The Daily Shot: 02-Oct-23
• The United States
• The Eurozone
• Europe
• Japan
• Asia-Pacific
• China
• Emerging Markets
• Commodities
• Energy
• Equities
• Credit
• Rates
• Global Developments
• Food for Thought
The United States
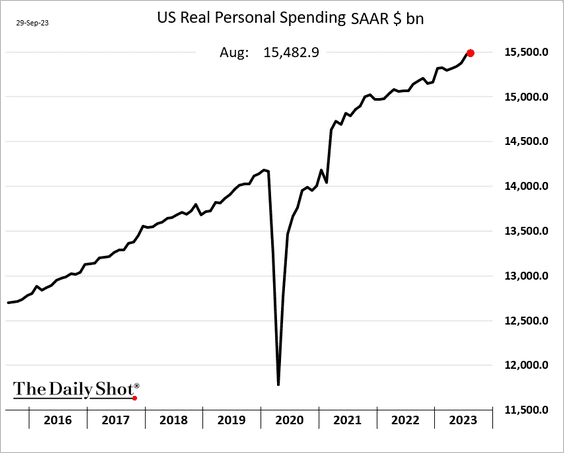
1. Real consumer spending edged higher in August.
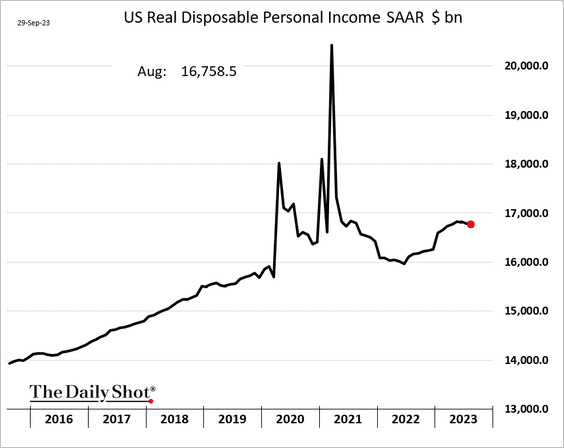
• Real disposable income has been down for three months in a row.
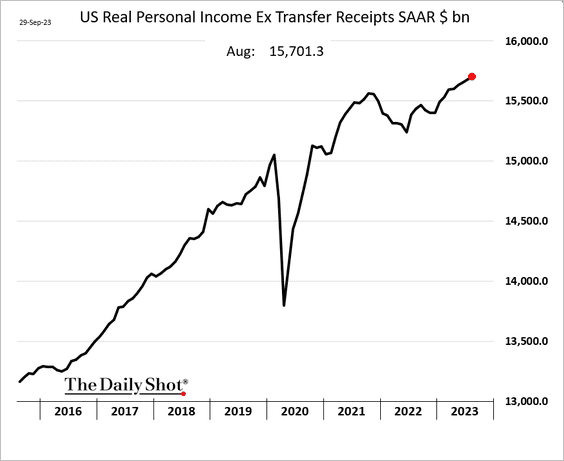
• Excluding payments from the government, real personal income continues to climb.
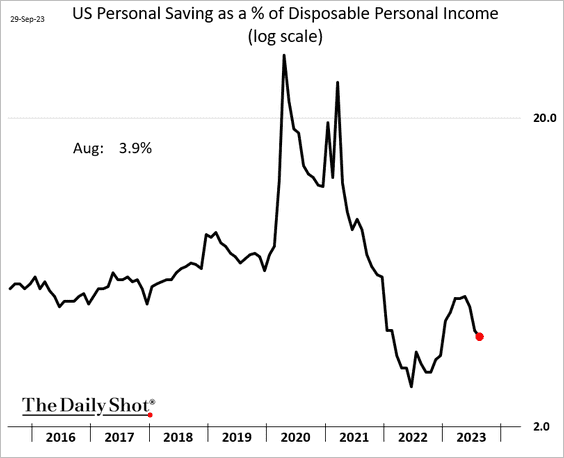
• Saving as a share of disposable income declined again.
• On average, households still have excess savings.
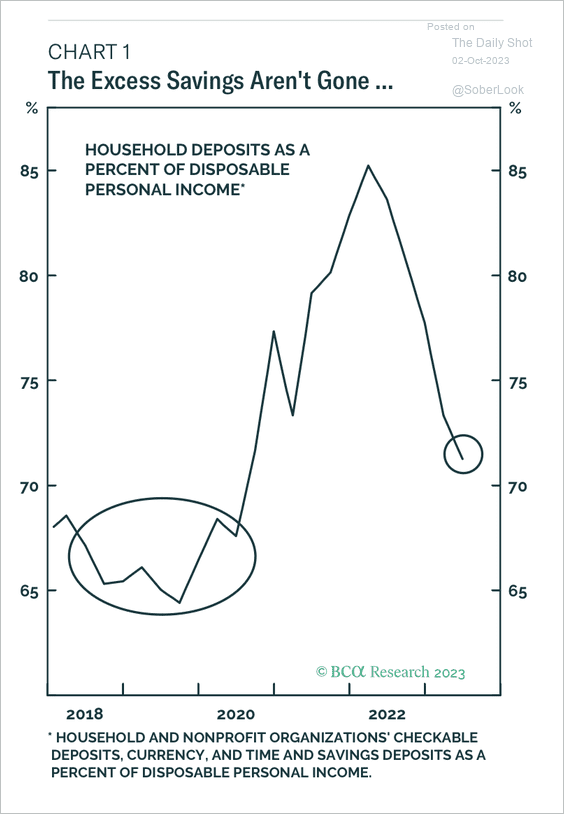 Source: BCA Research
• Credit card spending slowed in September, which could be reflected in the retail sales report.
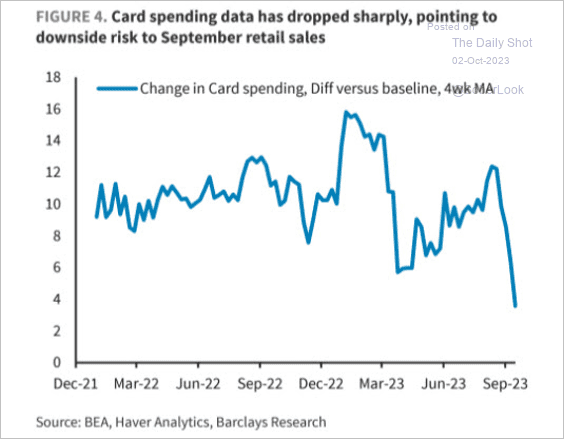 Source: Barclays Research; @dailychartbook
——————–
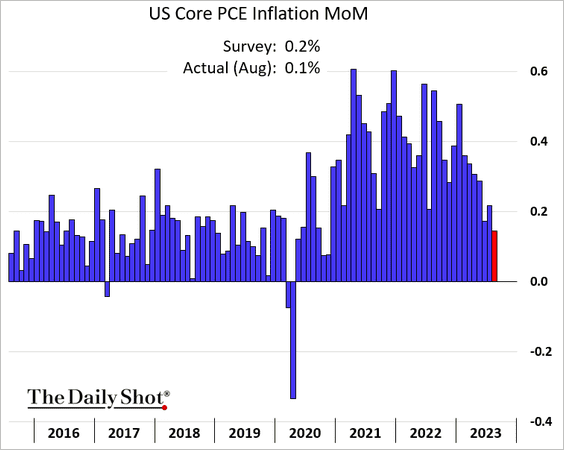
2. The August PCE inflation report was softer than expected.
• Headline PCE index (month-over-month):
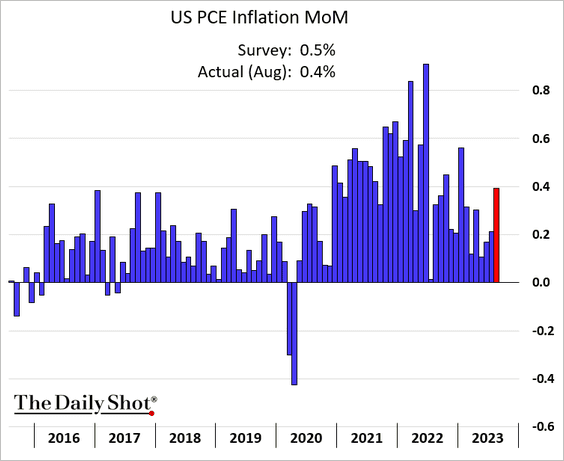
The August increase was due to higher gasoline prices. Here are the contributions.
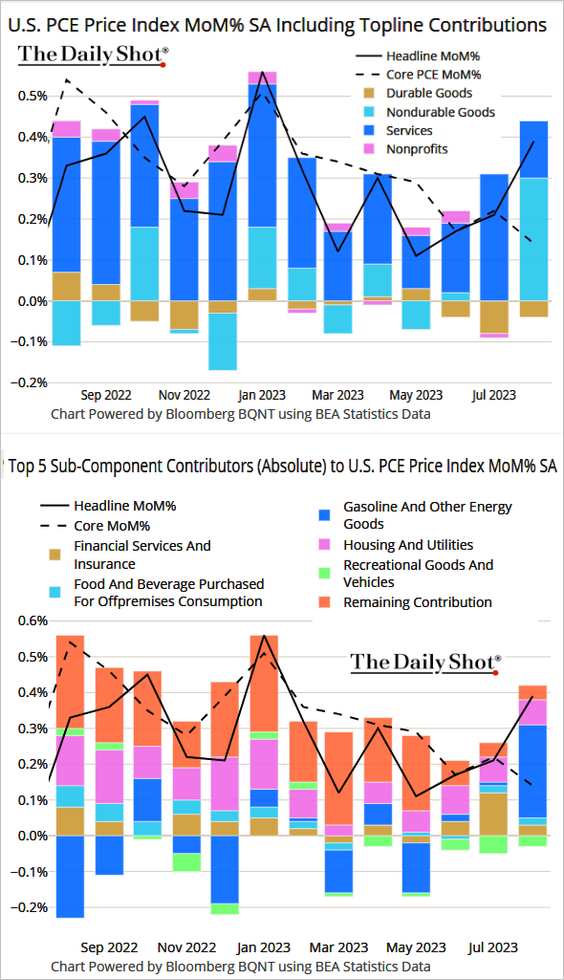 Source: @TheTerminal, Bloomberg Finance L.P.
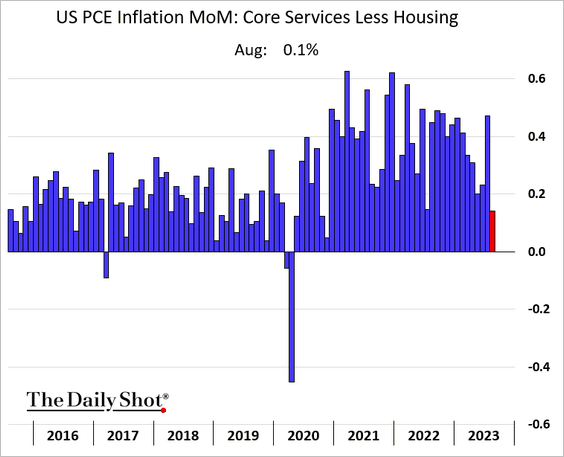
• Core inflation experienced its smallest monthly increase since 2020.
This chart shows the “supercore” PCE inflation measure.
 Source: Reuters Read full article
——————–
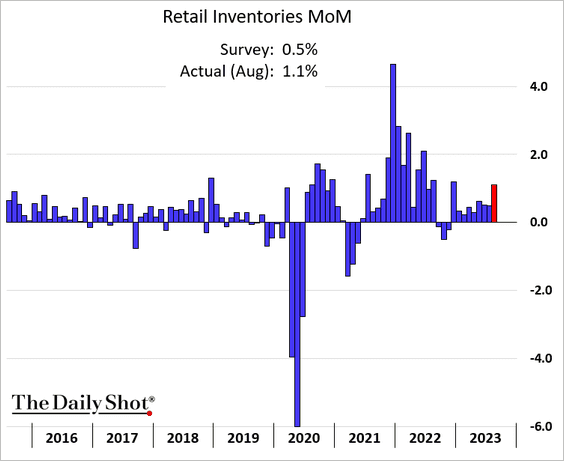
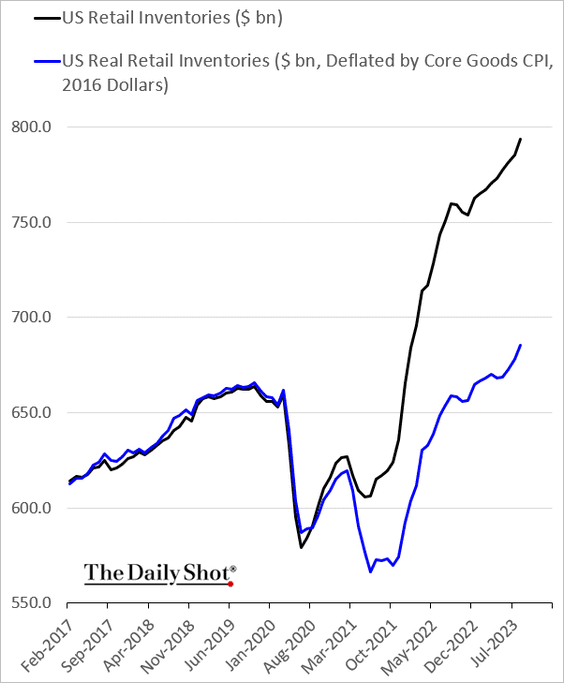
3. Retail inventories jumped in August.
This chart shows nominal and real retail inventories.
——————–
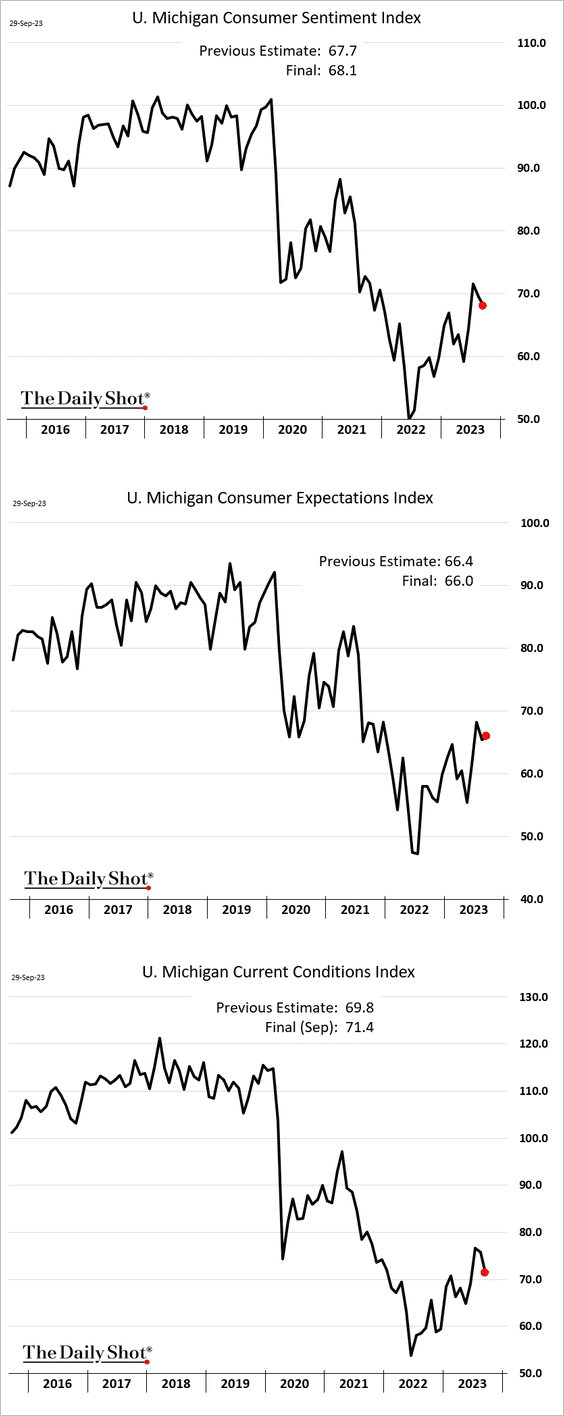
4. The September final release of the University of Michigan’s consumer sentiment report was revised slightly higher.
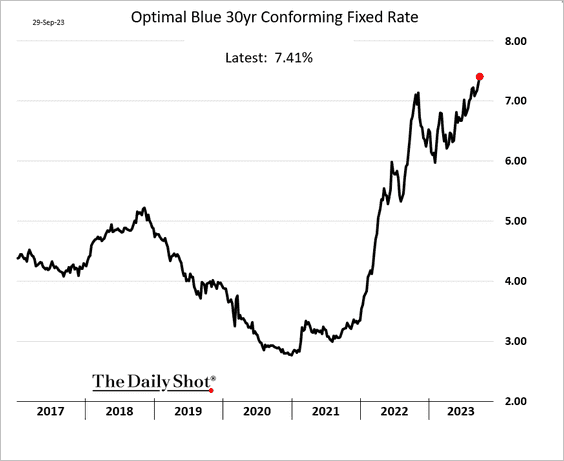
5. The 30-year mortgage rate continues to hit multi-year highs.
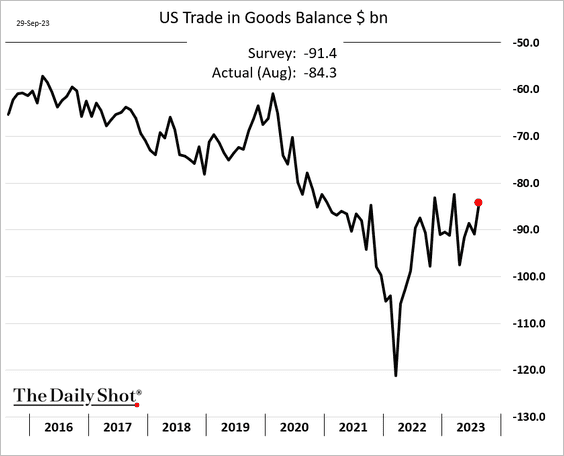
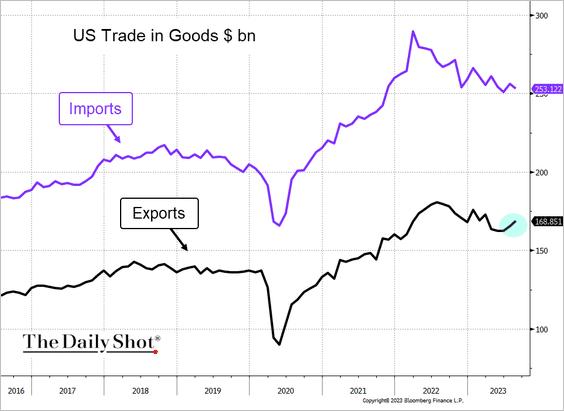
6. The goods trade deficit shrank in August as exports improved.
 Source: @TheTerminal, Bloomberg Finance L.P.
——————–
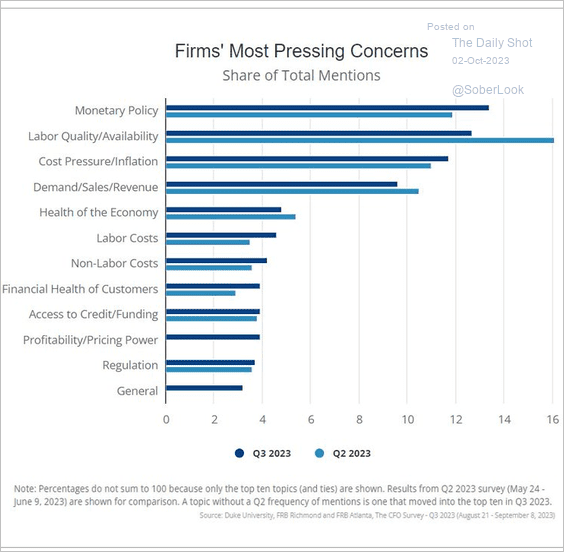
7. What are CFOs worried about?
 Source: @JeffreyKleintop
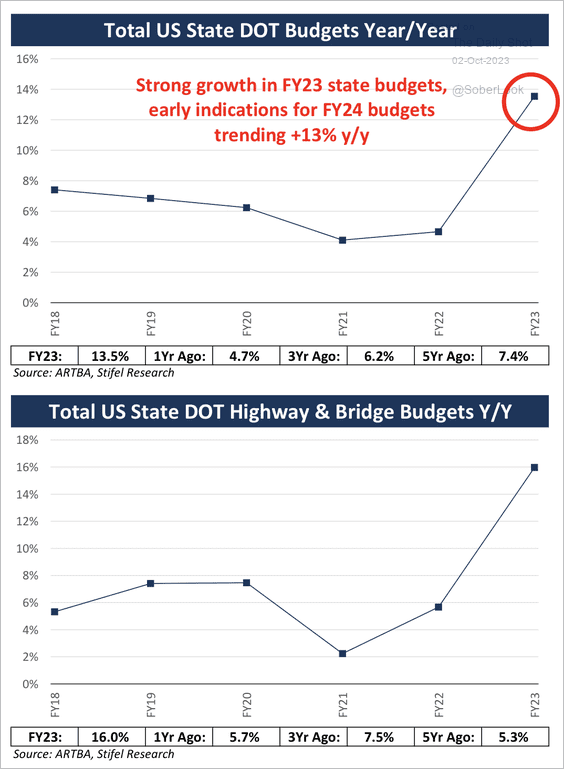
8. State transportation budgets remain firm, which could support infrastructure spending.
 Source: Stifel
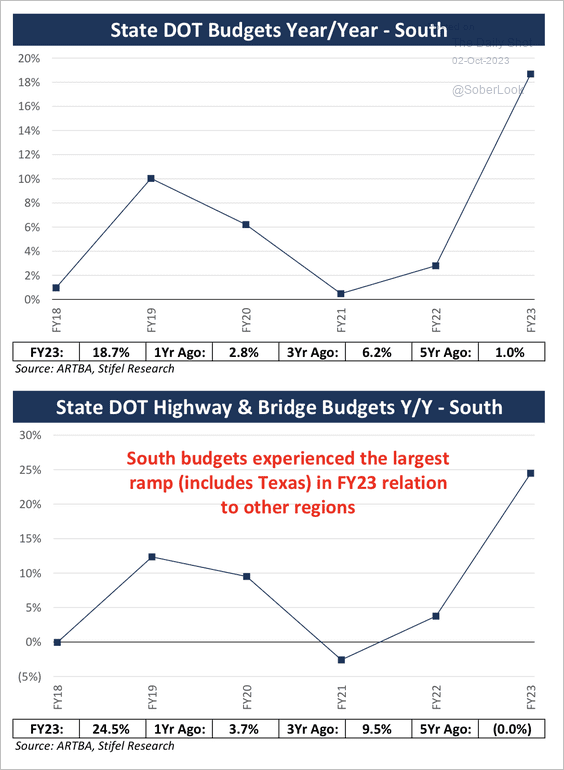
The biggest budget increases were in the South.
 Source: Stifel
Back to Index
The Eurozone
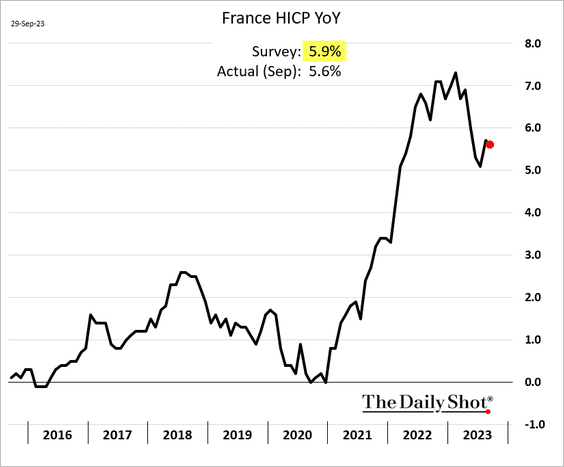
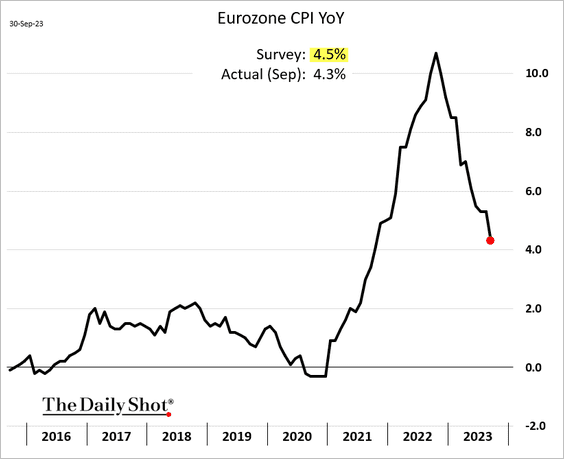
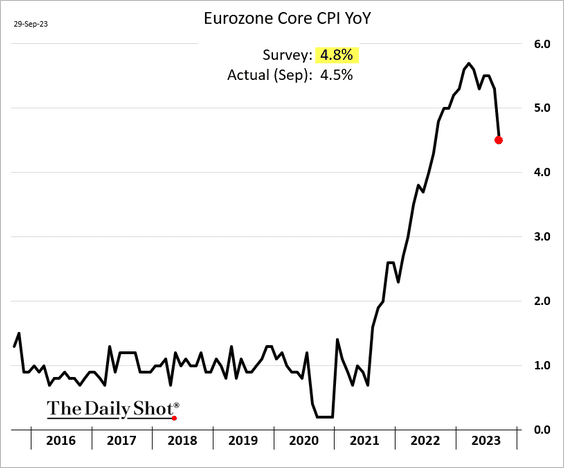
1. September inflation reports surprised to the downside. We already saw data from Germany and Spain. Below are the CPI trends in the Netherlands and France.
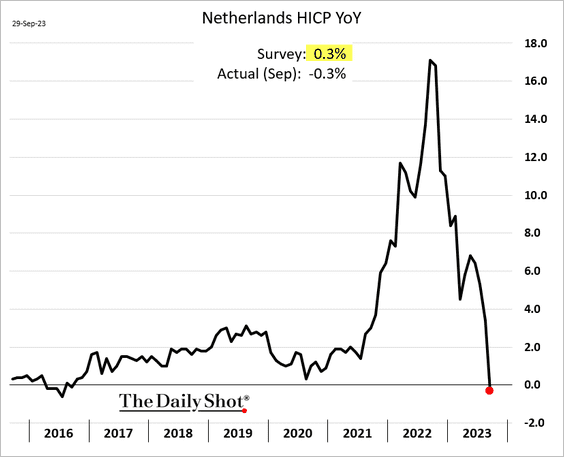
At the Eurozone level, both the headline and the core CPI measures were below forecasts.
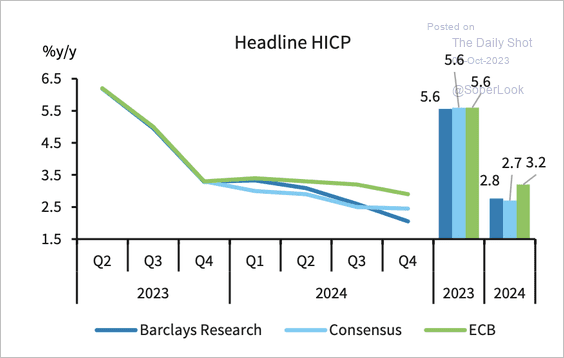
• Barclays expects a faster decline in inflation to 2% than the ECB, although progress on inflation could stall because of higher energy prices.
 Source: Barclays Research
——————–
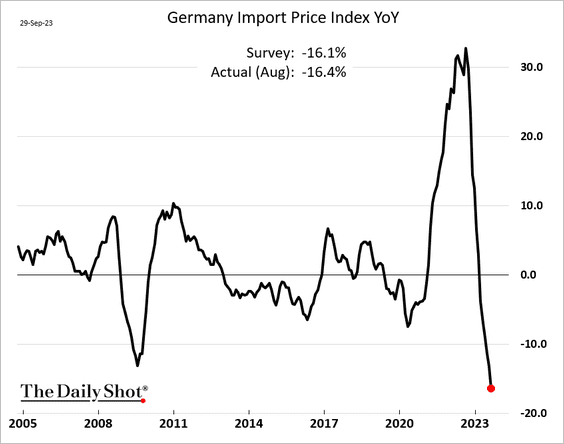
2. Germany’s import prices saw the largest year-over-year decline in recent history.
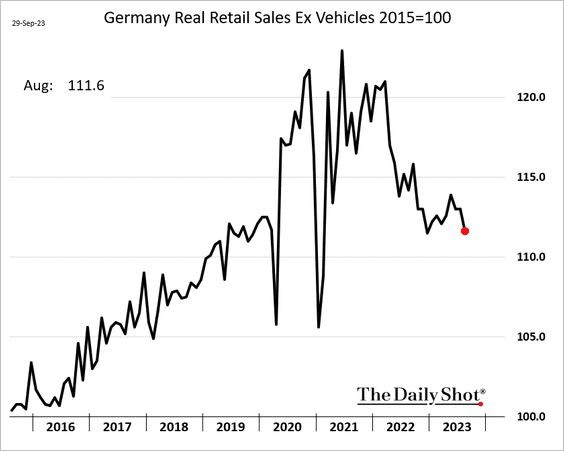
3. Germany’s retail sales declined sharply in August.
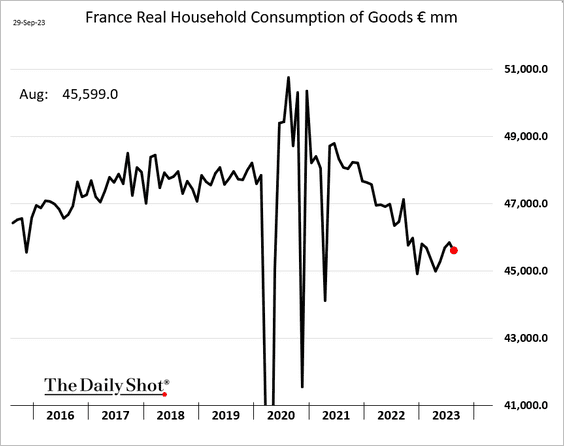
Goods consumption in France declined as well.
——————–
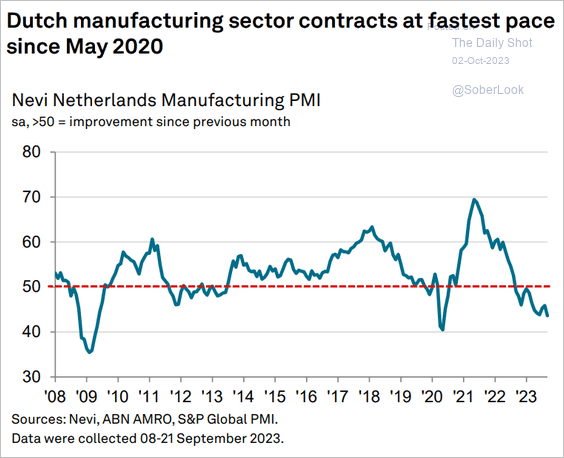
4. Dutch factory activity is crashing.
 Source: S&P Global PMI
Back to Index
Europe
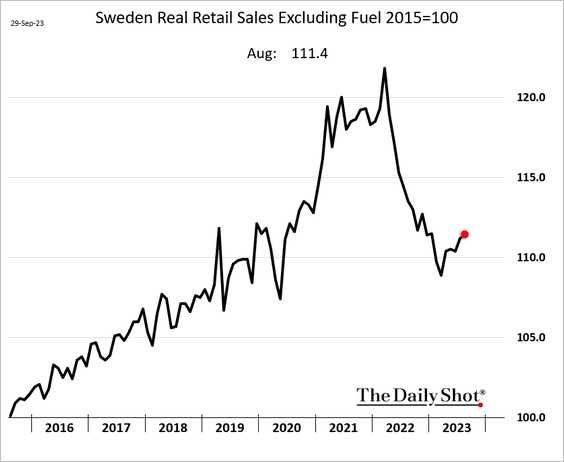
1. Sweden’s retail sales are gradually rebounding.
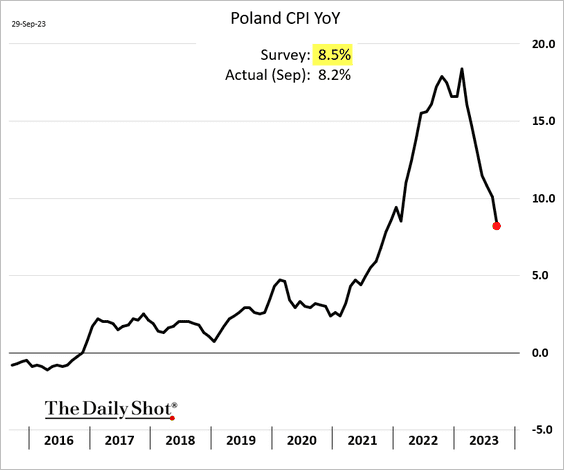
2. Poland’s inflation surprised to the downside.
3. Central European manufacturing hubs continue to struggle. Manufacturing PMIs for Poland and the Czech Republic remain in contraction territory.
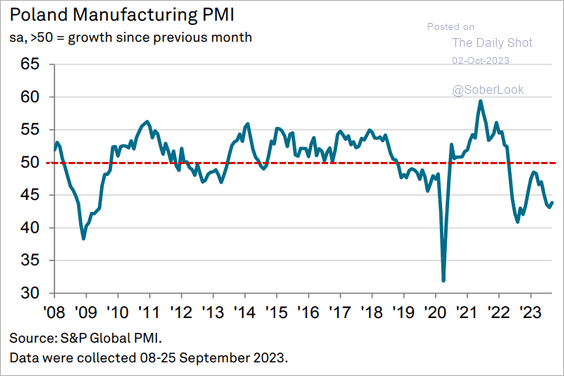 Source: S&P Global PMI
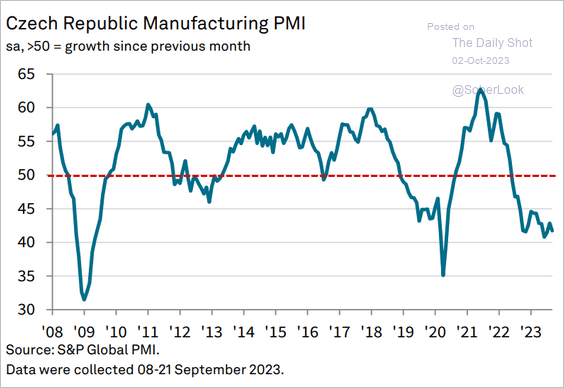 Source: S&P Global PMI
——————–
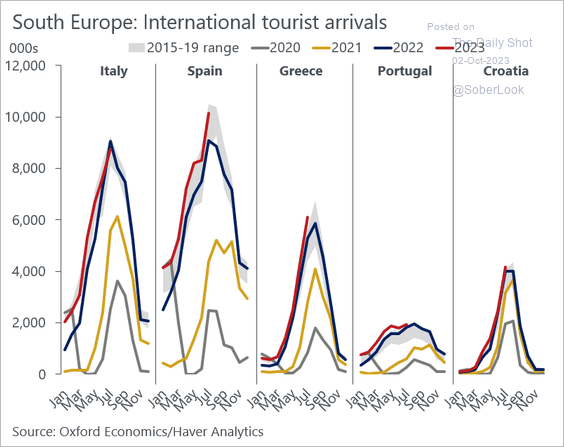
4. Tourism in southern Europe has been robust.
 Source: @JeffreyKleintop
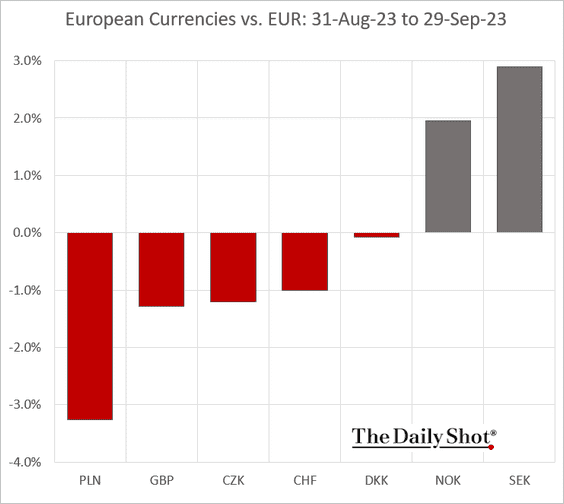
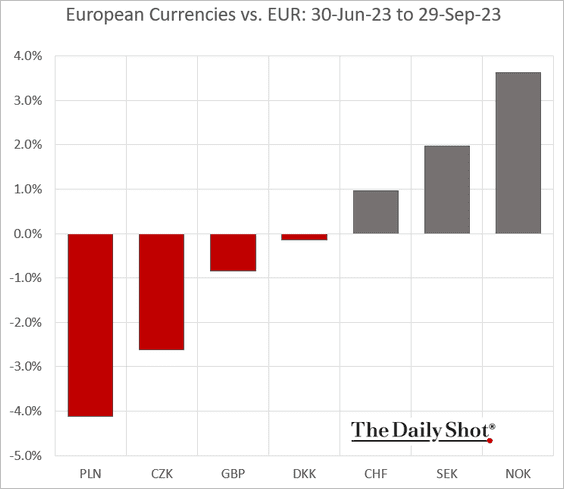
5. How have European currencies fared against the euro?
• September:
• Q3:
Back to Index
Japan
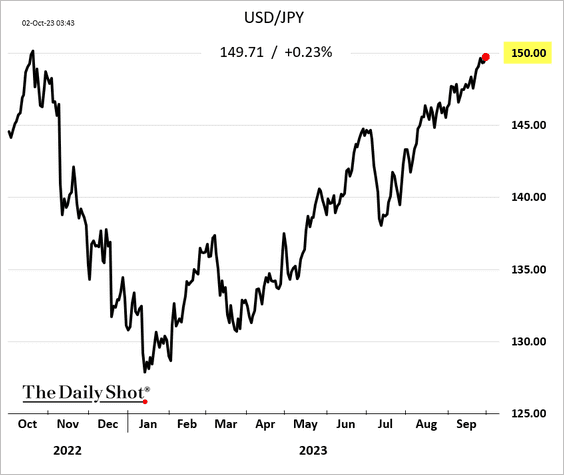
1. Dollar-yen is grinding toward 150.
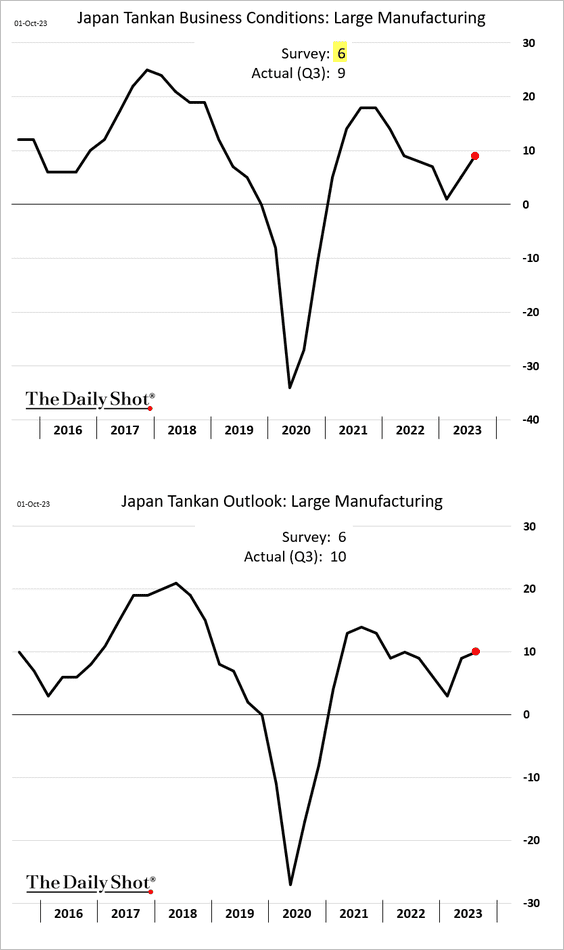
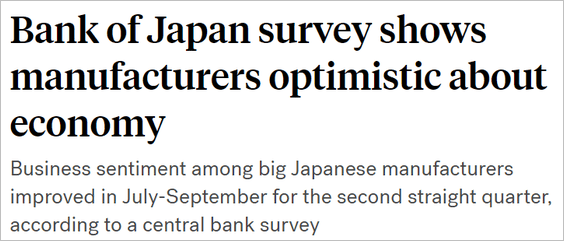
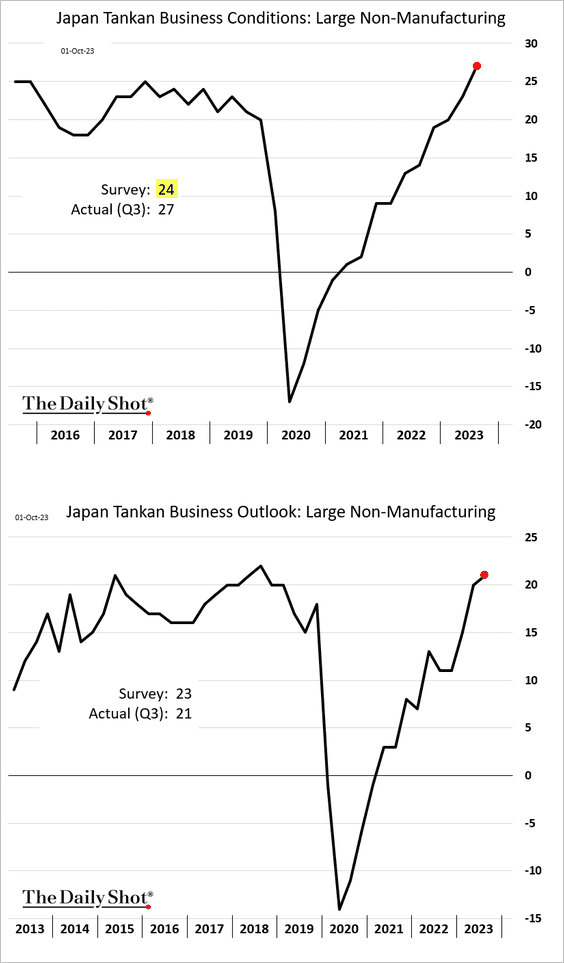
2. The Tankan report topped expectations, with companies reporting improved business conditions in manufacturing and services.
 Source: ABC News Read full article
• The non-manufacturing index hit a record high.
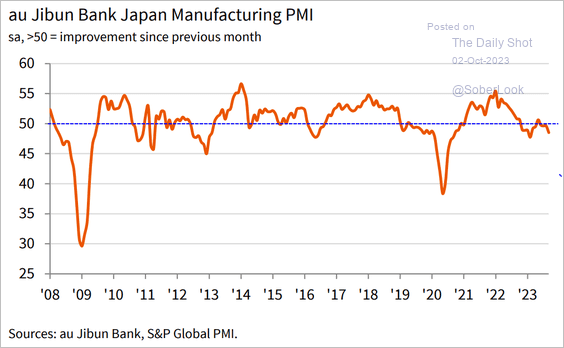
• However, the manufacturing PMI remains in contraction territory.
 Source: S&P Global PMI
——————–
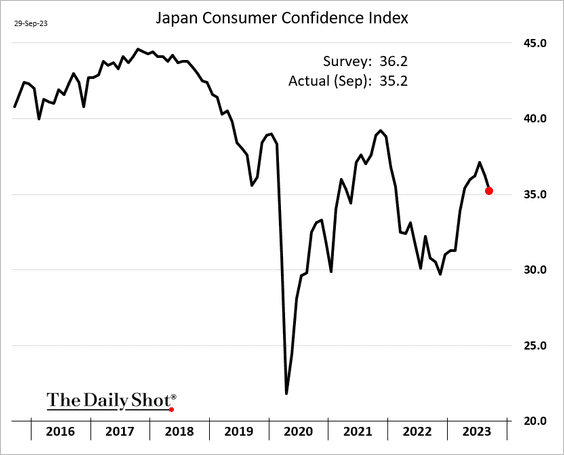
3. Consumer confidence declined again in September.
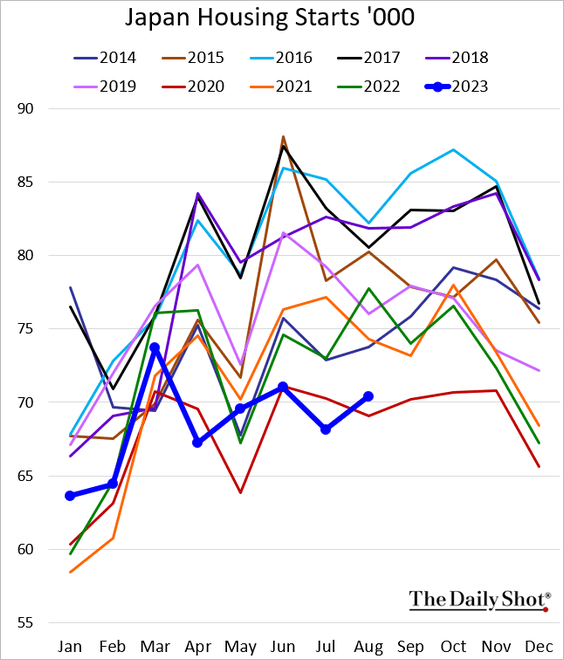
4. Housing starts remain soft.
Back to Index
Asia-Pacific
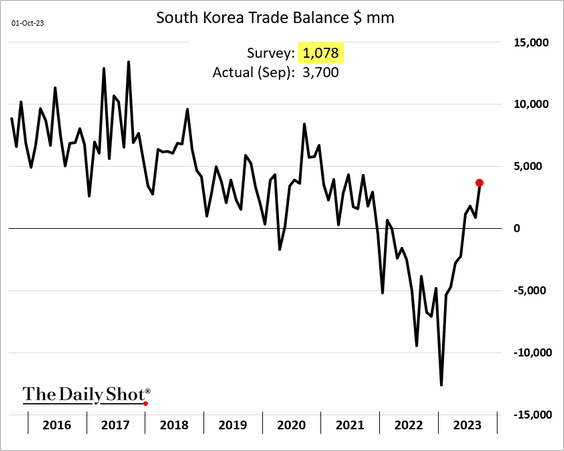
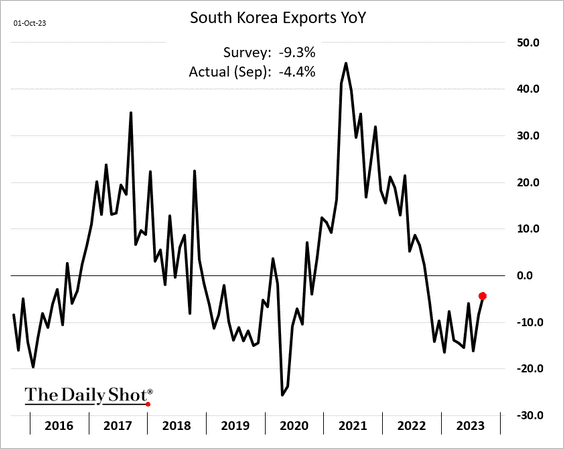
1. South Korea’s trade surplus topped expectations, …
… as exports improve.
——————–
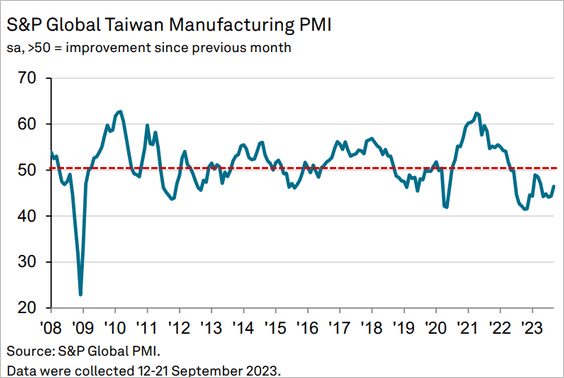
2. Taiwan’s manufacturing PMI remains in contraction territory.
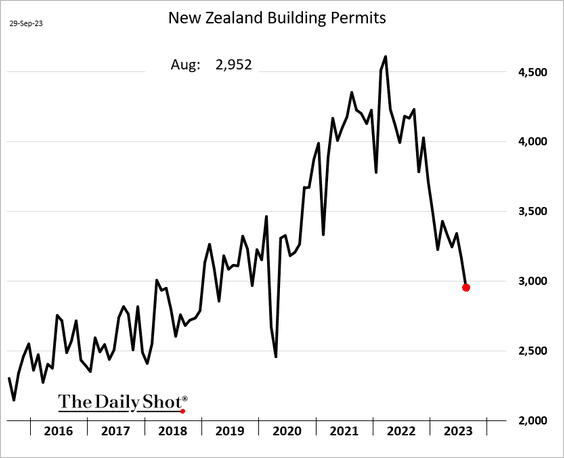
3. New Zealand’s building permits continue to tumble.
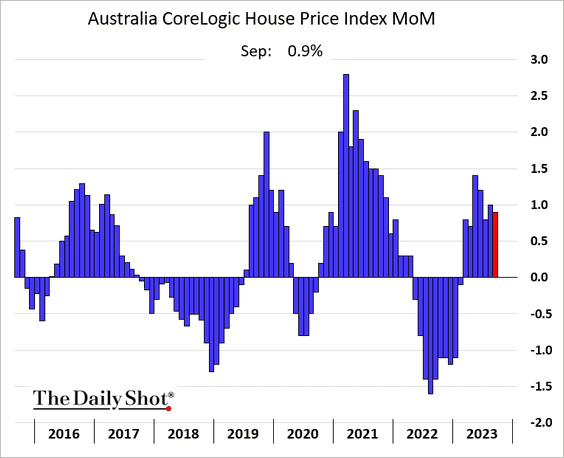
4. Australia’s home prices increased for the seventh month in a row.
Back to Index
China
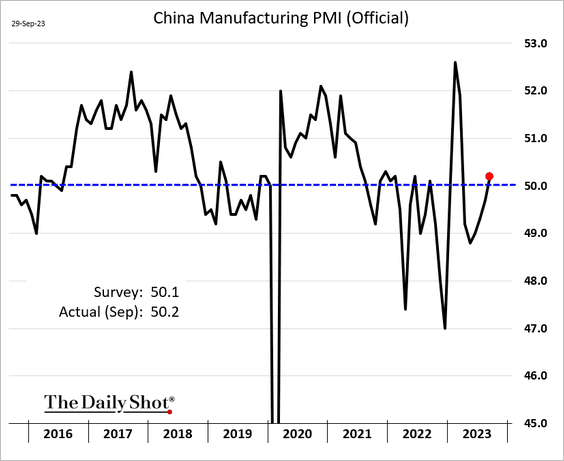
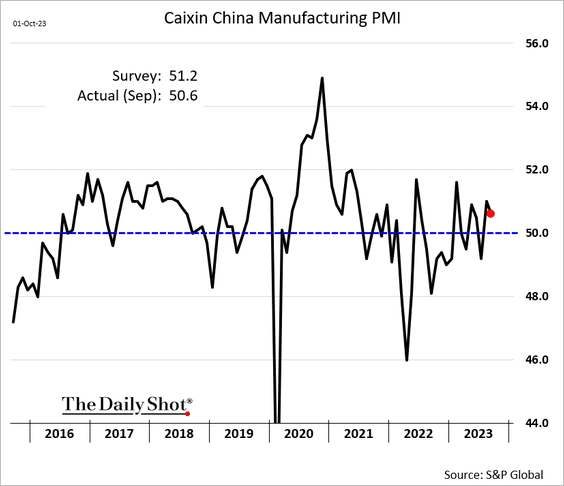
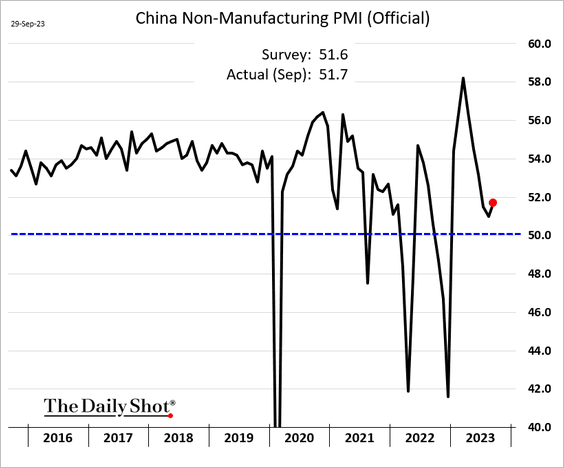
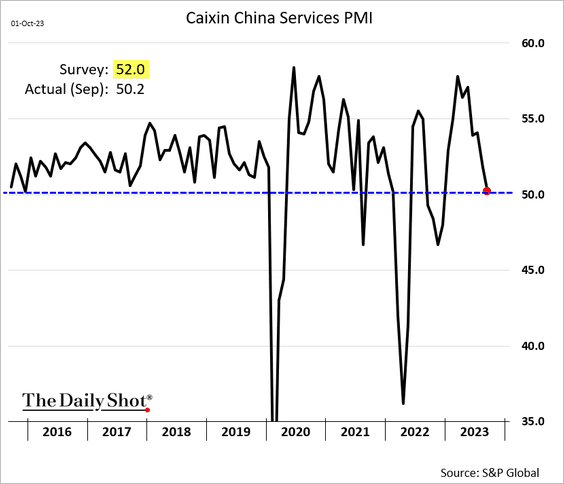
1. PMI indicators point to modest growth in China’s business activity.
• Manufacturing:
– Official:
– S&P Global:
• Services:
– Official:
– S&P Global:
 Source: Reuters Read full article
——————–
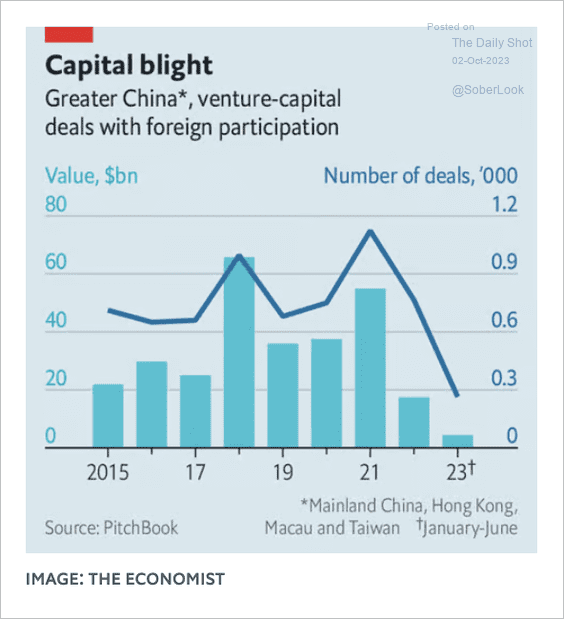
2. Here is a look at VC deals with foreign participation.
 Source: The Economist Read full article
Back to Index
Emerging Markets
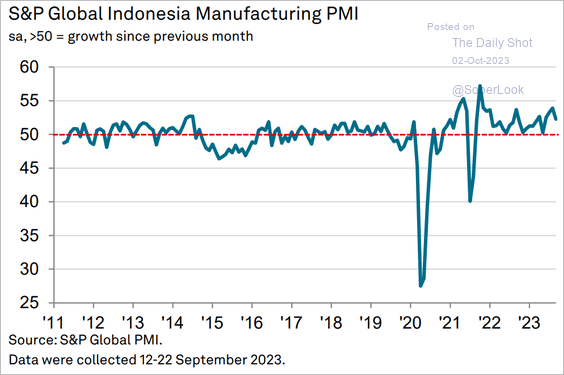
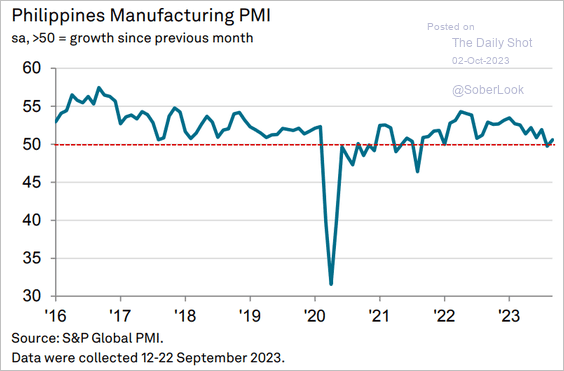
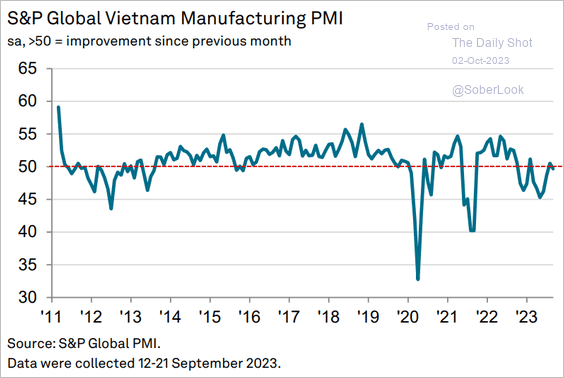
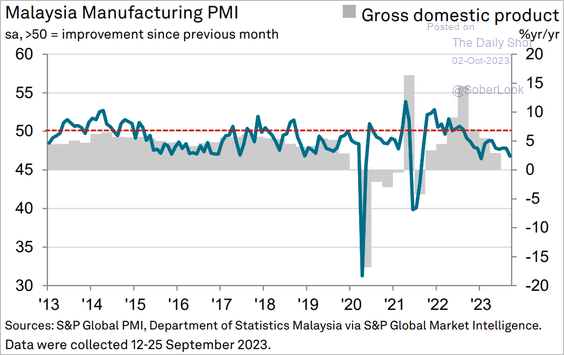
1. Let’s run through Asian manufacturing PMI reports.
• Indonesia (still growing):
 Source: S&P Global PMI
• The Philippines (back in expansion mode):
 Source: S&P Global PMI
• Vietnam (contracting again):
 Source: S&P Global PMI
• Malaysia (struggling):
 Source: S&P Global PMI
• Thailand (a sharp pullback):
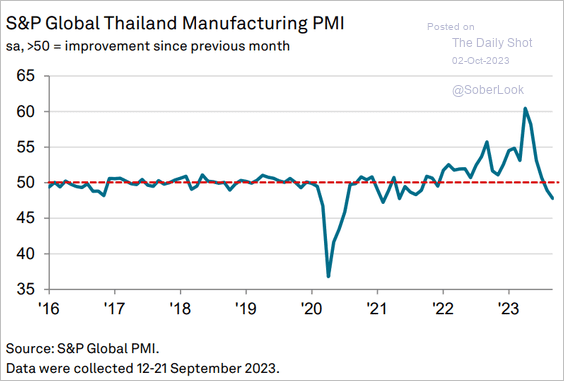 Source: S&P Global PMI
• ASEAN (in contraction for the first time in two years):
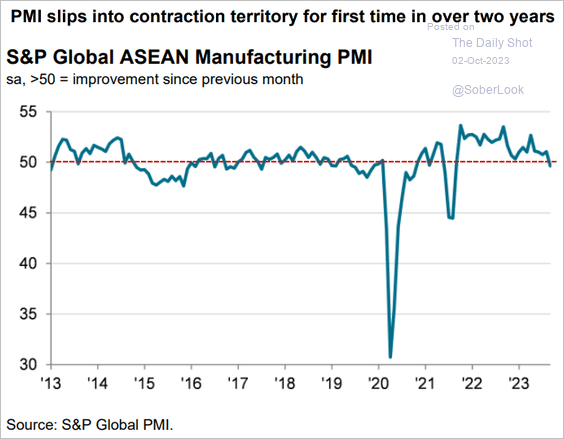 Source: S&P Global PMI
——————–
2. Activity in India’s eight core industries has accelerated.
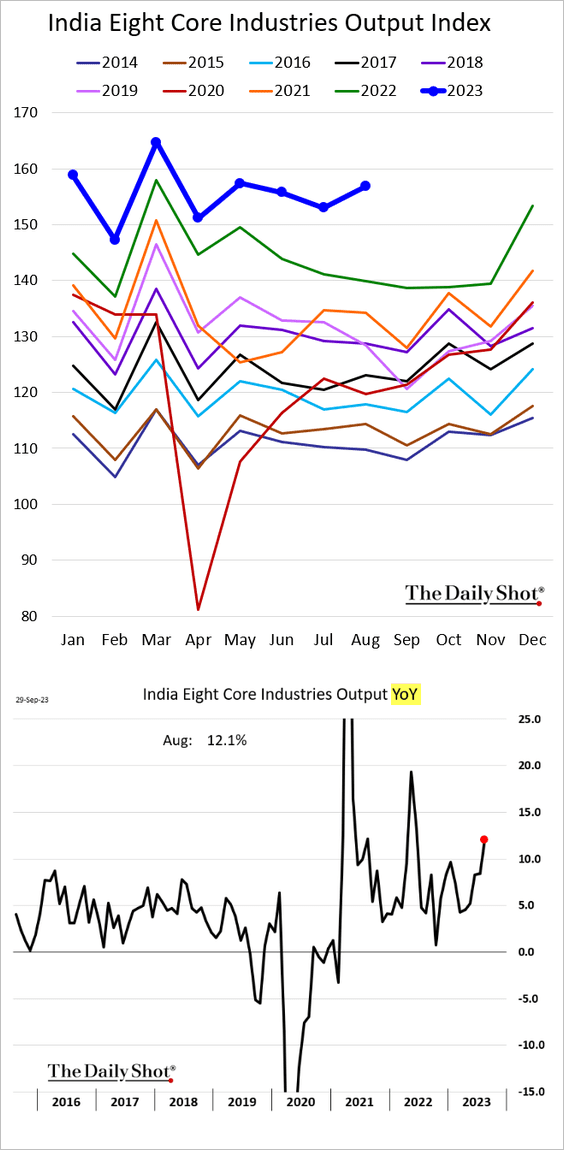
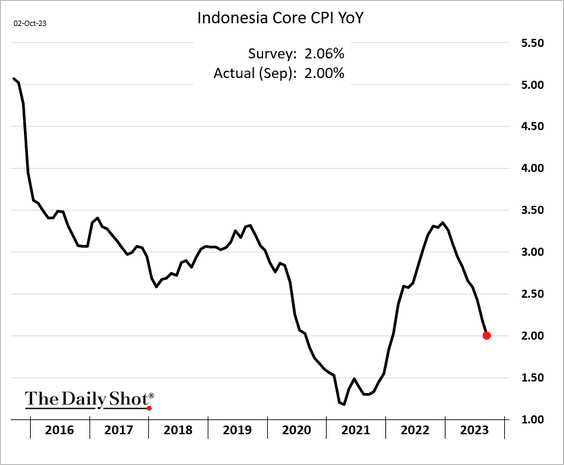
3. Indonesia’s inflation is back at 2%.
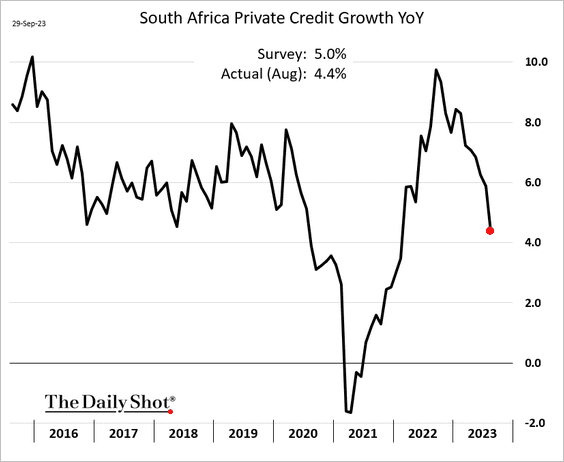
4. South Africa’s private credit growth is slowing.
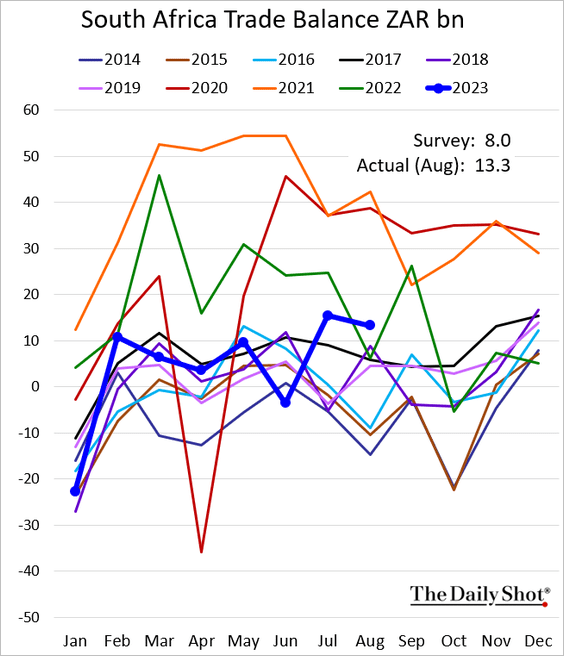
• The trade surplus is now above last year’s levels.
——————–
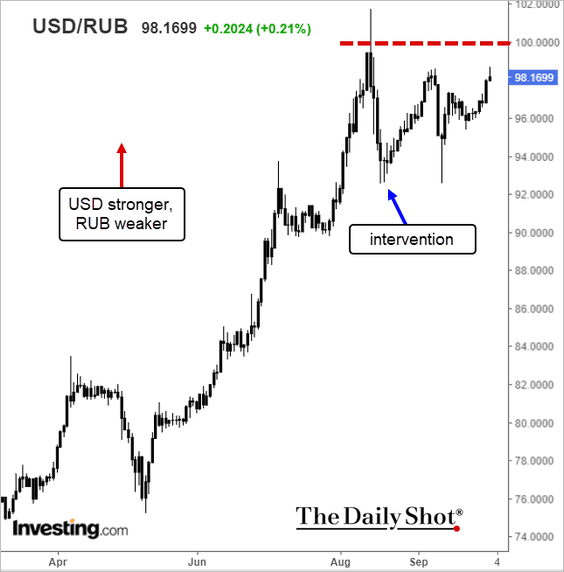
5. The ruble remains under pressure. Will USD/RUB hit 100 again?
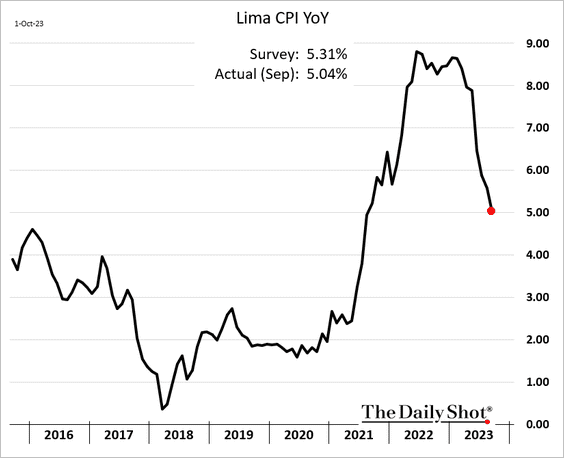
6. Peru’s inflation continues to ease.
 Source: Reuters Read full article
——————–
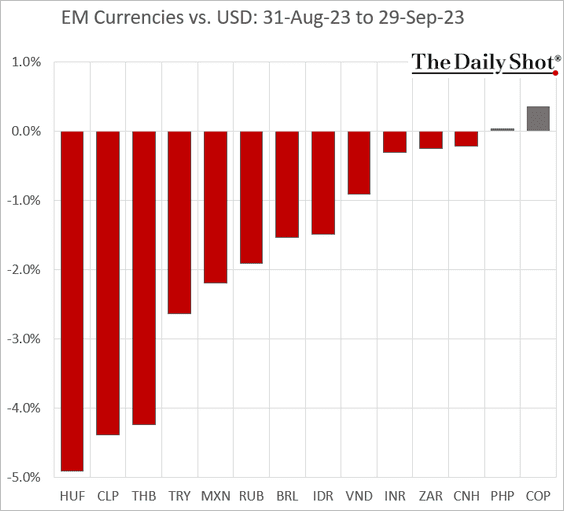
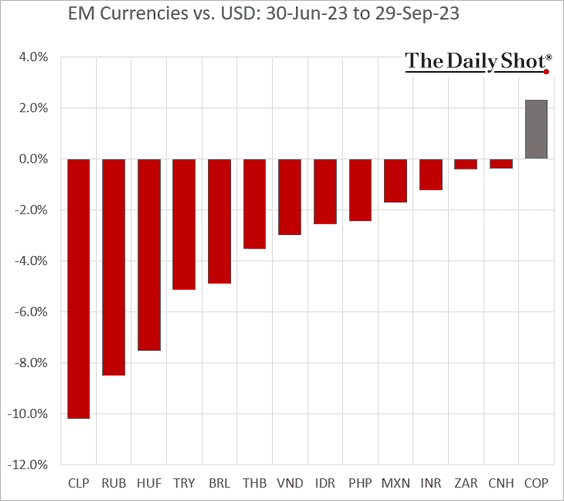
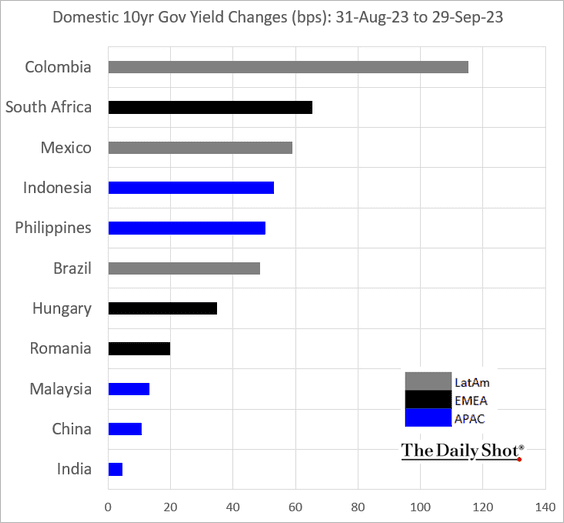
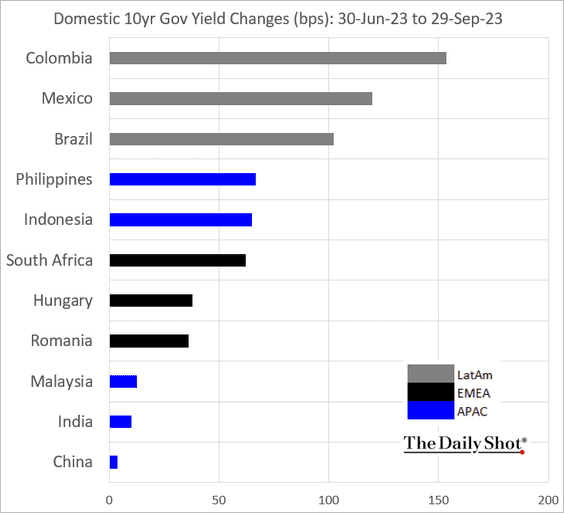
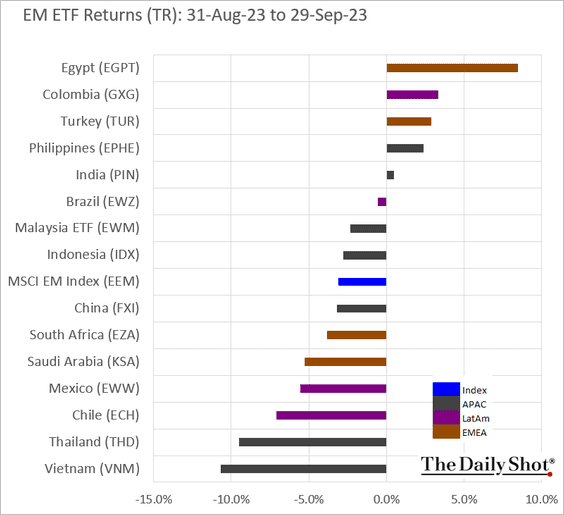
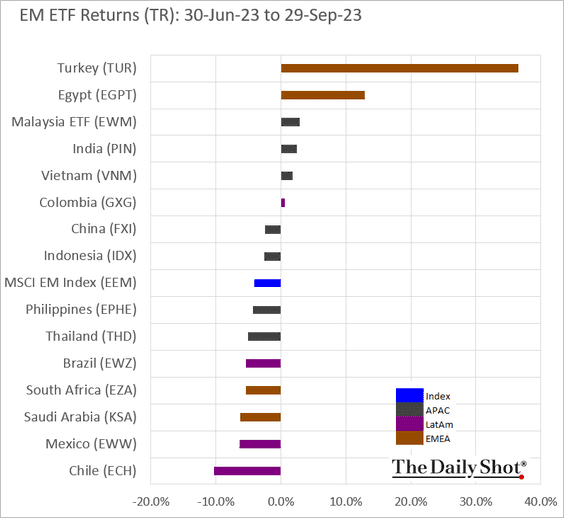
7. Next, let’s take a look at some performance data for September and the third quarter.
• Currencies (Sep):
– Currencies (Q3):
• Bond yields (Sep):
– Bond yields (Q3):
• Equity ETFs (Sep):
– Equity ETFs (Q3):
Back to Index
Commodities
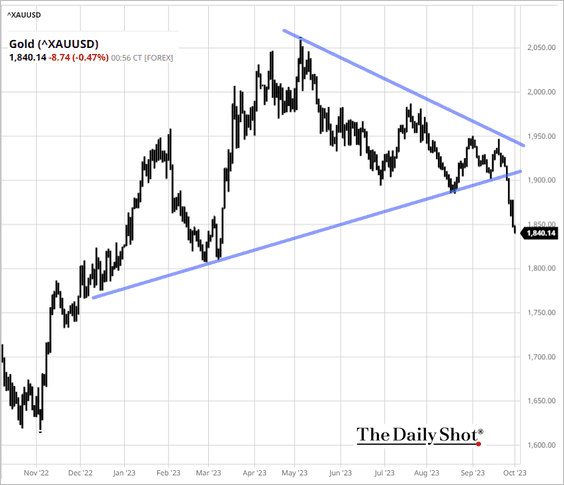
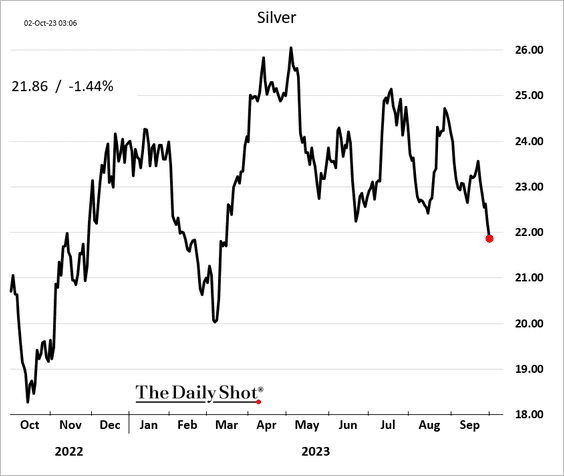
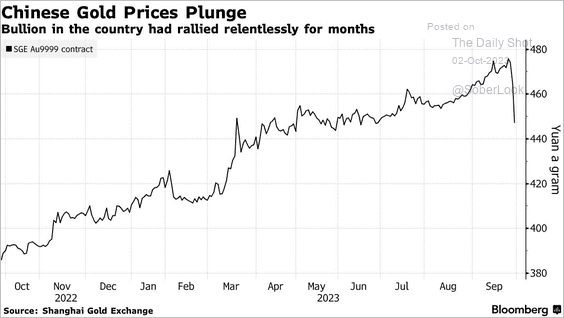
1. Precious metals remain under pressure.
– Gold:
 Source: barchart.com
– Silver:
• China’s gold price premium to international markets narrowed on Friday.
 Source: @markets Read full article
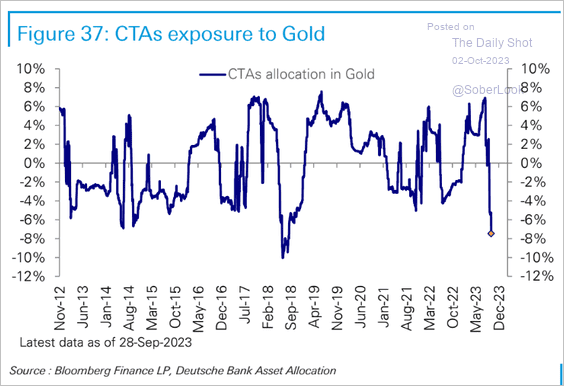
• CTAs are very bearish.
 Source: Deutsche Bank Research
——————–
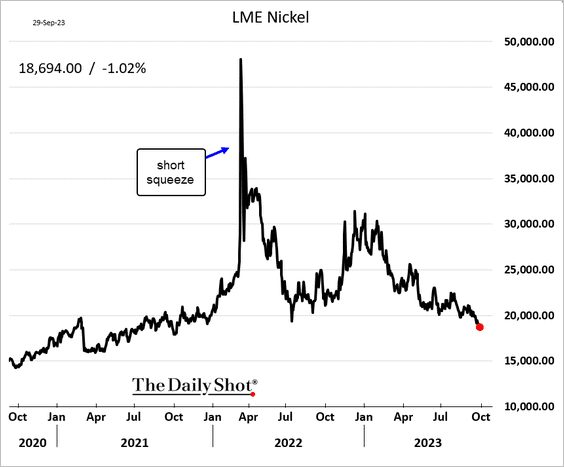
2. Nickel prices hit the lowest level since 2021.
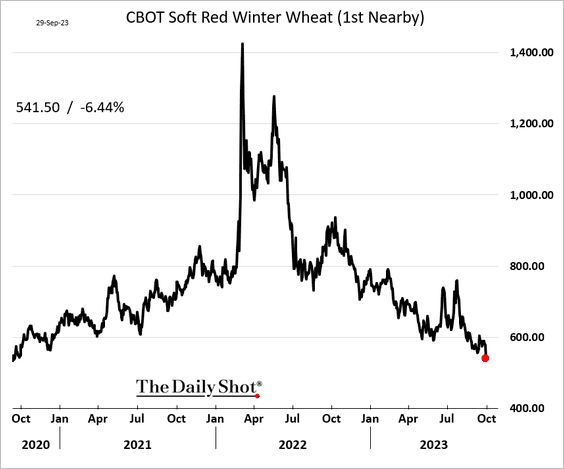
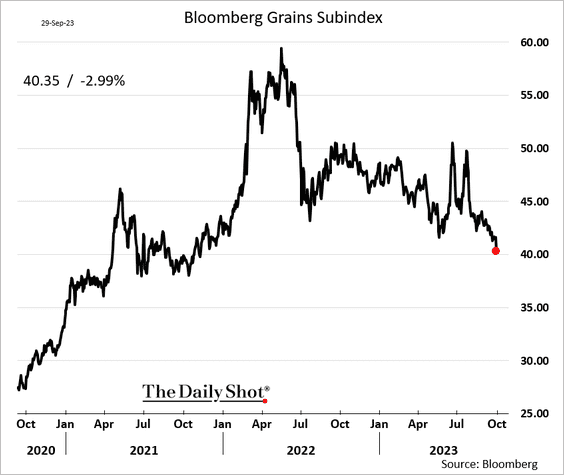
3. Wheat prices tumbled on Friday, pulled lower by the USDA’s higher-than-expected quarterly inventory outlook.
Other grains were also lower.
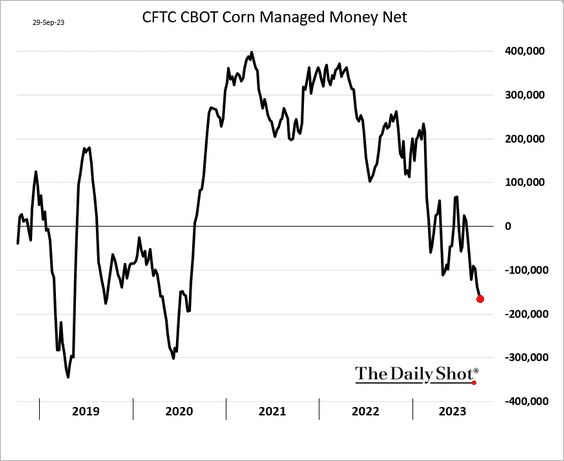
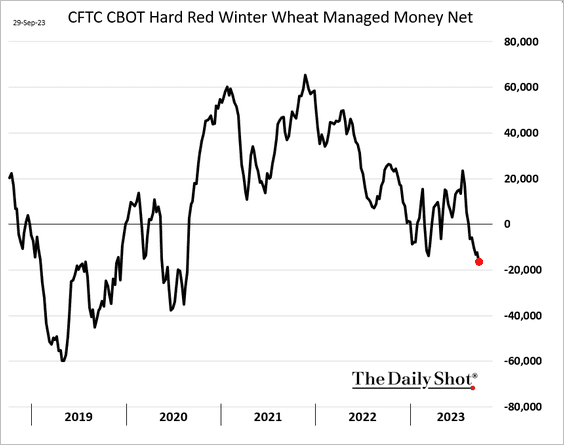
• Hedge funds have been boosting their bets against corn and wheat.
——————–
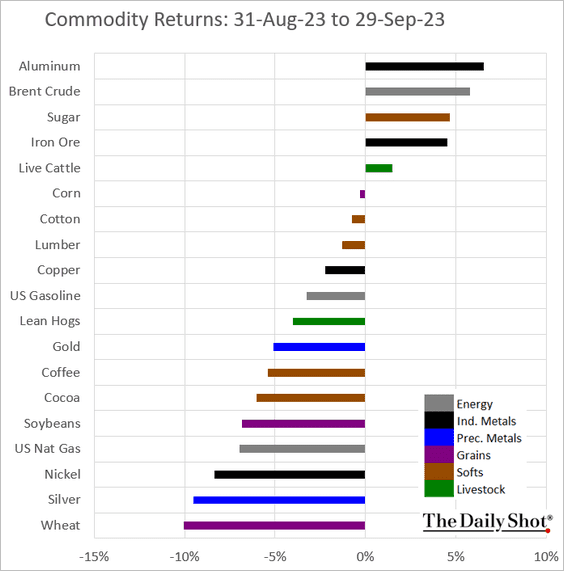
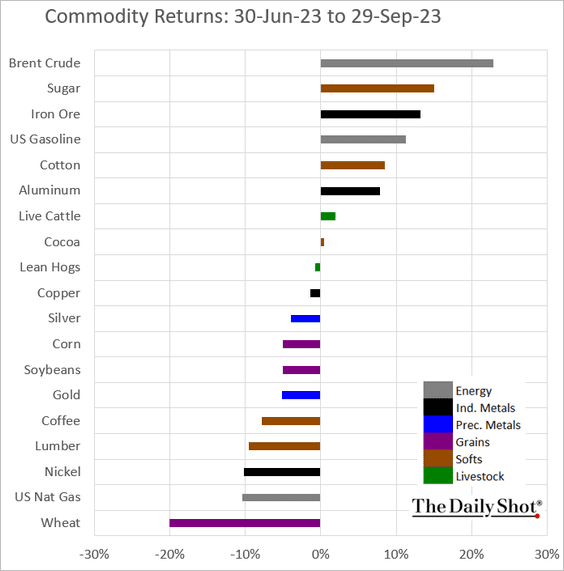
4. Finally, we have some performance data for September and the third quarter.
• September:
• Q3:
Back to Index
Energy
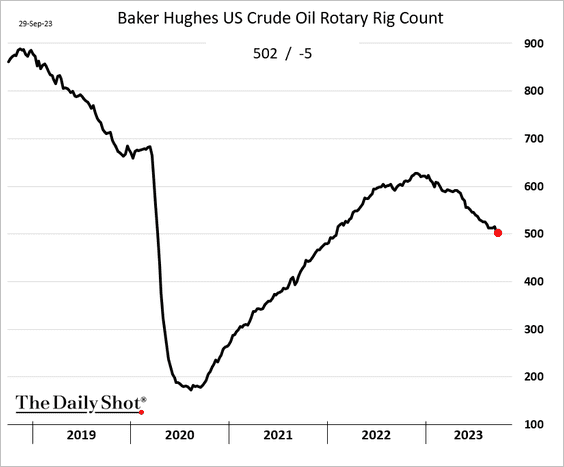
1. The US rig count continues to trend lower.
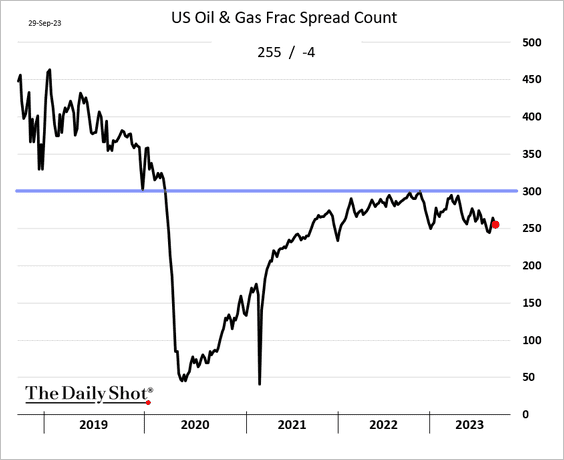
Fracking activity is slowing.
——————–
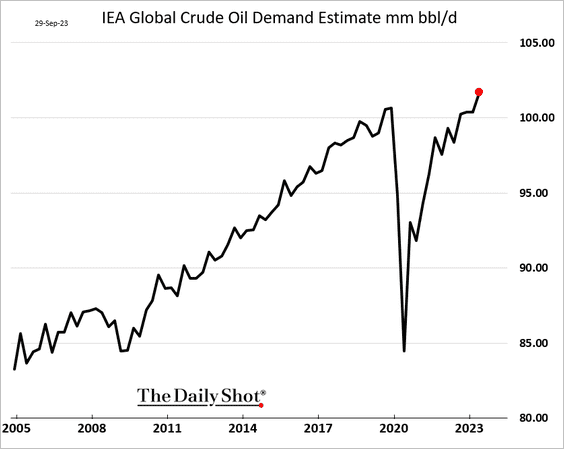
2. According to IEA, global crude oil demand hit a record high.
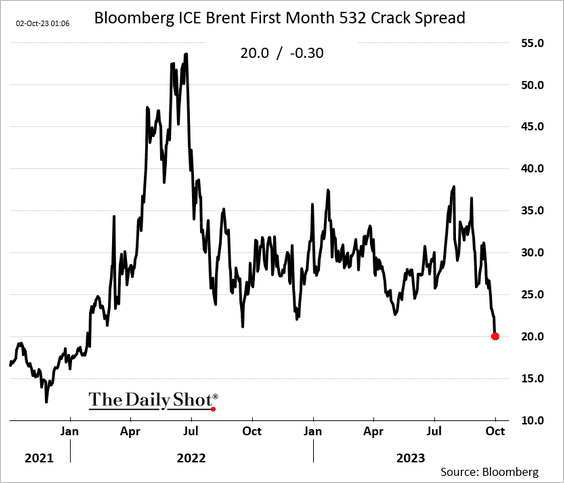
3. Crack spreads remain soft.
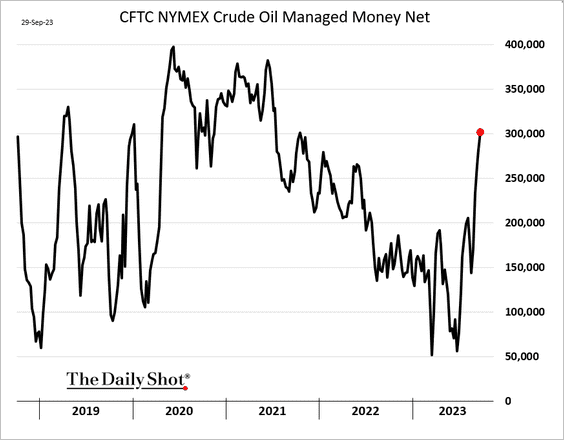
4. Hedge funds keep boosting their bets on crude oil.
Here is CTAs’ positioning.
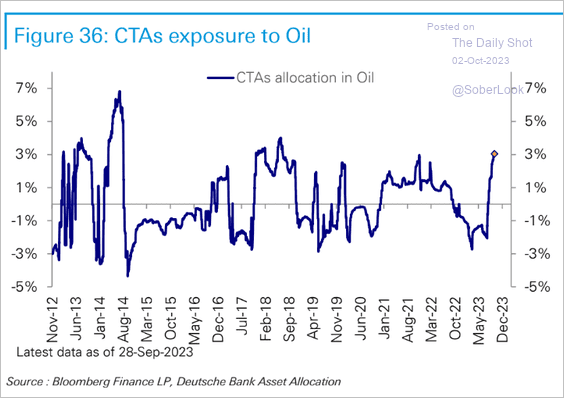 Source: Deutsche Bank Research
——————–
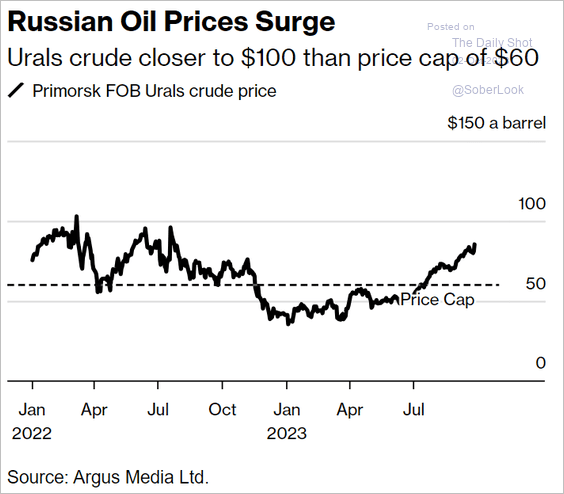
5. Russian crude oil is trading well above the $60/bbl cap.
 Source: @bpolitics Read full article
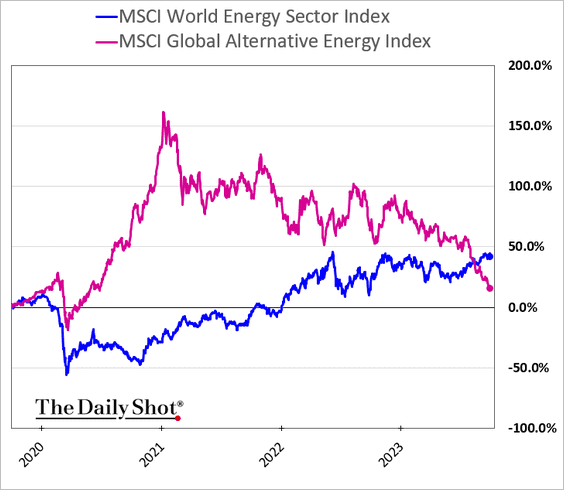
6. Alternative energy stocks have given up their COVID-era outperformance.
Back to Index
Equities
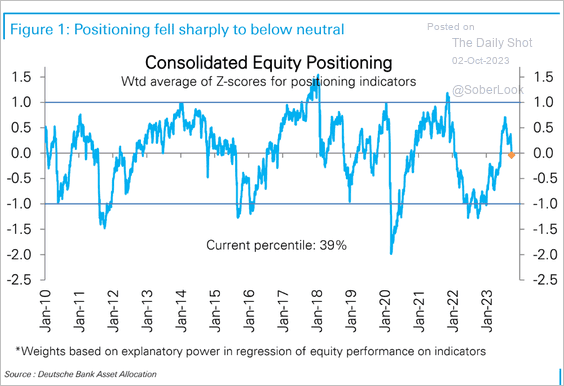
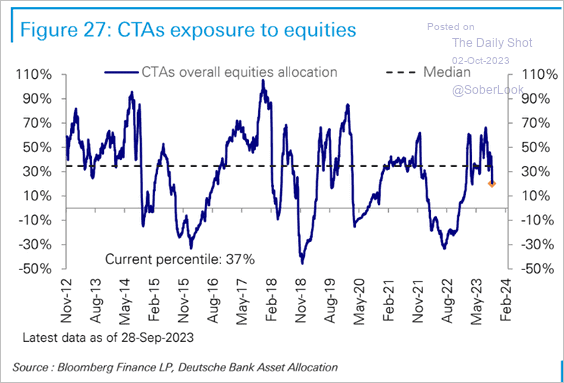
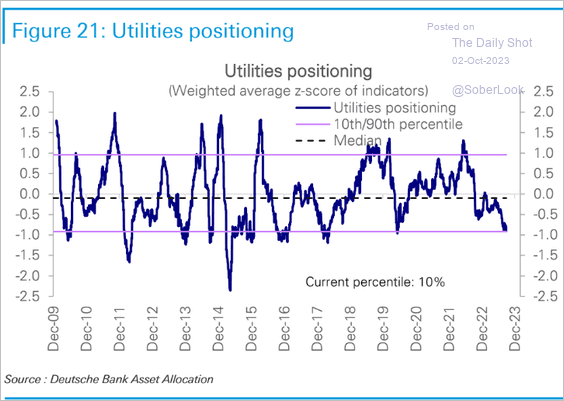
1. Deutsche Bank’s positioning indicator points to investors becoming more cautious.
 Source: Deutsche Bank Research
 Source: Deutsche Bank Research
——————–
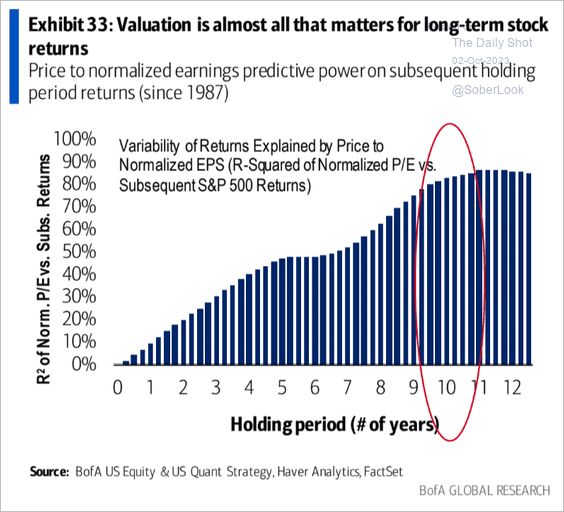
2. Stock market valuations drive longer-term performance.
 Source: BofA Global Research; @dailychartbook
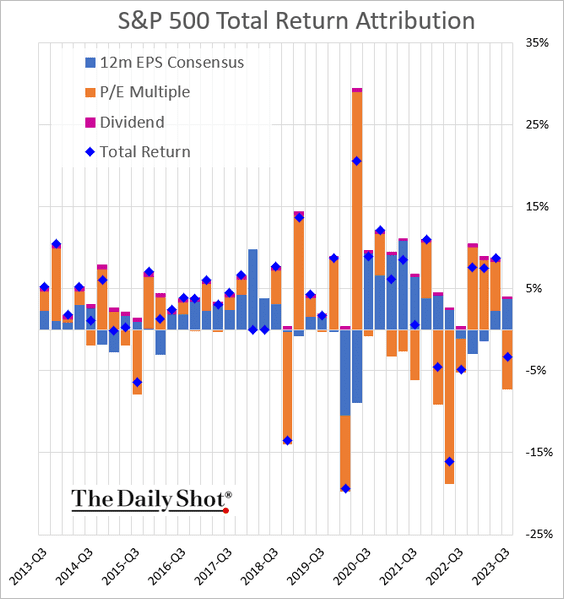
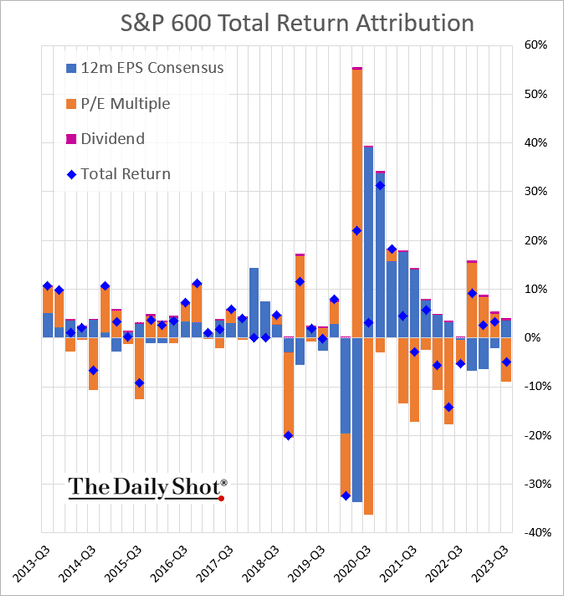
3. Next, we have some performance attribution data (Q3 declines were driven by multiple contraction).
——————–
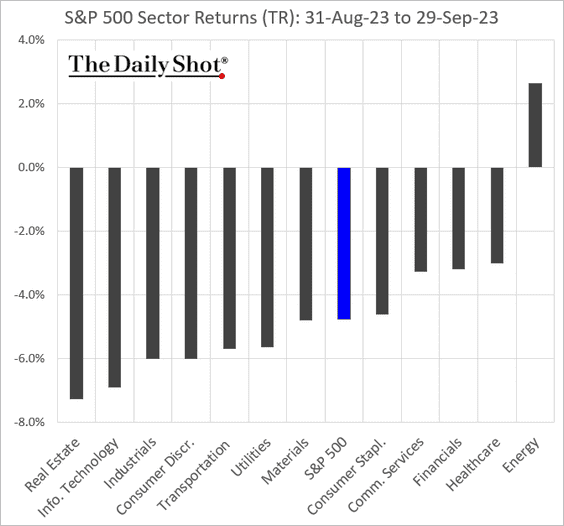
4. Now, let’s take a look at some performance data for September and Q3.
• Sectors (Sep):
– Sectors (Q3):
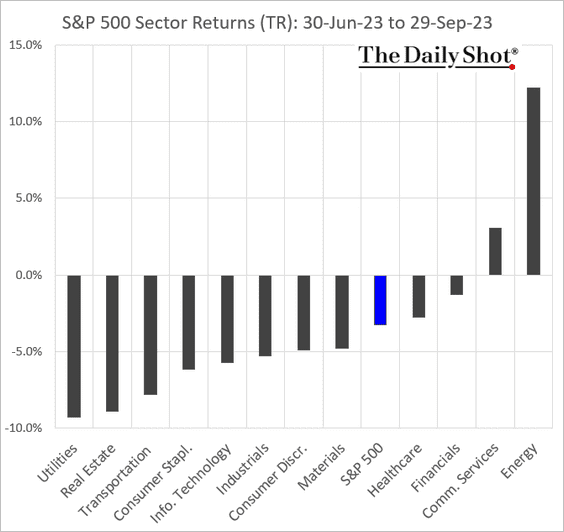
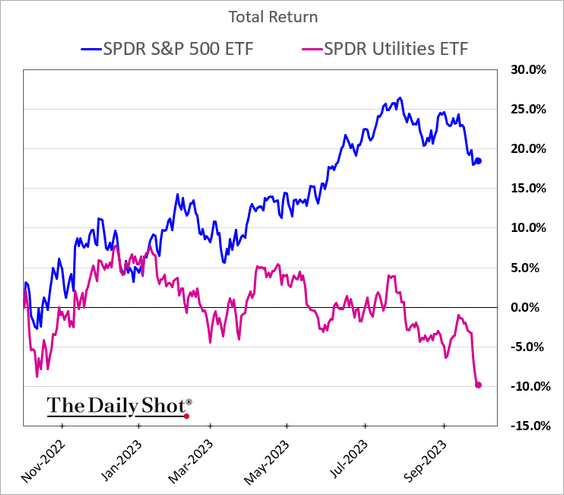
Utilities had a tough few weeks.
 Source: Deutsche Bank Research
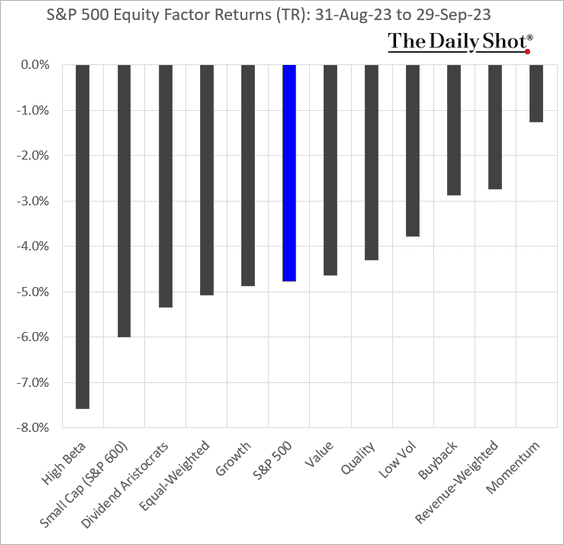
• Factors (Sep):
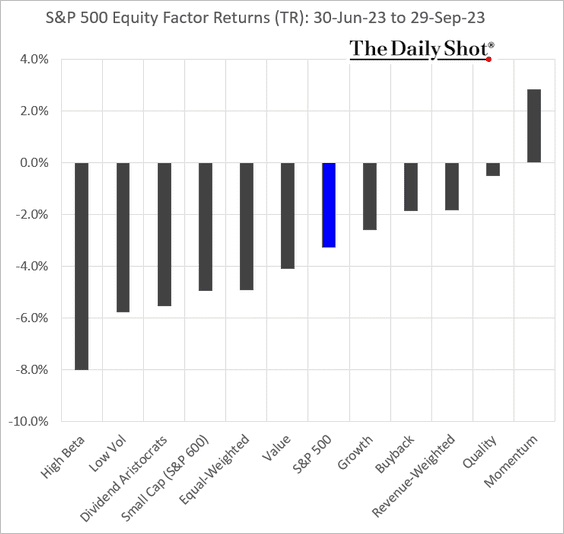
– Factors (Q3):
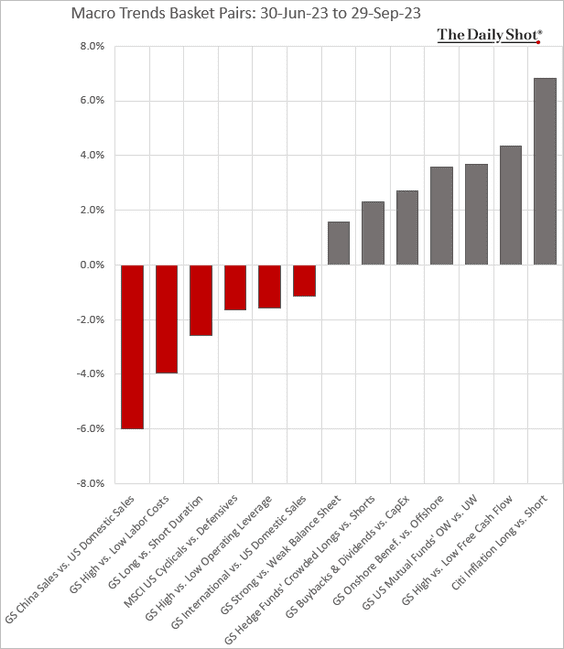
• Macro basket pairs’ relative performance (Sep):
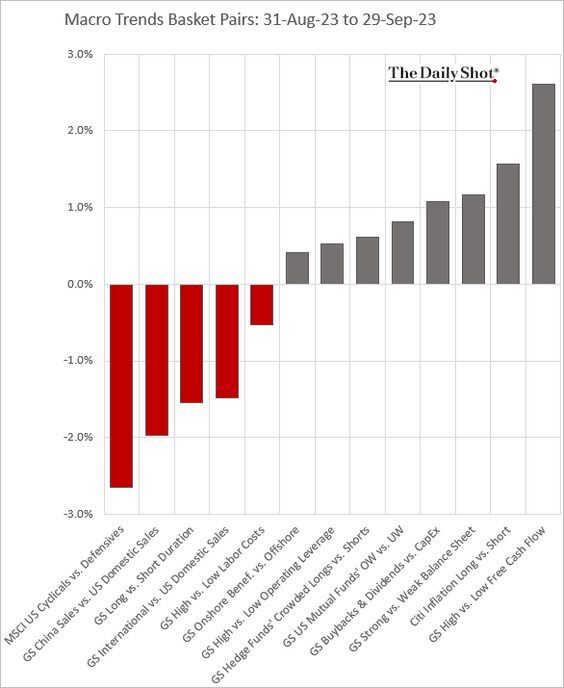
– Q3:
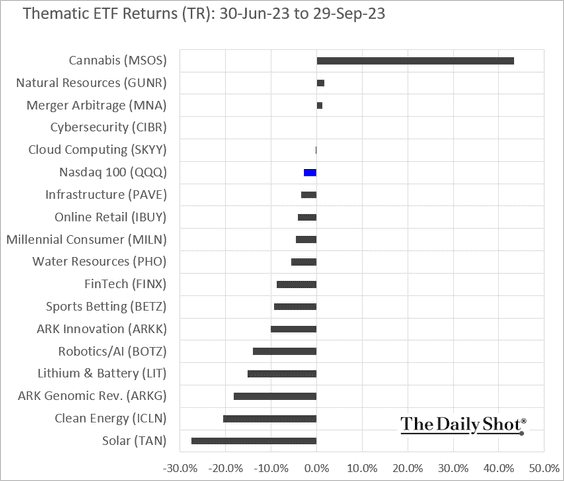
• Thematic ETFs (Sep):
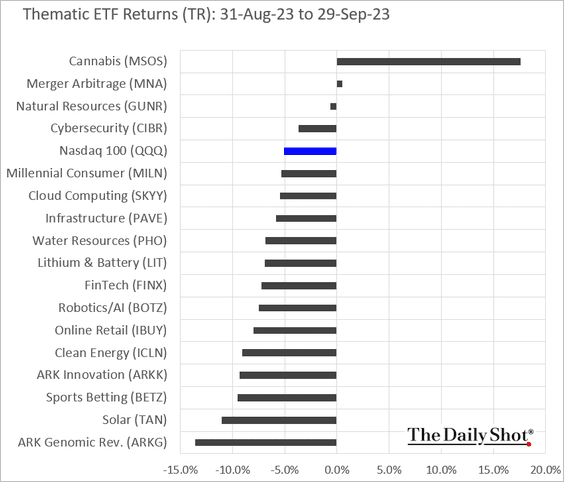
– Q3:
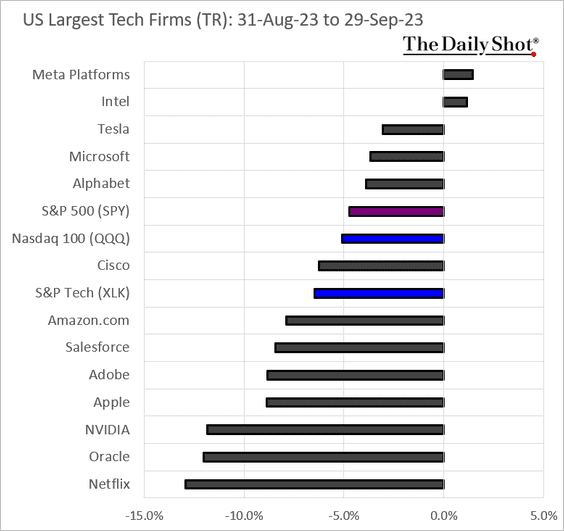
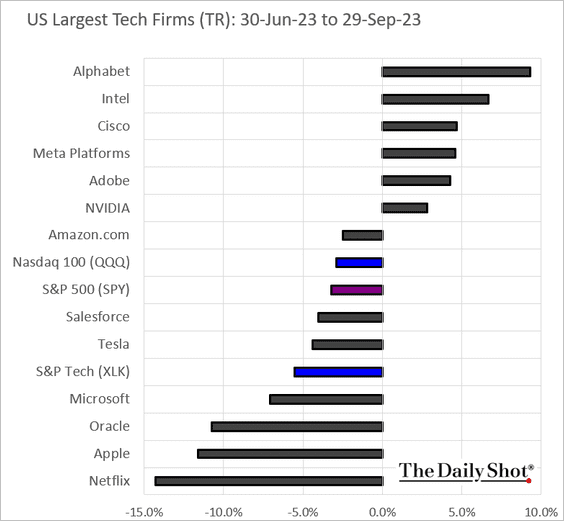
• Largest US tech firms (Sep):
– Q3:
Back to Index
Credit
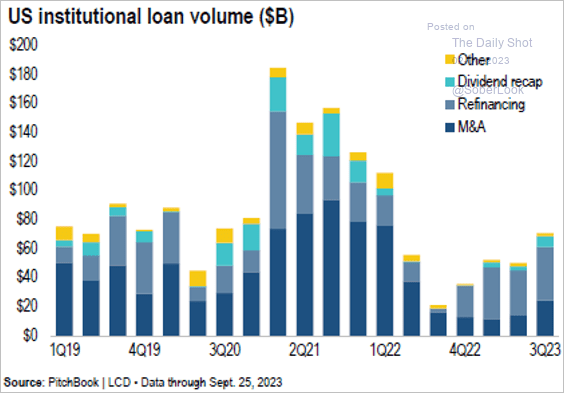
1. US institutional loan volume is starting to recover.
 Source: PitchBook
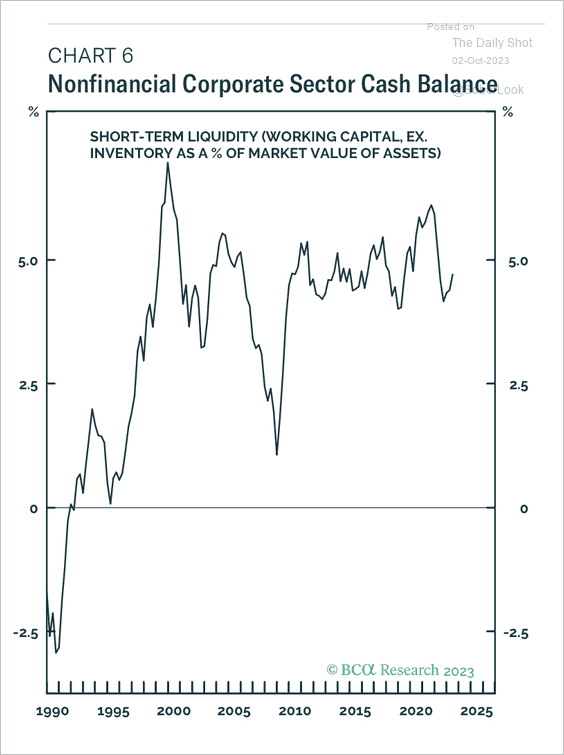
2. US nonfinancial corporate cash balances remain elevated.
 Source: BCA Research
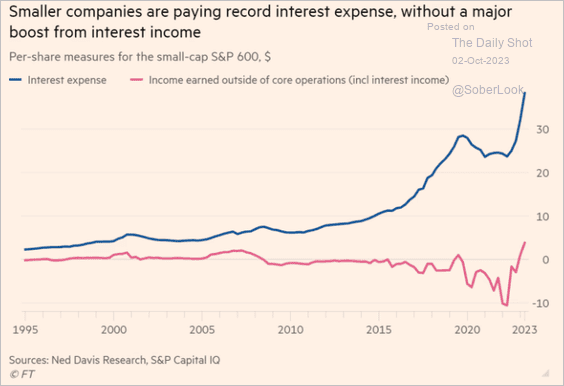
3. Here is a look at small-cap interest expense.
 Source: @financialtimes Read full article
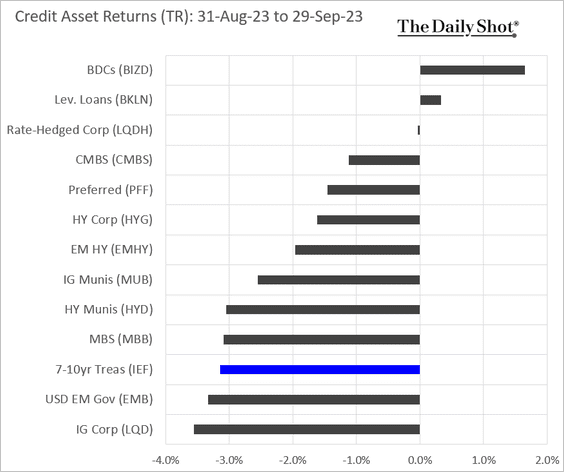
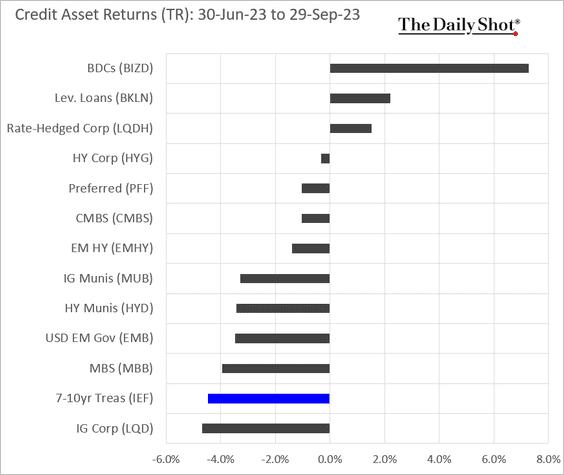
4. Next, we have some performance data for September and Q3.
• Sep:
• Q3:
Back to Index
Rates
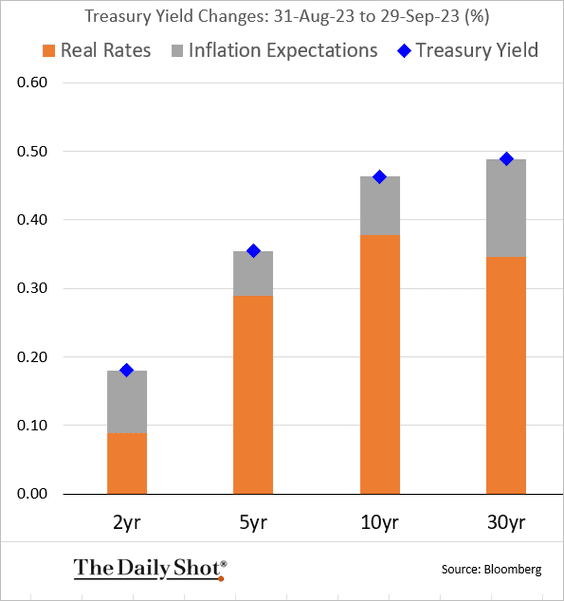
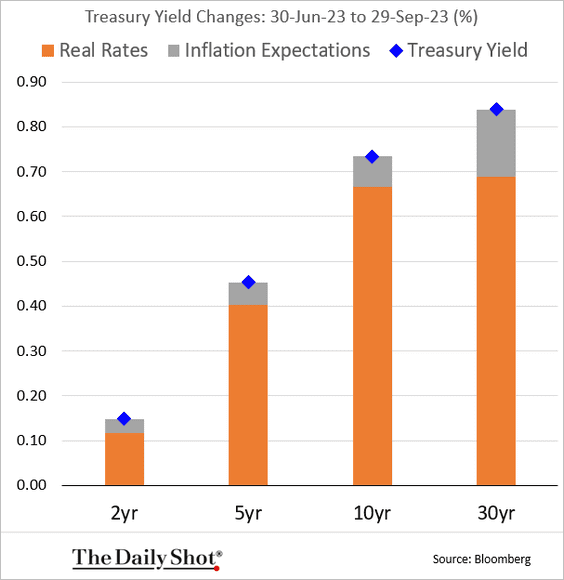
1. Here is a look at the attribution for Treasury yield changes.
• September:
• Q3:
——————–
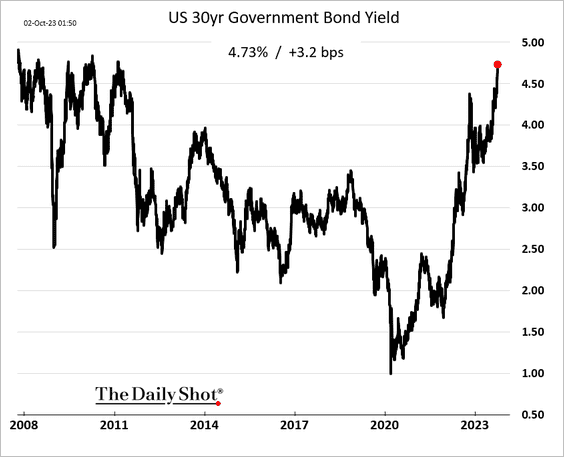
2. The 30-year bond yield hit a multi-year high this morning.
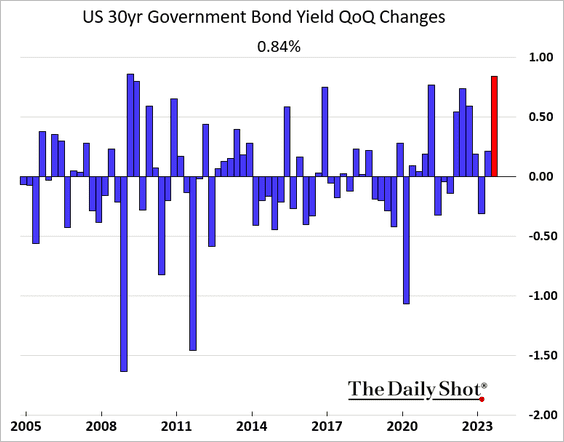
Here are the quarterly changes.
——————–
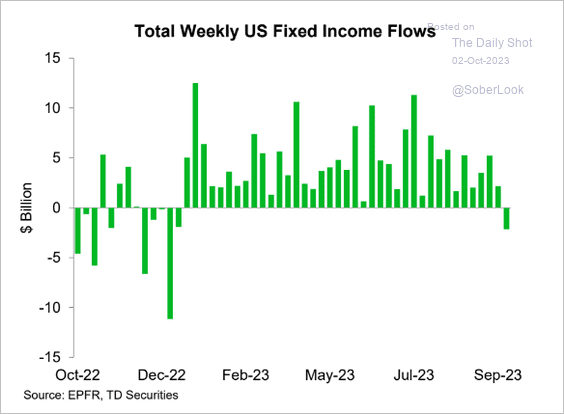
3. Fixed-income funds finally saw some outflows.
 Source: TD Securities; @Barchart
Back to Index
Global Developments
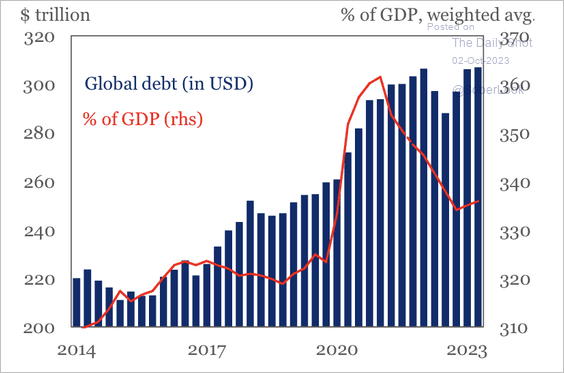
1. Global debt-to-GDP ticked higher during the first half of the year.
 Source: IIF
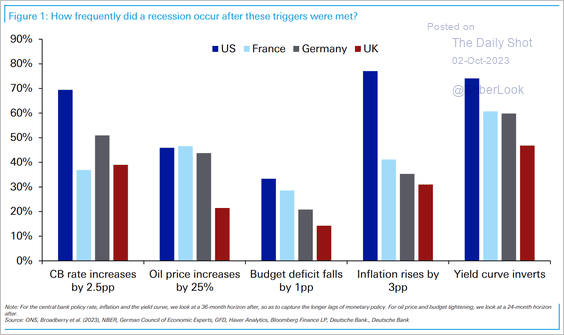
2. Common recessionary signals vary in their predictive power, although the US has been more sensitive to rising inflation, yield curve inversions, and rate hikes.
 Source: Deutsche Bank Research
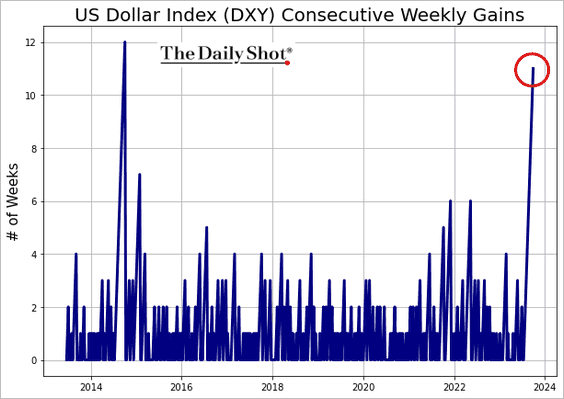
3. The dollar index (DXY) has risen for 11 weeks in a row.
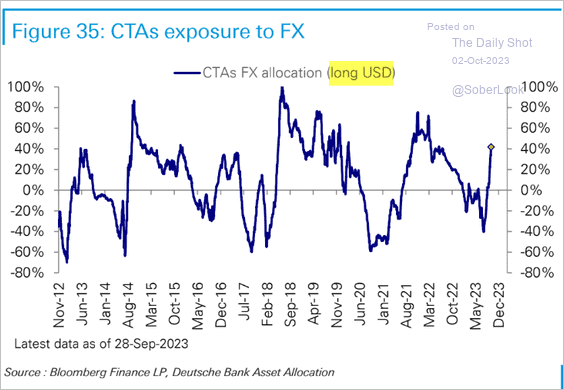
• CTAs have been boosting their USD exposure.
 Source: Deutsche Bank Research
——————–
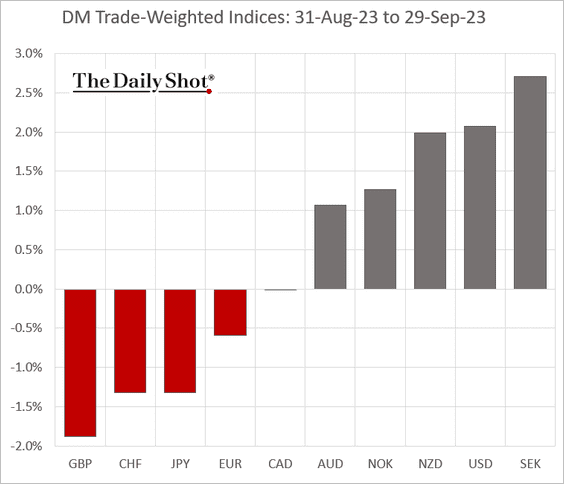
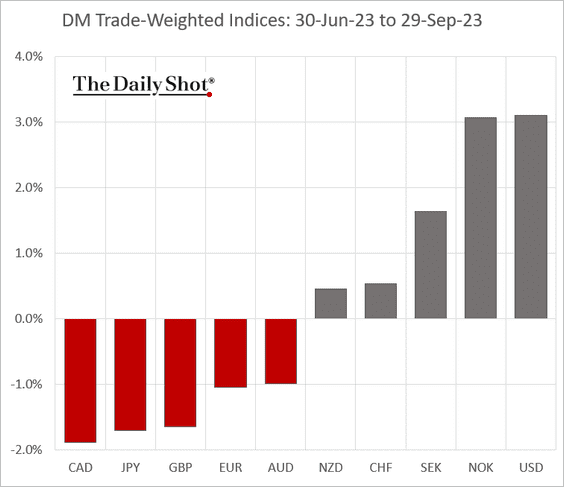
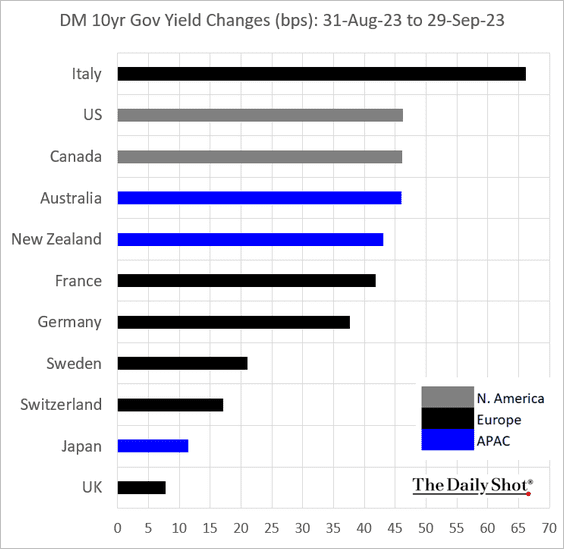
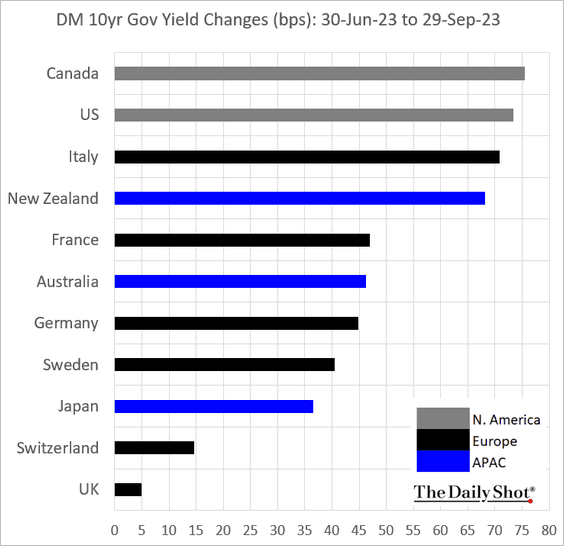
4. Next, we have some performance data for advanced economies covering September and Q3.
• Currencies:
Sep:
Q3:
• Bond yields:
Sep:
Q3:
• Equity indices:
Sep:
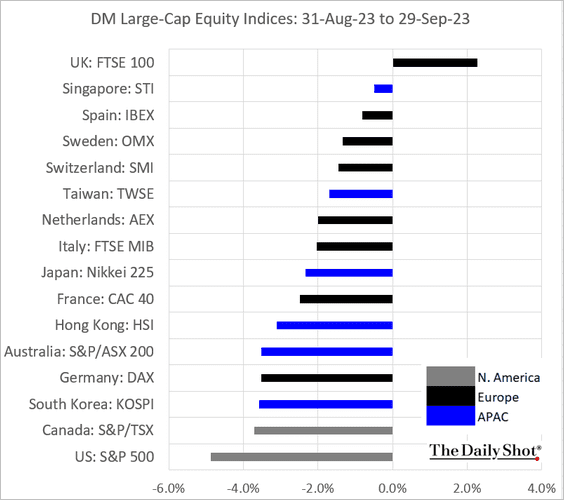
Q3:
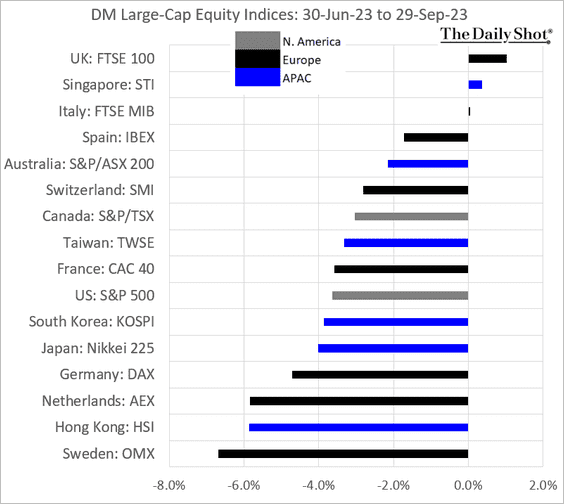
——————–
Food for Thought
1. US EV sales:
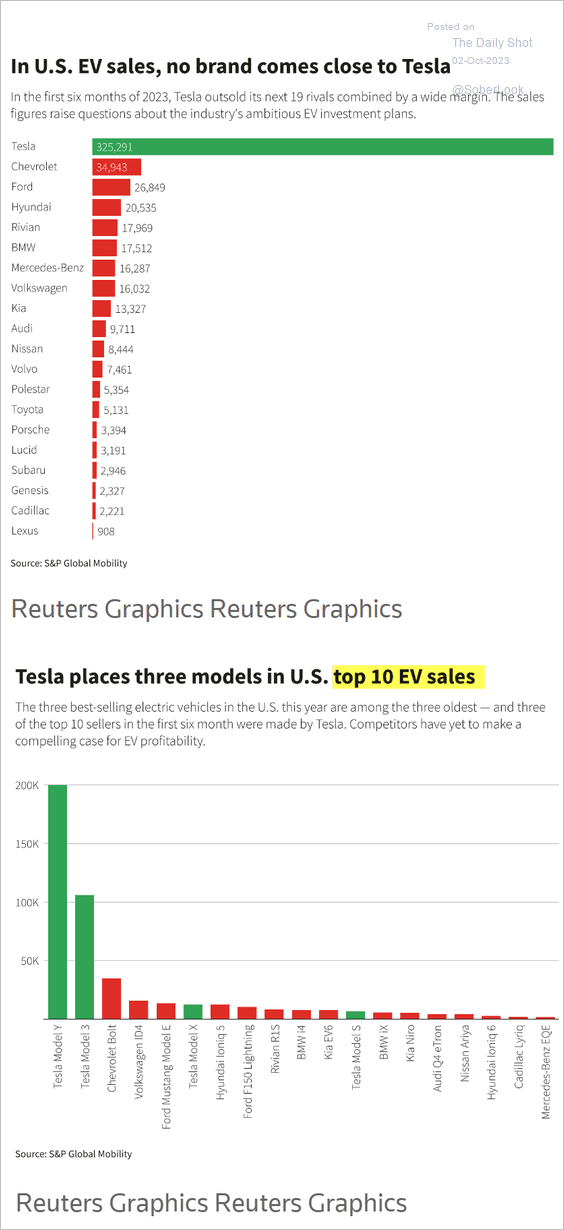 Source: Reuters Read full article
2. Largest automakers:
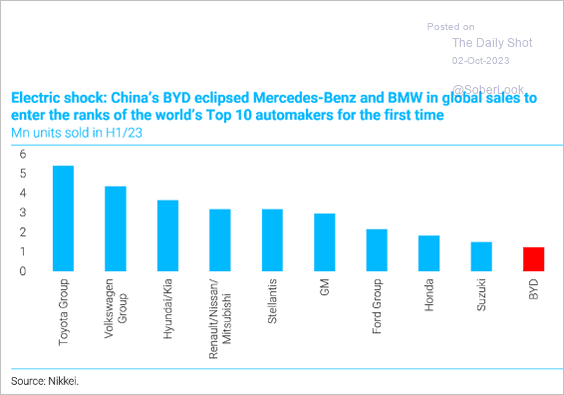 Source: TS Lombard
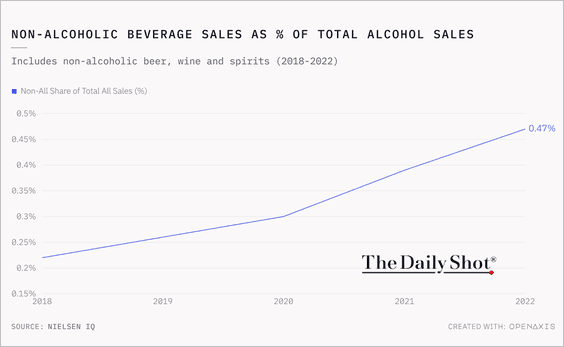
3. Non-alcoholic beverage sales as a share of total alcohol sales:
 Source: @TheDailyShot
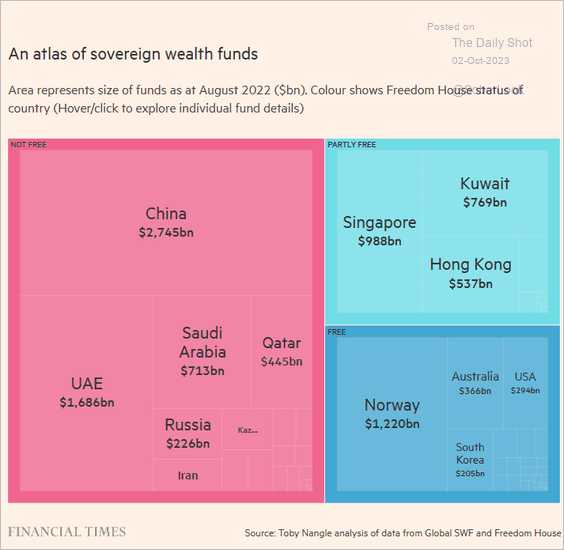
4. Sovereign wealth funds:
 Source: @financialtimes Read full article
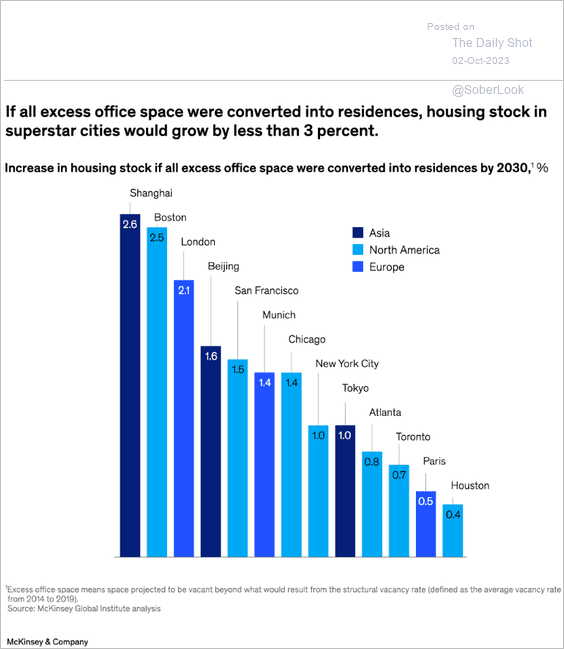
5. The impact of converting vacant offices to residential space:
 Source: McKinsey & Company Read full article
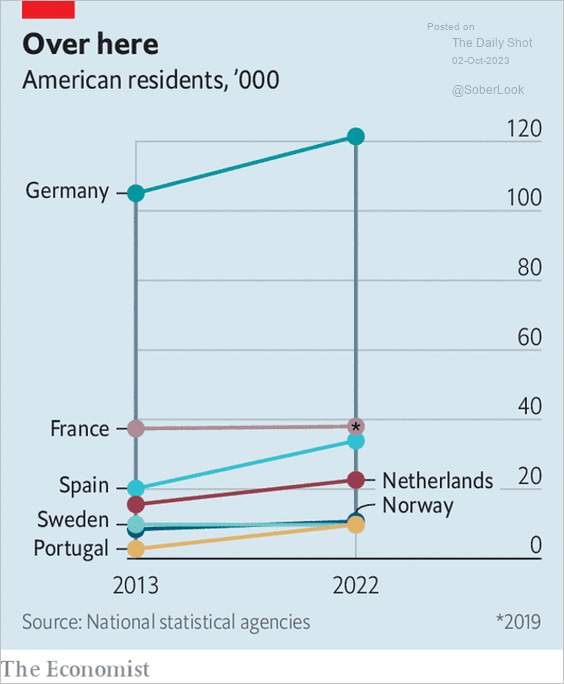
6. Americans in Europe:
 Source: The Economist Read full article
7. Global temperature anomalies:
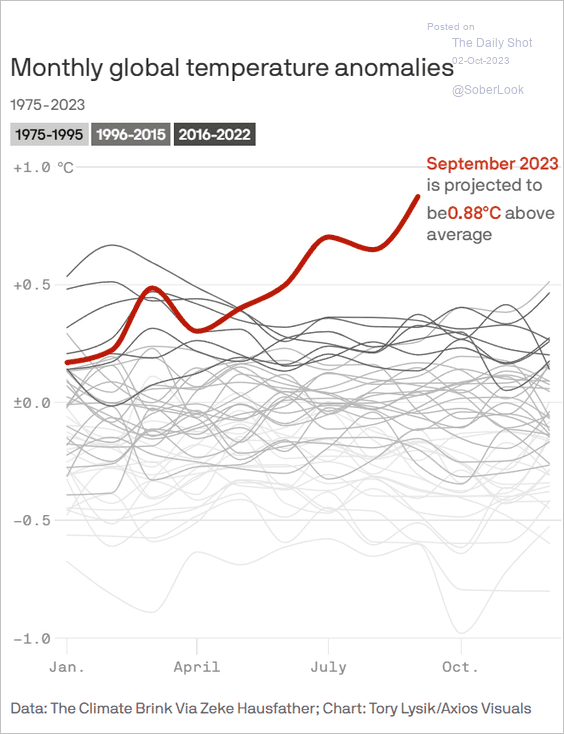 Source: @axios Read full article
8. Euthanasia rates across US animal shelters:
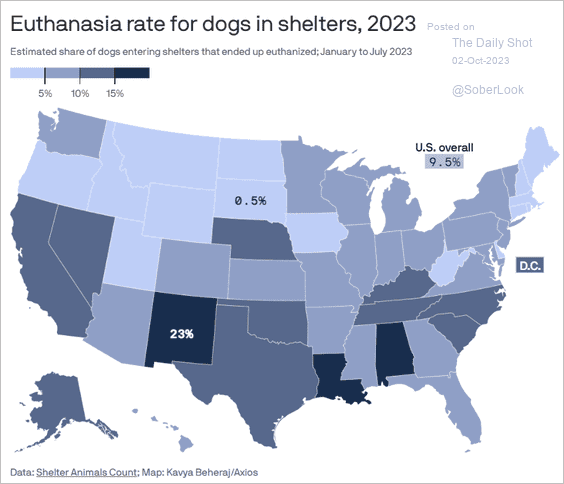 Source: @axios Read full article
9. Best Actor winners depicting real vs. fictional figures:
 Source: @chartrdaily
——————–
Back to Index
