
The Daily Shot: 03-Oct-23
• The United States
• Canada
• The United Kingdom
• The Eurozone
• Asia-Pacific
• China
• Emerging Markets
• Cryptocurrency
• Commodities
• Energy
• Equities
• Credit
• Rates
• Global Developments
• Food for Thought
The United States
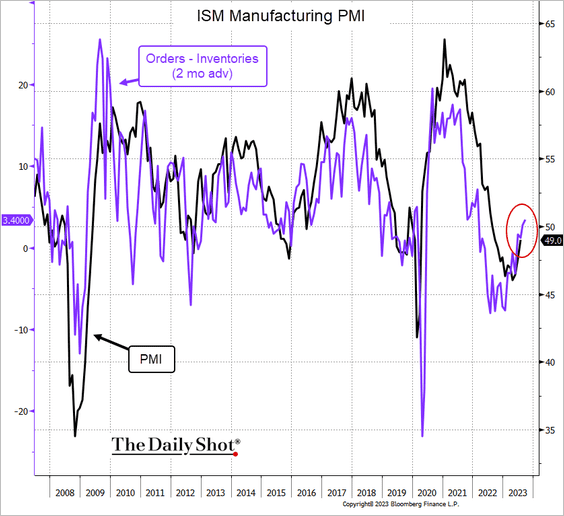
1. The September ISM Manufacturing PMI exceeded expectations, indicating an easing in the US factory slump.
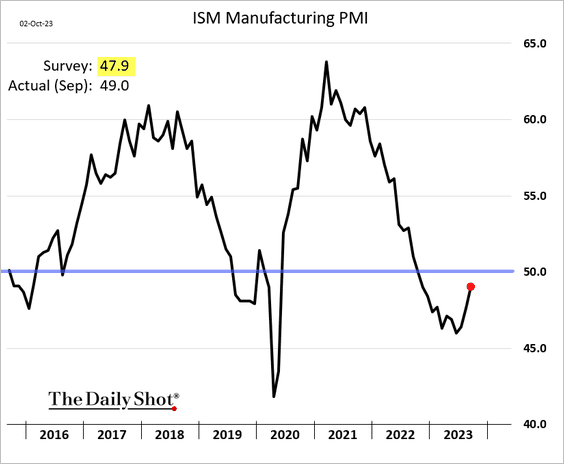
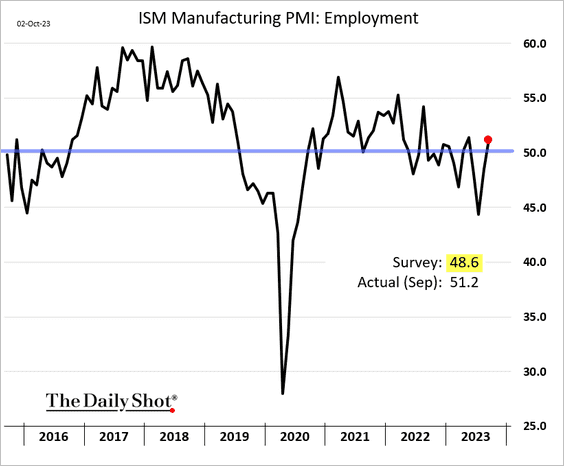
• Production and employment shifted to growth (2 charts).
 Source: @TheTerminal, Bloomberg Finance L.P.
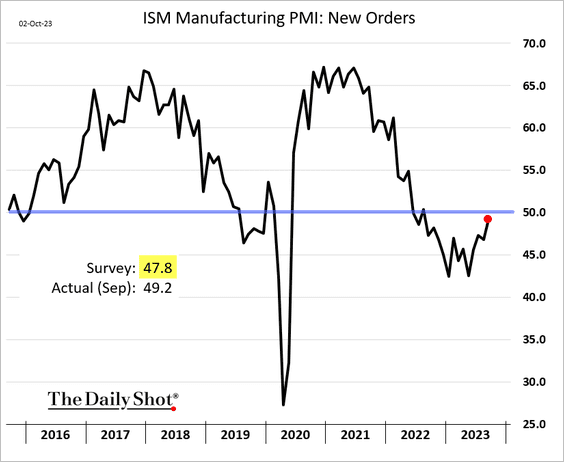
• The spread between the indicators of orders and inventories signals a further improvement ahead.
 Source: @TheTerminal, Bloomberg Finance L.P.
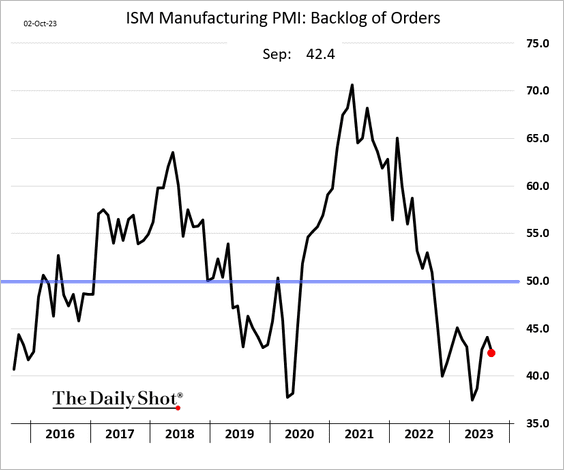
• Order backlog keeps shrinking.
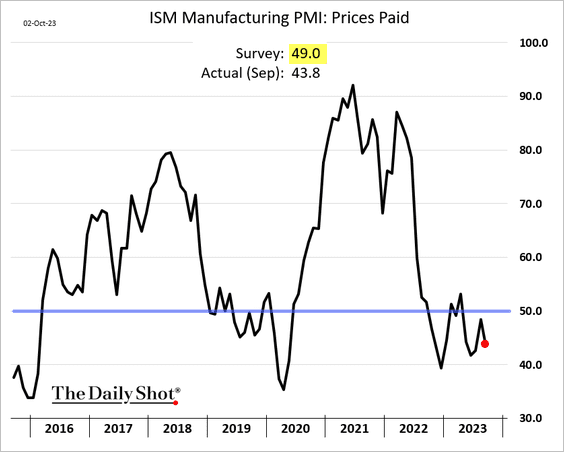
• Manufacturers continue to report falling input prices.
——————–
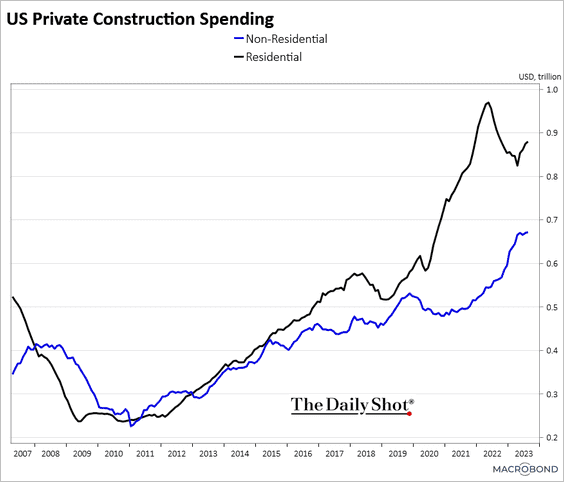
2. Construction spending climbed again in August (8th increase in a row).
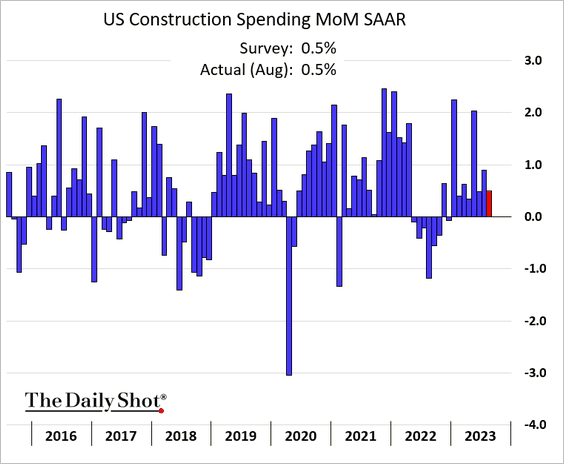
Both residential and non-residential expenditures are rising.
 Source: Chart and data provided by Macrobond
——————–
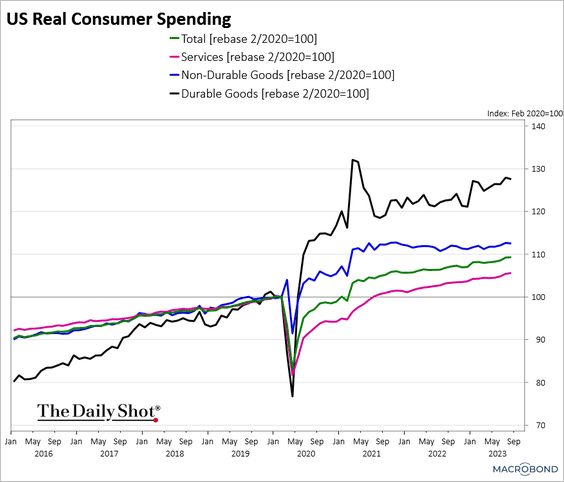
3. Here is a look at real consumer spending trends for goods and services.
 Source: Chart and data provided by Macrobond
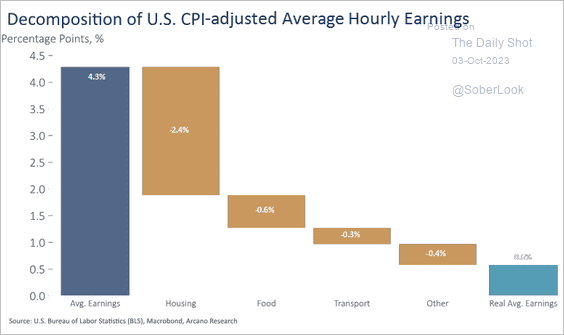
4. This diagram bridges nominal and real wage growth.
 Source: Arcano Economics
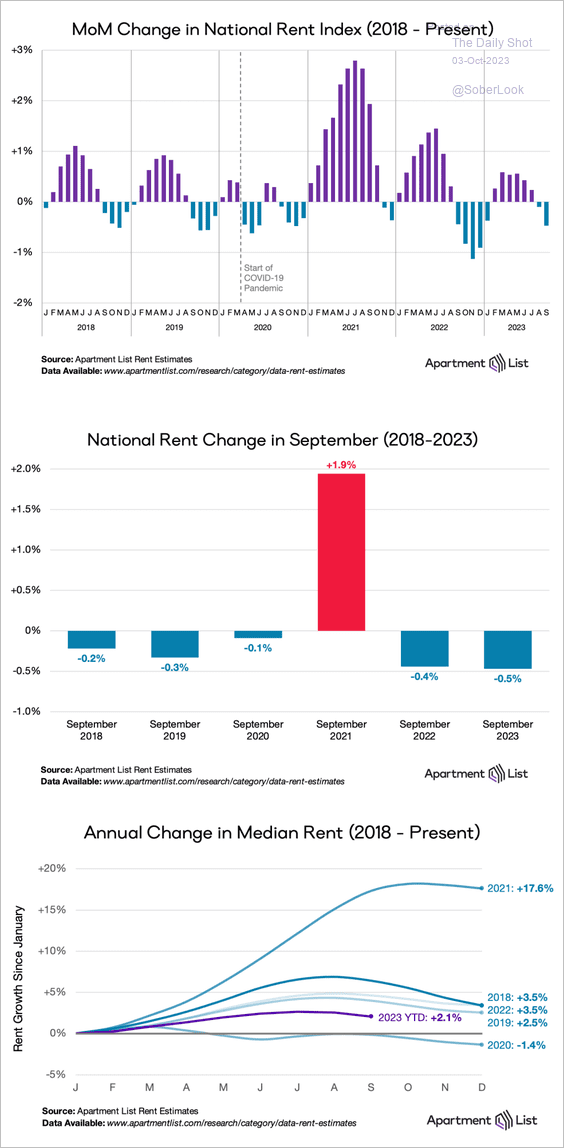
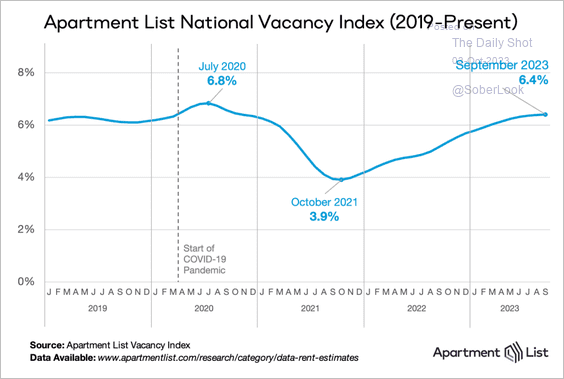
5. Last month, the decline in rents was greater than the typical decrease observed in September.
 Source: Apartment List
Rental vacancies are now above pre-COVID levels.
 Source: Apartment List
——————–
6. Used vehicle prices have been declining, yet they remain approximately 40% above pre-pandemic levels.
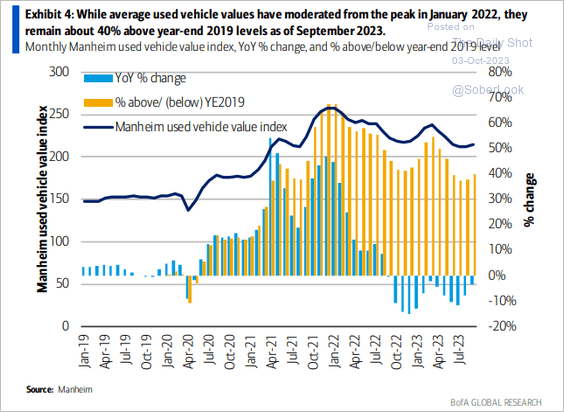 Source: BofA Global Research; @MikeZaccardi
Back to Index
Canada
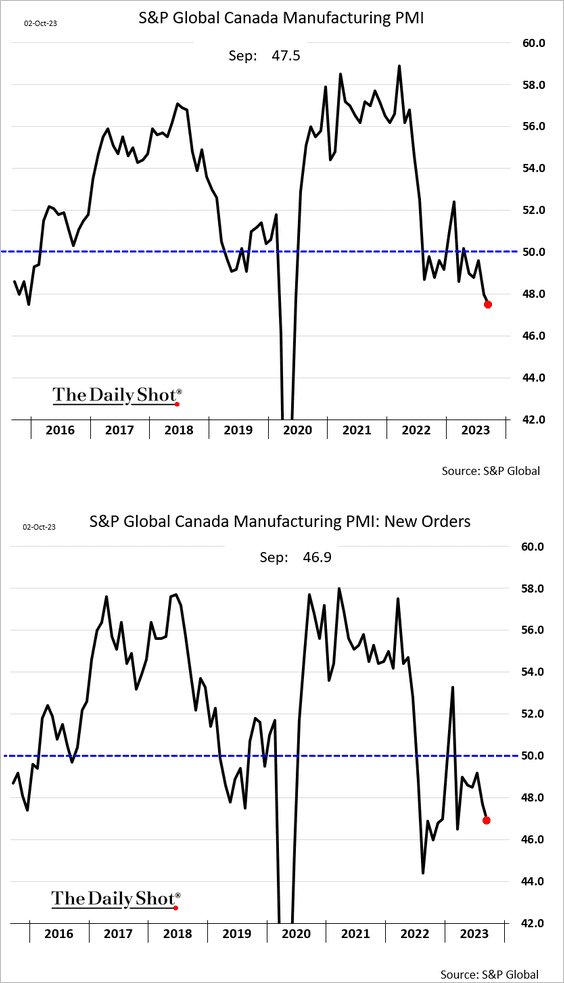
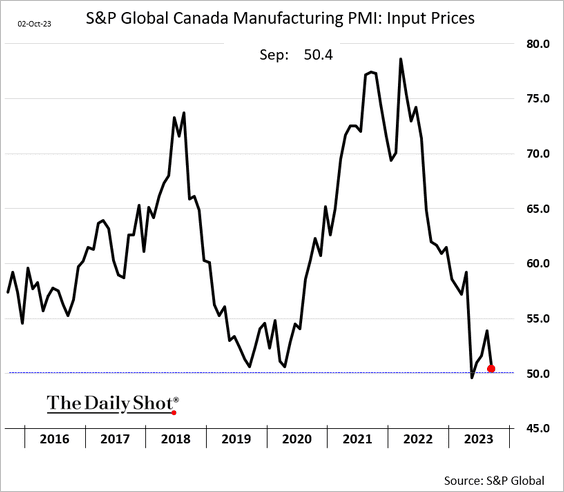
1. Canadian manufacturing contraction accelerated last month.
 Source: Reuters Read full article
Input price gains have stalled as demand softens.
——————–
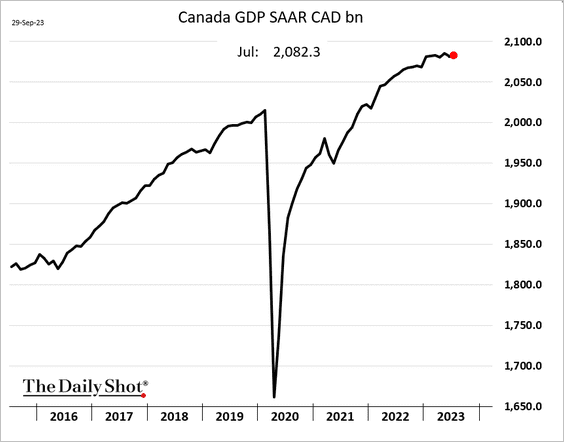
2. The monthly GDP estimate was unchanged in July.
Back to Index
The United Kingdom
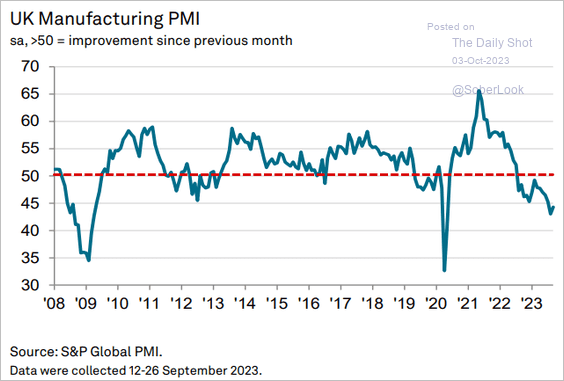
1. The manufacturing sector continued to struggle last month.
 Source: S&P Global PMI
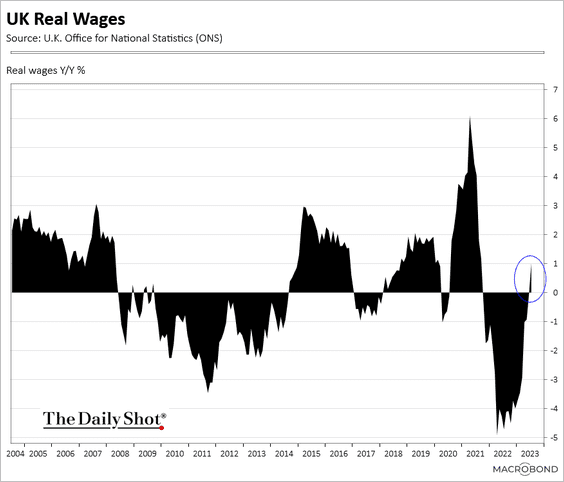
2. Real wages are back in positive territory.
 Source: Chart and data provided by Macrobond
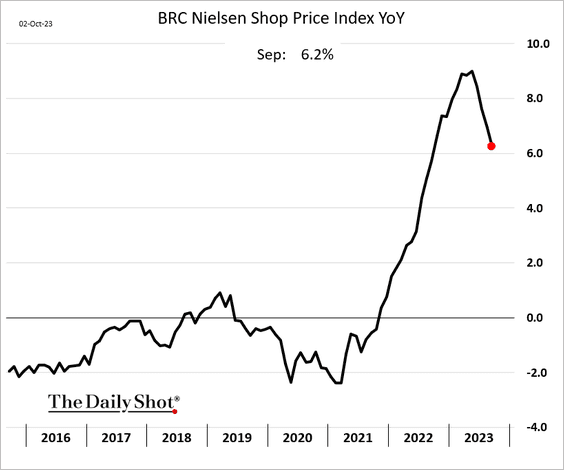
3. Shop price gains are moderating.
4. Here is a look at the BoE’s economic forecasts.
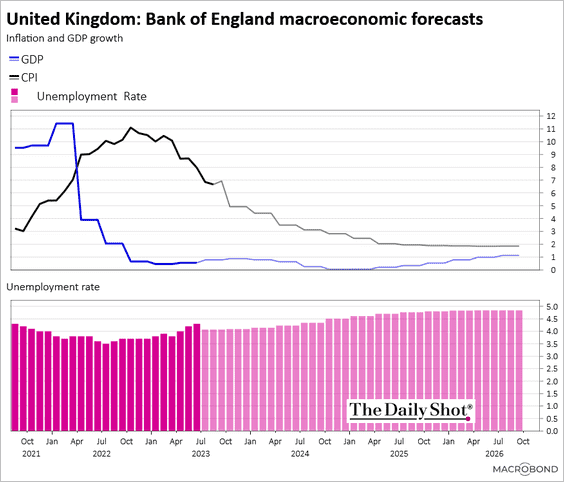 Source: Chart and data provided by Macrobond
Back to Index
The Eurozone
The manufacturing slump continued last month, with the PMI report pointing to weakness in industrial production.
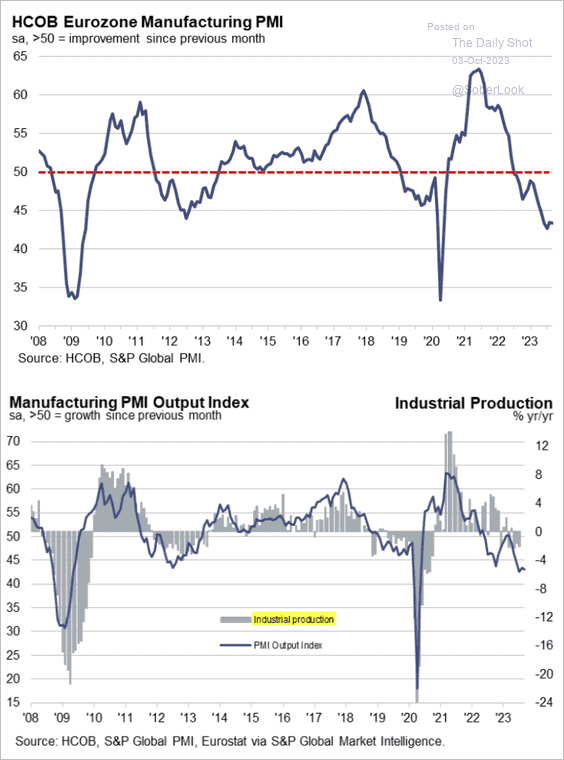 Source: S&P Global PMI
 Source: Reuters Read full article
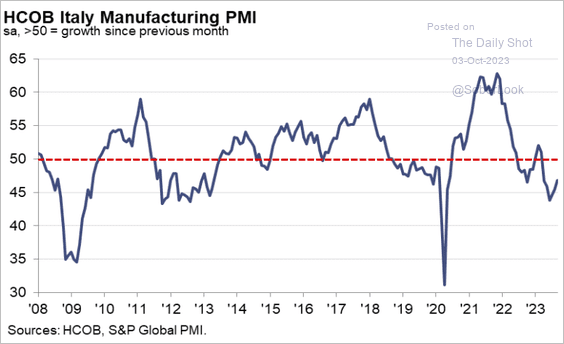
The contraction in Spanish and Italian factory activity moderated somewhat in September.
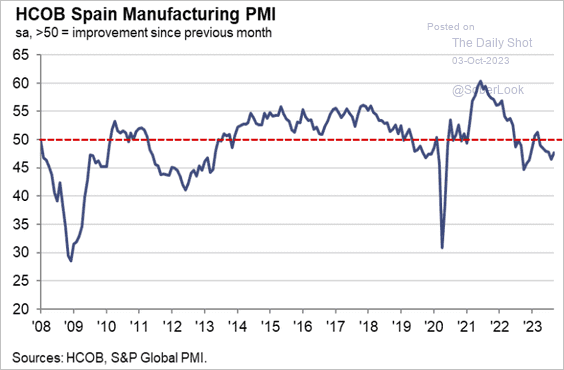 Source: S&P Global PMI
 Source: S&P Global PMI
Back to Index
Asia-Pacific
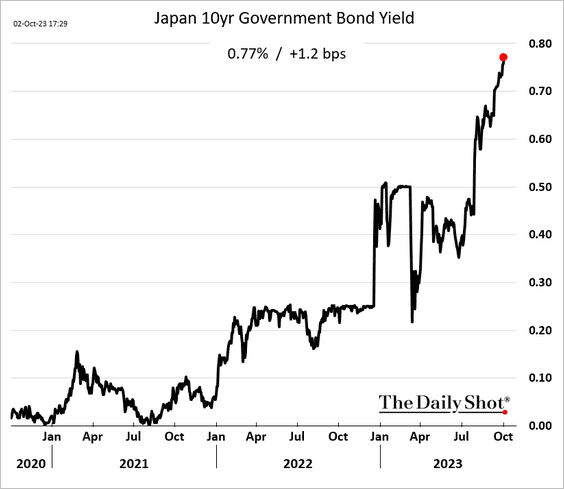
1. JGB yields continue to grind higher.
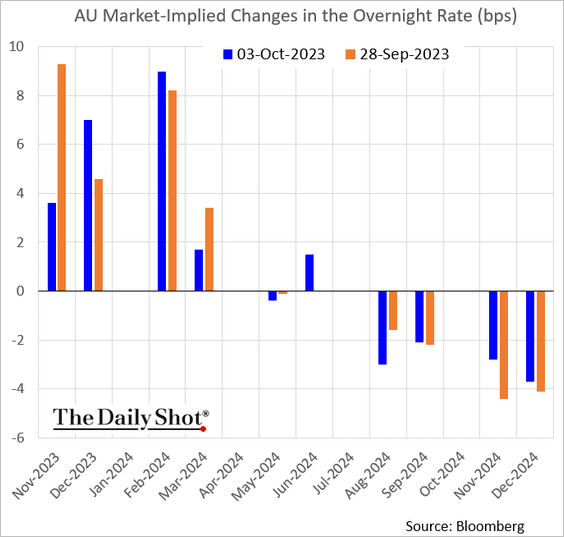
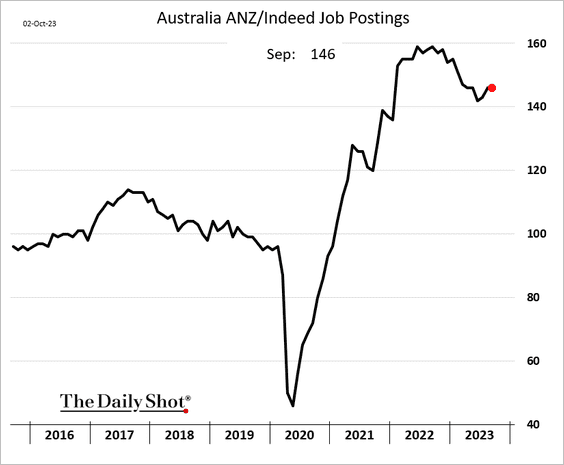
2. Next, we have some updates on Australia.
• The RBA left rates unchanged. The market expects one more rate increase in this cycle.
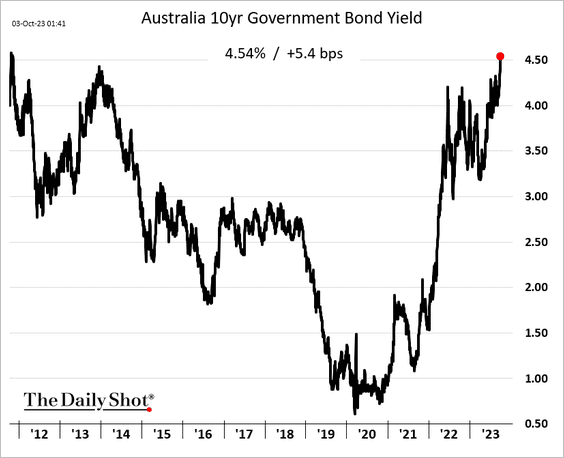
• The 10-year yield hit the highest level since 2011.
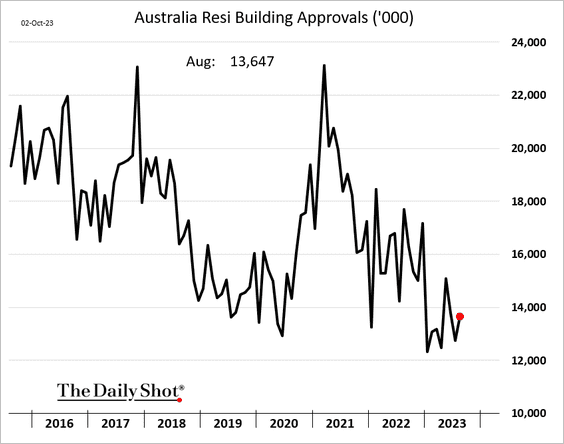
• Residential building approvals increased in August.
• Job postings remain elevated.
Back to Index
China
1. Very few cities report rising property prices.
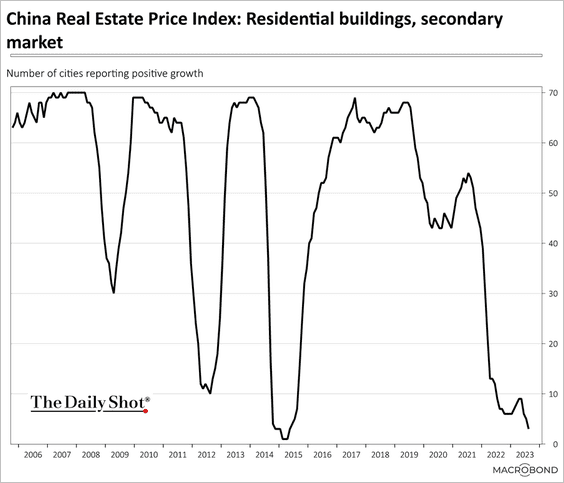 Source: Chart and data provided by Macrobond
The supply of new housing has been falling,
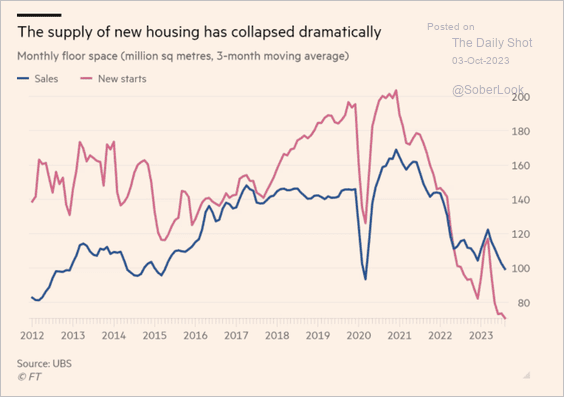 Source: @financialtimes Read full article
——————–
2. China’s savings rate stands out.
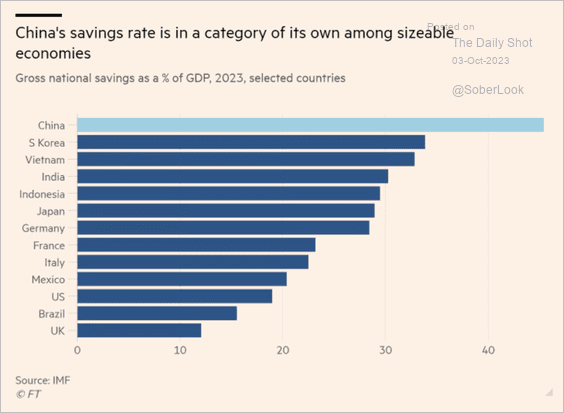 Source: @financialtimes Read full article
3. A-share corporates experienced a slowdown in revenue growth and a contraction in profits in Q2.
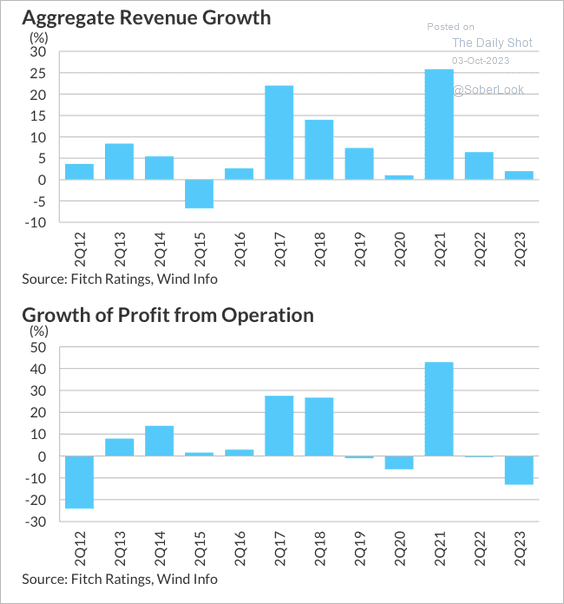 Source: Fitch Ratings
• Weakness was notable in the energy and materials sector. (2 charts)
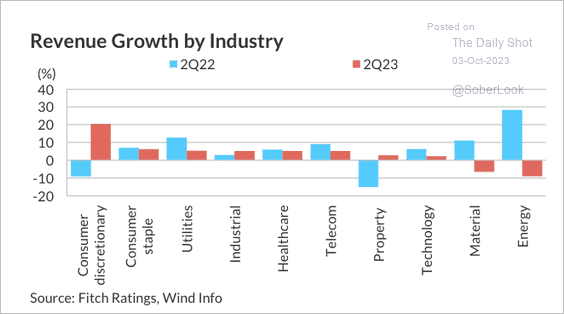 Source: Fitch Ratings
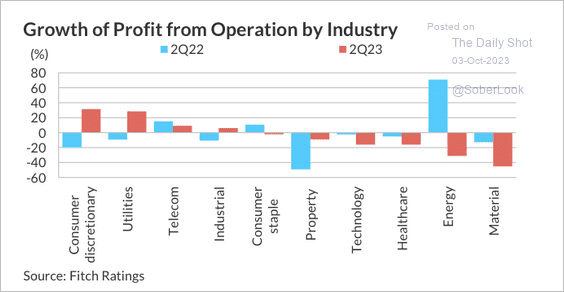 Source: Fitch Ratings
Back to Index
Emerging Markets
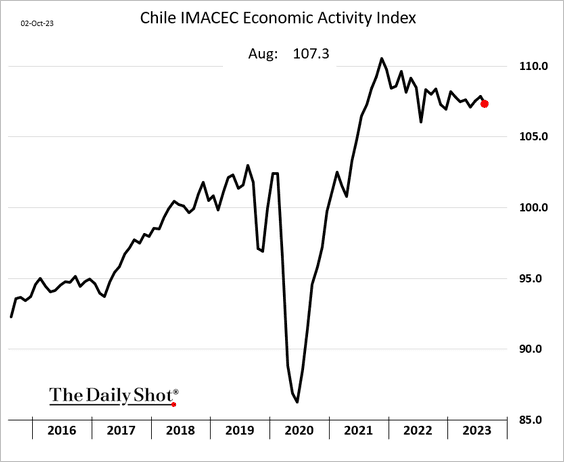
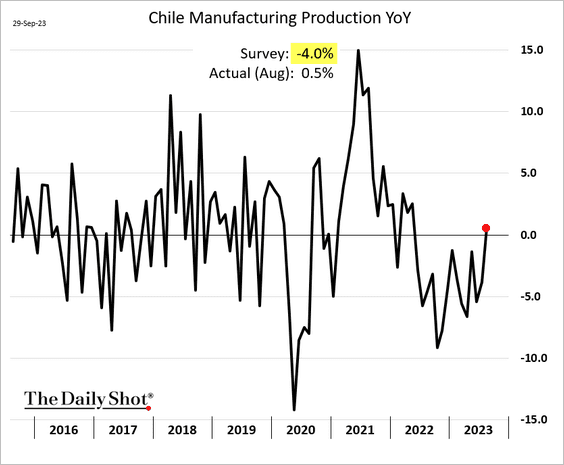
1. Let’s begin with Chile.
• Economic activity is gradually easing.
• August manufacturing output surprised to the upside.
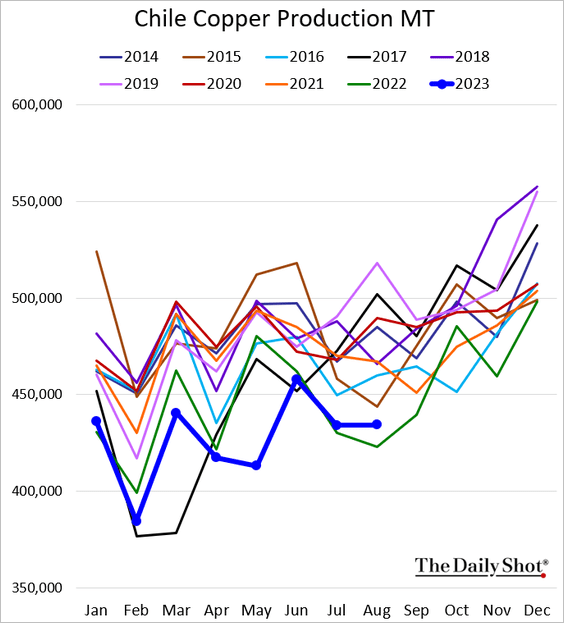
• Copper production remains soft but is now above last year’s levels.
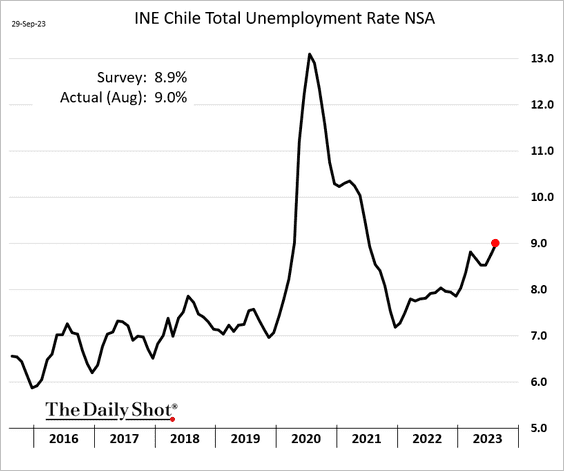
• The unemployment rate is rising.
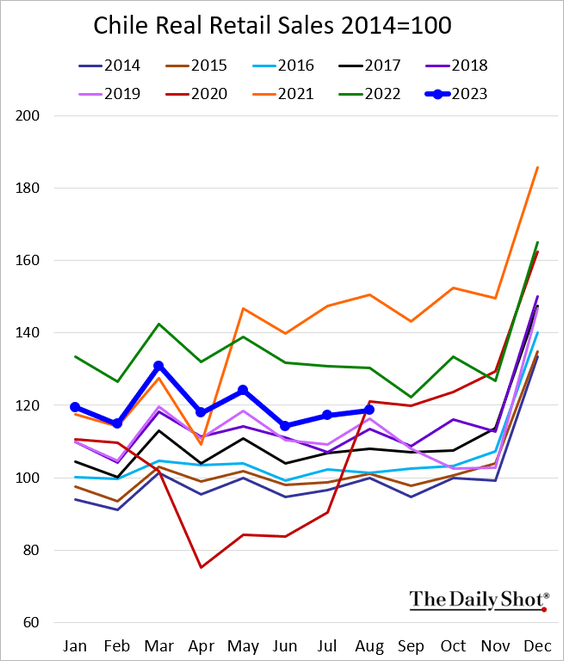
• Retail sales are running below 2022 levels.
——————–
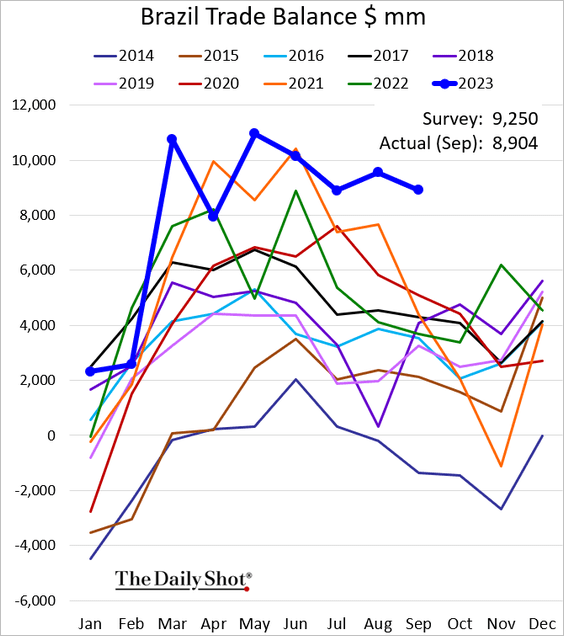
2. Brazil’s trade surplus is at multi-year highs.
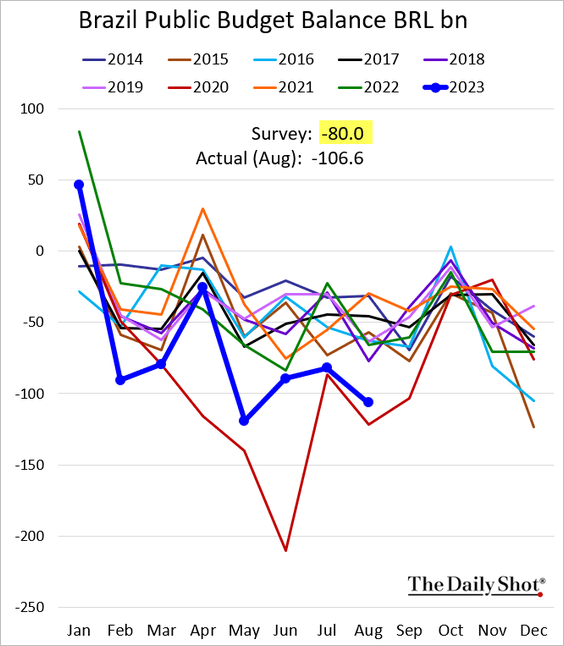
• The budget deficit was worse than expected in August.
• Manufacturing activity is still not growing (PMI < 50).
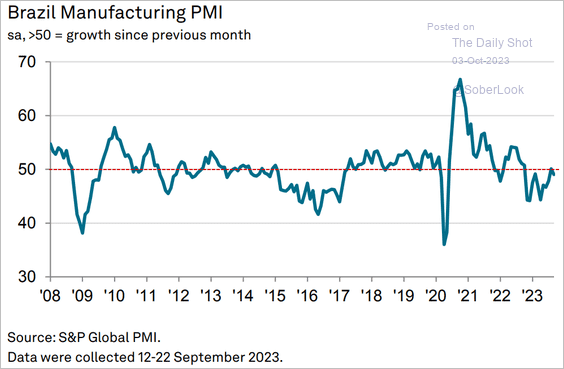 Source: S&P Global PMI
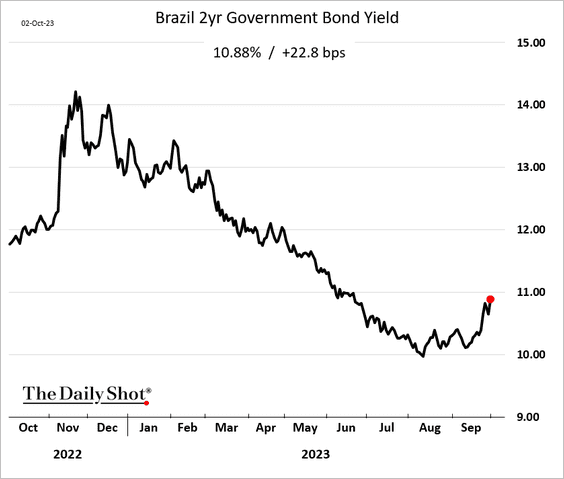
• Brazil’s short-term bond yields are rising as traders temper their rate-cut expectations.
——————–
3. Mexico’s manufacturing growth has stalled.
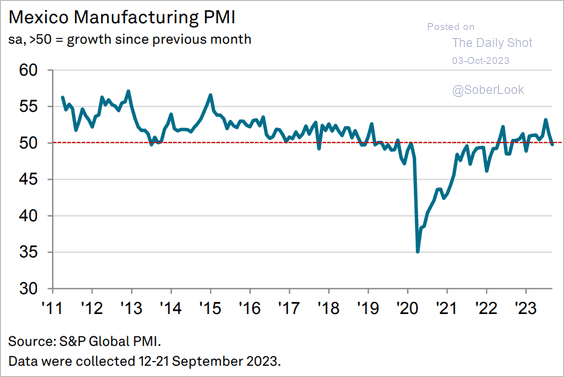 Source: S&P Global PMI
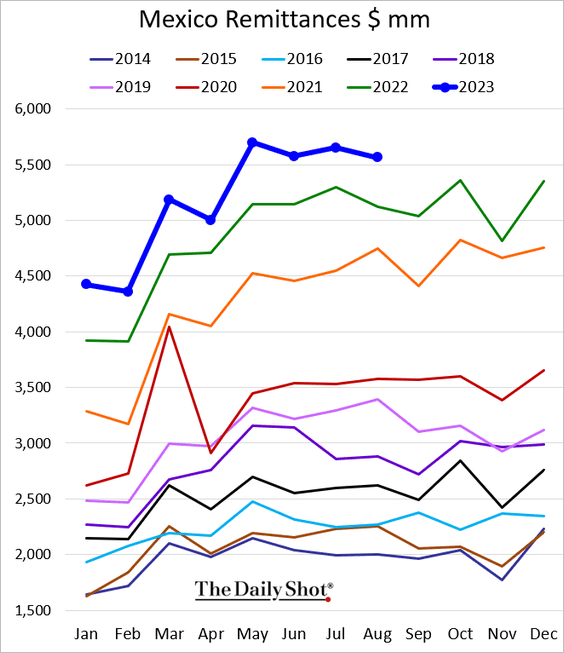
• Remittances remain elevated.
——————–
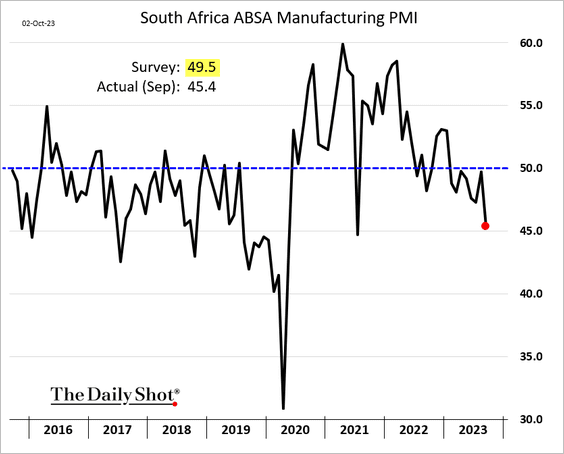
4. South Africa’s manufacturing activity declined sharply last month.
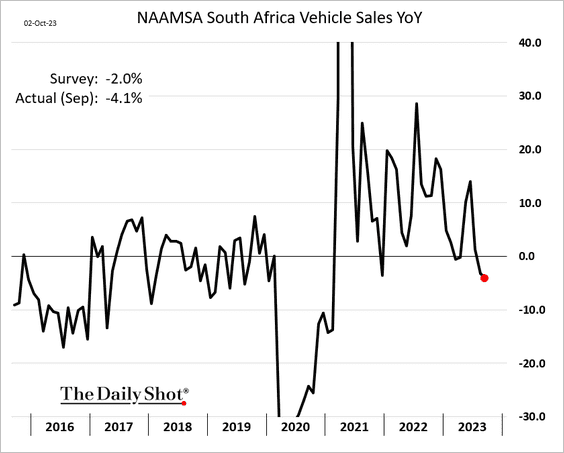
• Vehicle sales are slowing.
——————–
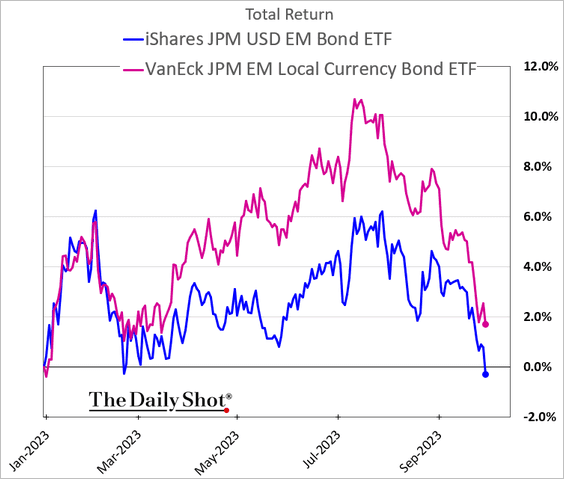
5. EM bond prices continue to sink in dollar terms.
Back to Index
Cryptocurrency
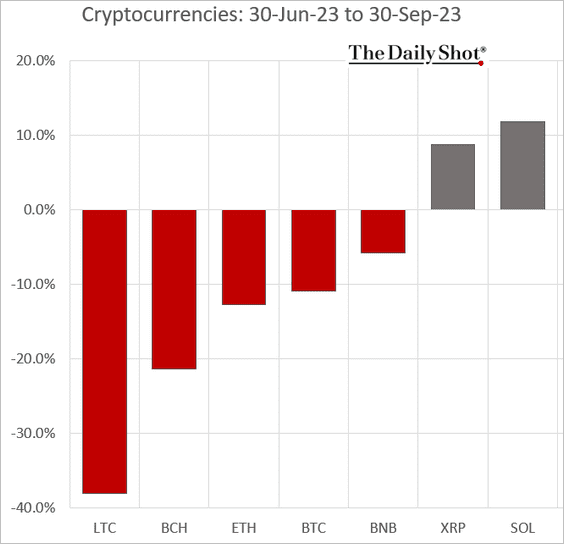
1. Let’s start with the Q3 performance for some of the most liquid cryptos.
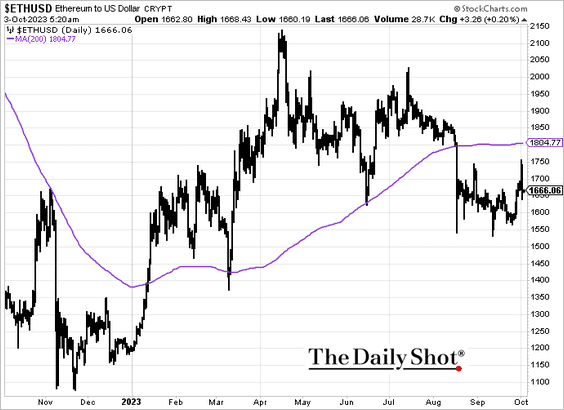
2. Bitcoin is struggling to break above the 200-day moving average.
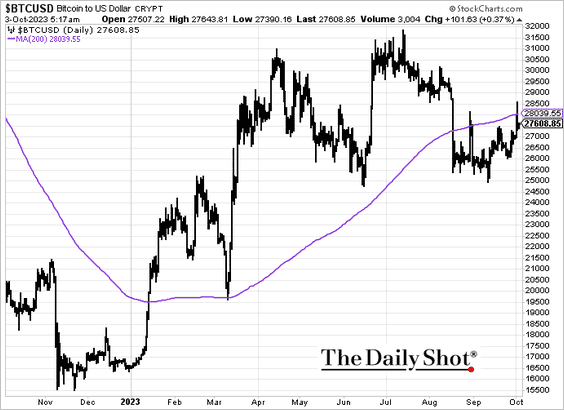
Ether is not quite there.
——————–
3. Here is a look at market cap and liquidity rankings across select cryptos, according to Keiko.
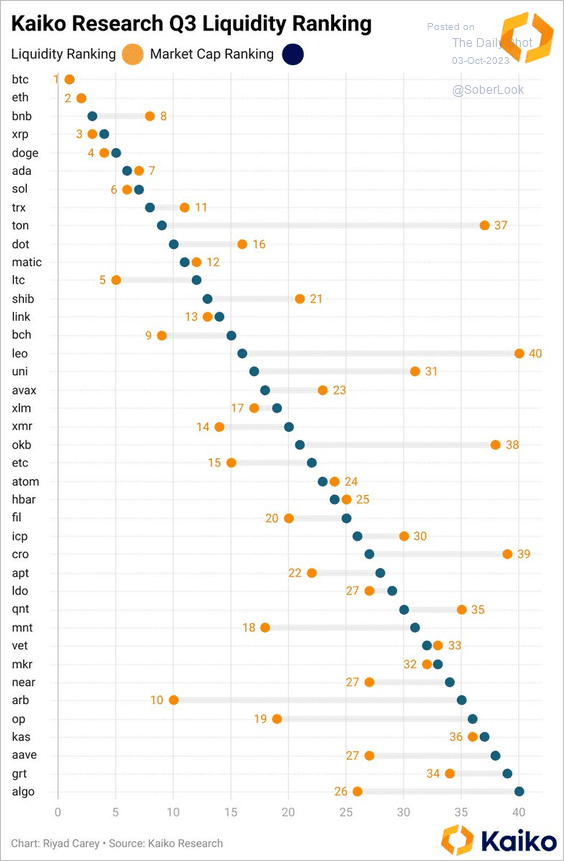 Source: @KaikoData
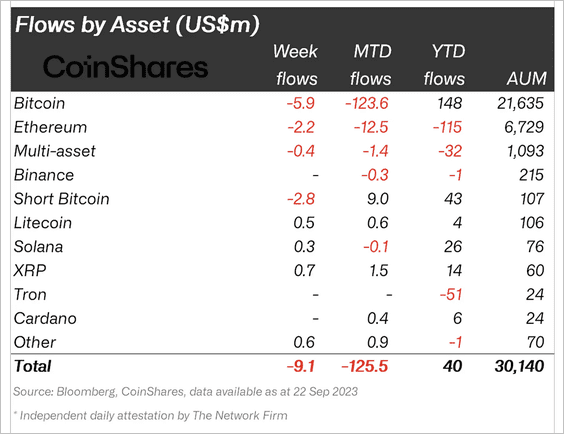
4. Crypto funds saw outflows for the sixth consecutive week led by long-bitcoin products. (2 charts)
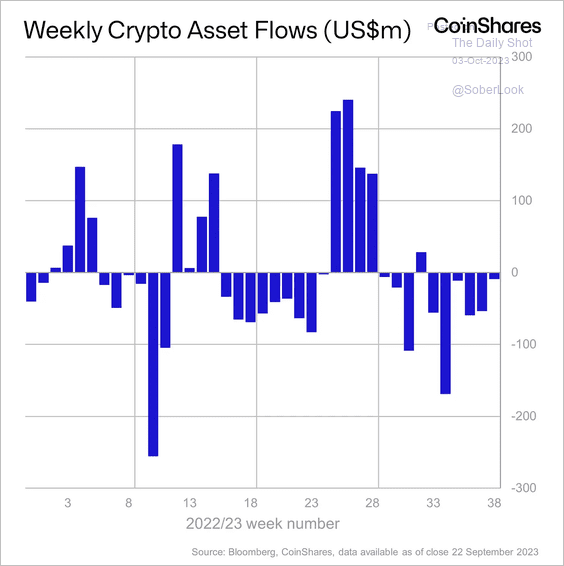 Source: CoinShares Read full article
 Source: CoinShares Read full article
US crypto funds led outflows last week, while Europe saw inflows.
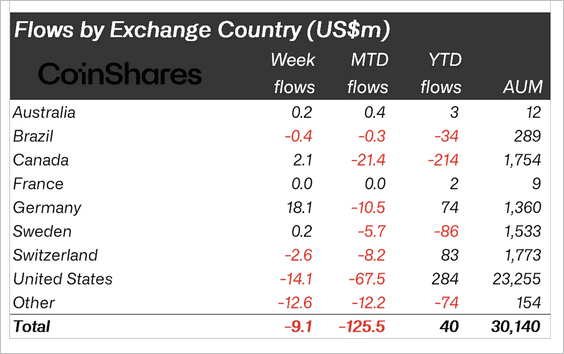 Source: CoinShares Read full article
Back to Index
Commodities
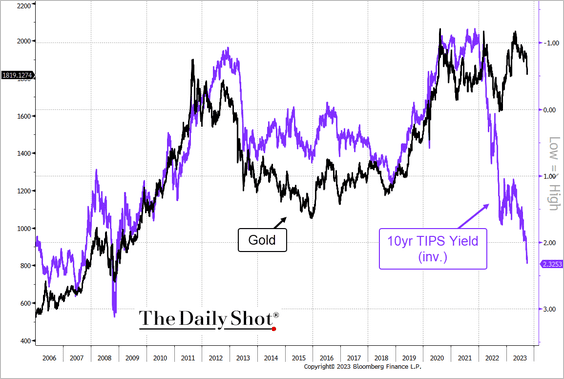
1. Surging real rates and the US dollar rally continue to pose downside risks for gold.
 Source: @TheTerminal, Bloomberg Finance L.P.
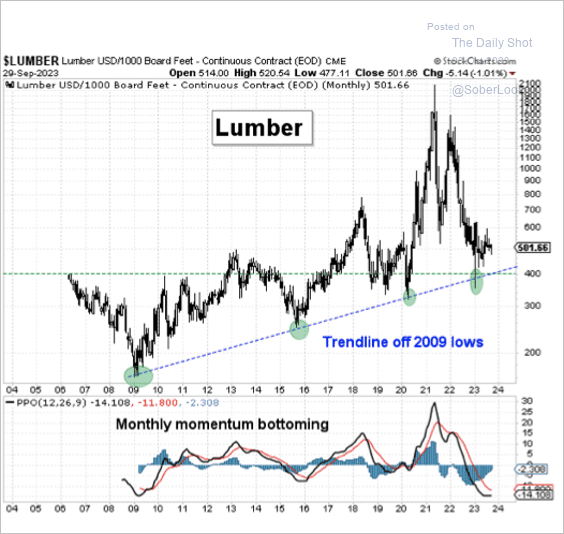
2. The lumber futures price is holding long-term support with improving momentum.
 Source: Aazan Habib, Paradigm Capital
Back to Index
Energy
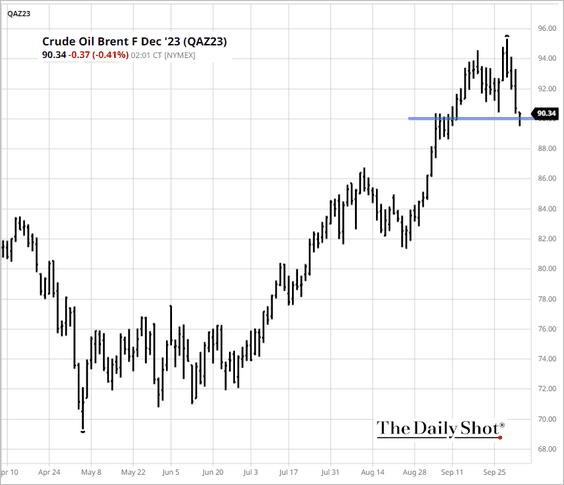
1. Surging bond yields have been pressuring crude oil, but Brent appears to hold support at $90/bbl.
 Source: barchart.com
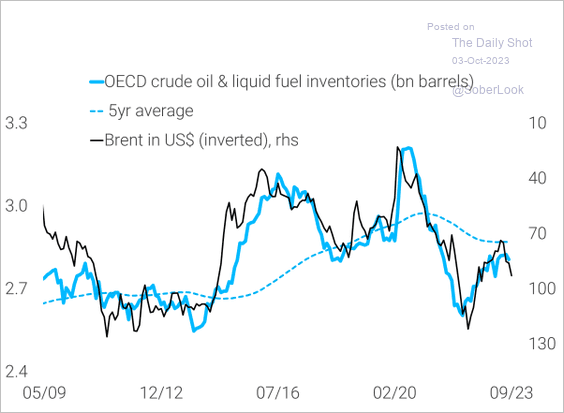
2. Oil prices are highly correlated to the OECD liquids inventories (inverse correlation).
 Source: TS Lombard
3. BCA Research expects China’s oil demand to remain robust, which could benefit prices.
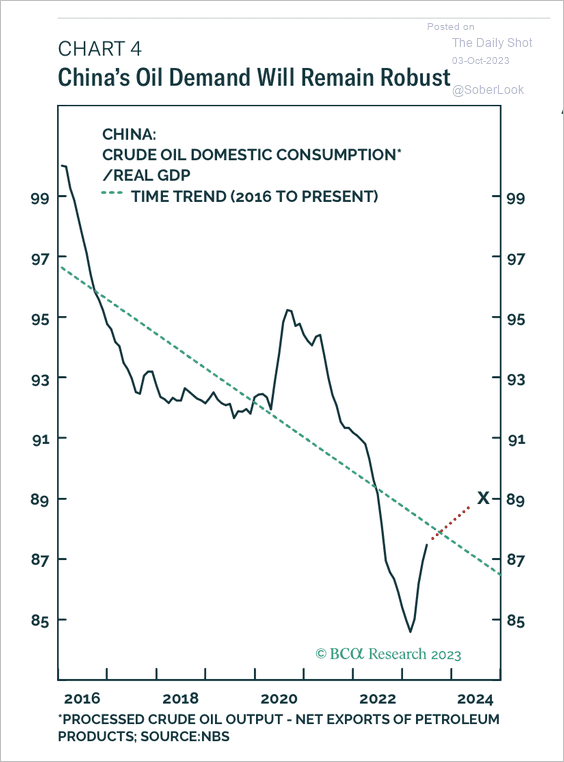 Source: BCA Research
Back to Index
Equities
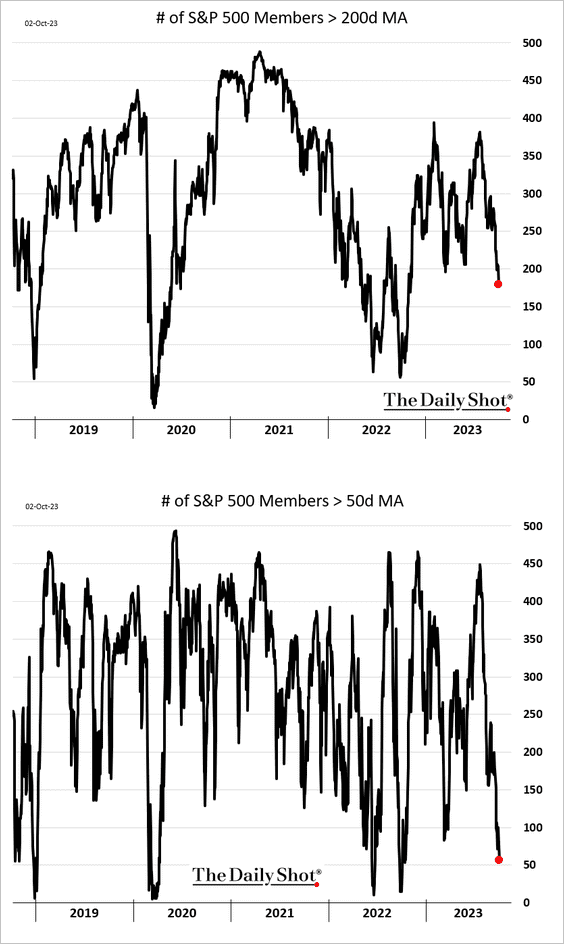
1. Market breadth keeps deteriorating.
2. Surging real yields remain a threat to stock valuations. Something has to give.
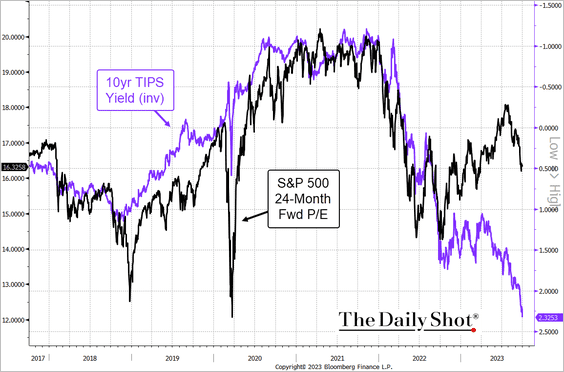 Source: @TheTerminal, Bloomberg Finance L.P.
3. The stock market’s earnings “spread” to Treasuries (equity risk premium) is now well below spreads offered by the investment-grade bond market (IG OAS).
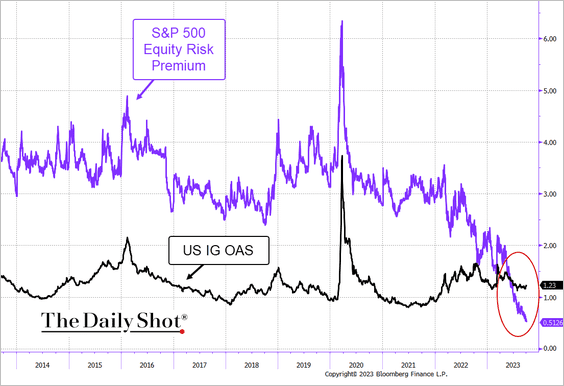 Source: @TheTerminal, Bloomberg Finance L.P.
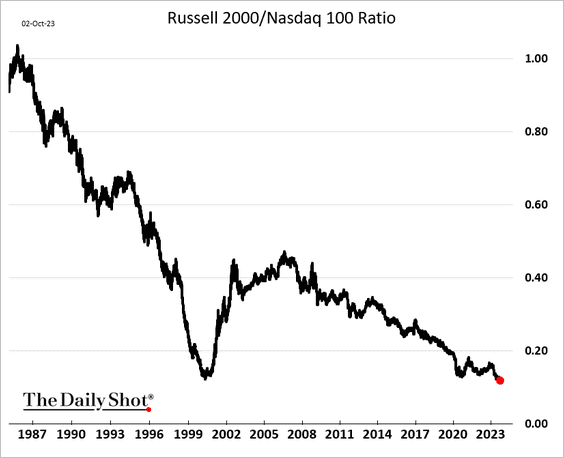
4. Small caps and microcaps are widening their underperformance.
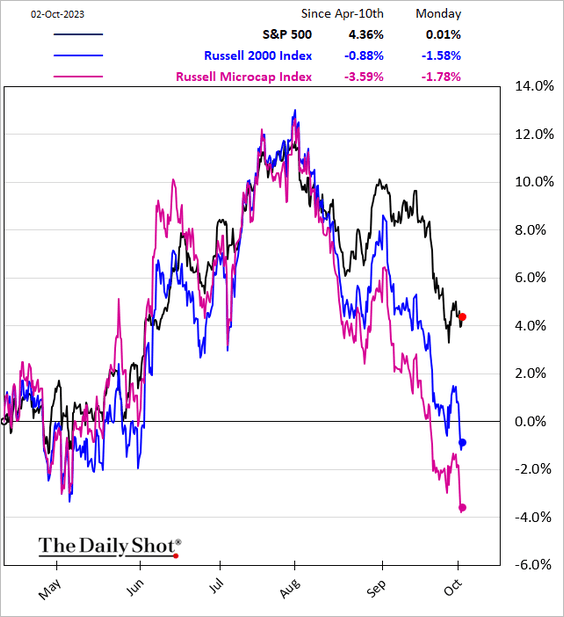
• The Russell 2000/Nasdaq 100 ratio hit a record low.
• The number of Russell 2000 companies with negative earnings remains elevated.
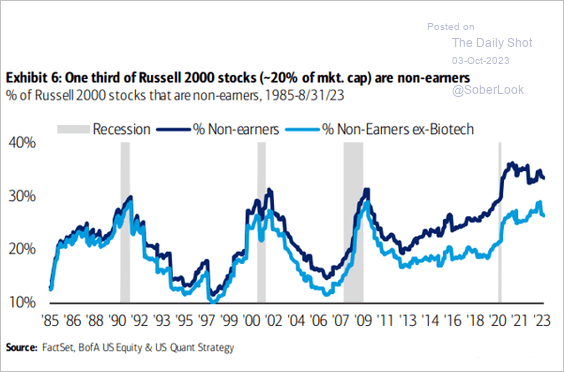 Source: BofA Global Research
——————–
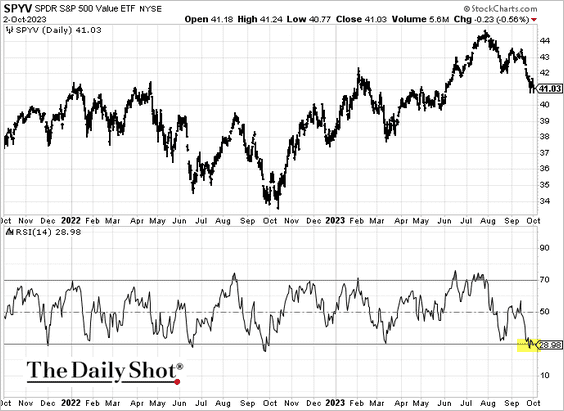
5. Value stocks are also widening their underperformance.
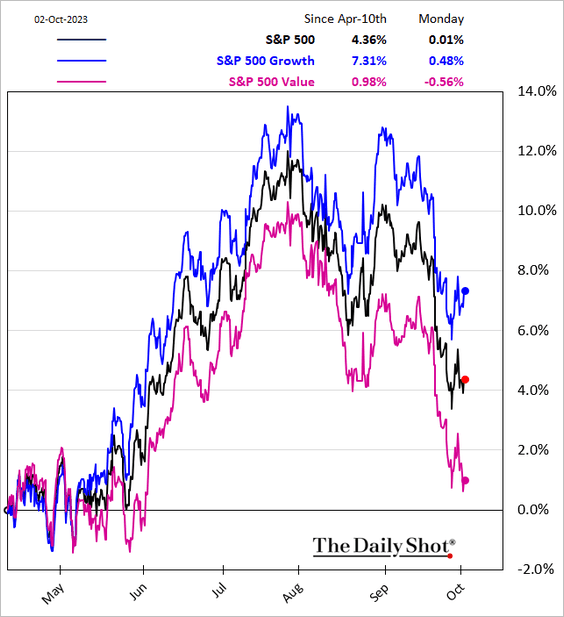
Technicals suggest that value is oversold.
——————–
6. So far, US homebuilding stocks have shrugged off accelerating mortgage rates.
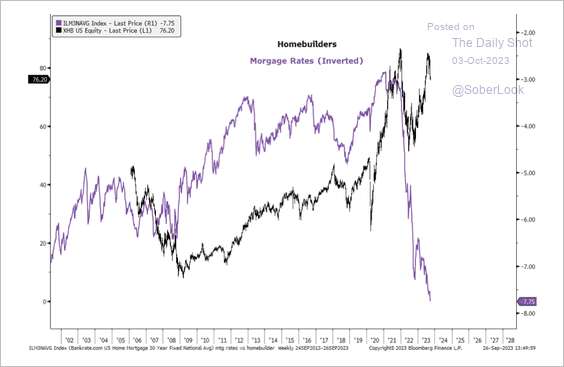 Source: Aazan Habib, Paradigm Capital
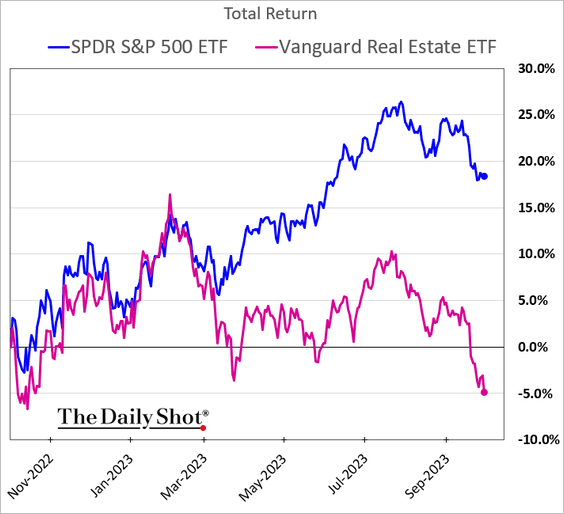
7. REITs are struggling as bond yields surge.
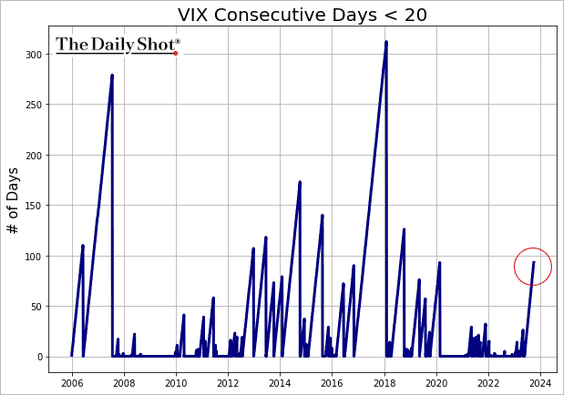
8. VIX has been below twenty for 93 trading sessions in a row.
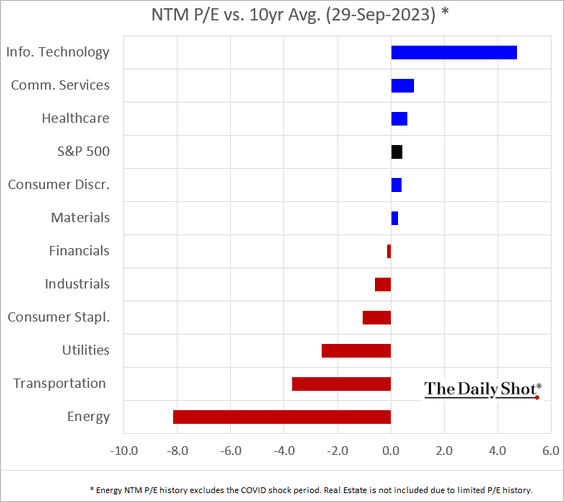
9. Next, let’s take a look at some valuation metrics.
• Sectors’ 12-month forward P/E vs. the 10-year average:
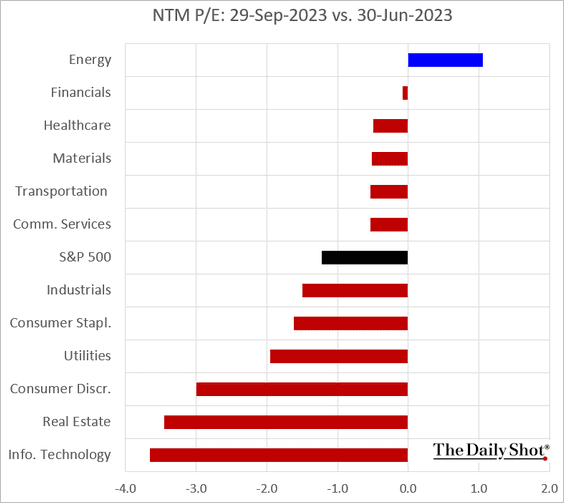
– Sector P/E changes during Q3:
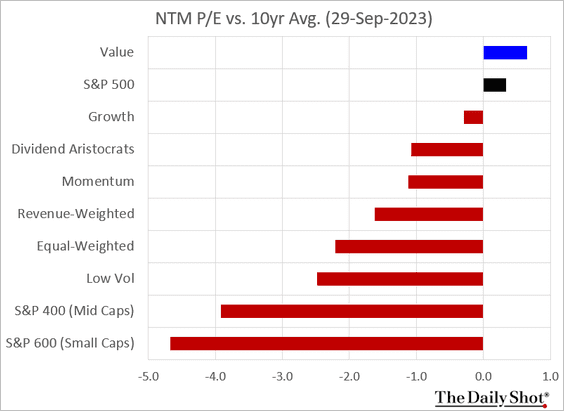
• Equity factors’ forward P/E vs. the 10-year average:
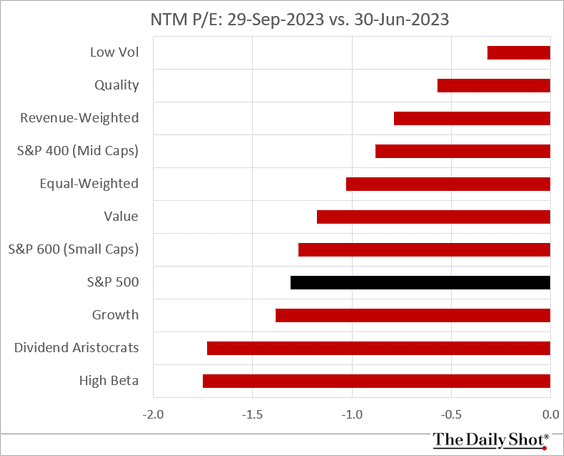
• Factor P/E changes during Q3:
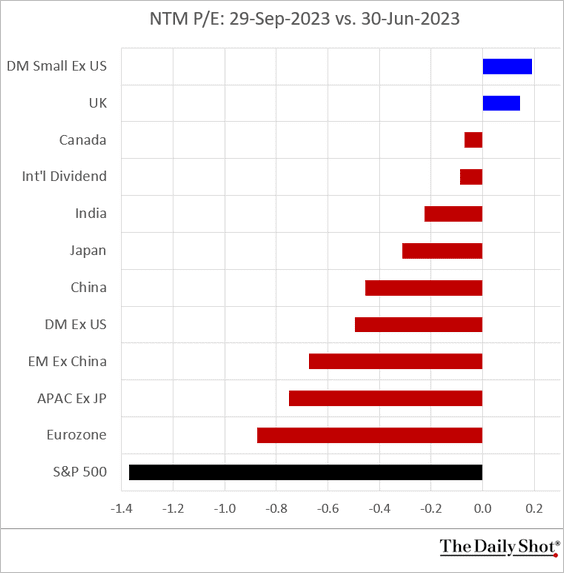
• Selected international indices’ 12-month forward P/E vs. the 10-year average:
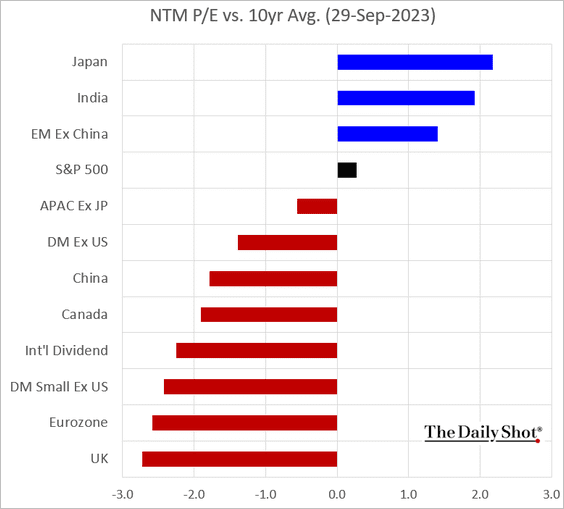
– P/E changes during Q3:
Back to Index
Credit
1. Here is a look at the high-yield debt maturity wall.
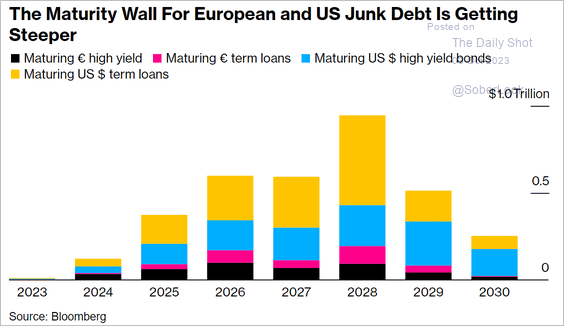 Source: @business Read full article
2. Yields on new-issue US junk bonds have crept higher over the past quarter. According to PitchBook, the primary market continues to re-engage with last month’s deal volume at the highest level since January 2022.
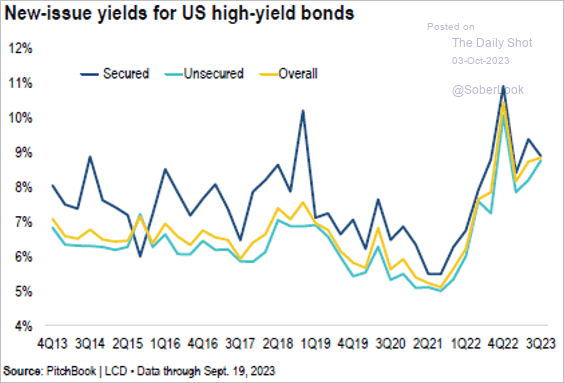 Source: PitchBook
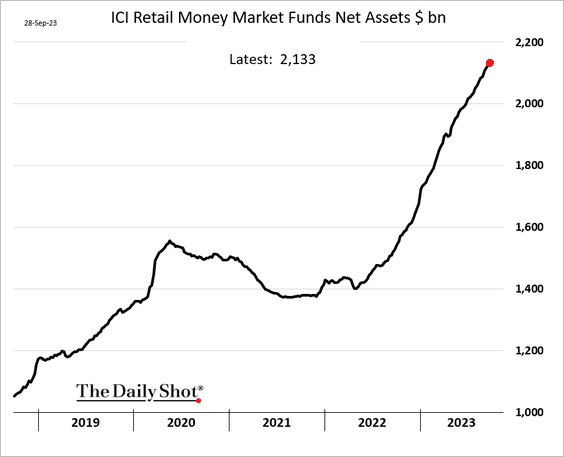
3. Retail money market funds continue to see inflows.
Back to Index
Rates
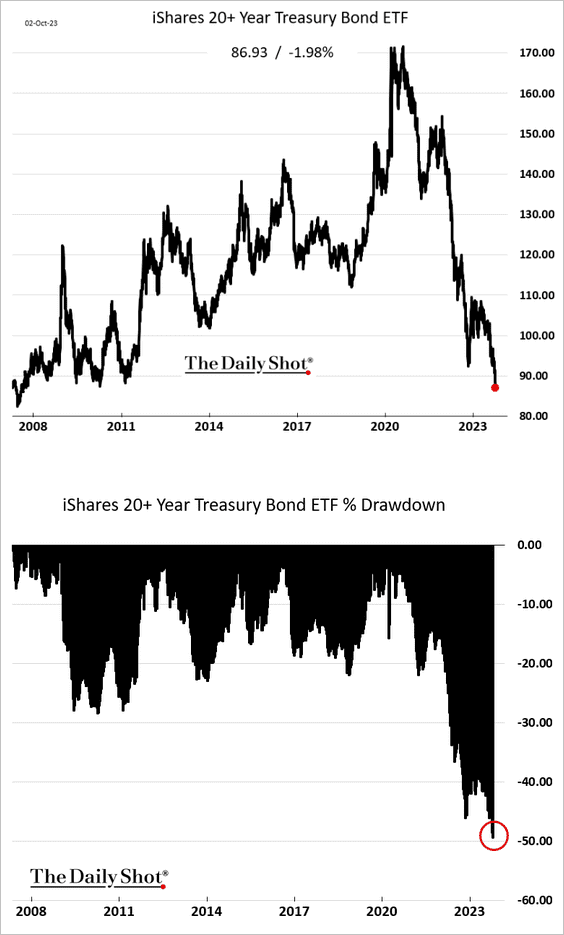
1. The rout in longer-dated Treasuries continues.
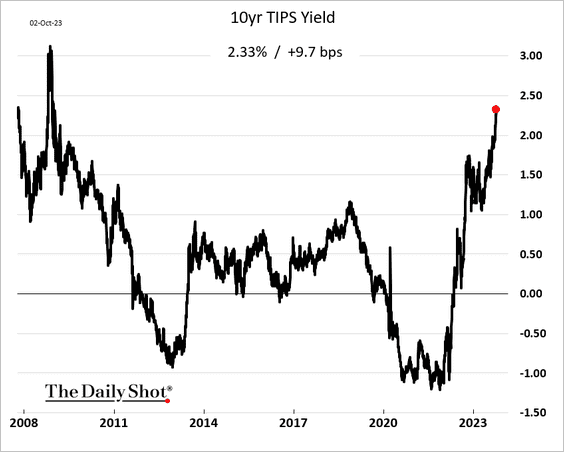
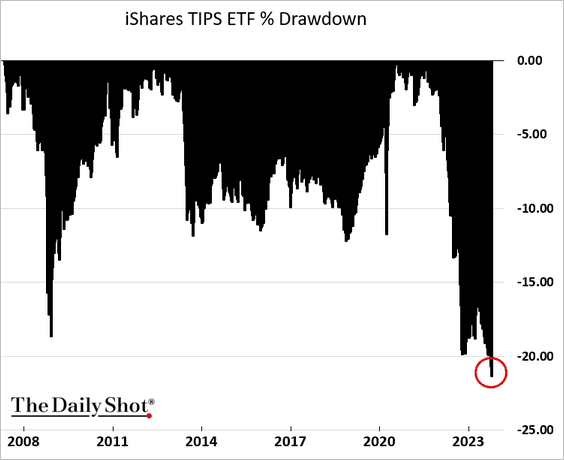
2. Real yields keep surging.
——————–
3. The divergence between Treasury yields and the copper-to-gold ratio is still growing.
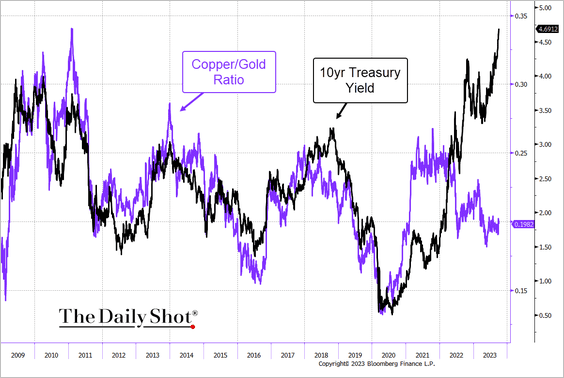 Source: @TheTerminal, Bloomberg Finance L.P.
4. Retail investors continue to buy Treasury ETFs.
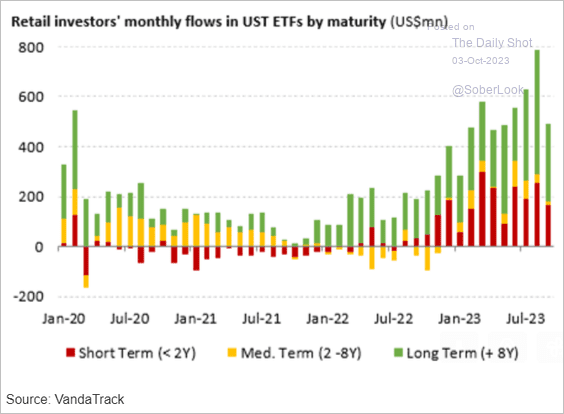 Source: Vanda Research
Back to Index
Global Developments
1. Oil prices recovered in Q3 as major equity indices and sovereign bonds declined.
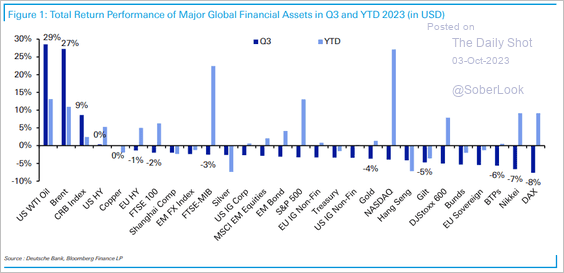 Source: Deutsche Bank Research
2. Here is a look at return projections by the end of 2025 from Capital Economics.
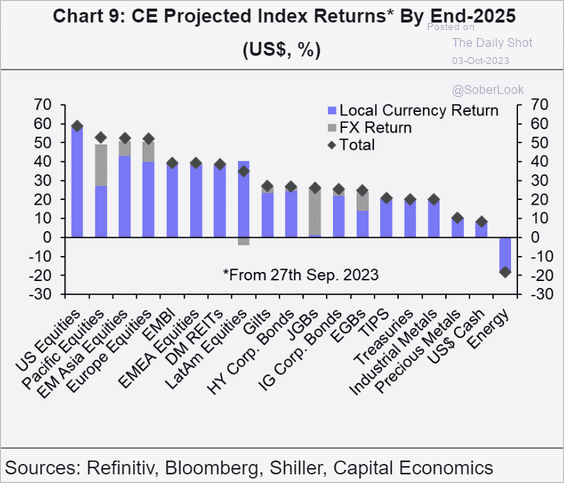 Source: Capital Economics
3. The rise in government interest expenses has been more pronounced in mature markets in recent months.
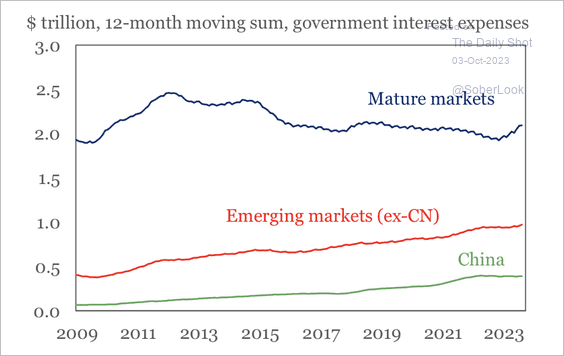 Source: IIF
——————–
Food for Thought
1. Preschool enrollment rates:
 Source: US Census Bureau
2. Largest metro populations globally:
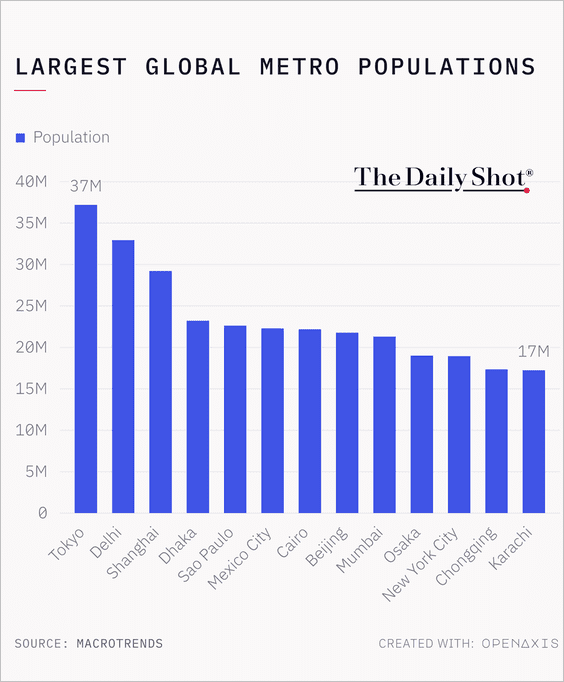 Source: @TheDailyShot
3. The G7 and BRICS:
 Source: Statista
4. Spending on regional conflicts:
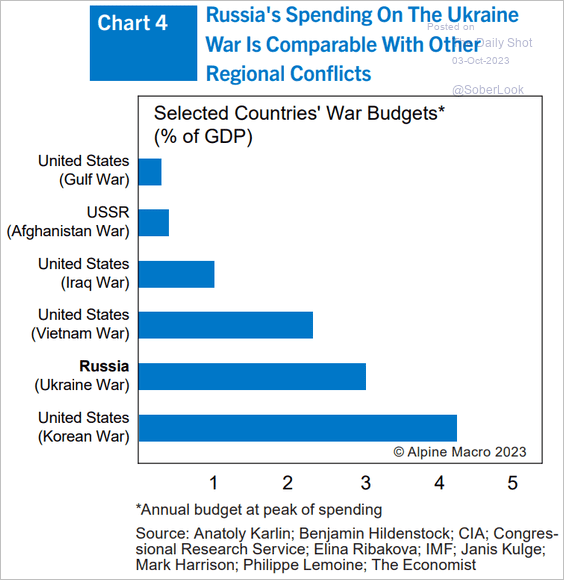 Source: Alpine Macro
5. How many Americans have access to legal marijuana?
 Source: Statista
6. Canada’s wildfire CO2 emissions:
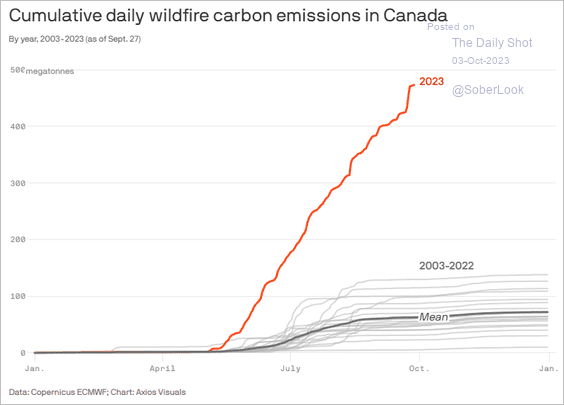 Source: @axios Read full article
7. Hate crime in the largest US cities:
 Source: @axios Read full article
8. Not at work due to a labor dispute:
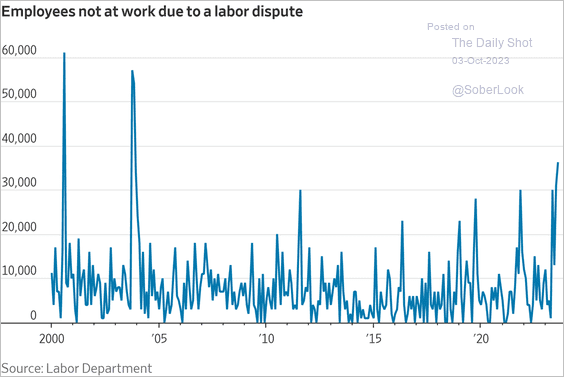 Source: @WSJ Read full article
9. Missing inventory:
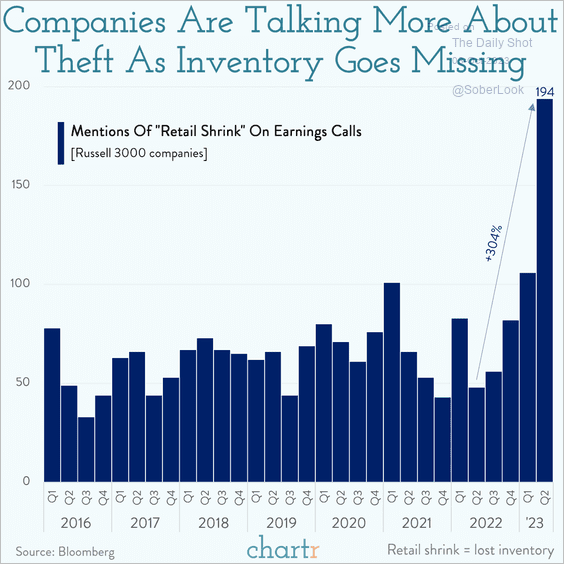 Source: @chartrdaily
——————–
Back to Index