
The Daily Shot: 09-Oct-23
• The United States
• Canada
• The United Kingdom
• The Eurozone
• Europe
• China
• Emerging Markets
• Commodities
• Energy
• Equities
• Credit
• Global Developments
• Food for Thought
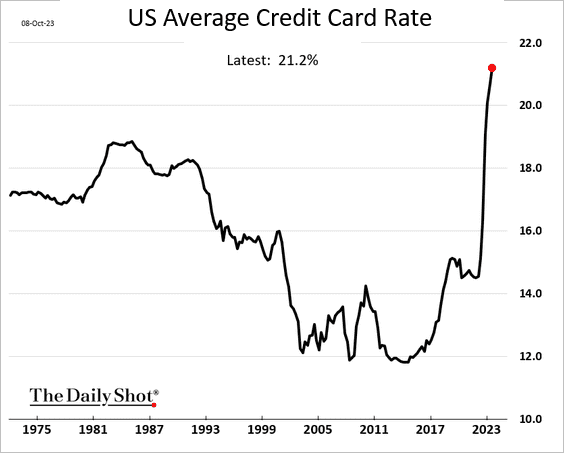
Updated: Fixed title on the credit card rate chart
The United States
1. The September jobs growth figure was almost double the expectations.
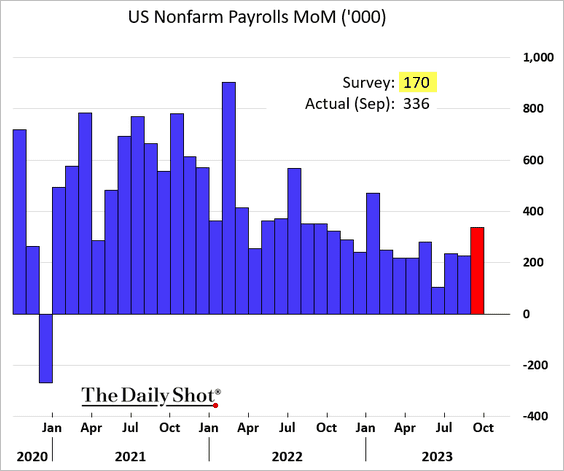
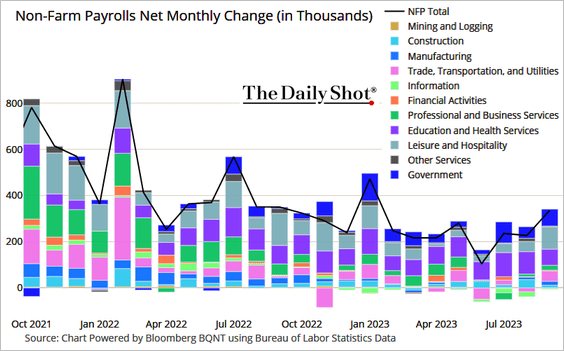
Gains were broad, with hotels and restaurants, logistics, retail, healthcare, business services, and government (mostly educators) all registering payroll increases.
 Source: @TheTerminal, Bloomberg Finance L.P.
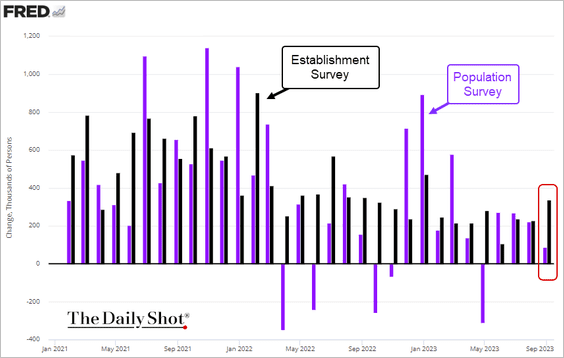
• The Population Survey showed only a modest gain, diverging from the Establishment Survey (above).
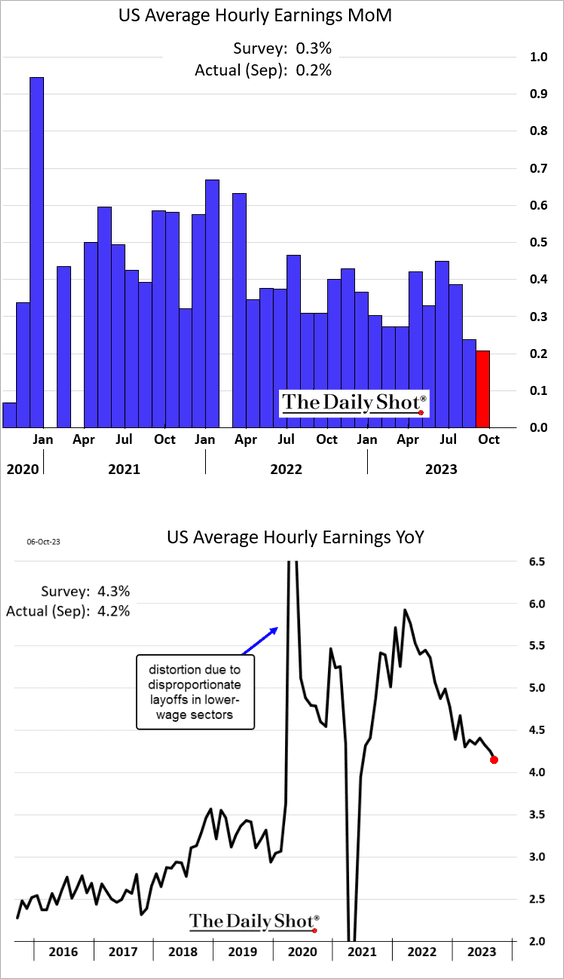
• Wage growth surprised to the downside.
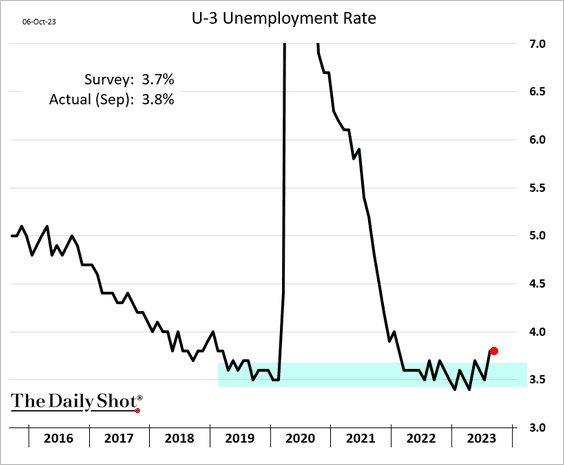
• The unemployment rate held steady, …
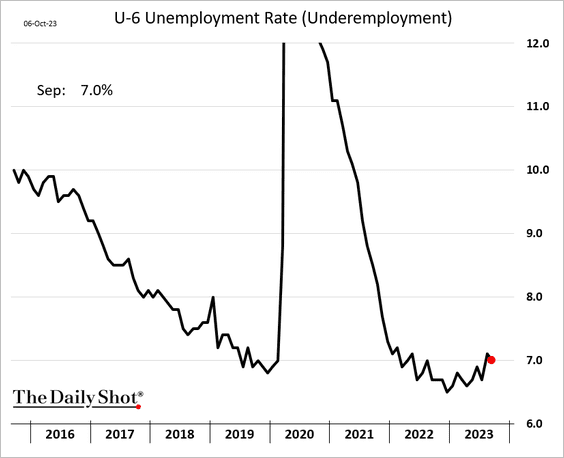
… and underemployment edged lower.
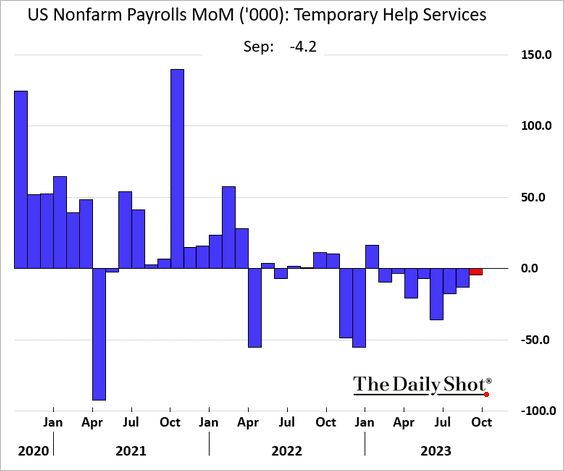
• The declines in temp services continued but at a slower pace.
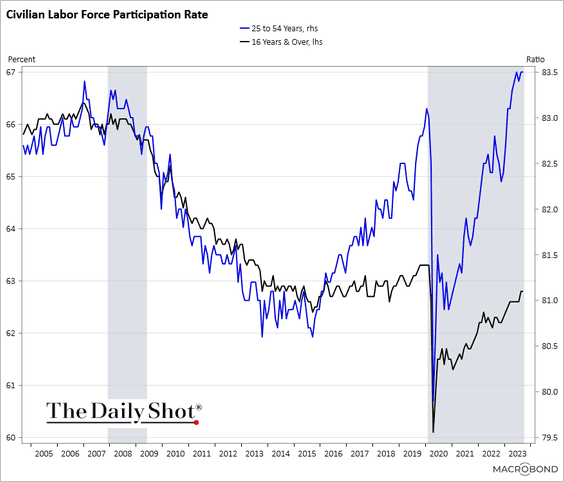
• Labor force participation held steady.
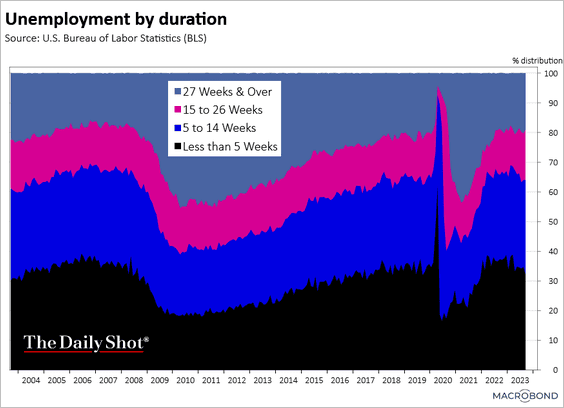
• Here is a look at unemployment by duration.
 Source: Chart and data provided by Macrobond
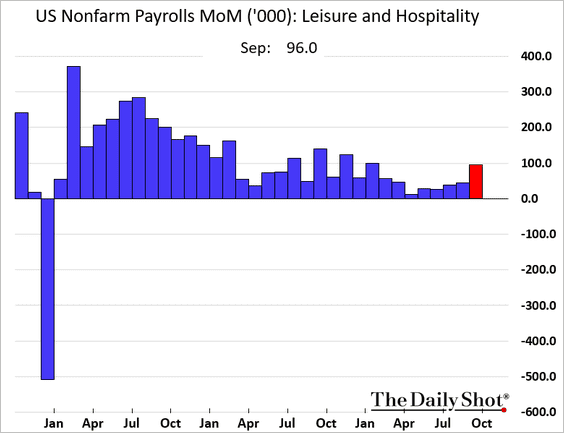
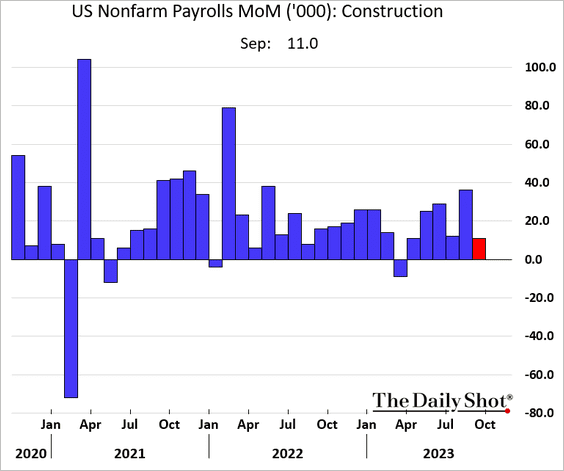
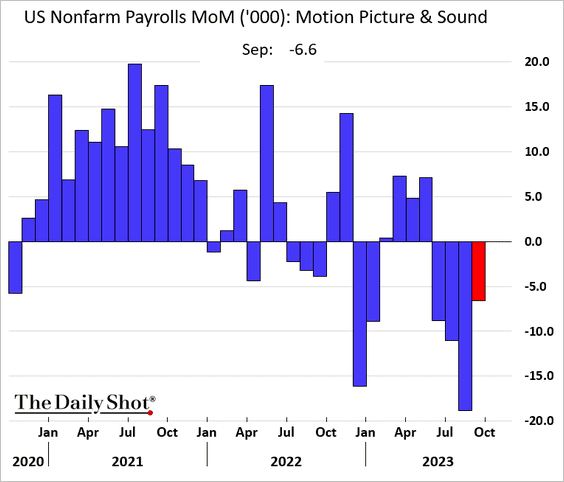
• Next, we have the monthly trends for select sectors.
– Leisure & Hospitality (biggest gain since January):
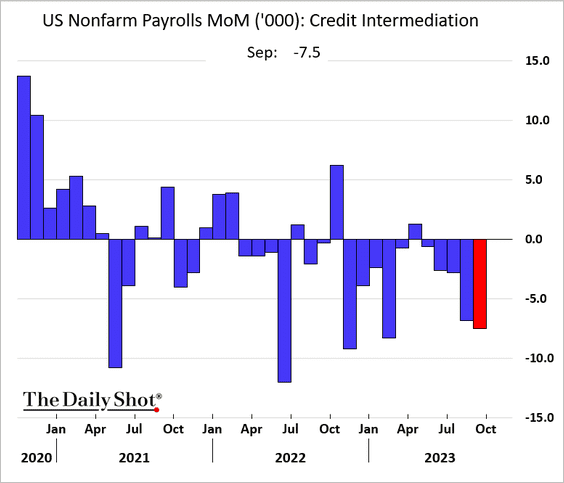
– Banks (lenders continue to reduce staff):
– Construction (resilient):
– The film industry (layoffs continued last month):
——————–
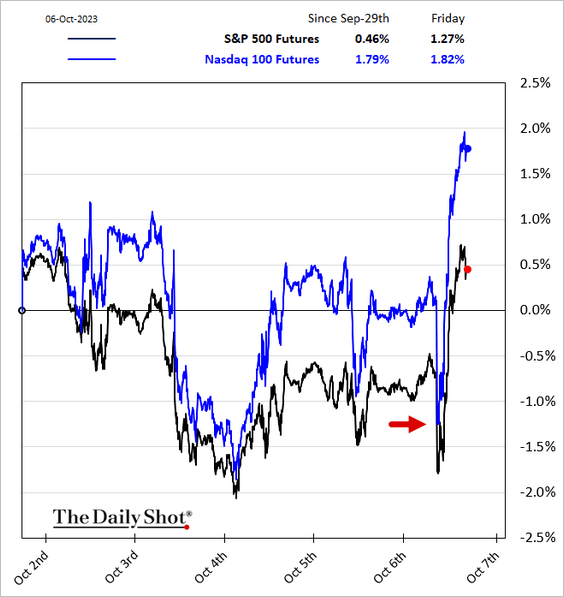
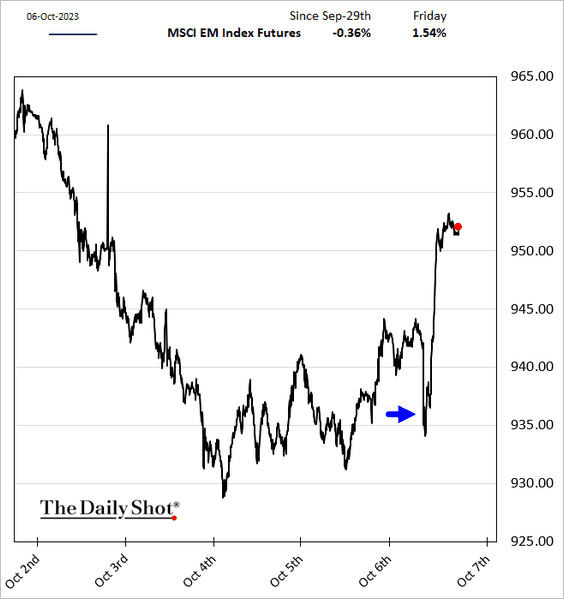
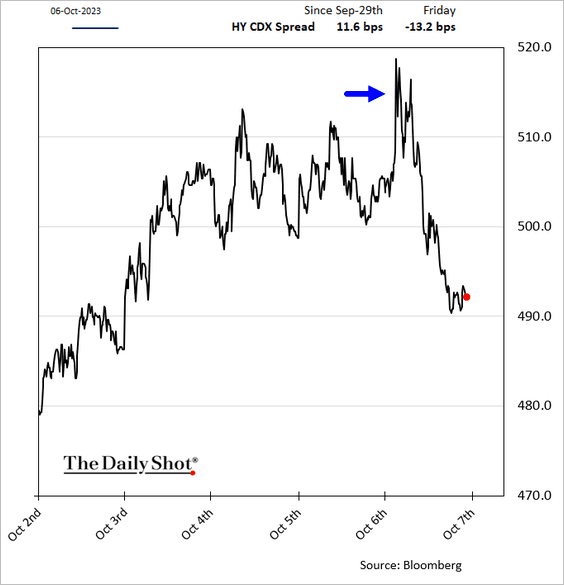
2. Risk assets sold off initially but then took solace in slowing wage growth. However, all bets are off with escalating violence in the Middle East.
– Stocks:
– EM equities:
– Credit spreads:
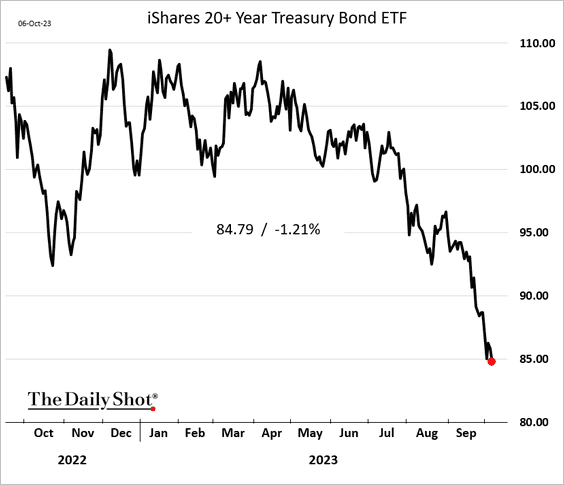
• Treasury yields managed to hit new highs (4 charts), …
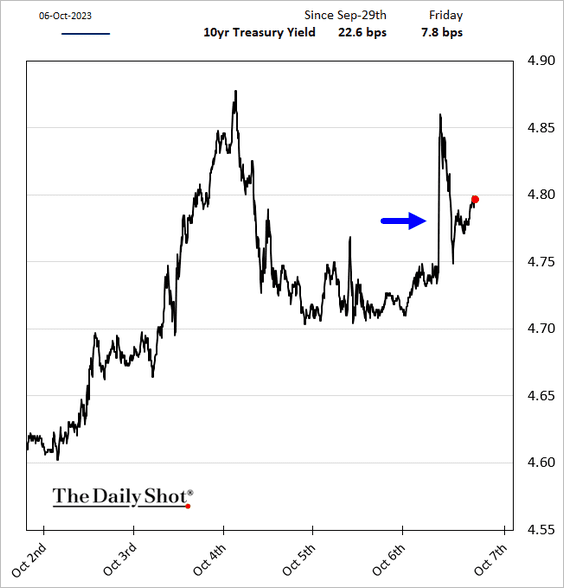
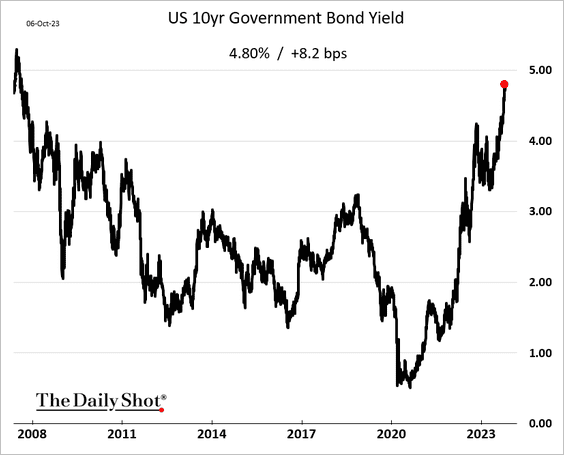
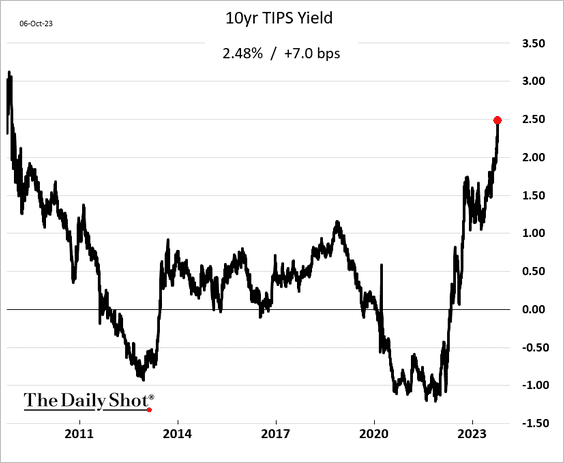
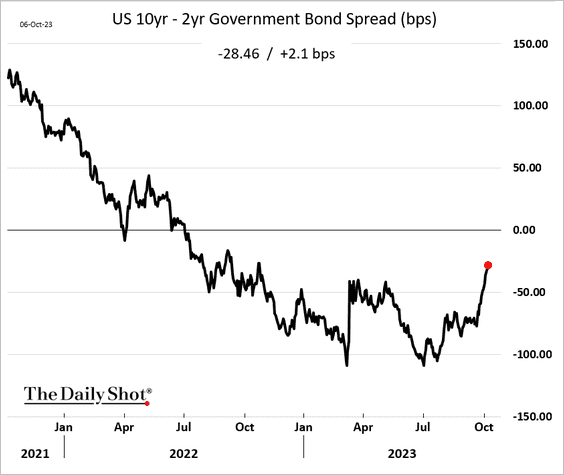
… and the yield curve steepened further.
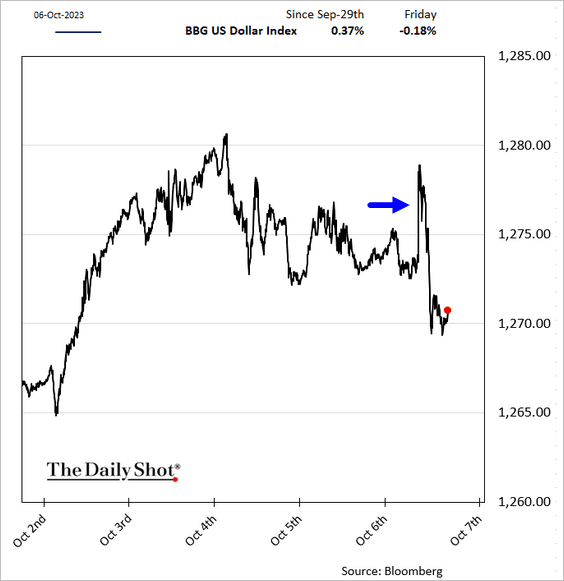
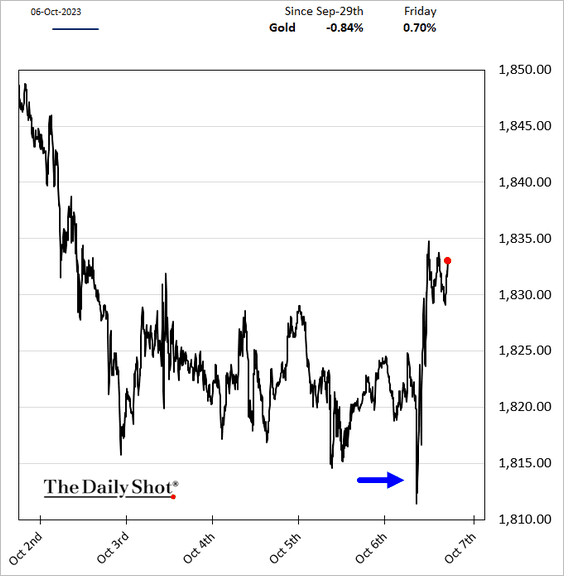
• The dollar declined, boosting gold.
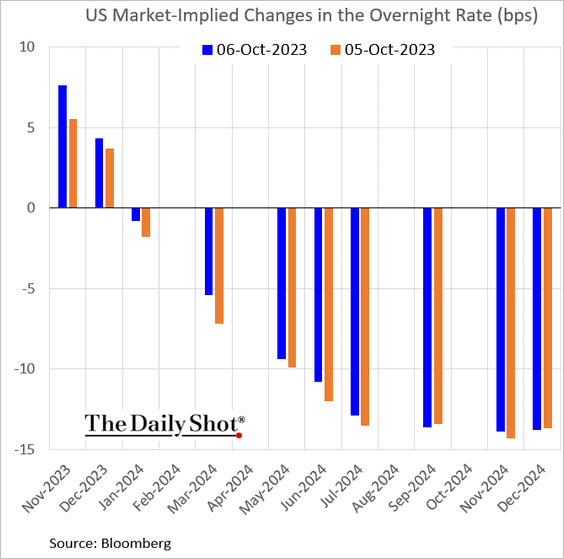
• The market still sees about a 50% chance of another Fed rate hike.
——————–
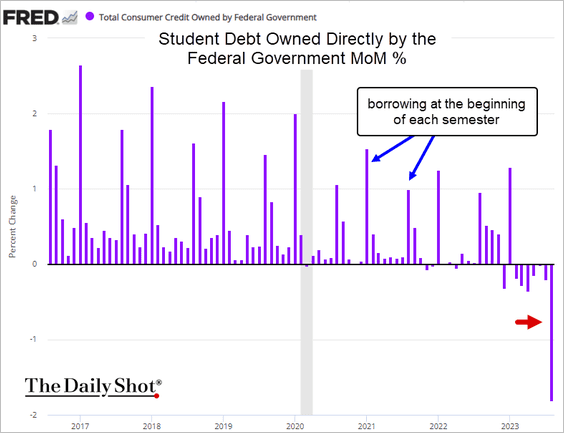
3. Consumer credit tumbled in August, …
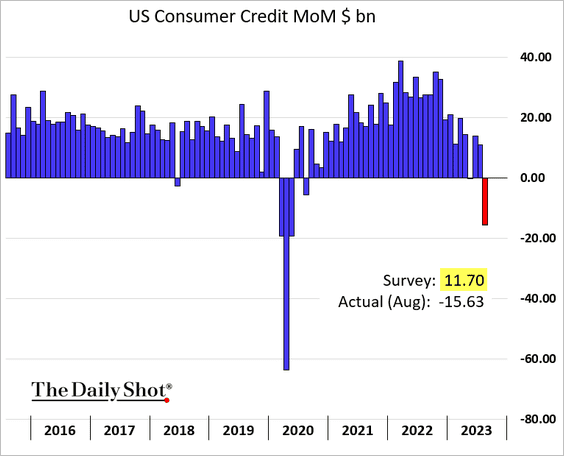
… as borrowers paid down some of their student debt.
 Source: MarketWatch Read full article
• Credit card balances continued to climb, …
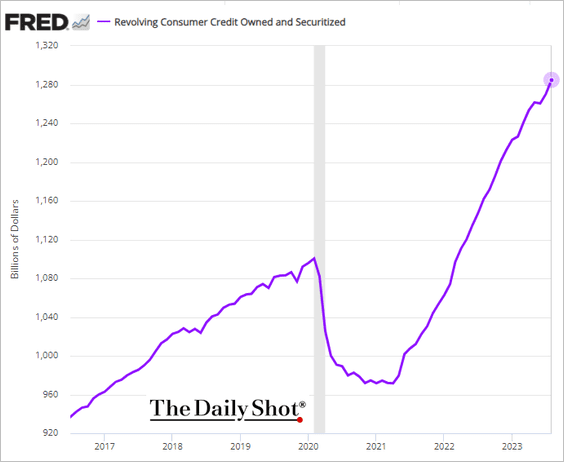
… despite record rates.
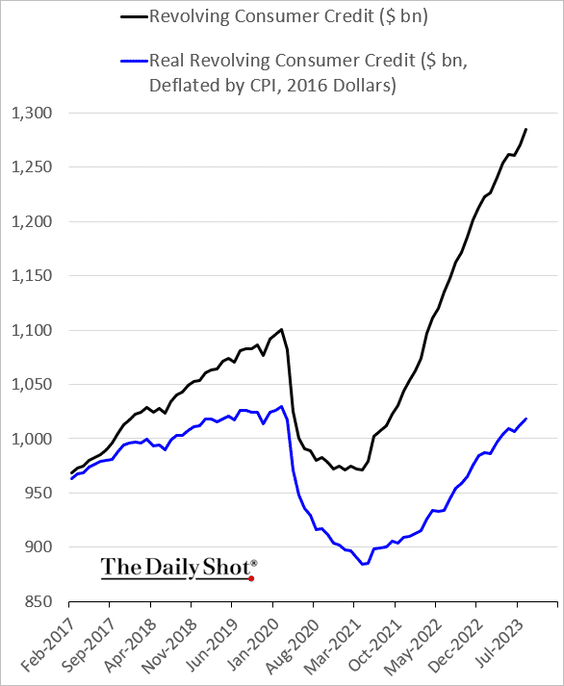
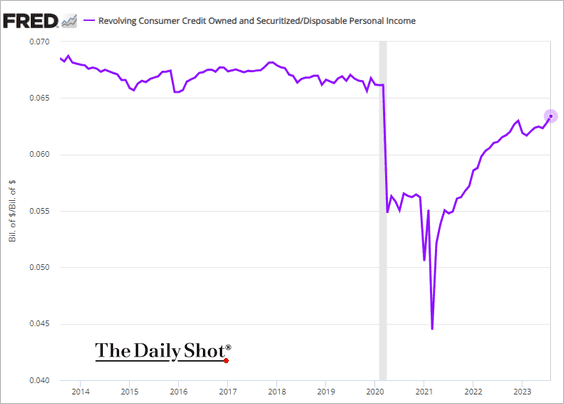
Below are a couple of additional charts on credit card debt.
• Inflation-adjusted credit card loan balances:
• Credit card debt as a share of disposable personal income:
——————–
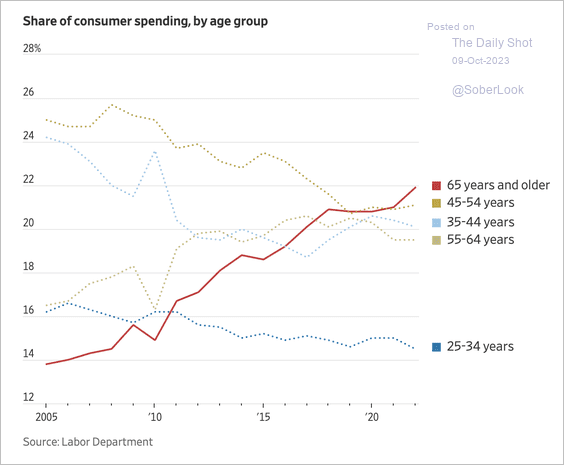
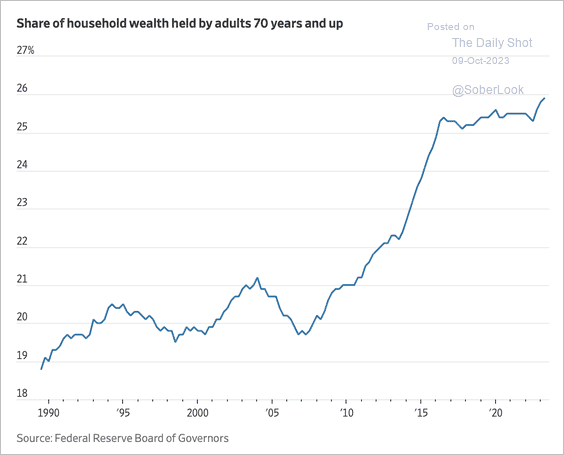
4. Older consumers account for a growing share of total spending and total household wealth. (2 charts)
 Source: @WSJ Read full article
 Source: @WSJ Read full article
Back to Index
Canada
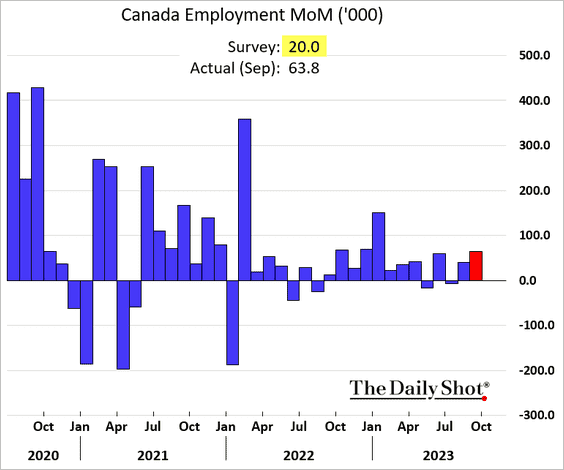
1. Canada’s September employment report also topped expectations.
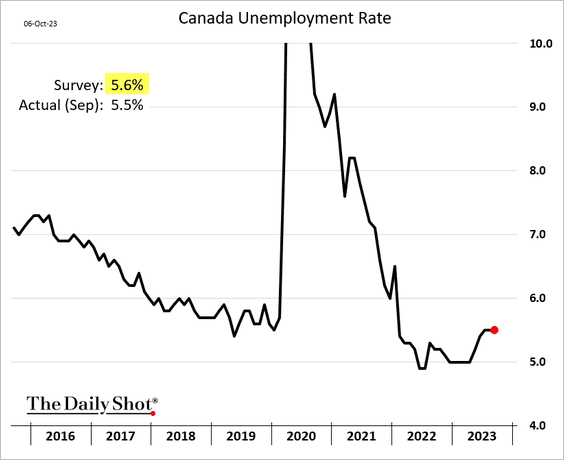
• The unemployment rate held steady.
• Wages surprised to the upside.
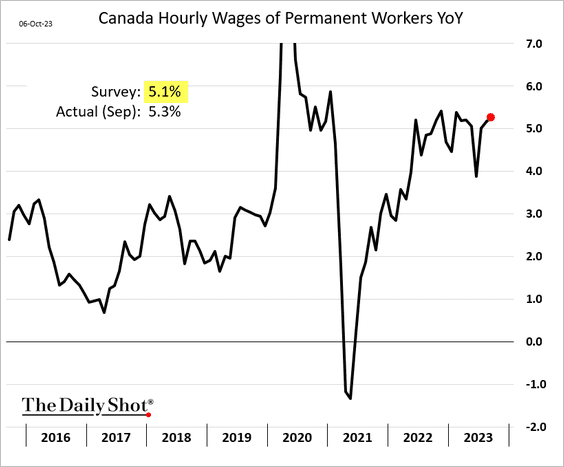
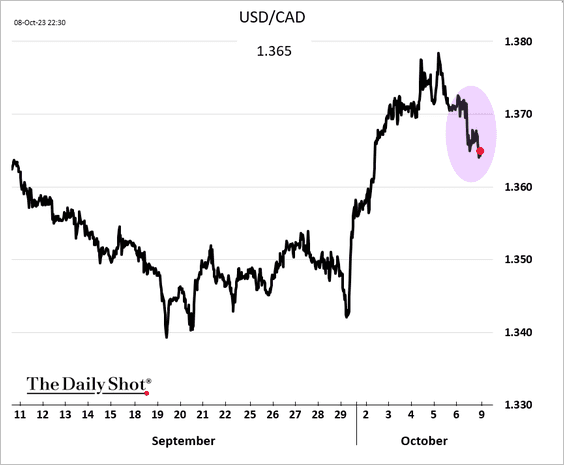
2. The probability of a BoC rate hike this month jumped after the wage growth surprise.
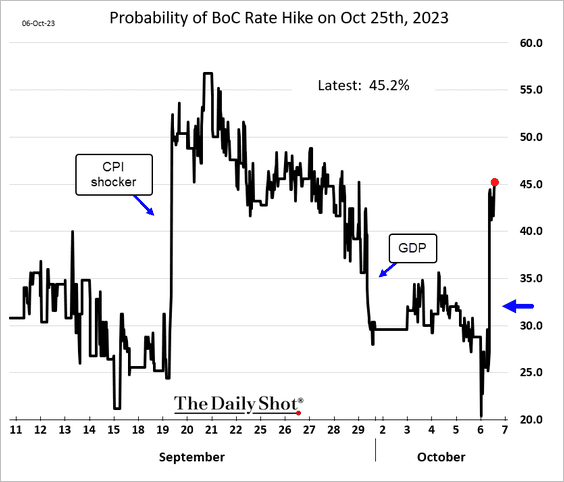
The loonie strengthened vs USD.
Back to Index
The United Kingdom
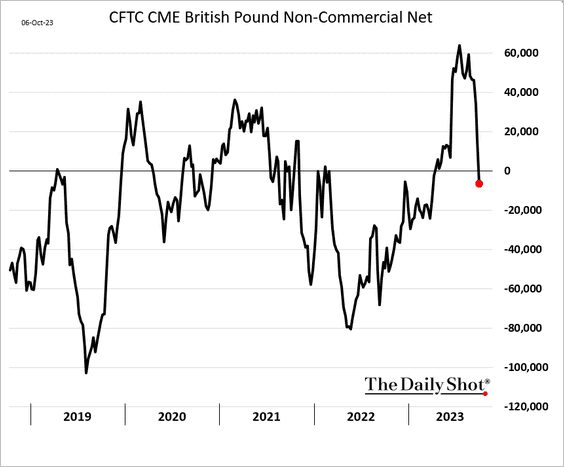
1. Traders turned bearish on the pound last week.
2. With pension liabilities discounted at much higher rates, assets as a share of liabilities climbed further in recent months.
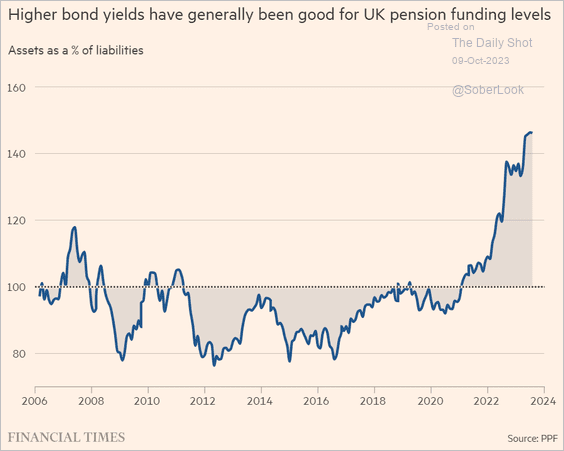 Source: @financialtimes Read full article
Back to Index
The Eurozone
1. Germany’s factory orders increased in August.
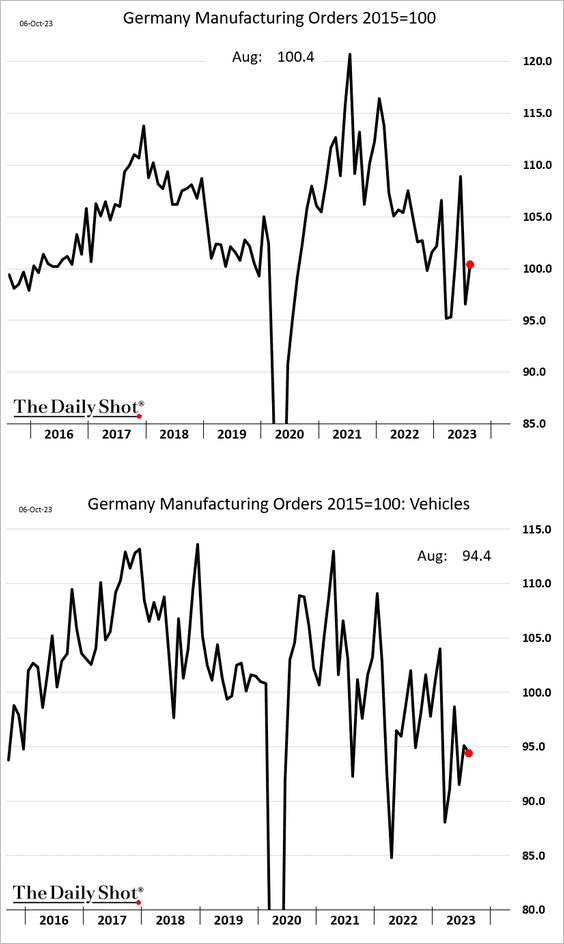
 Source: @economics Read full article
– Industrial production declined. However, manufacturing output (2nd panel) showed a modest increase.
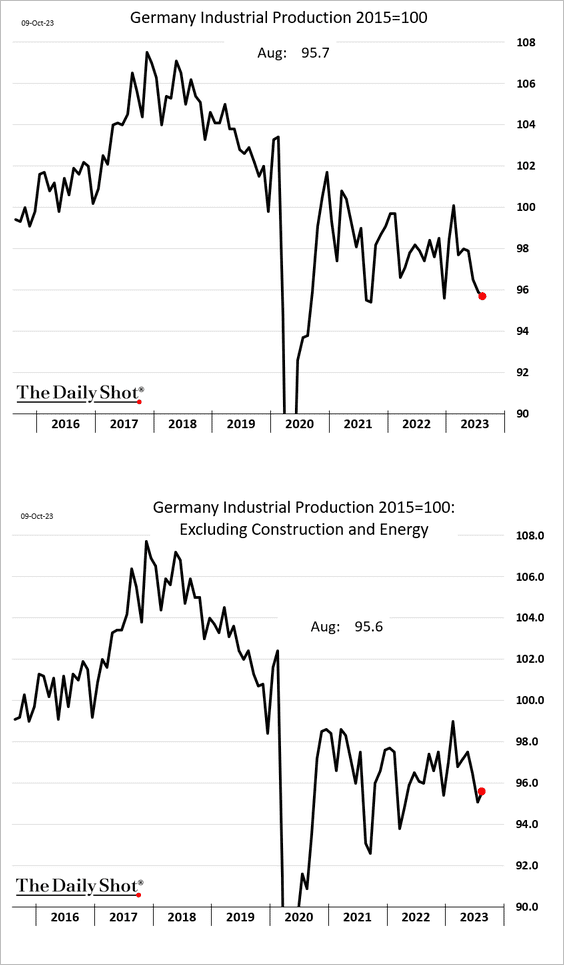
 Source: @WSJ Read full article
• The German economy has lost momentum relative to the broader Eurozone.
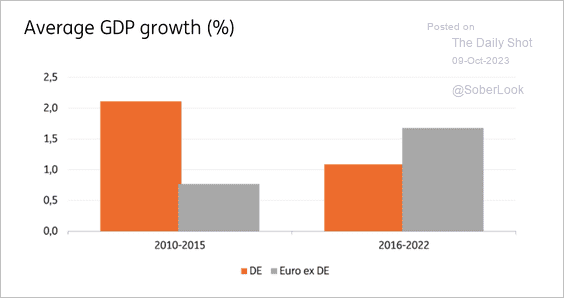 Source: ING
——————–
2. Depositors have been shifting to longer-term (and higher-yielding) money market products.
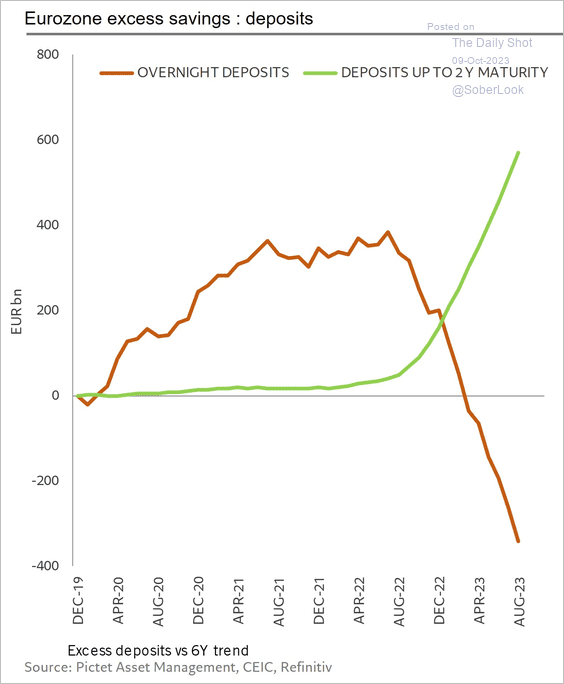 Source: @skhanniche
Back to Index
Europe
1. Here is a look at home prices and rents in the EU.
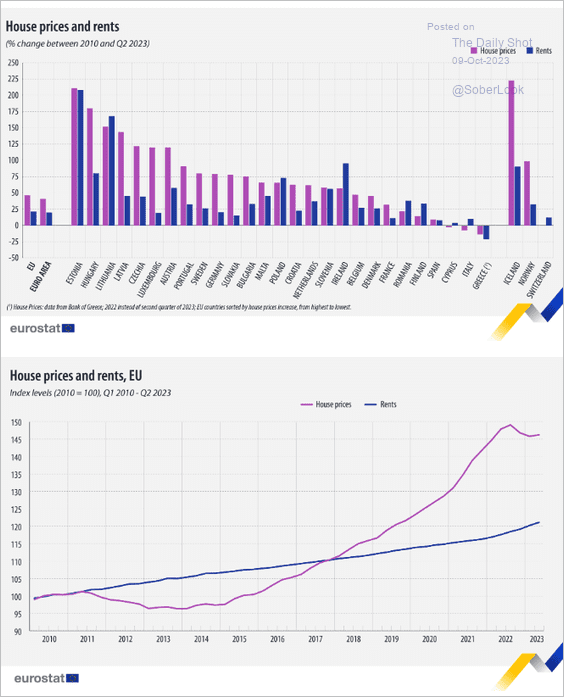 Source: Eurostat Read full article
Home prices are down on a year-over-year basis for the first time in a decade.
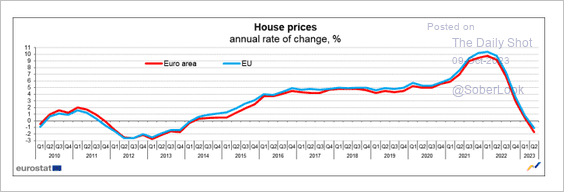 Source: Eurostat Read full article
——————–
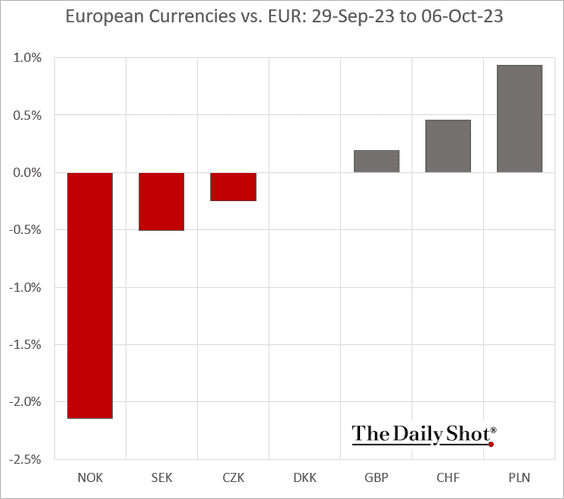
2. Here is a look at how European currencies fared against the euro last week.
3. The graphic below provides an overview of tourism in Europe.
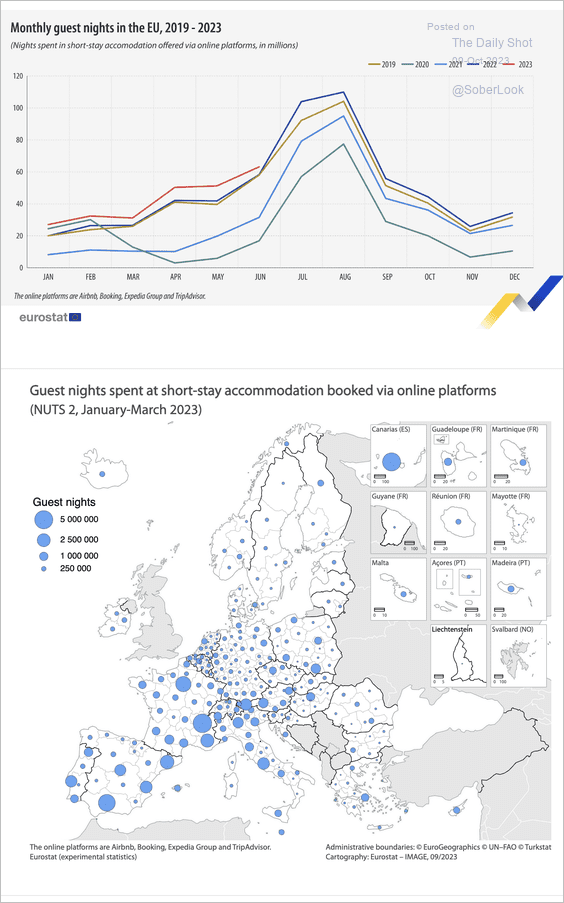 Source: Eurostat Read full article
Back to Index
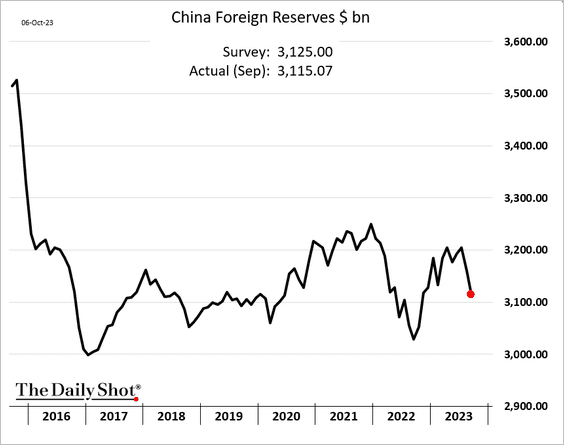
China
1. China’s FX reserves declined again.
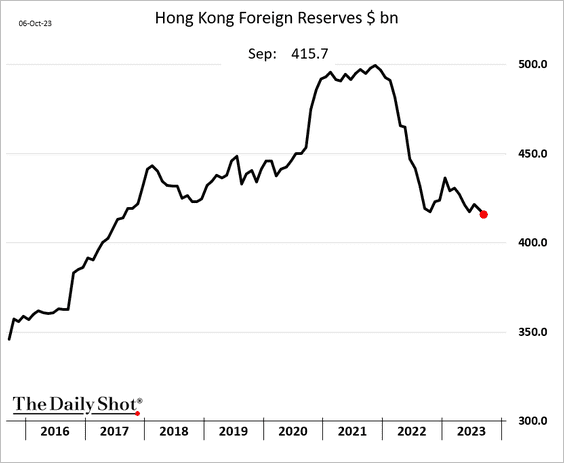
Hong Kong’s FX reserves continue to fall.
——————–
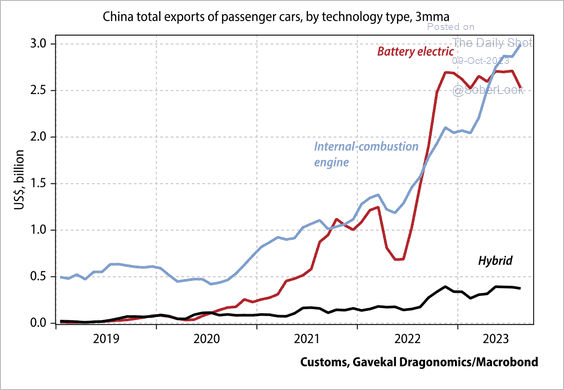
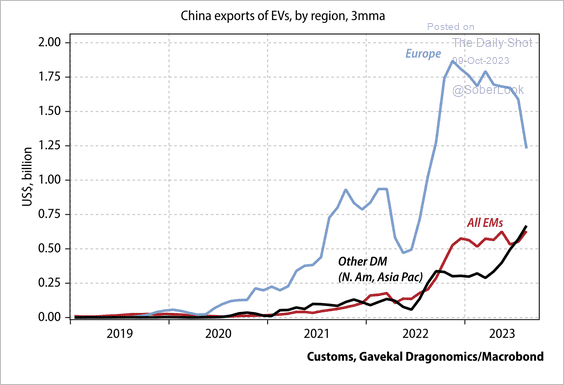
2. EV exports are booming, but so are exports of cars with internal combustion engines.
 Source: Gavekal Research
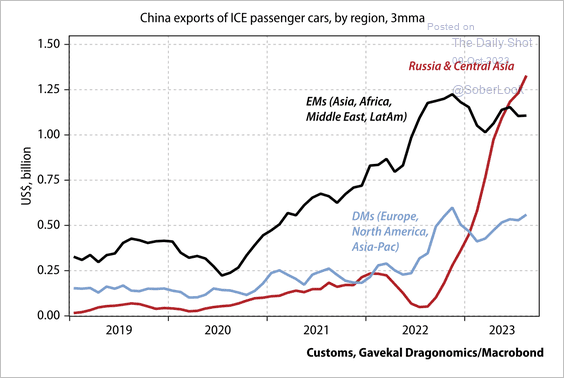
• Russia has emerged as a significant buyer of Chinese internal combustion engine vehicles (ICE) since sanctions blocked access to Western imported goods.
 Source: Gavekal Research
• EV exports to markets outside of Europe are small but picking up.
 Source: Gavekal Research
Back to Index
Emerging Markets
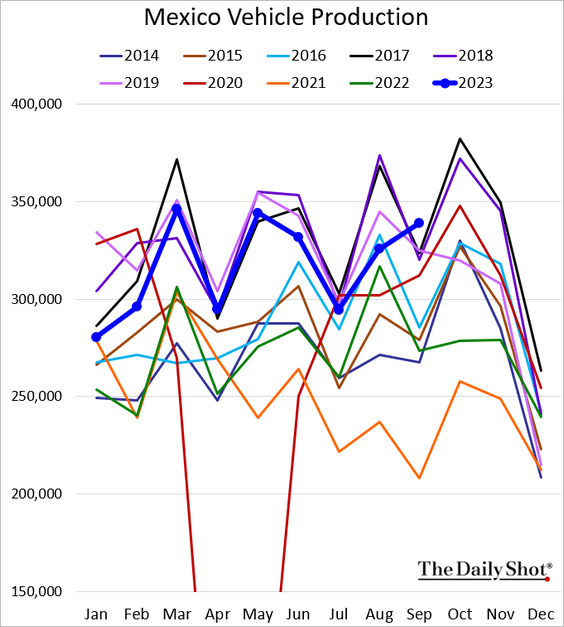
1. Mexico’s vehicle production hit a multi-year high for this time of the year.
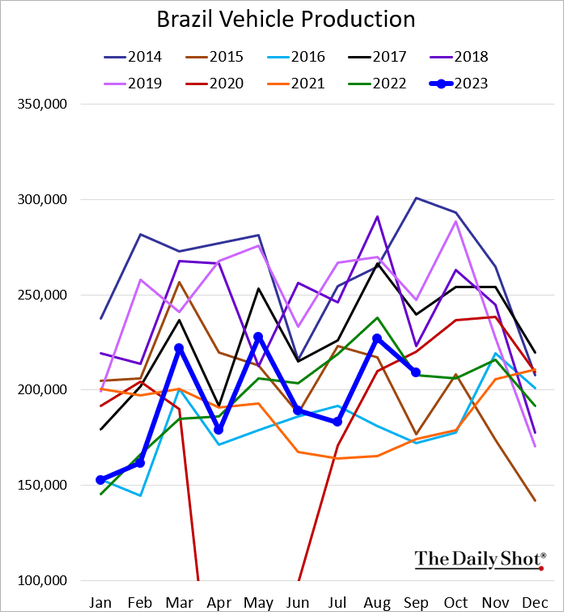
2. Brazil’s vehicle production is now in line with last year’s levels.
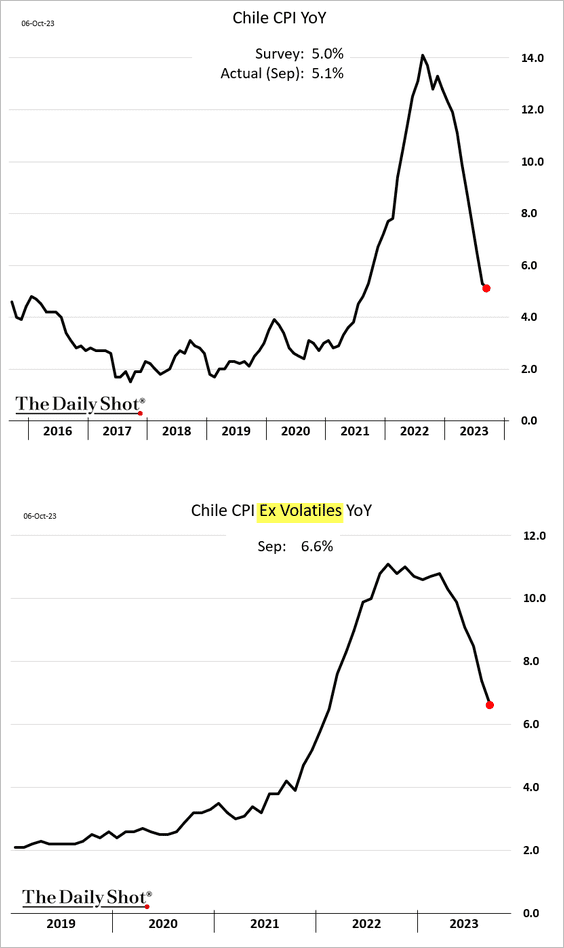
3. Chile’s core inflation is easing rapidly.
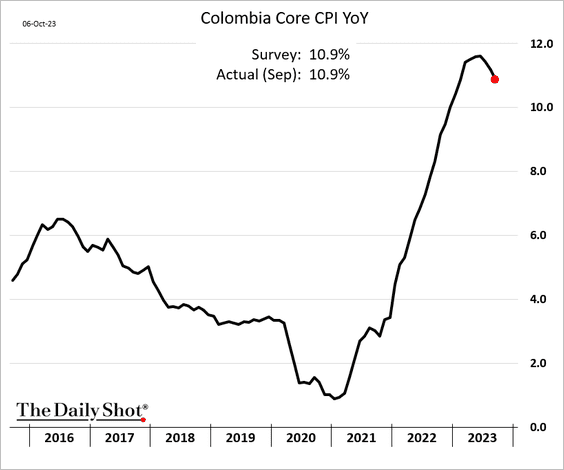
4. Colombia’s core CPI has finally peaked.
——————–
5. India’s bond yields surged as the RBI announced bond sales.
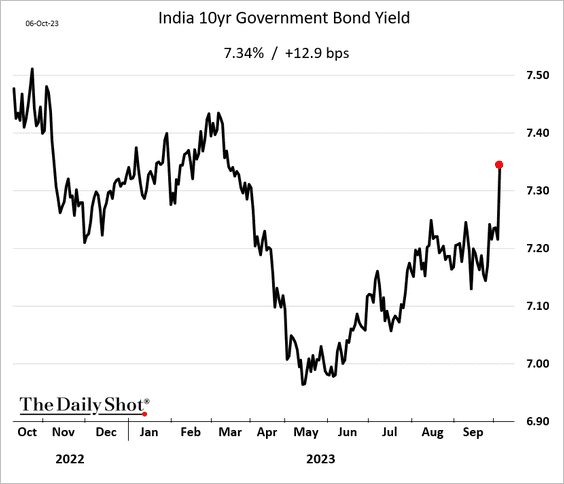
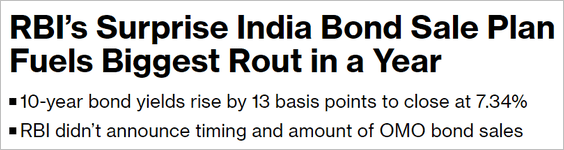 Source: @markets Read full article
——————–
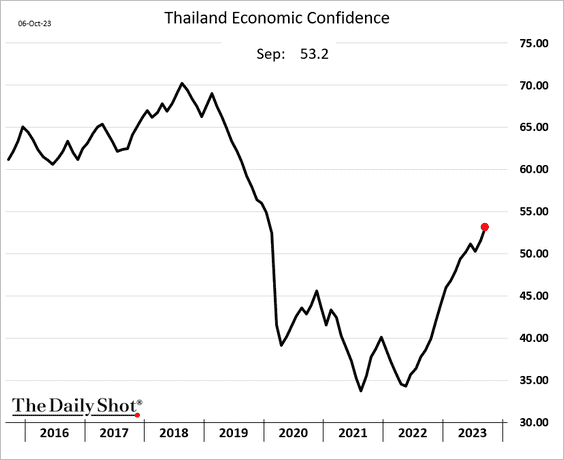
6. Thai economic confidence continues to recover.
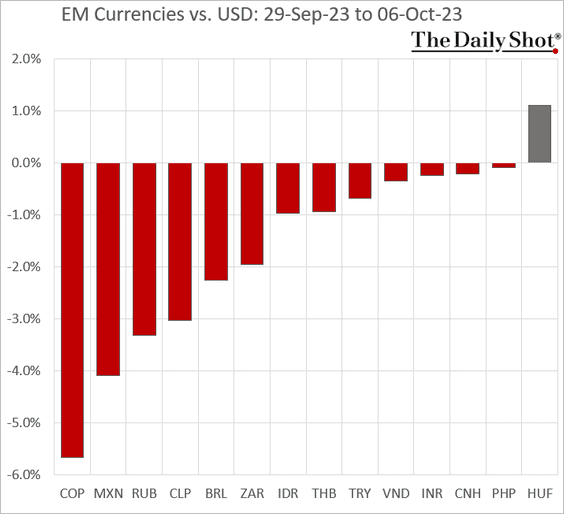
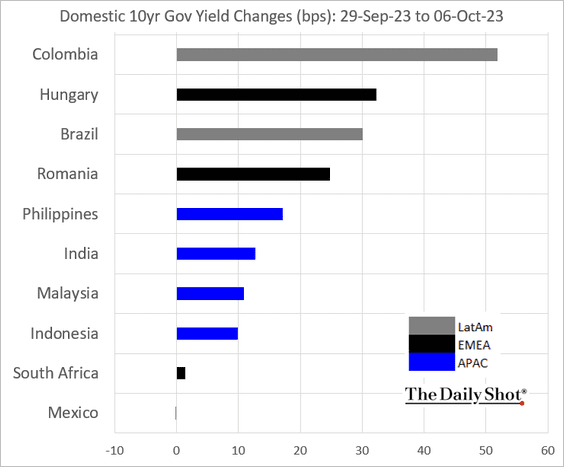
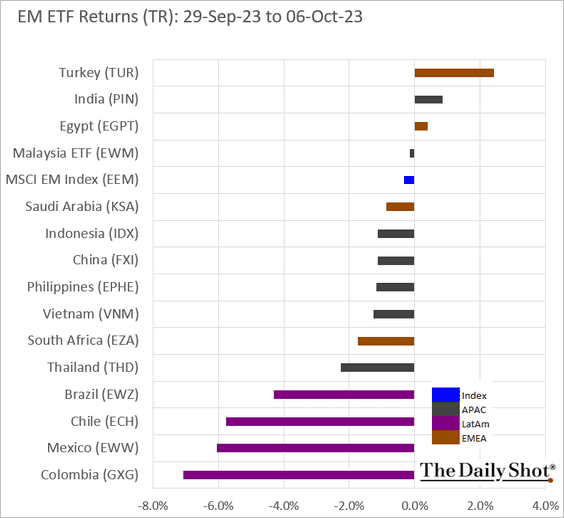
7. Next, let’s take a look at last week’s performance.
• Currencies:
• Bond yields:
• Equity ETFs:
Back to Index
Commodities
1. Gold appears oversold.
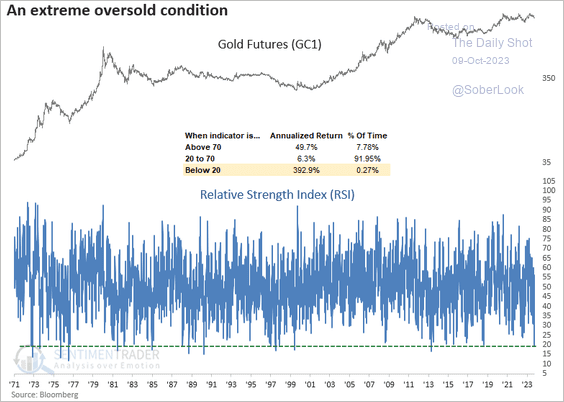 Source: SentimenTrader
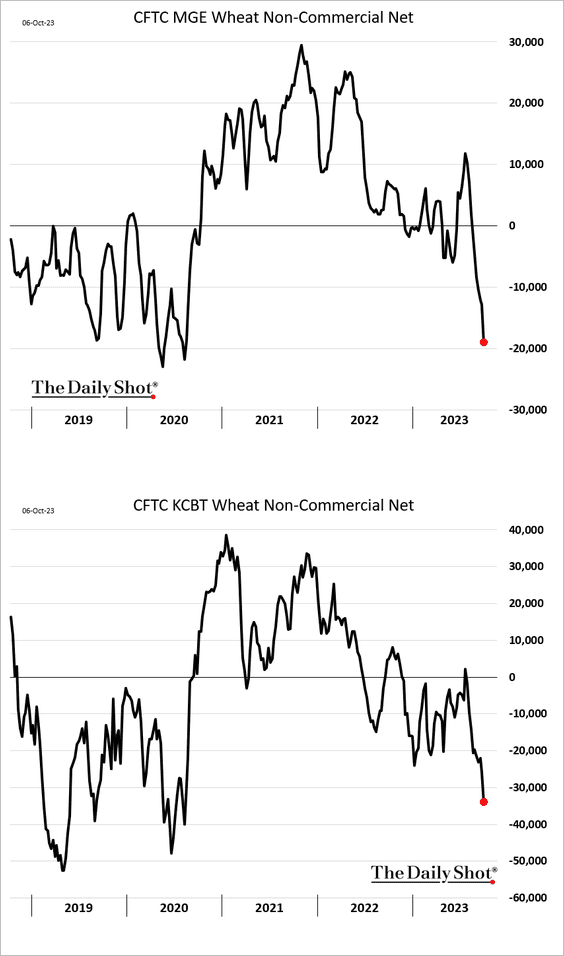
2. Speculative accounts sharply reduced their bets on soybean meal, …
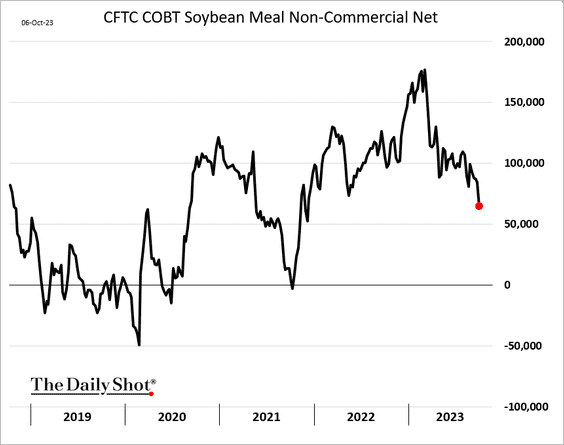
… and boosted bets against wheat.
——————–
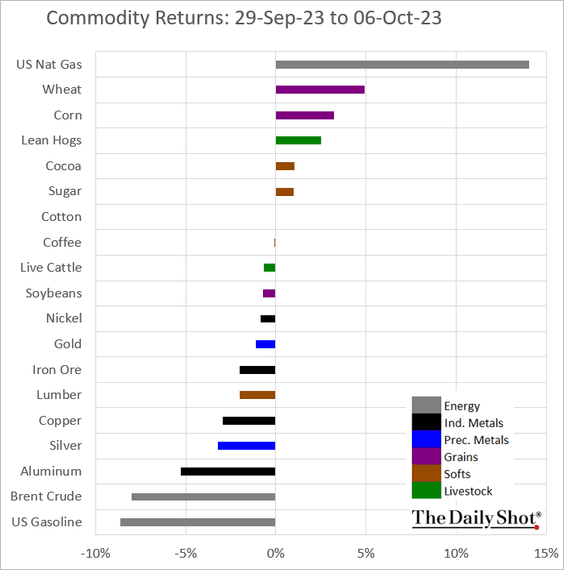
3. Here is a look at last week’s performance across commodity markets.
Back to Index
Energy
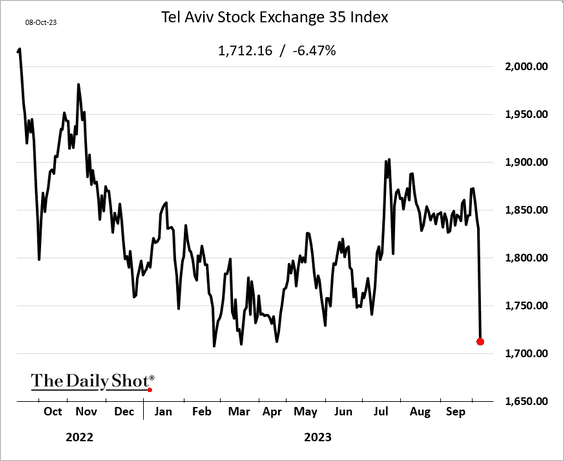
1. Oil futures jumped in response to escalating violence in the Middle East.
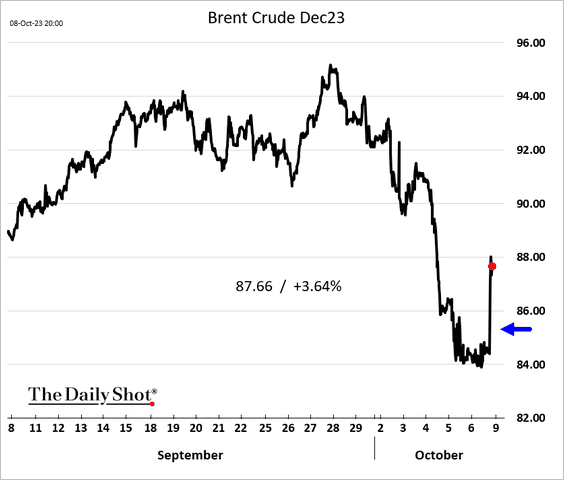
 Source: @WSJ Read full article
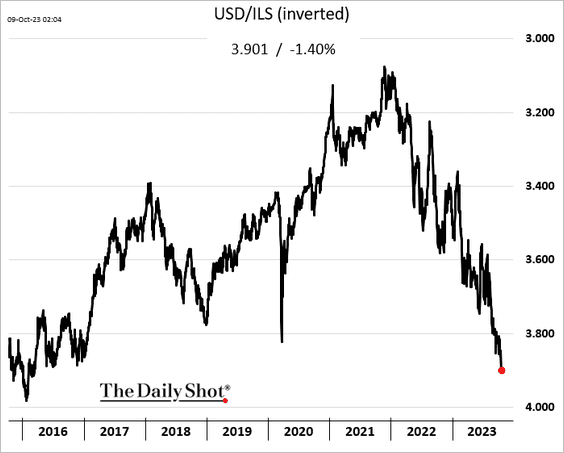
• Israeli and other Middle East shares tumbled, and the shekel hit a multi-year low.
——————–
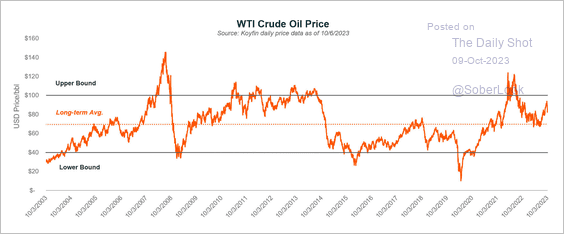
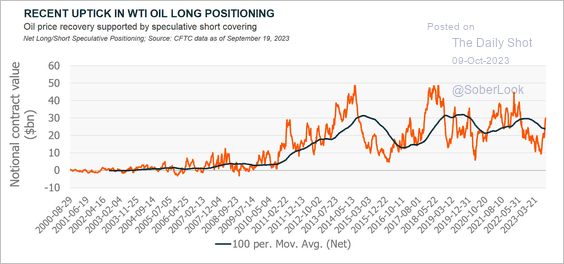
2. WTI crude oil approached the upper bound of its long-term price range. However, speculative short covering is not yet extreme, which could stabilize the recent price drop, especially given geopolitical risk. (2 charts)
 Source: Damanick Dantes; Global X ETFs
 Source: Damanick Dantes; Global X ETFs
——————–
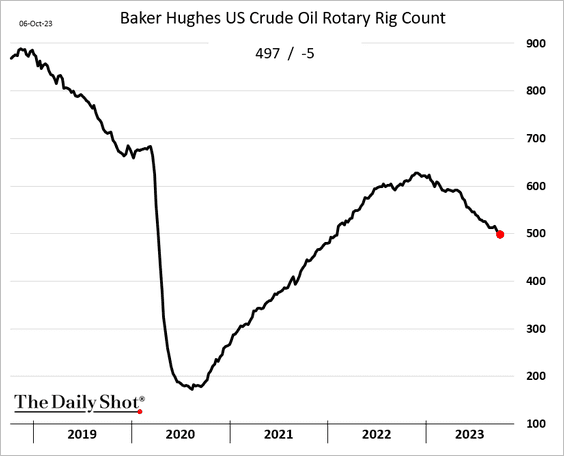
3. The US oil rig count dipped below 500 for the first time since 2021.
4. Saudi Arabia’s oil production continues to decline.
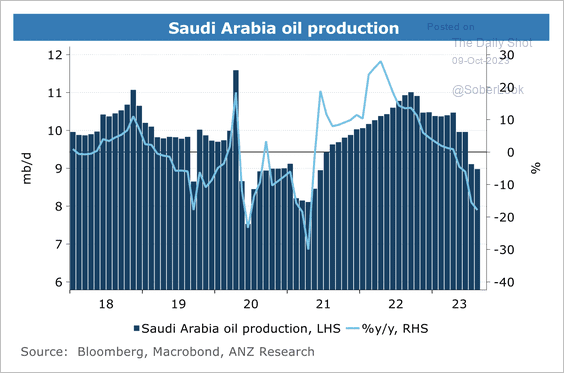 Source: @ANZ_Research
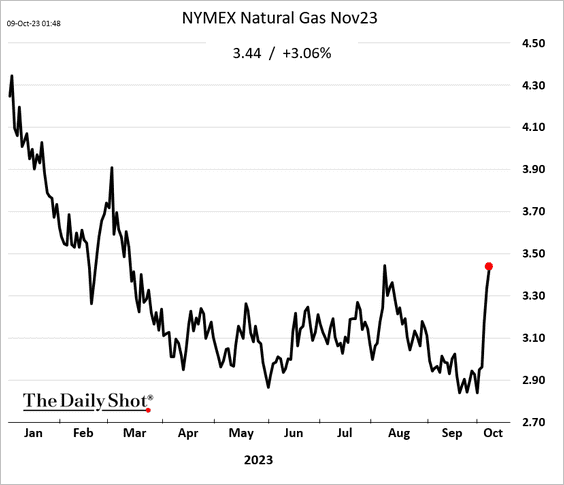
5. US natural gas futures are still rising.
Back to Index
Equities
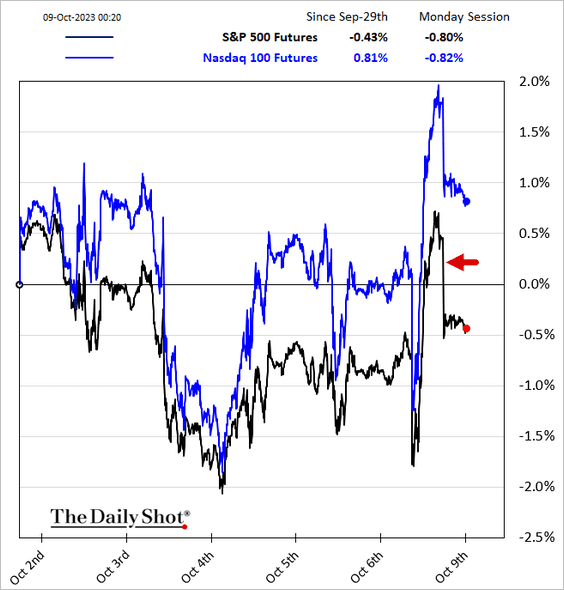
1. The S&P 500 held support as US wage growth slowed.
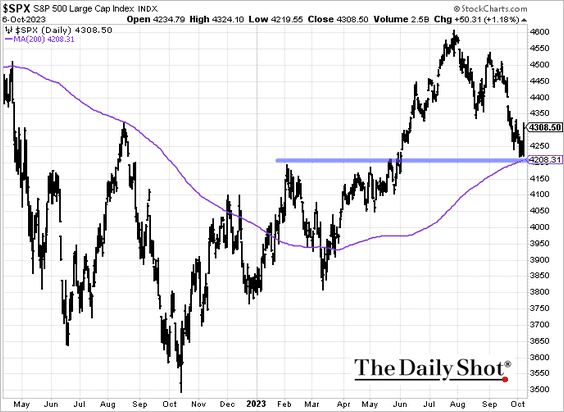
But futures are lower due to the events in the Middle East.
——————–
2. S&P 500 breadth sharply deteriorated over the past two months, which typically precede market recoveries.
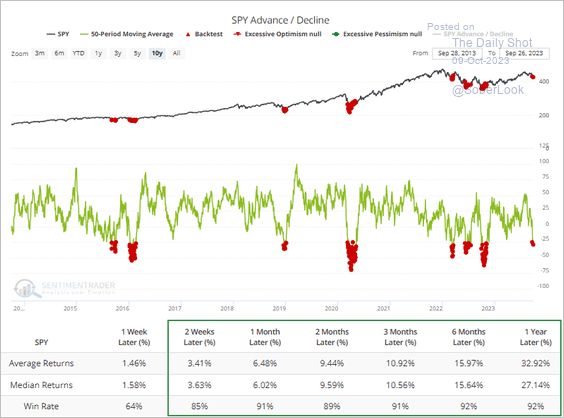 Source: SentimenTrader
3. The S&P 500 concentration is at the highest level since the dot-com bubble.
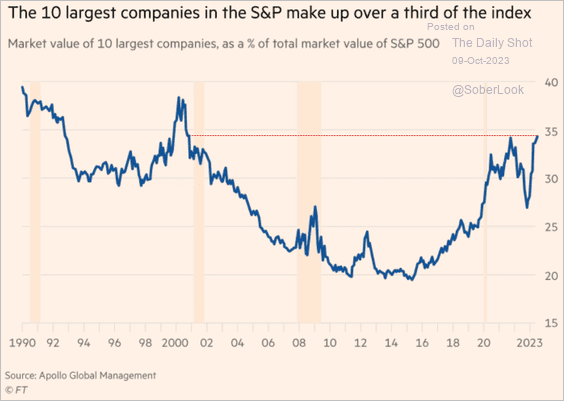 Source: @financialtimes Read full article
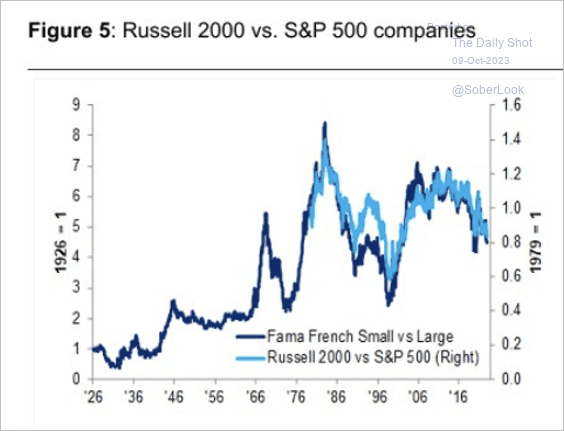
4. The Russell 2000 small-cap index is testing long-term support relative to the S&P 500 index.
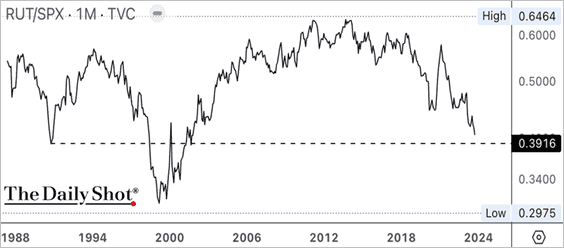
• US small and mid-cap stocks (SMID) have outperformed large-caps in most decades over the past century. According to Citi Private Bank, SMID stocks currently trade at a 30% discount to the S&P 500 after a concentrated rally in large-caps this year.
——————–
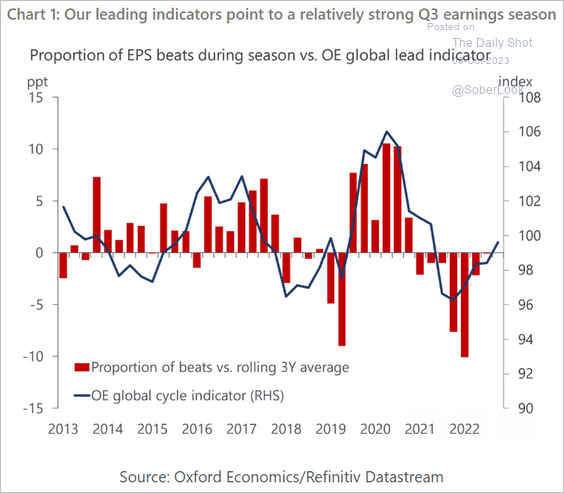
5. Oxford Economics sees a relatively strong Q3 earnings season.
 Source: Oxford Economics
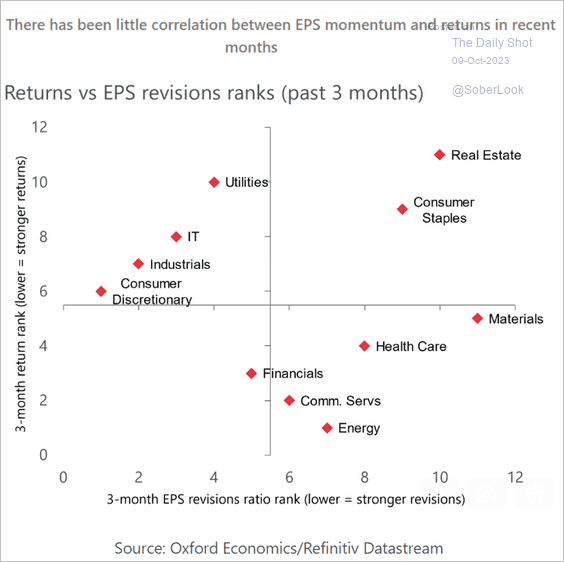
However, there hasn’t been much correlation between earnings momentum and performance in recent months.
 Source: Oxford Economics
——————–
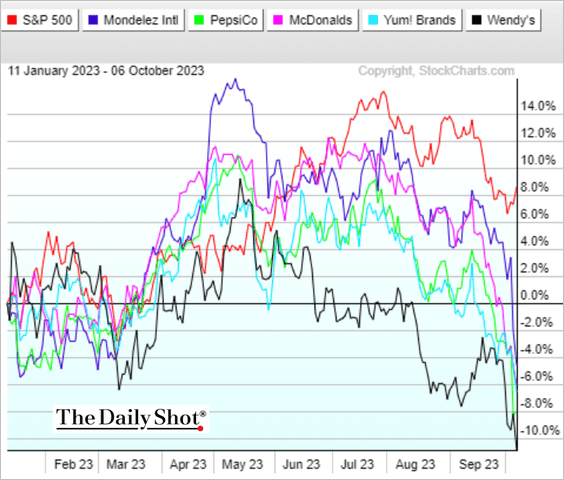
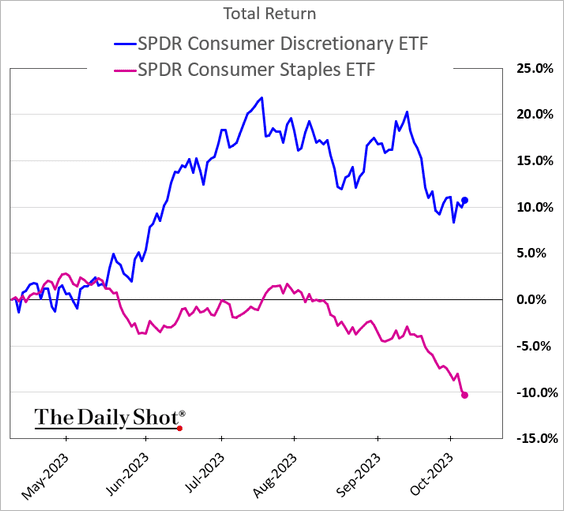
6. Food companies and restaurant chains are under pressure from new weight loss drugs, …
 Source: @axios Read full article
… which contributes to the underperformance of the consumer staples sector.
——————–
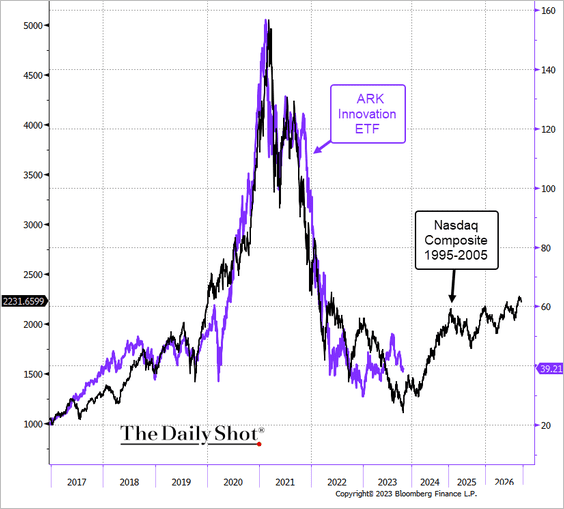
7. The ARK Innovation ETF continues to (roughly) follow the dot-com analog.
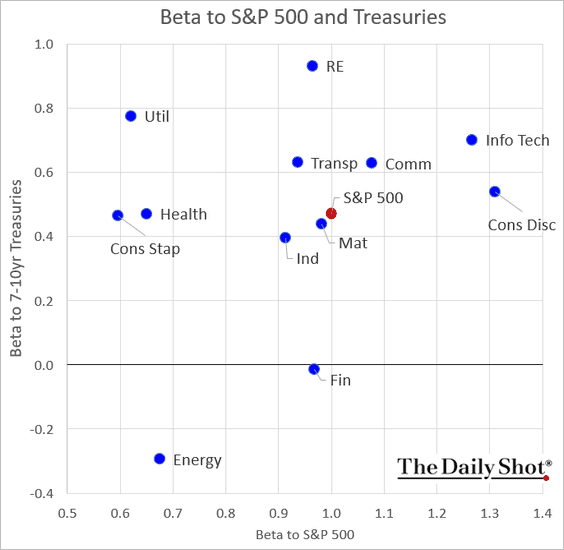
8. How sensitive are different sectors to movements in the S&P 500 and Treasuries?
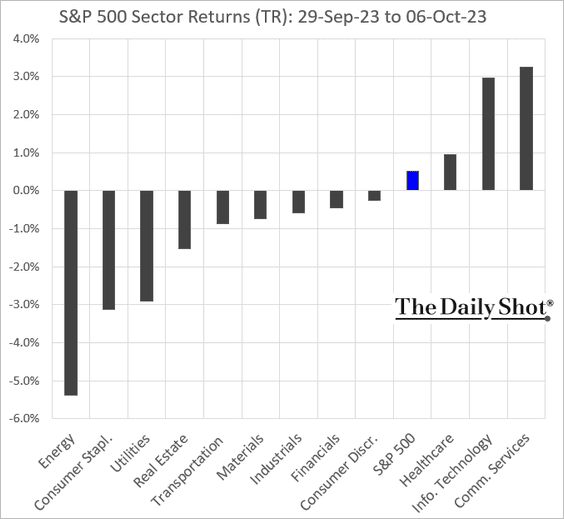
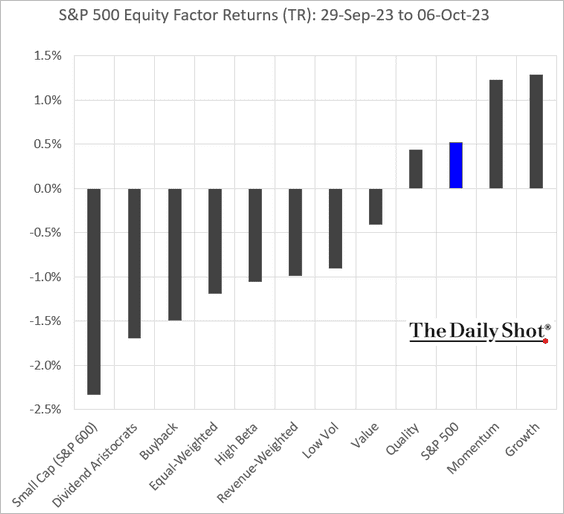
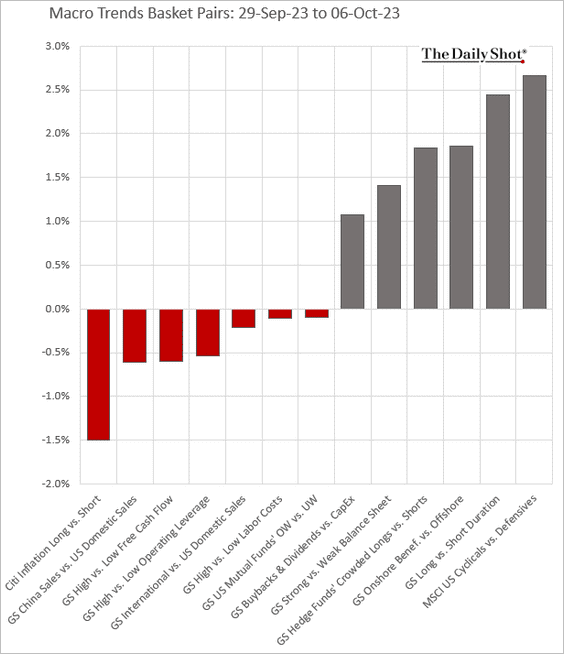
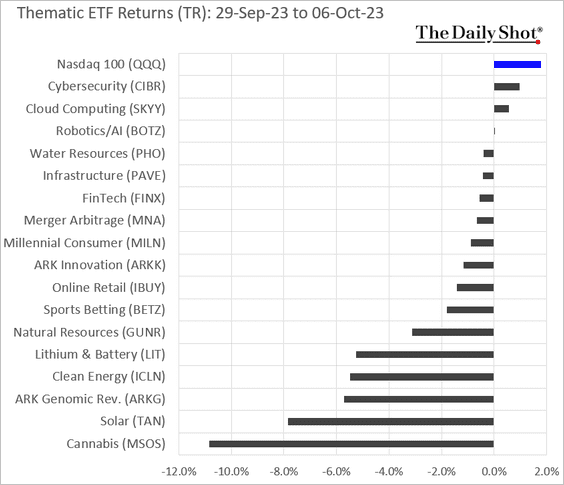
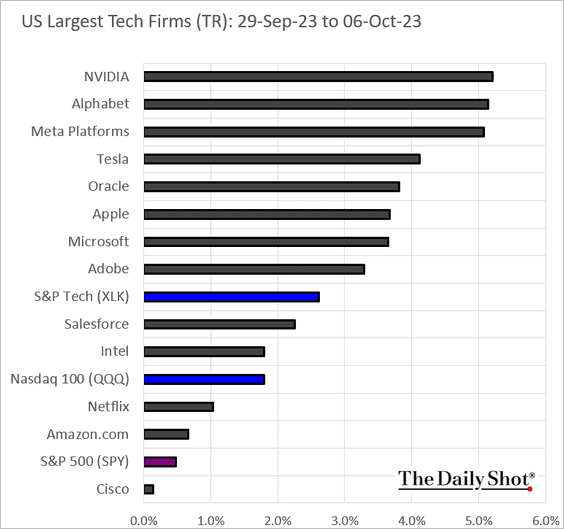
9. Finally, let’s take a look at last week’s performance data.
• Sectors:
• Equity factors:
• Macro basket pairs’ relative performance:
• Thematic ETFs:
• Largest US tech firms:
Back to Index
Credit
1. The US leveraged loan default rate fell in September and is below its 10-year average.
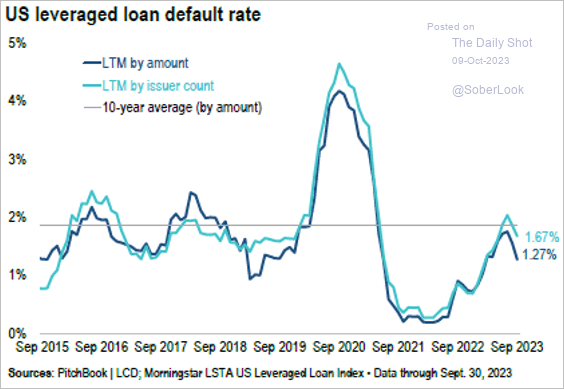 Source: PitchBook
2. Oil & Gas companies accounted for 19% of the overall high-yield new issue supply this year.
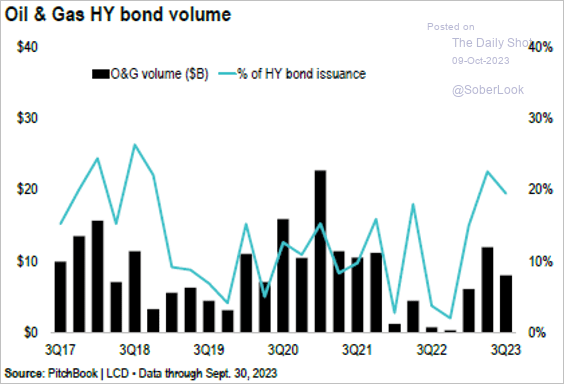 Source: PitchBook
3. Recovery rates for the riskiest CCC-rated high-yield bonds are near post-pandemic levels…
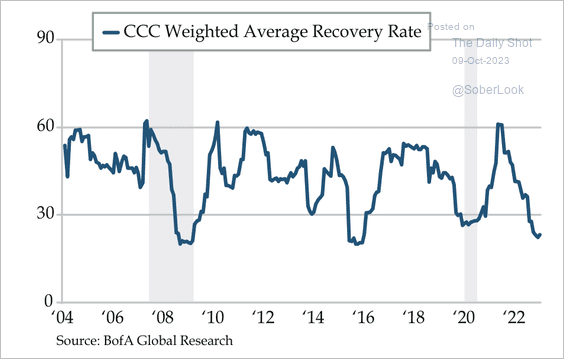 Source: Quill Intelligence
…and near financial crisis lows for the broader high-yield universe.
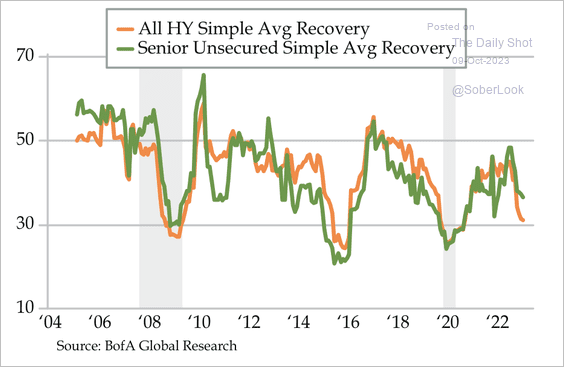 Source: Quill Intelligence
——————–
4. Here is last week’s performance data.
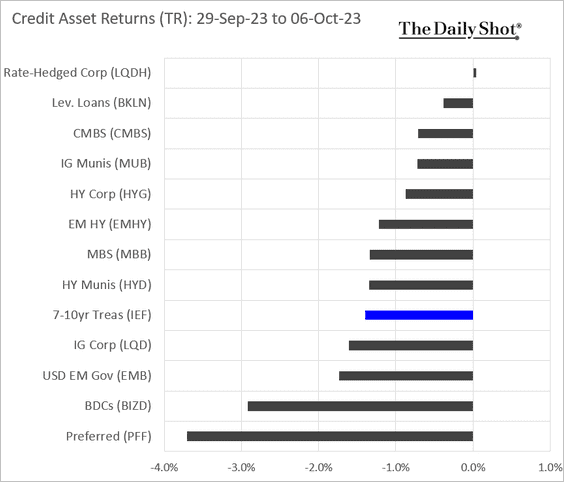
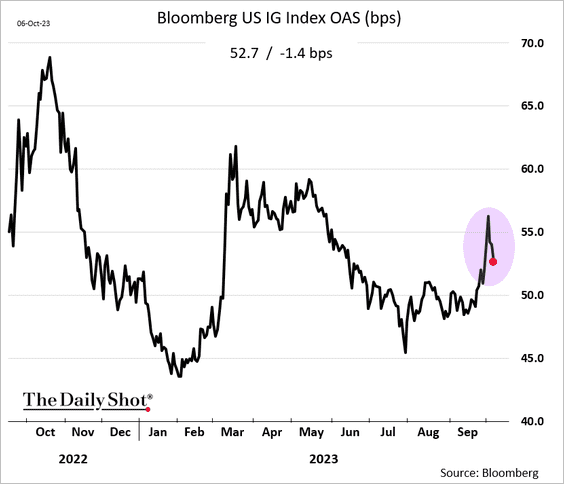
Note that the losses were due to higher rates. Credit spreads tightened.
Back to Index
Global Developments
1. Demographics will limit growth in advanced economies over the next couple of decades. Below is a forecast from Oxford Economics.
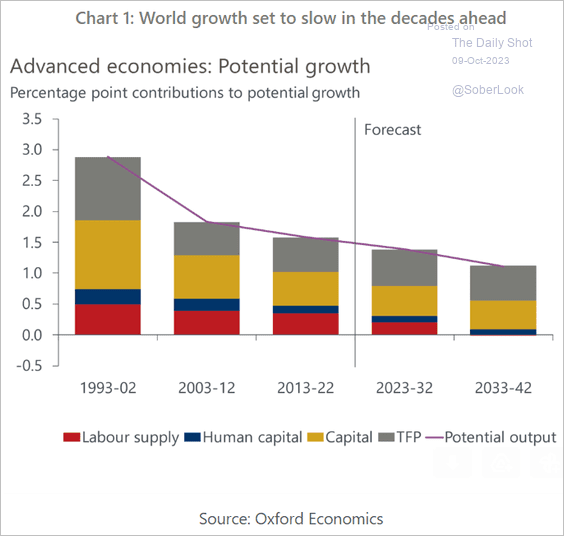 Source: Oxford Economics
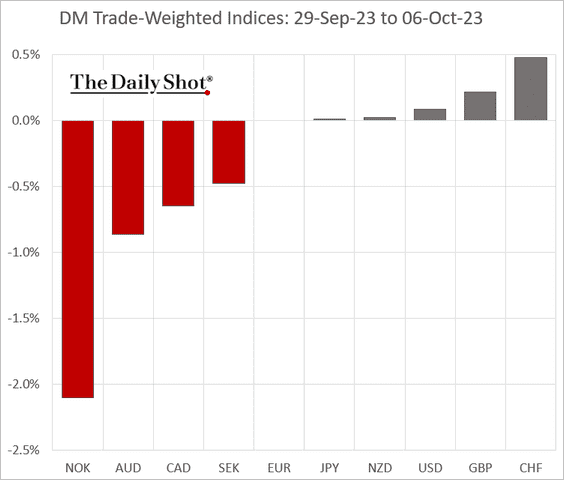
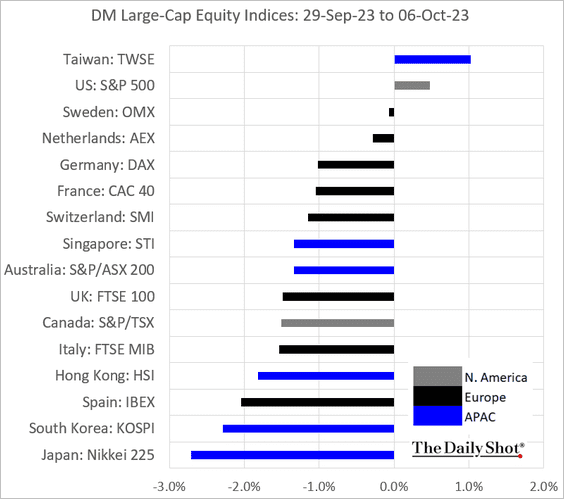
2. Here is a look at last week’s DM performance data.
• Currencies:
• Bond yields:
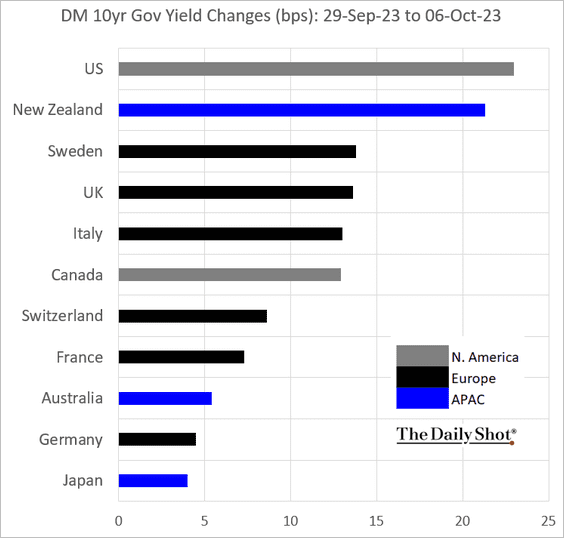
• Equity indices:
——————–
Food for Thought
1. Annual home ownership cost as a percent of median income:
 Source: @TheDailyShot
2. How much home can you afford at current rates?
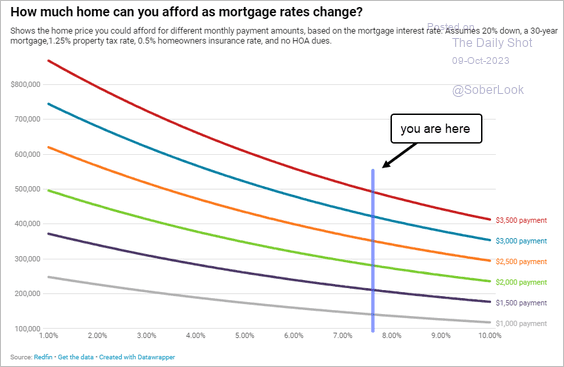 Source: Redfin
3. Relying on social security funds:
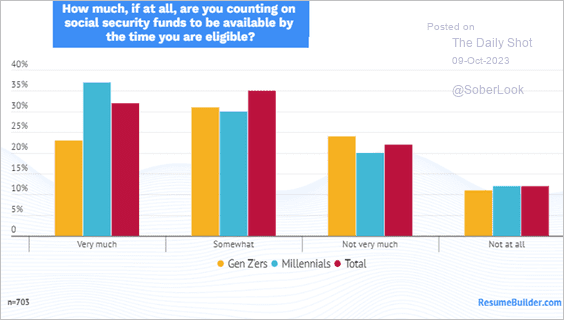 Source: ResumeBuilder.com Read full article
4. Sovereign credit ratings:
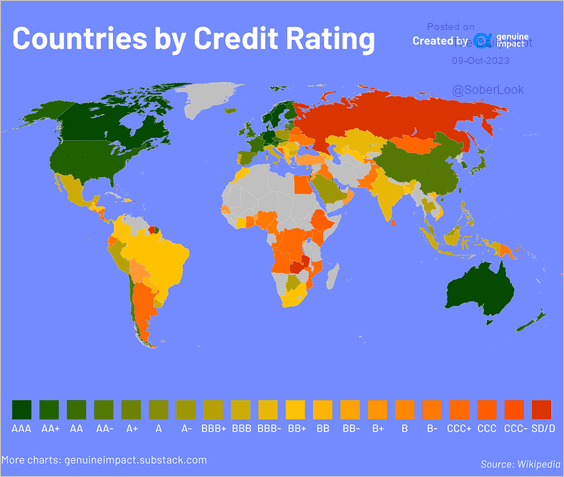 Source: @genuine_impact
5. African countries with the highest GDP per capita:
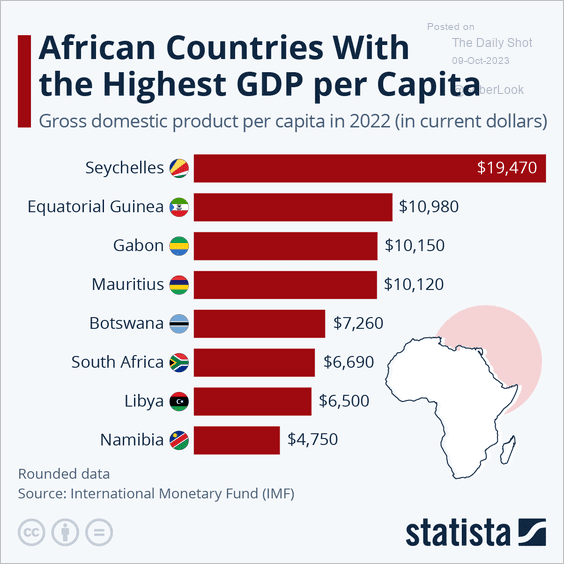 Source: Statista
6. Concerns about public education:
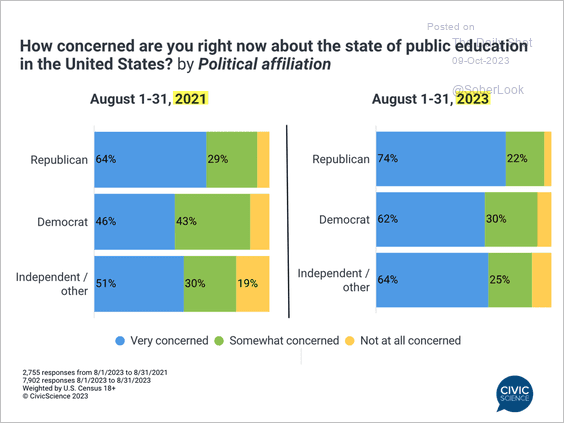 Source: @CivicScience Read full article
• Diverging views on public school issues:
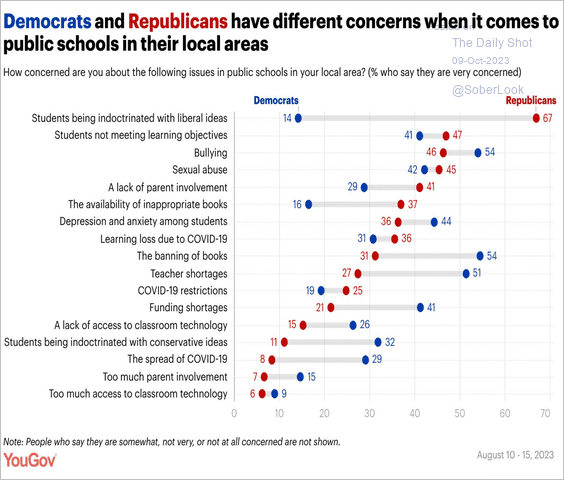 Source: @YouGovAmerica Read full article
——————–
7. Syphilis cases in the US:
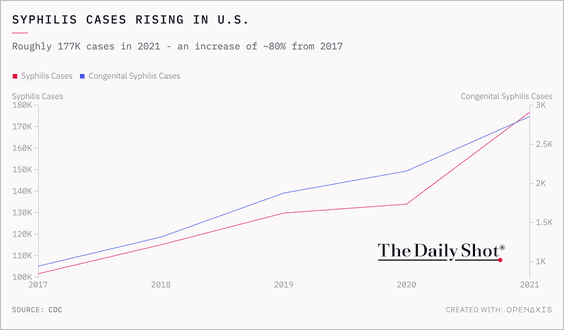 Source: @TheDailyShot
8. Projected costs of renewables:
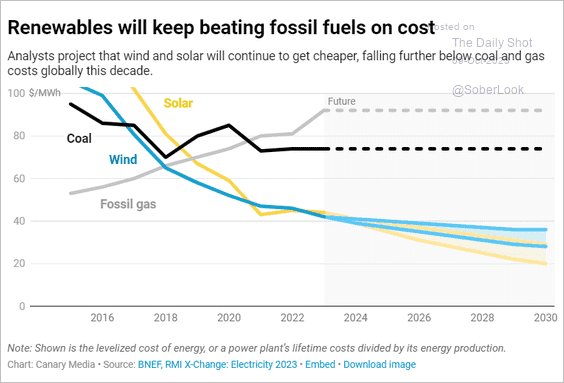 Source: Canary Media Read full article
9. Upcoming moon missions:
 Source: Statista
——————–
Back to Index