The Daily Shot: 11-Oct-23
• The United States
• The United Kingdom
• The Eurozone
• Europe
• Asia-Pacific
• Emerging Markets
• Commodities
• Energy
• Equities
• Credit
• Rates
• Global Developments
• Food for Thought
The United States
1. The NFIB small business sentiment indicator declined last month.
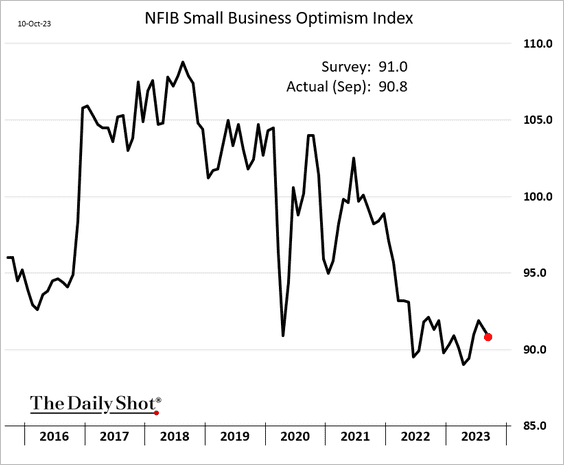
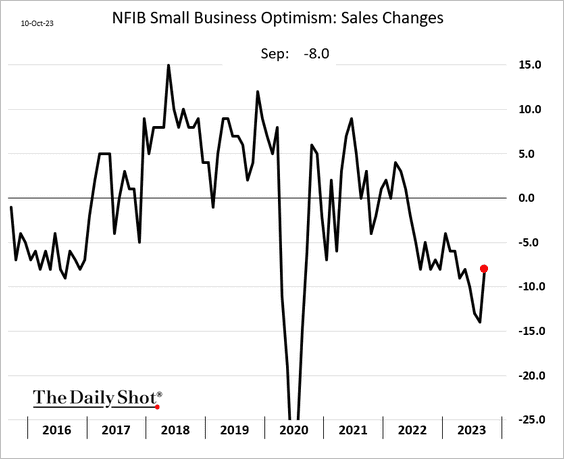
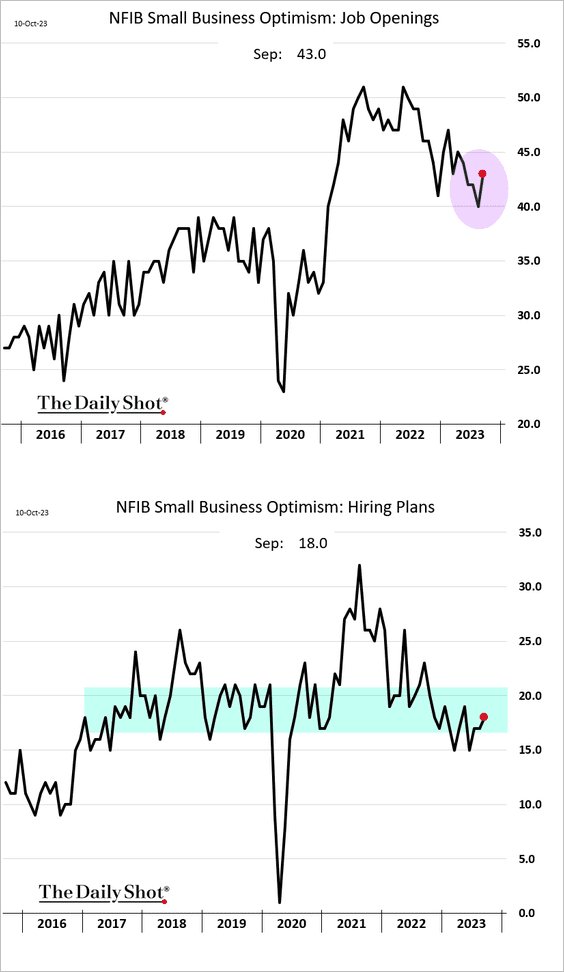
But sales and hiring indicators showed some improvement.
The percentage of firms planning to increase staff is back inside the pre-COVID range (2nd panel).
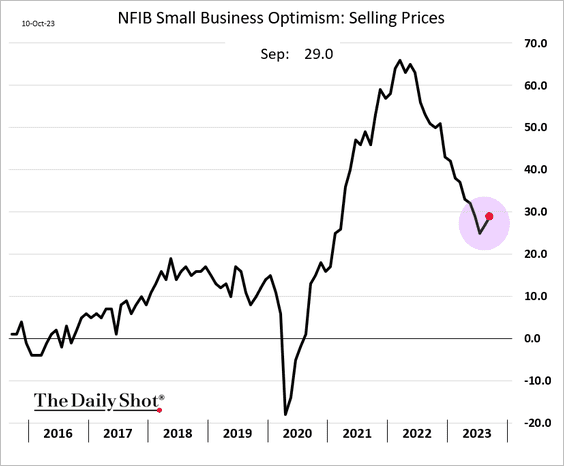
• More companies boosted prices last month.
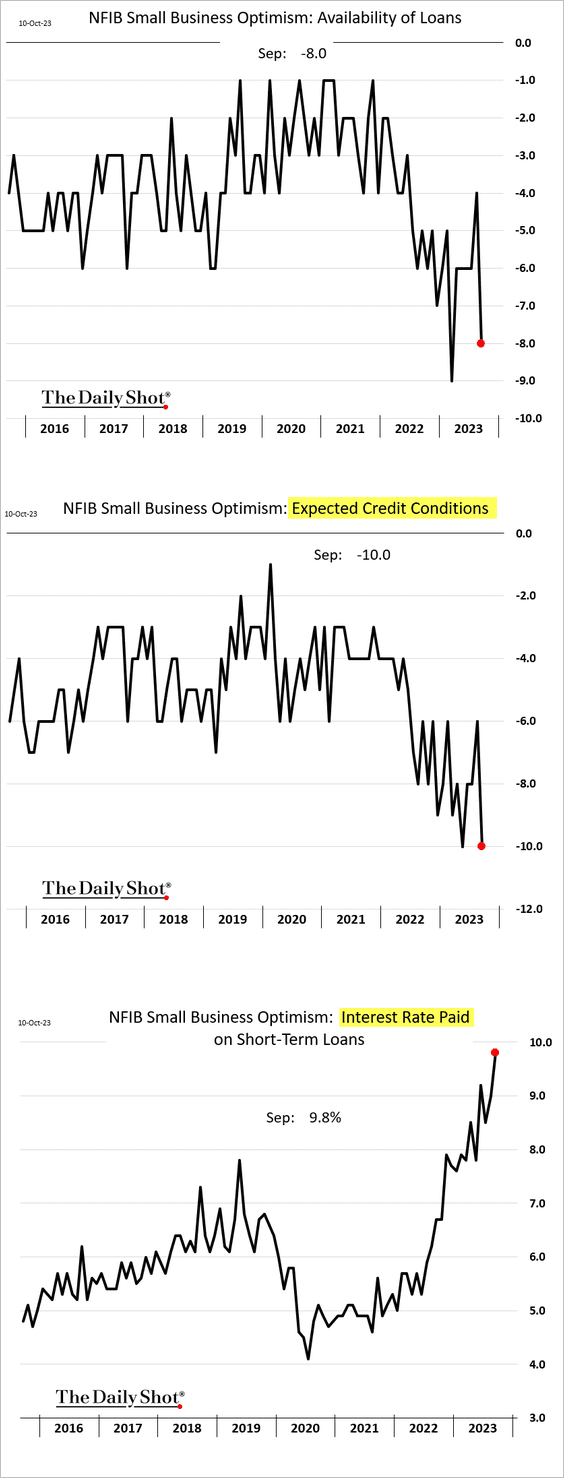
• Businesses are reporting tighter credit conditions and rising rates on loans.
——————–
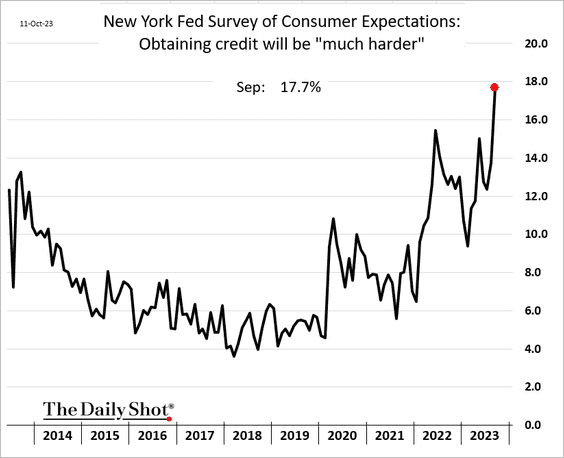
2. The share of US consumers who anticipate significant challenges in securing credit is on the rise.
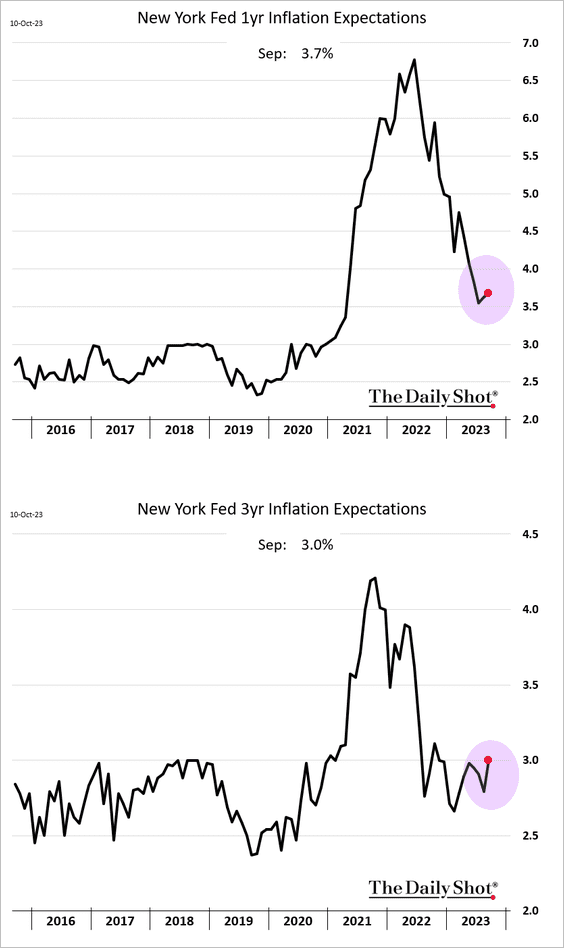
3. Inflation expectations rose last month, as reported by the NY Fed’s Survey of Consumer Expectations, likely due to the increase in gasoline prices.
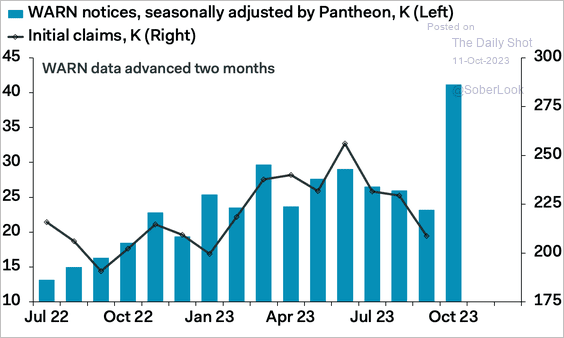
4. WARN notices suggest that jobless claims will jump this month. Under the WARN Act, companies with over 100 employees must provide a 60-day notice ahead of any planned closures or mass layoffs.
 Source: Pantheon Macroeconomics
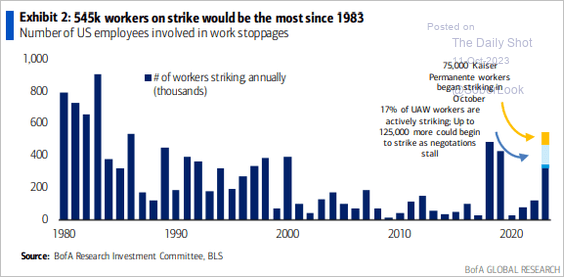
• The number of workers on strike hit a multi-year high.
 Source: BofA Global Research
——————–
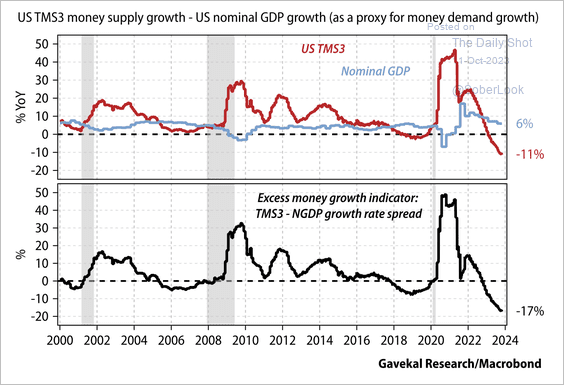
5. Money supply has been falling rapidly relative to the growth in demand for money.
 Source: Gavekal Research
Back to Index
The United Kingdom
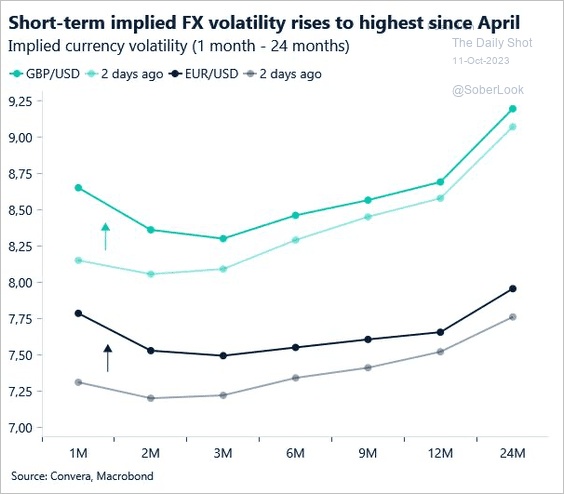
1. GBP/USD short-term implied volatility rose to the highest level since April alongside EUR/USD.
 Source: Convera
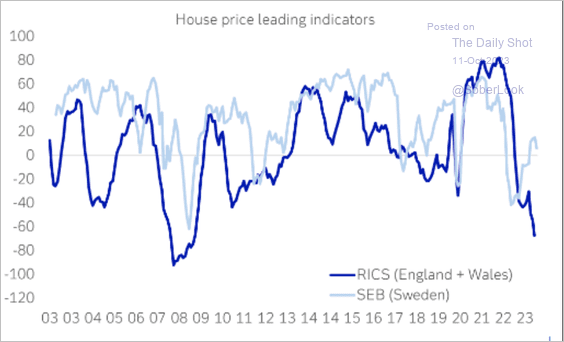
2. The leading indicator of house prices in the UK has diverged from that of Sweden.
 Source: Deutsche Bank Research
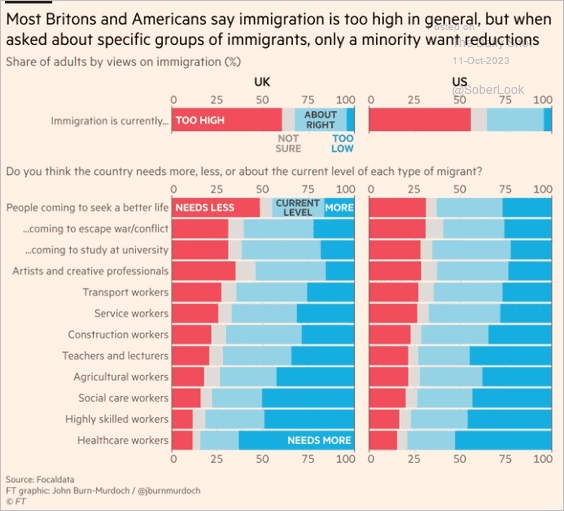
3. How do Britons and Americans view immigration?
 Source: @financialtimes Read full article
Back to Index
The Eurozone
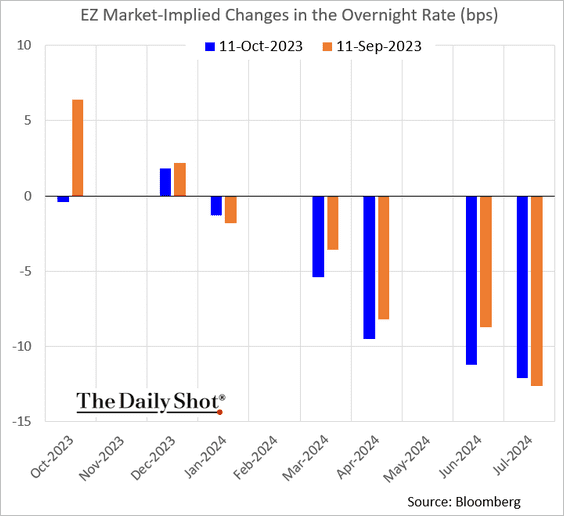
1. The market does not expect any more ECB rate hikes in this cycle.
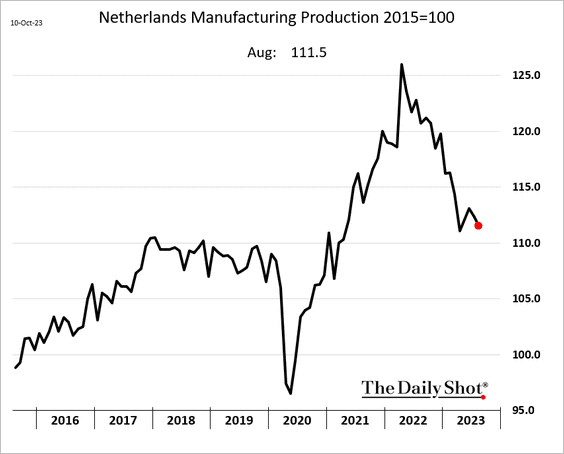
2. Dutch factory output has been trending lower.
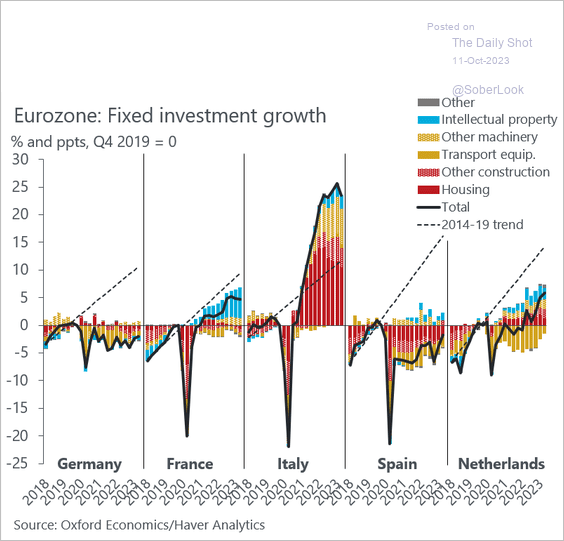
3. Here is a look at fixed investment compared to the pre-COVID trend.
 Source: @DanielKral1
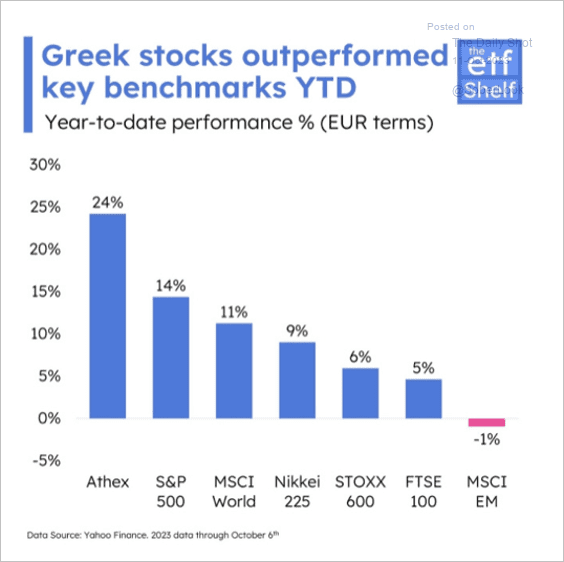
4. Greek stocks have outperformed this year.
 Source: The ETF Shelf
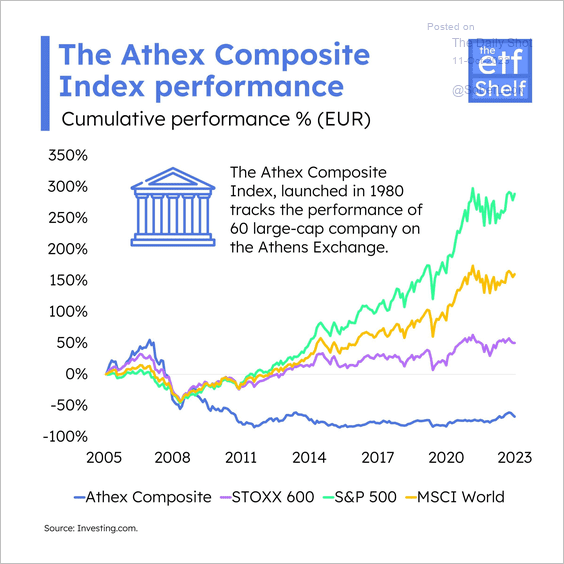
However, Greek stocks have lagged the recovery in global equities since the financial crisis.
 Source: The ETF Shelf
Back to Index
Europe
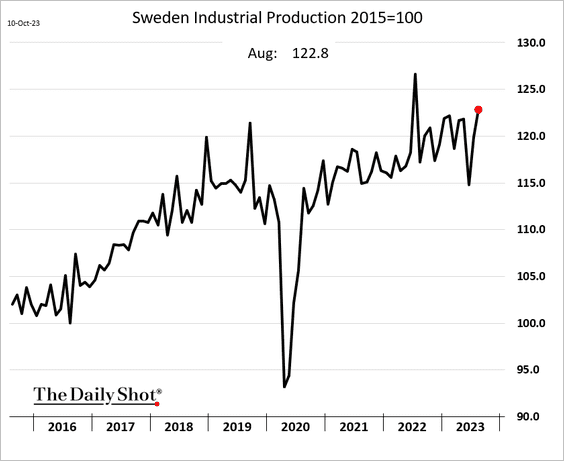
1. Sweden’s industrial production improved again in August.
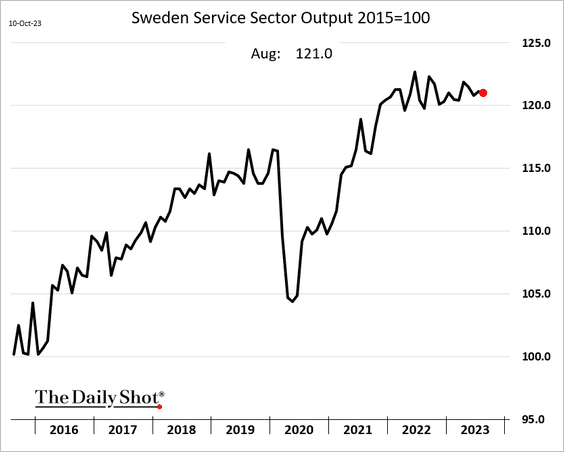
• Services output has been flat.
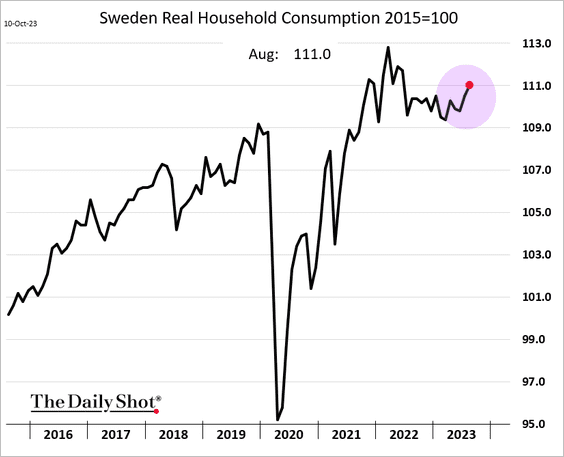
• Household consumption is rebounding.
——————–
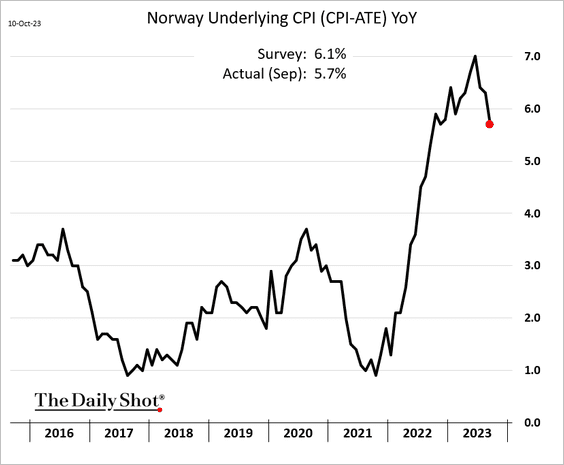
2. Norway’s inflation surprised to the downside.
 Source: @economics Read full article
——————–
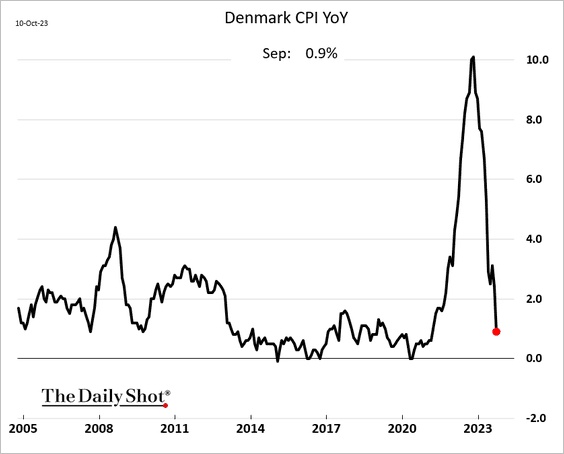
3. Denmark is headed for deflation.
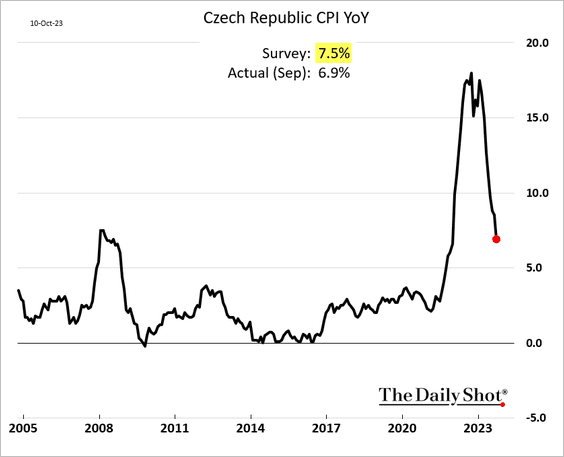
4. Czech inflation is also crashing.
5. The rally in CHF/JPY appears stretched.
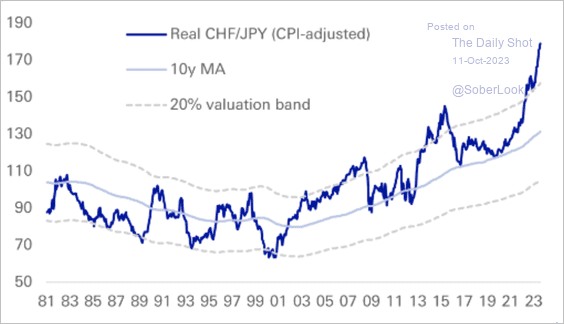 Source: Deutsche Bank Research
6. Hedge funds continue to rotate to European shares.
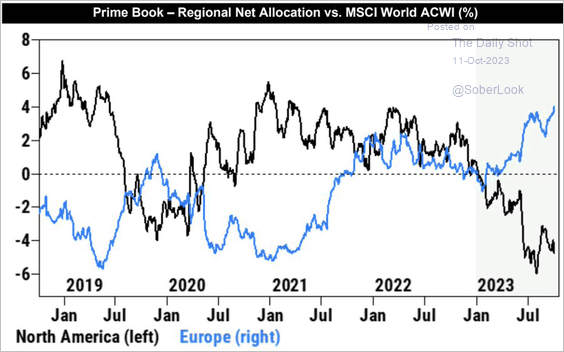 Source: Goldman Sachs; @dailychartbook
7. Here is a look at investment in R&D.
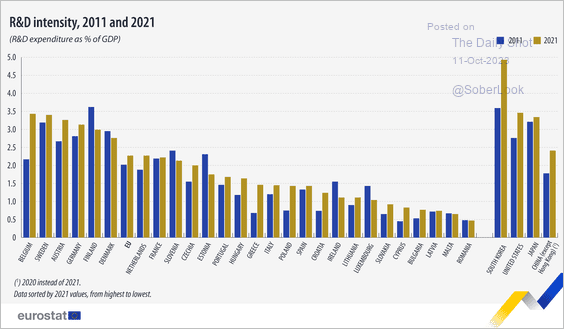 Source: Eurostat Read full article
Back to Index
Asia-Pacific
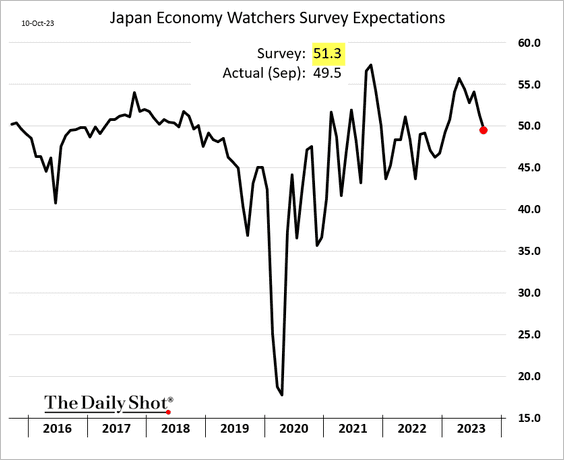
1. Japan’s Economy Watchers Survey expectations index surprised to the downside.
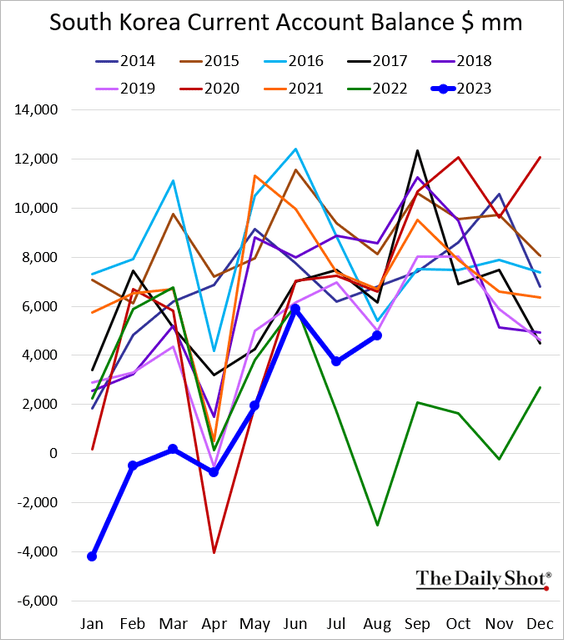
2. South Korea’s current account balance is back at 2019 levels.
Back to Index
Emerging Markets
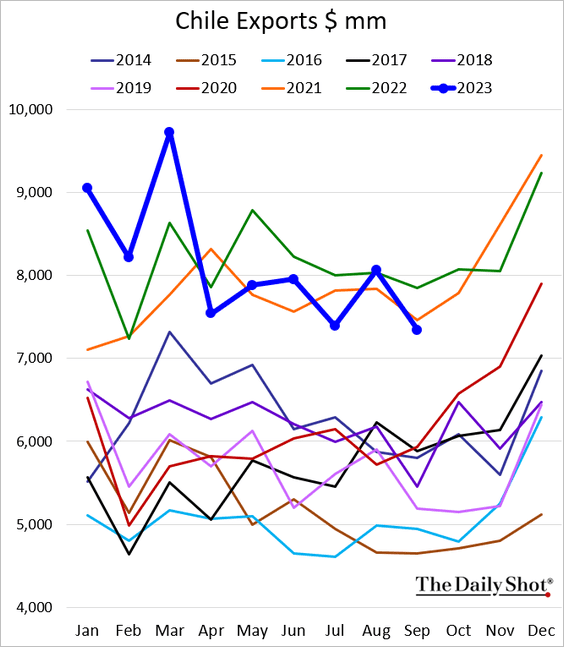
1. Chile’s exports slowed last month.
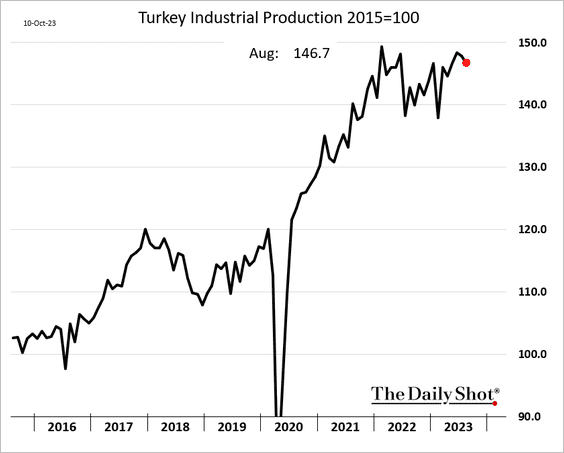
2. Turkey’s industrial production appears to be peaking for now.
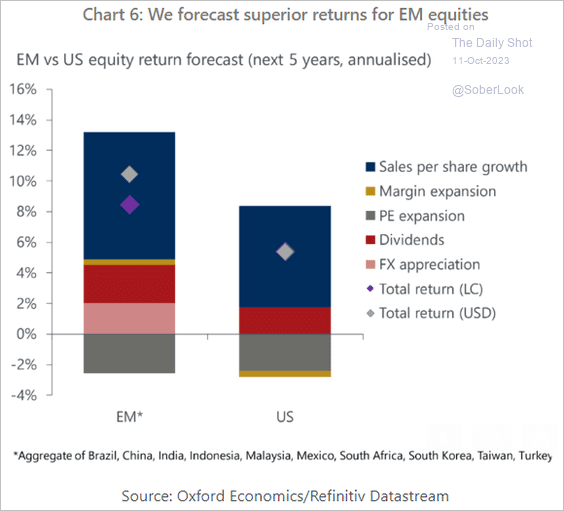
3. EM shares have been lagging the S&P 500 over the past three years.
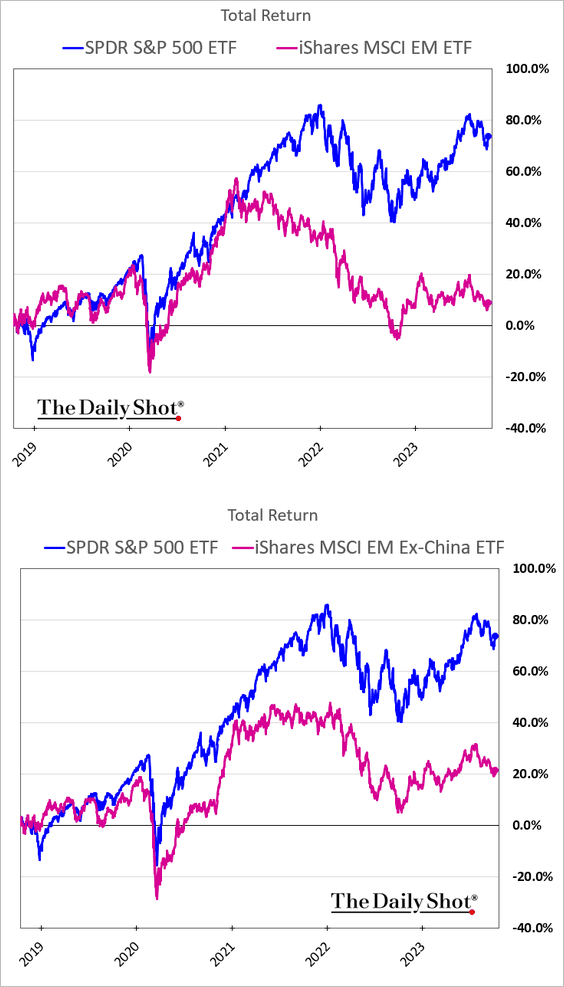
Will EM equities outperform the US over the next five years? Here is a forecast from Oxford Economics.
 Source: Oxford Economics
Back to Index
Commodities
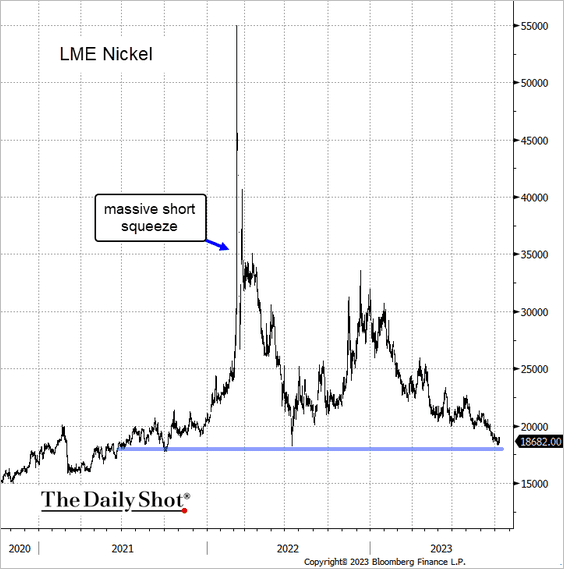
1. Nickel is at support.
 Source: @TheTerminal, Bloomberg Finance L.P.
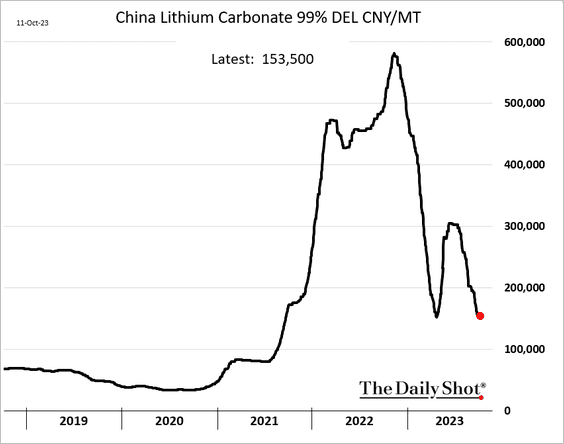
2. This year’s bounce in lithium prices has been reversed.
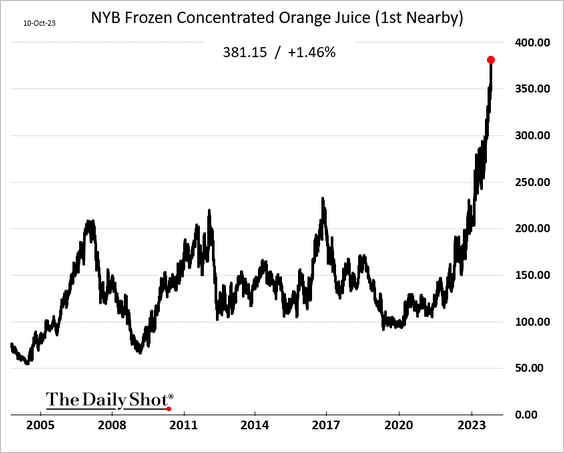
3. US orange juice futures continue to hit record highs.
Back to Index
Energy
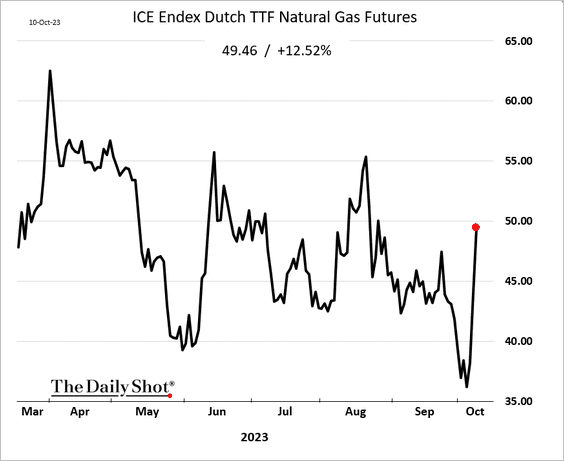
1. European natural gas prices are up sharply amid concerns about the Finland-Estonia pipeline sabotage.
 Source: @markets Read full article
——————–
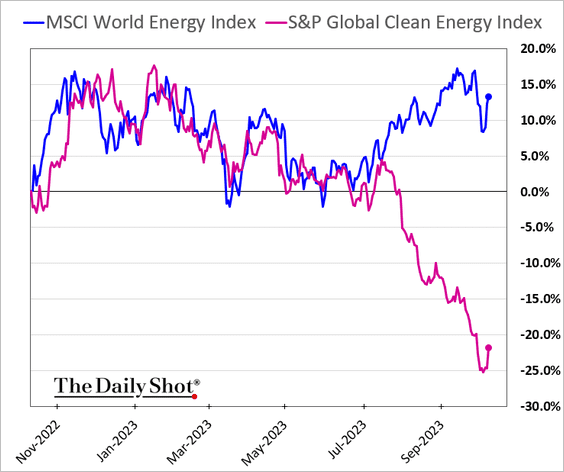
2. The gap between clean energy shares and traditional energy firms has blown out.
Back to Index
Equities
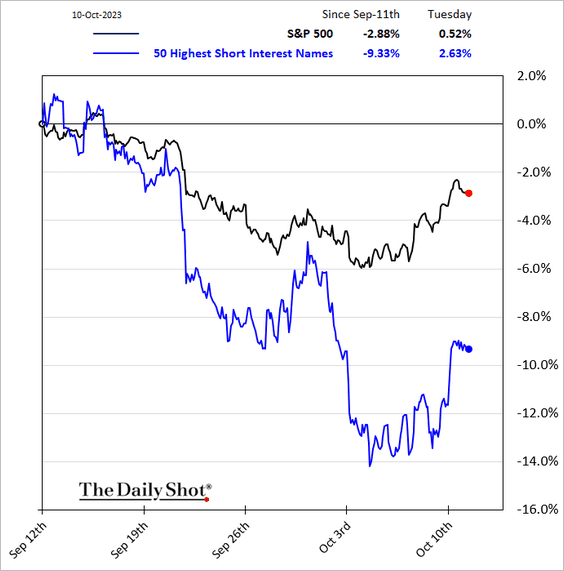
1. The current market bounce does not appear to show a lot of short covering.
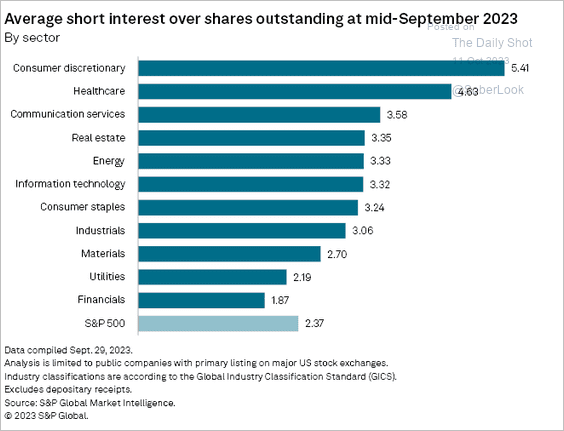
• This chart shows short interest by sector.
 Source: S&P Global Market Intelligence
——————–
2. Equities have diverged from global excess liquidity (2 charts).
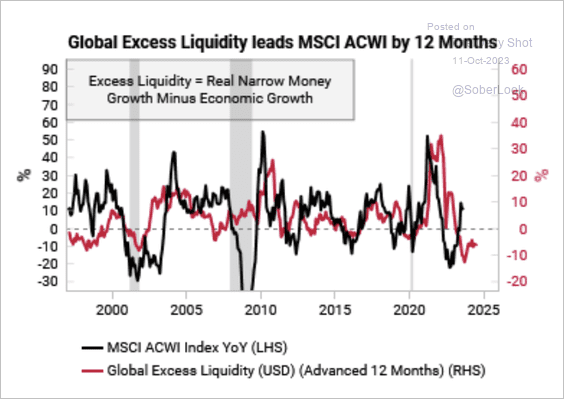 Source: Variant Perception
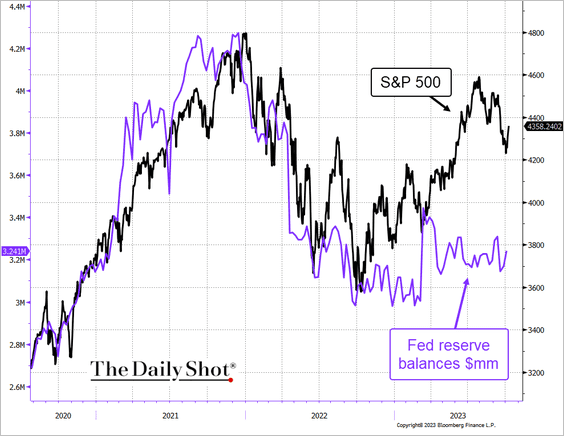 Source: @TheTerminal, Bloomberg Finance L.P.
——————–
3. The distribution of single stock valuations for the Russell 2000 small-cap index is already comparable to previous market bottoms, …
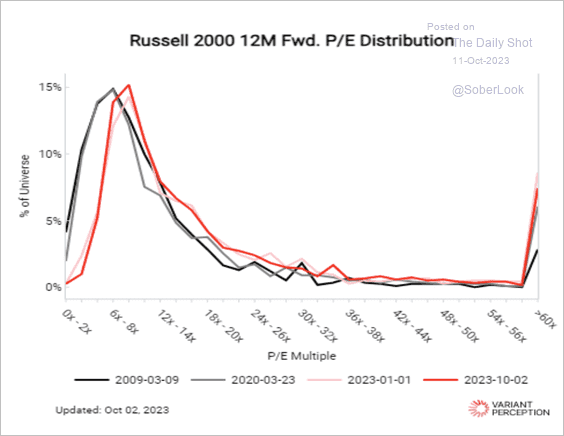 Source: Variant Perception
… while the S&P 500 distribution still looks different compared to previous lows.
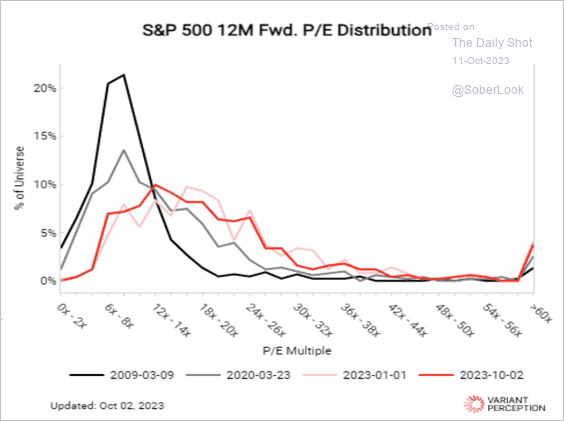 Source: Variant Perception
——————–
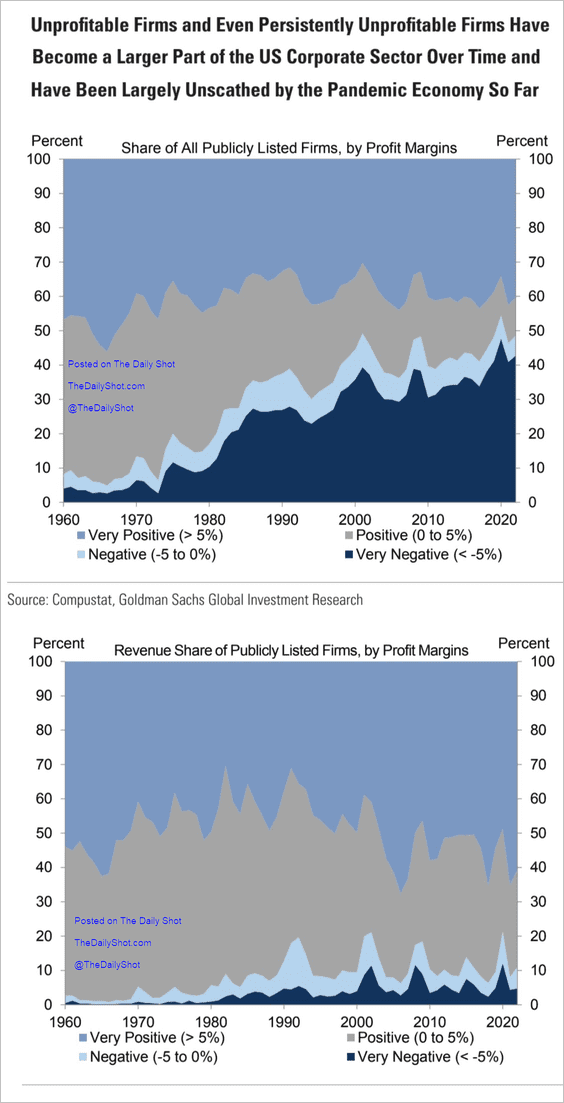
4. Here is a look at growth in unprofitable firms’ share of the US corporate sector.
 Source: Goldman Sachs
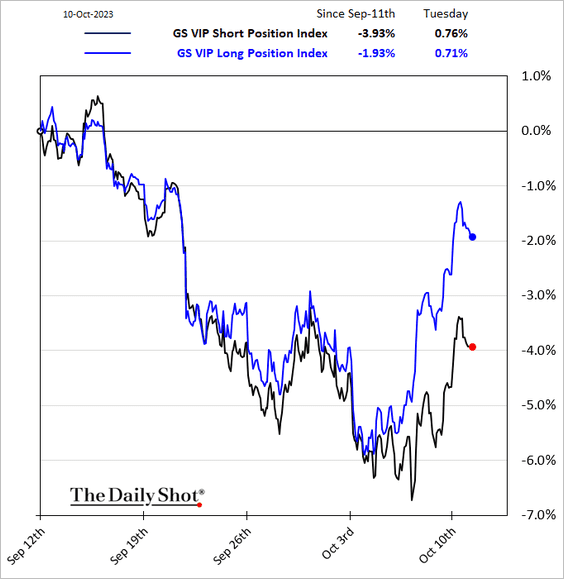
5. Hedge funds’ long stock picks are outperforming this month.
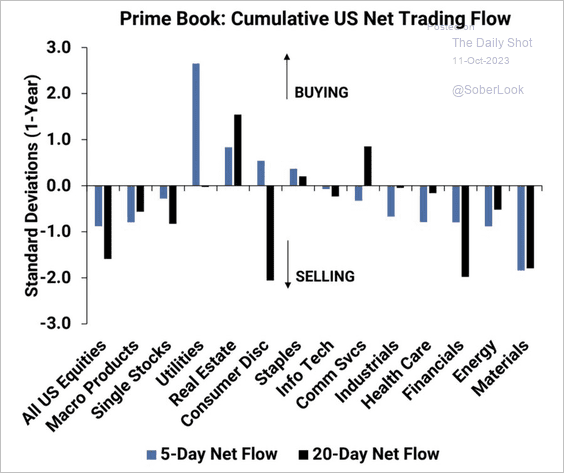
• This chart shows hedge funds’ trading flows by sector.
 Source: Goldman Sachs; @dailychartbook
Back to Index
Credit
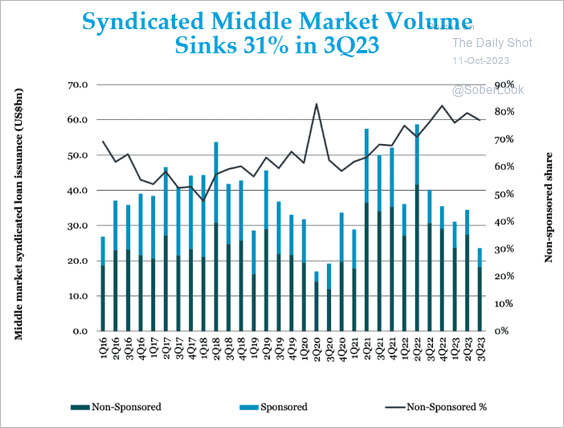
1. Middle market syndicated loan volume hit the lowest level since the third quarter of 2020.
 Source: @theleadleft
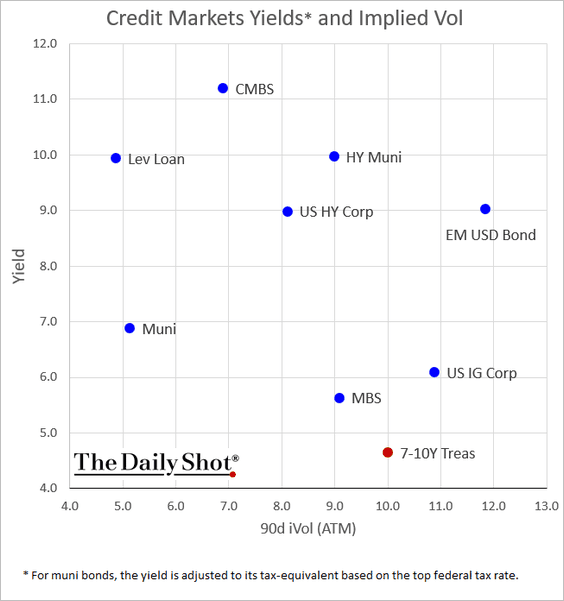
2. This chart shows yields and implied volatility across key credit markets.
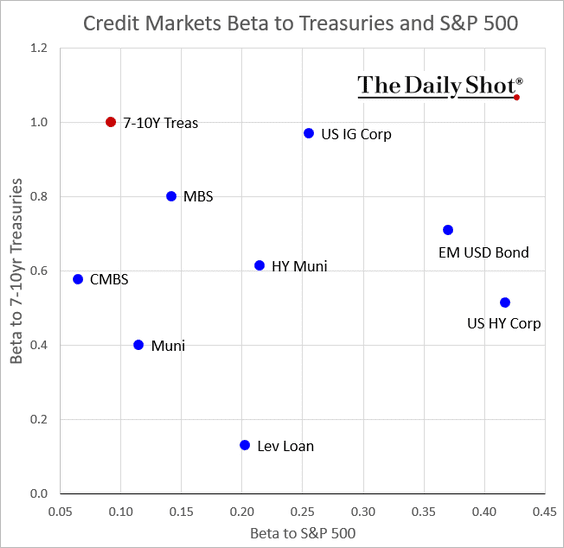
• How sensitive are credit markets to price movements in Treasuries and stocks?
Back to Index
Rates
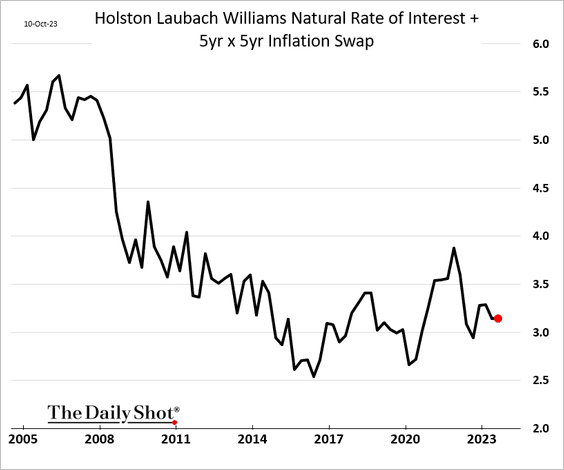
1. The San Francisco Fed’s president, Mary Daly, suggested that the nominal neutral rate could be at 3%, above the current FOMC estimates.
 Source: See Video:
The HLW neutral rate measure combined with longer-term inflation expectations points to the nominal neutral rate slightly above 3%. This is marginally higher than what we observed in the years leading up to the pandemic.
——————–
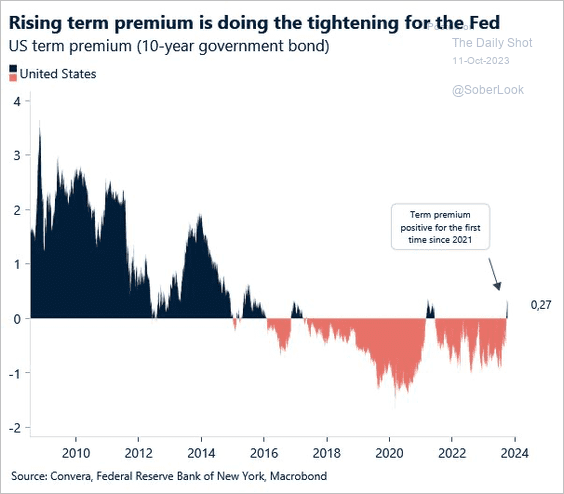
2. The 10-year Treasury term premium turned positive for the second time since 2016.
 Source: Convera
Back to Index
Global Developments
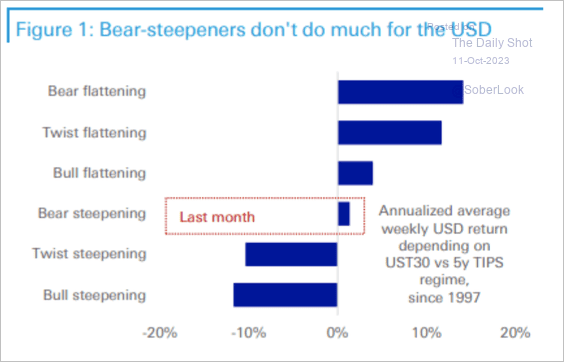
1. Historically, a bear steepening of the Treasury curve is only mildly positive for the dollar.
 Source: Deutsche Bank Research
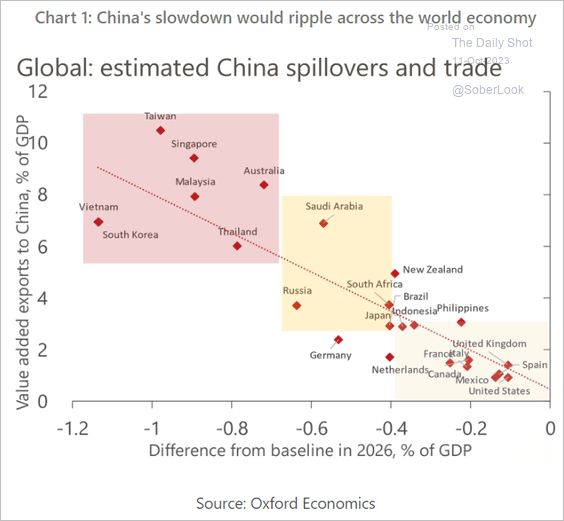
2. Here is a look at countries’ exposure to China’s economy.
 Source: Oxford Economics
——————–
Food for Thought
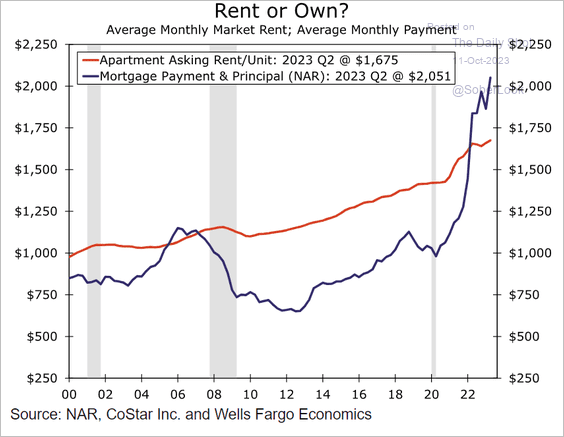
1. US rental costs vs. mortgage payments:
 Source: Wells Fargo Securities
2. Global EV sales:
 Source: Statista
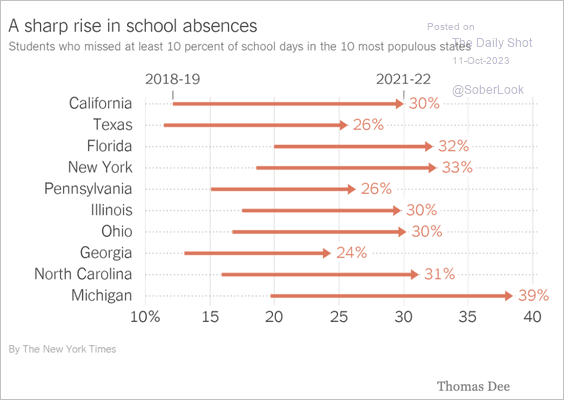
3. Missing school (2 charts):
 Source: The New York Times Read full article
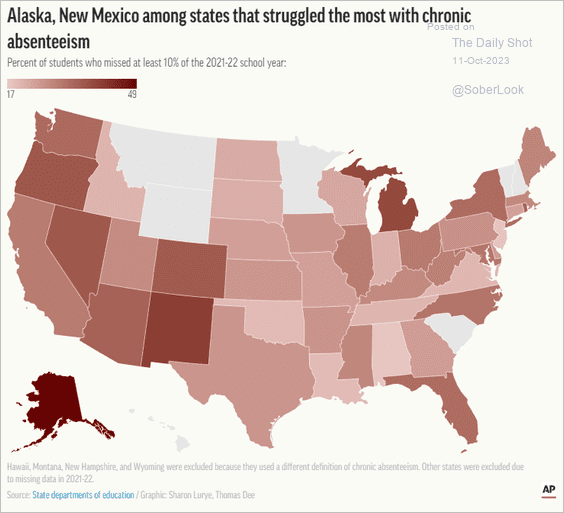 Source: AP News Read full article
——————–
4. US defense budget and debt service costs:
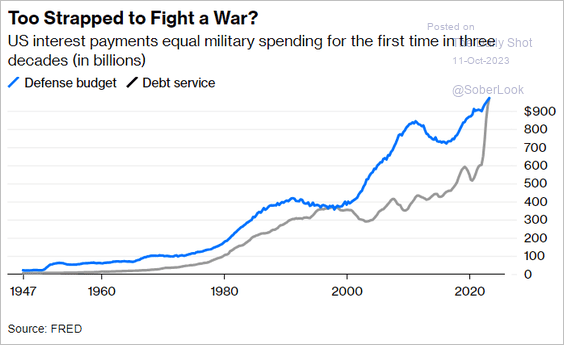 Source: @nfergus, @opinion Read full article
5. Global air and sea surface temperatures:
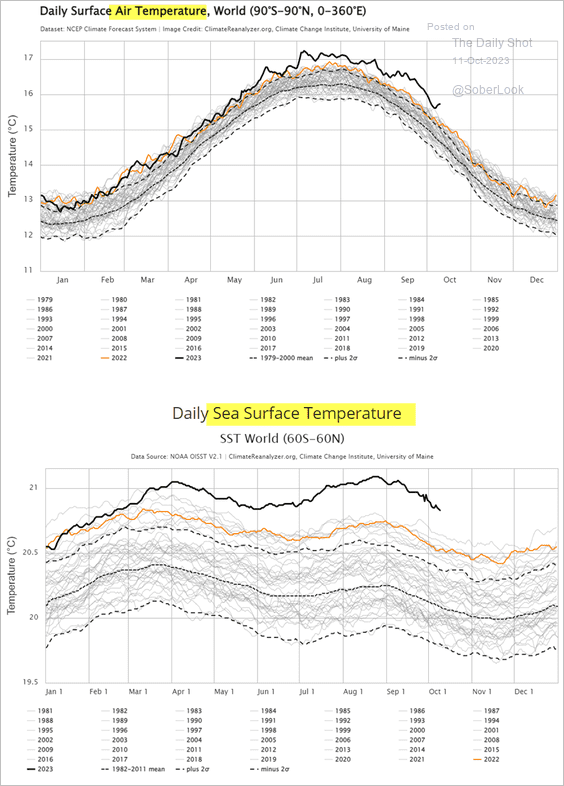 Source: Climate Reanalyzer
6. Passenger misconduct in the skies:
 Source: USAFacts
7. Birth rates and living standards:
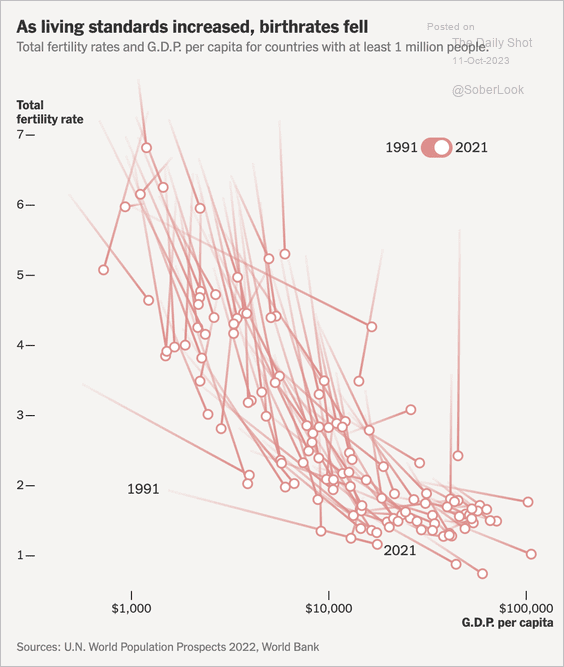 Source: The New York Times Read full article
8. Athletes vs. animals:
 Source: Statista
——————–
Back to Index
