
The Daily Shot: 13-Oct-23
• The United States
• The United Kingdom
• Europe
• Asia-Pacific
• China
• Emerging Markets
• Commodities
• Energy
• Equities
• Credit
• Rates
• Global Developments
• Food for Thought
The United States
1. The September CPI report topped expectations, suggesting that the Fed’s effort to curb inflation remains a work in progress.
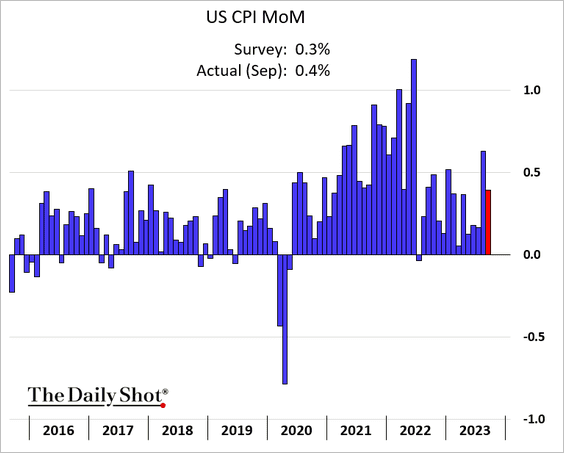
 Source: CNBC Read full article
Here are the contributions.
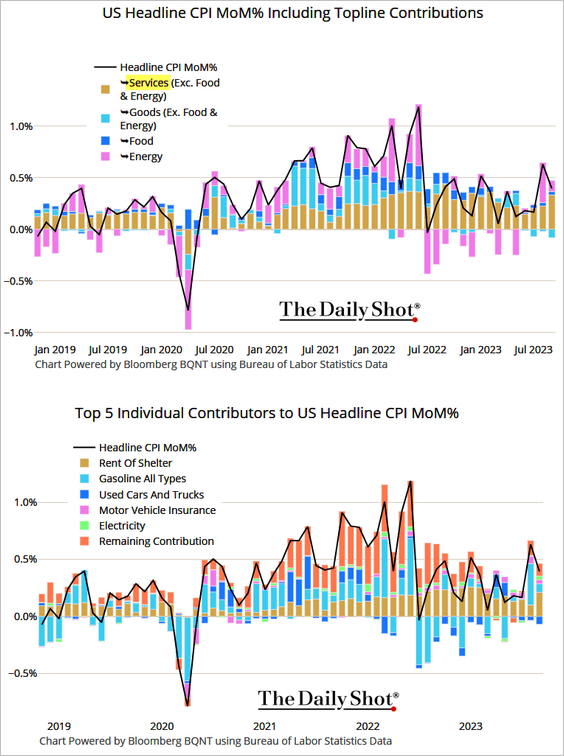 Source: @TheTerminal, Bloomberg Finance L.P.
• Core inflation strengthened.
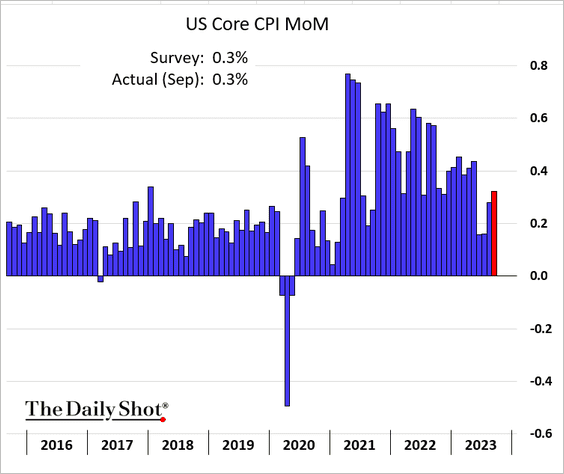
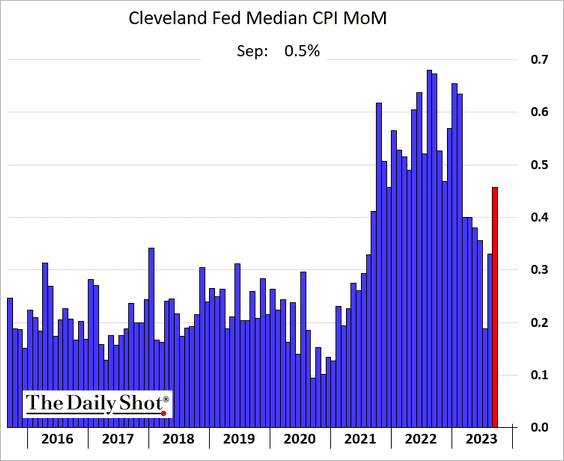
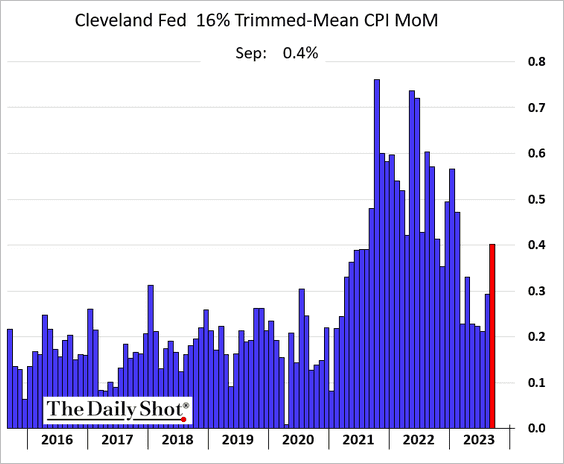
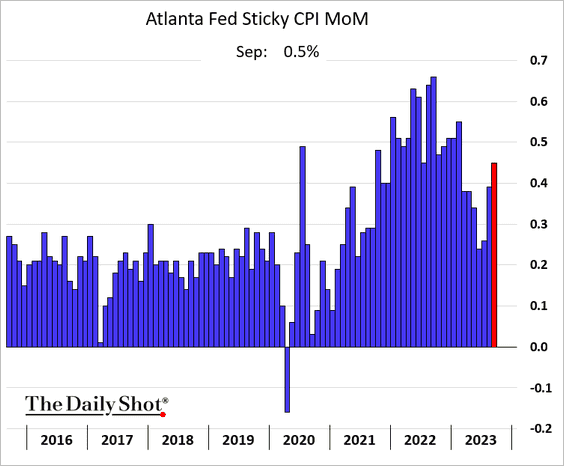
Alternative measures of core inflation showed rapid price gains in September.
– Median CPI:
– Trimmed-mean CPI:
– Sticky CPI:
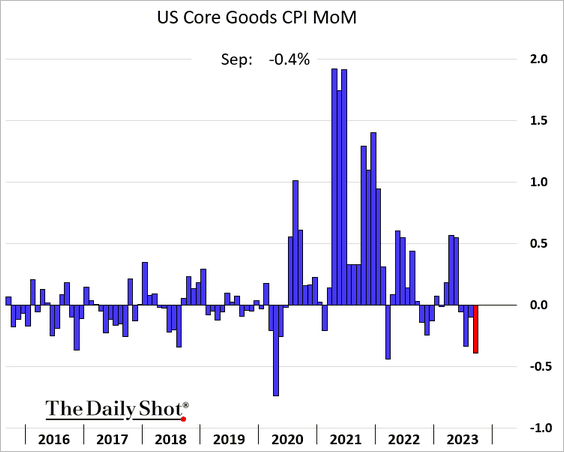
• Core goods CPI was negative for the fourth month in a row.
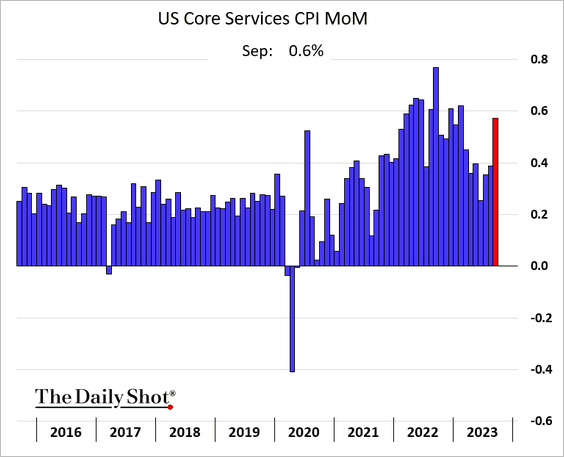
But core services CPI surged last month.
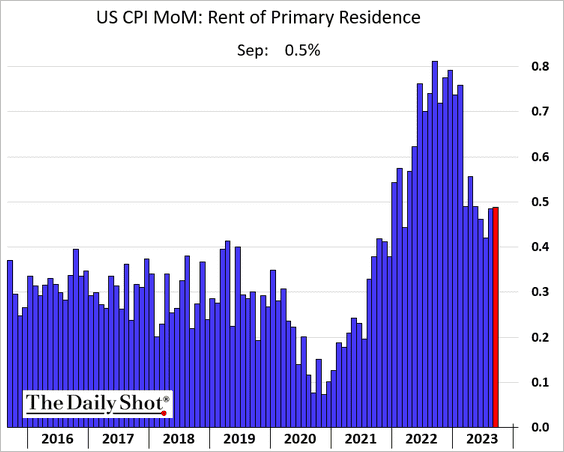
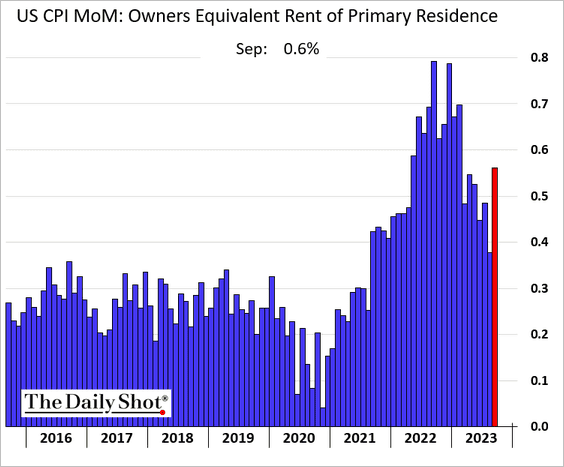
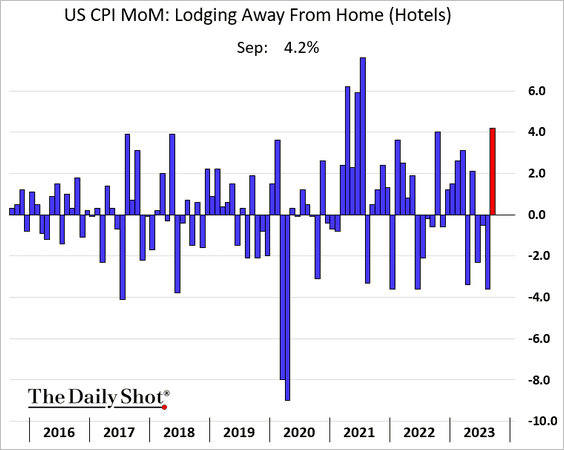
Shelter drove most of the gains in core inflation.
– Rent:
– Owners’ equivalent rent:
– Hotel costs:
• But even excluding shelter, services inflation climbed sharply. Here is the supercore CPI.
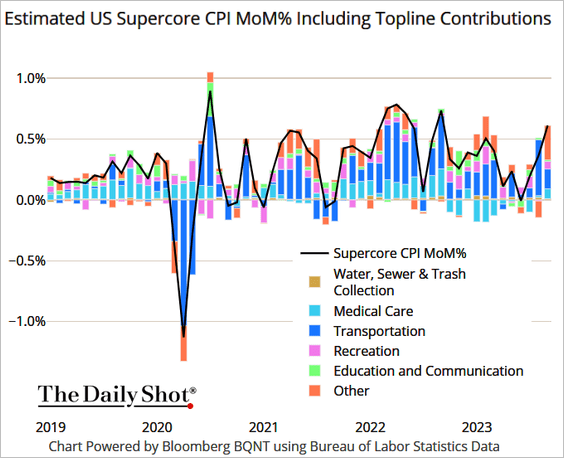 Source: @TheTerminal, Bloomberg Finance L.P.
——————–
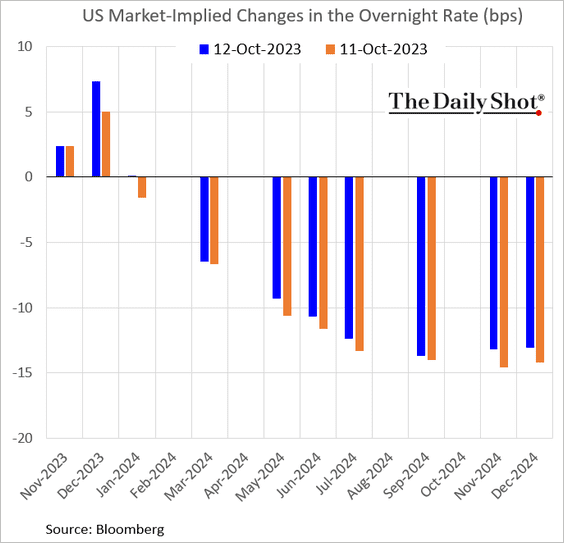
2. The probability of a Fed rate hike in December increased in response to the CPI report. November still seems to be off the table.
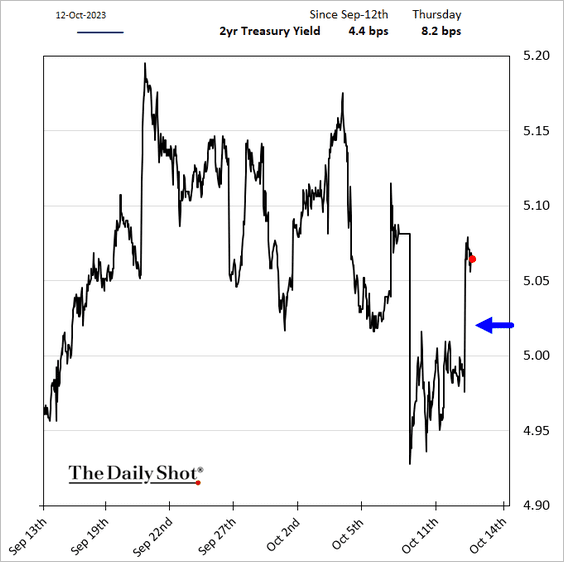
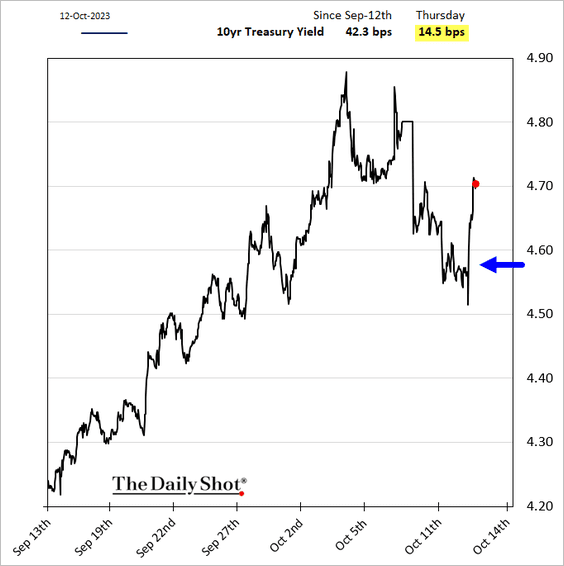
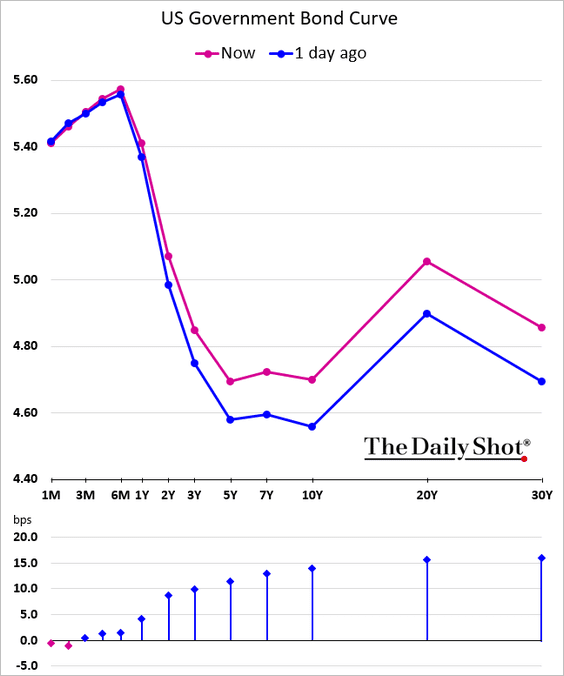
• Treasury yields surged, with the 2-year rate climbing above 5% again.
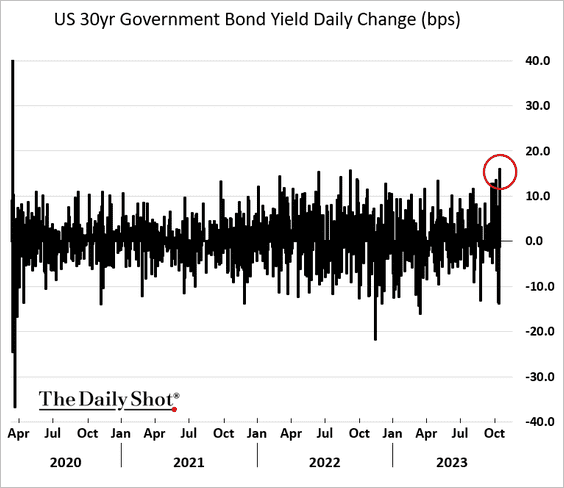
The 30-year yield increase was the highest in years.
• The yield curve steepened.
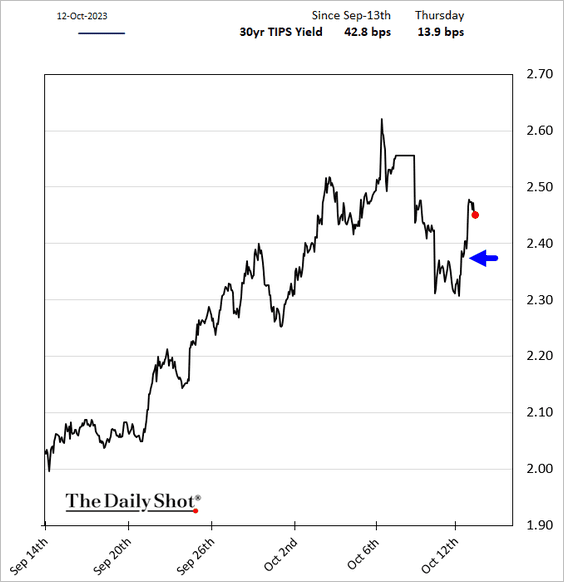
• Real yields also increased.
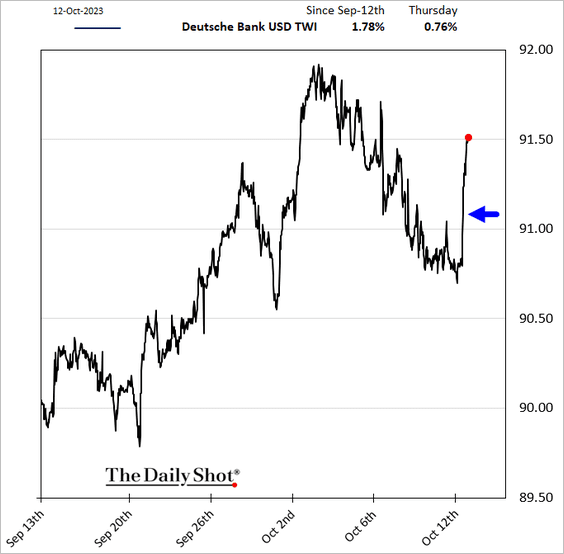
• The dollar jumped.
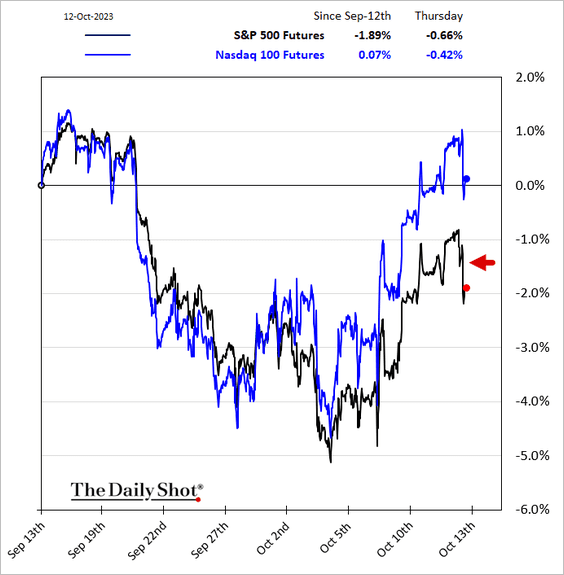
• Risk assets retreated.
——————–
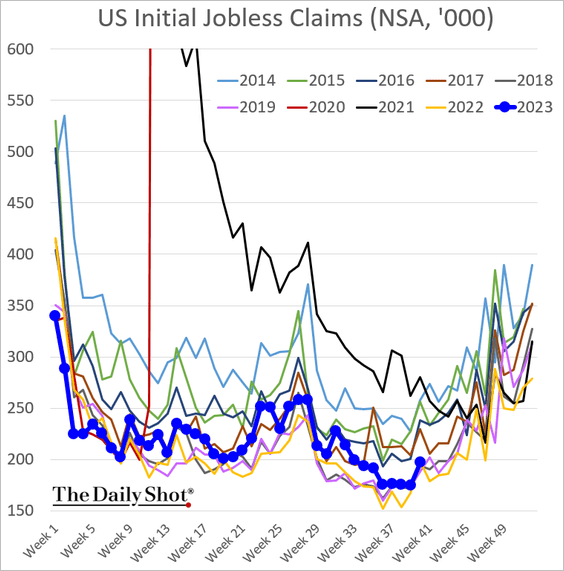
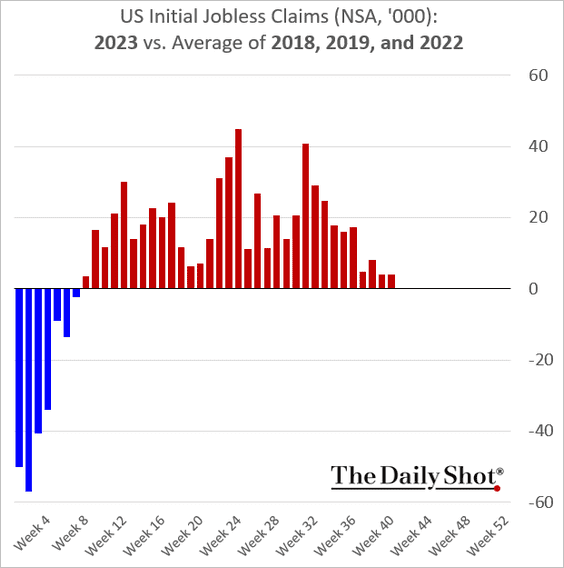
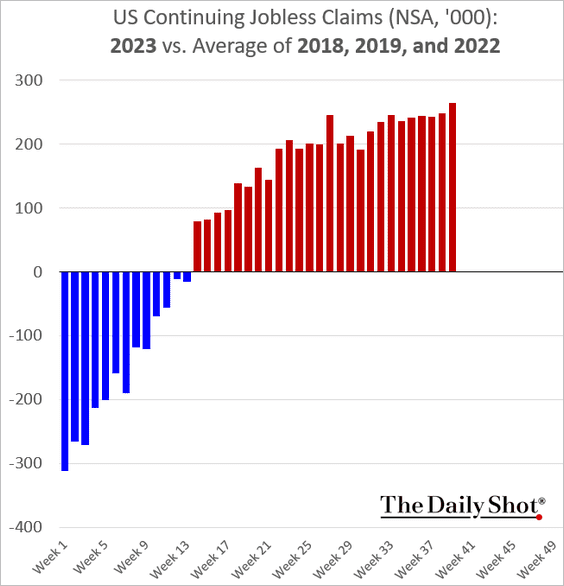
3. US jobless claims are holding just above multi-year lows for this time of the year.
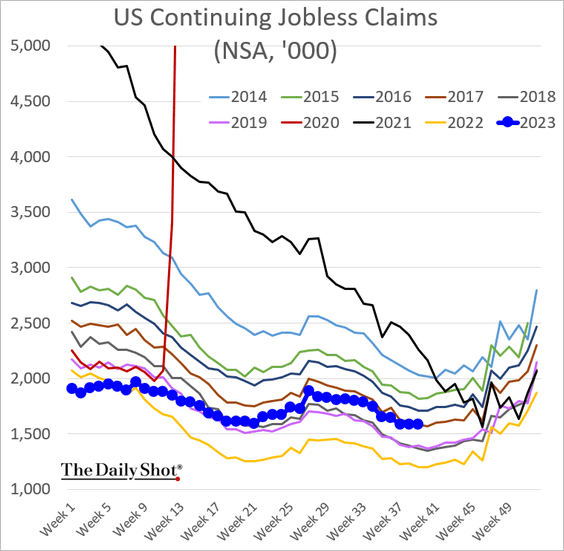
But continuing claims remain elevated.
——————–
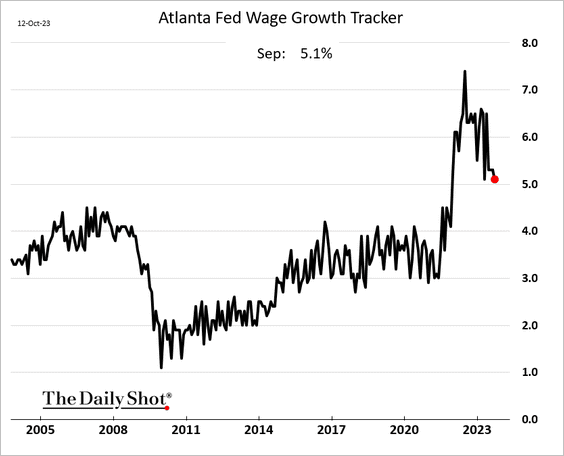
4. The Atlanta Fed’s wage growth tracker eased in September but remained above 5%.
5. US housing inventories remain tight.
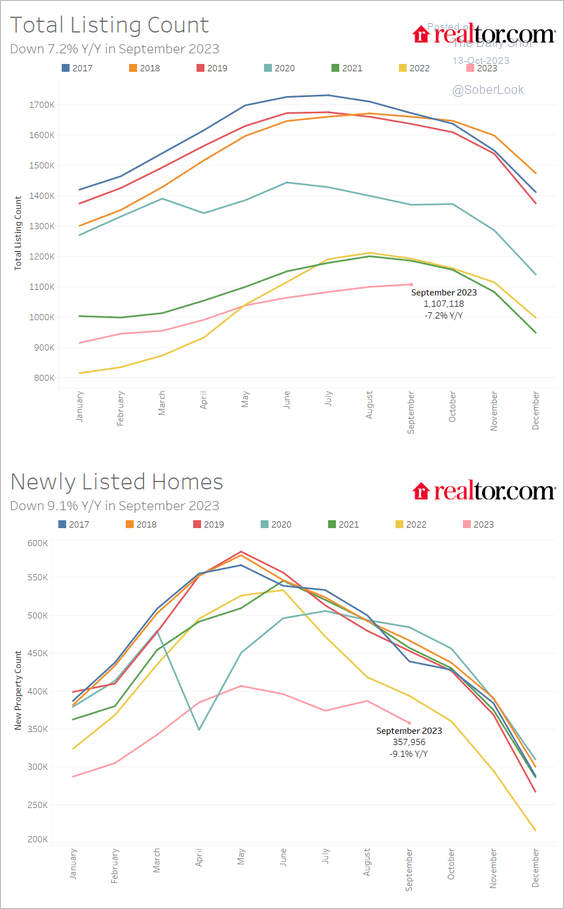 Source: realtor.com
6. The average interest rate on government debt is projected to stay below nominal GDP growth until about 2038.
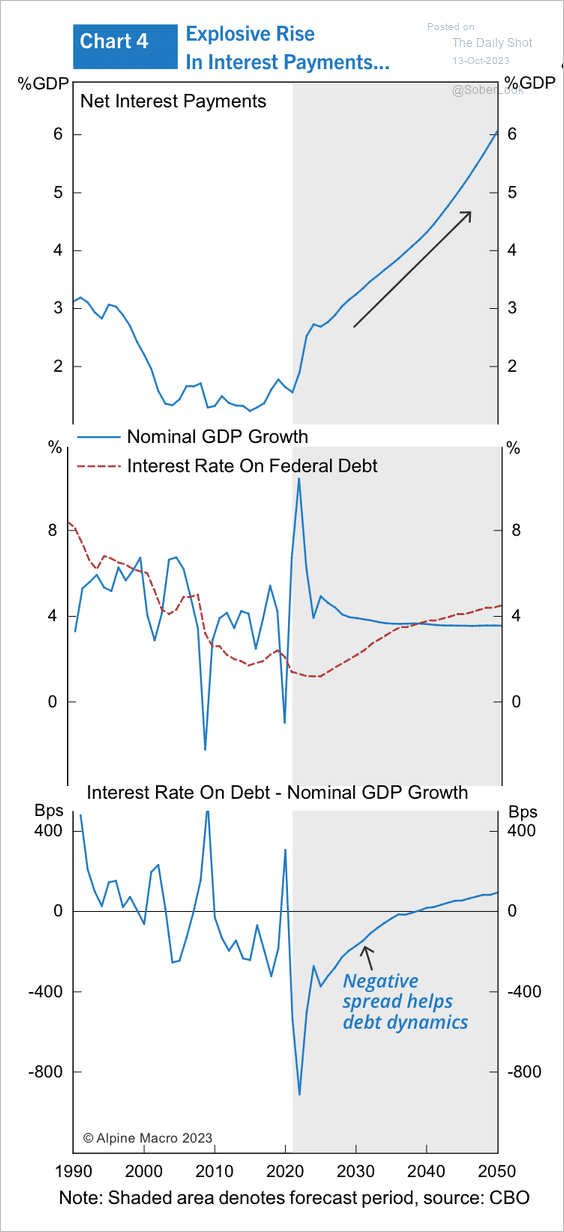 Source: Alpine Macro
Back to Index
The United Kingdom
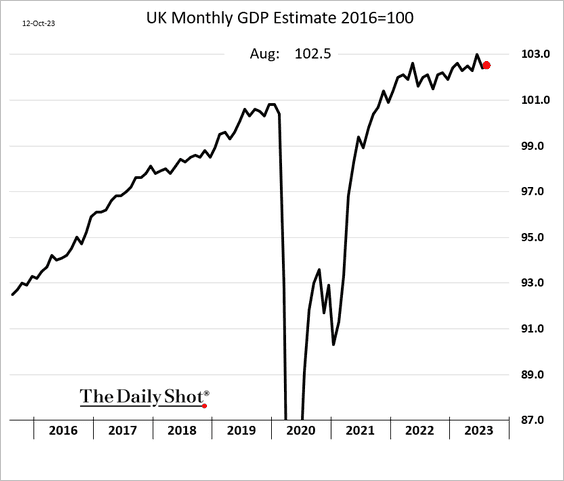
1. The monthly GDP index was up slightly in August.
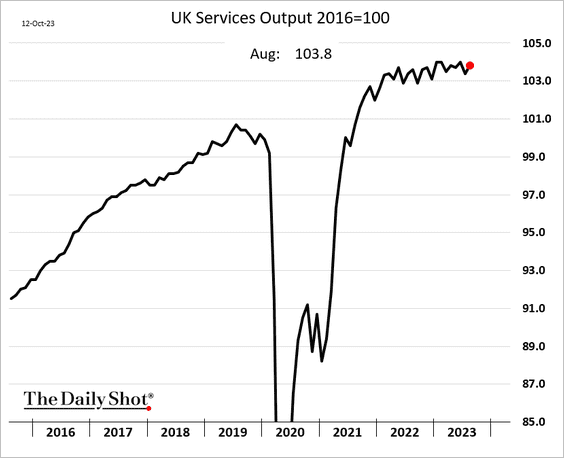
• Services activity improved.
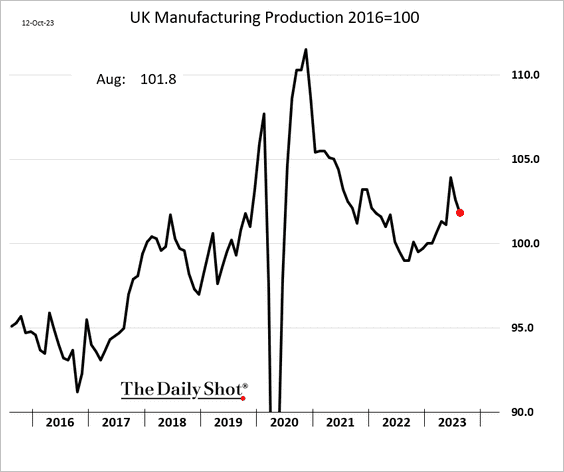
But manufacturing output declined again.
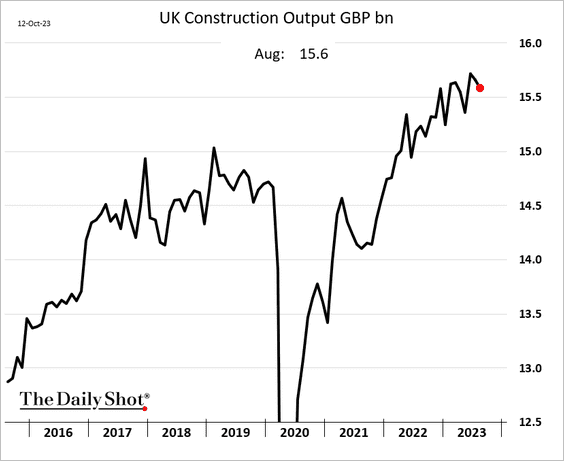
Construction output also eased.
——————–
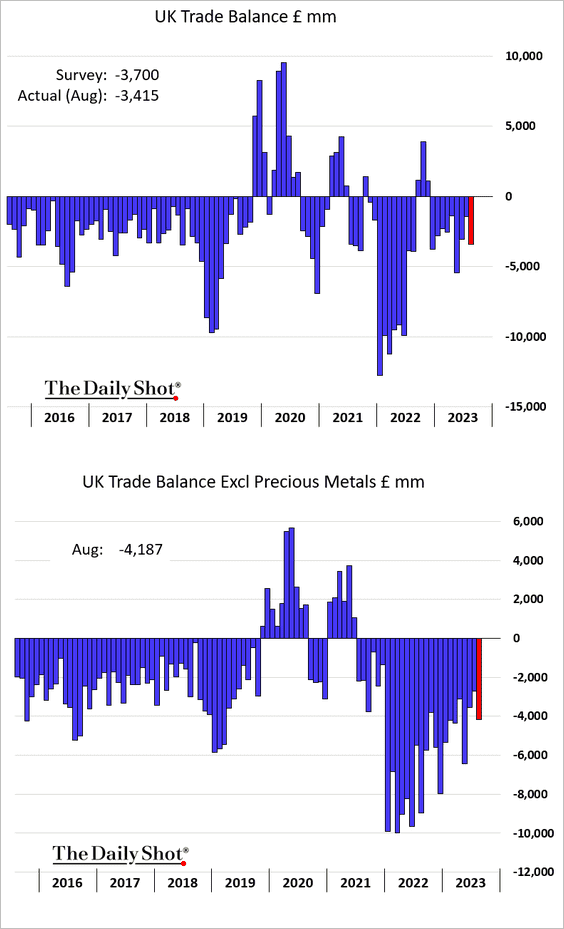
2. The trade deficit was a bit narrower than expected.
Back to Index
Europe
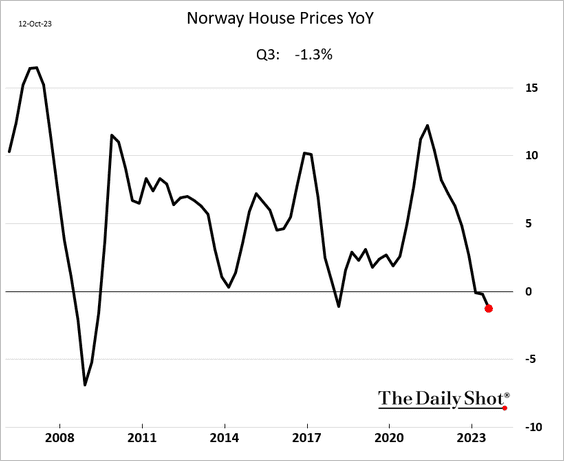
1. Norway’s house price declines deepened last quarter.
2. Here is a look at the EU’s reduction in electricity demand.
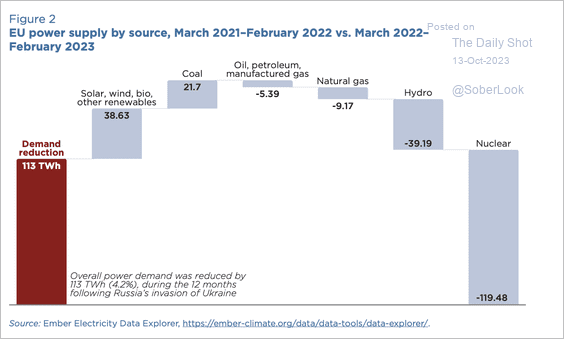 Source: PIIE Read full article
Back to Index
Asia-Pacific
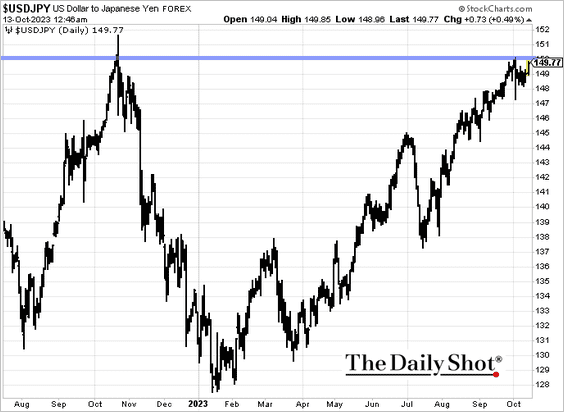
1. Dollar-yen is trading just below 150 as traders watch for signs of another F/X intervention from Japan.
2. Economists downgraded South Korea’s growth forecasts for next year.
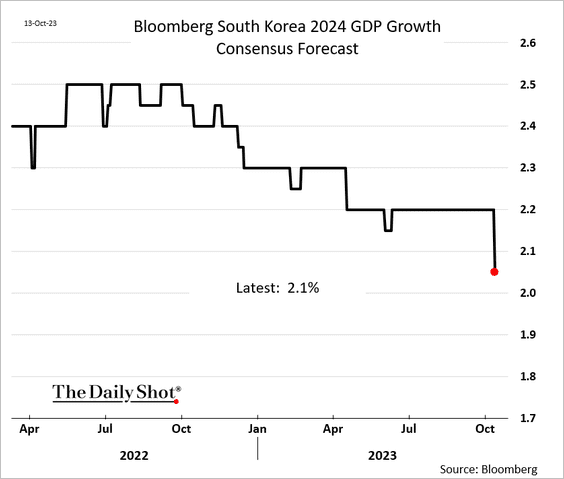
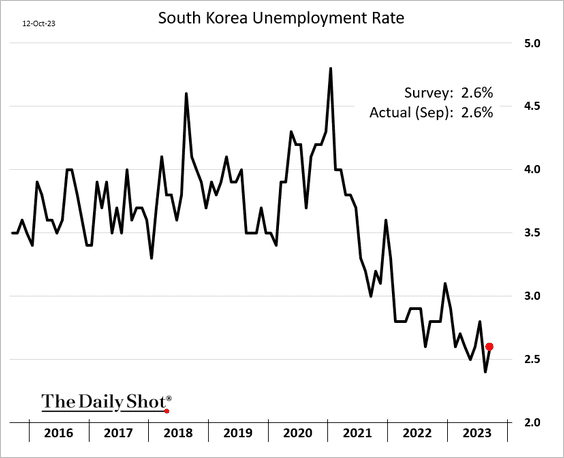
South Korean unemployment remains very low.
——————–
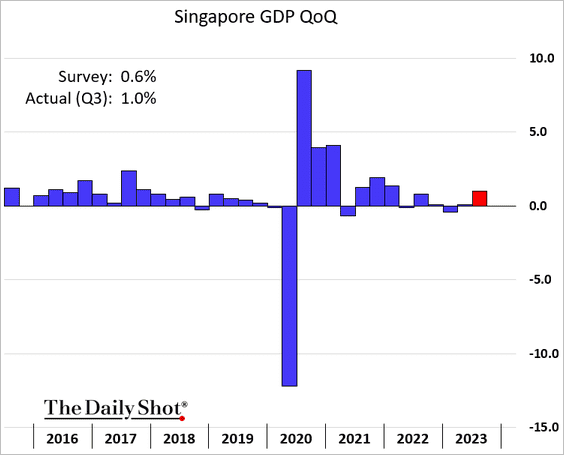
3. Singapore’s Q3 GDP growth was stronger than expected.
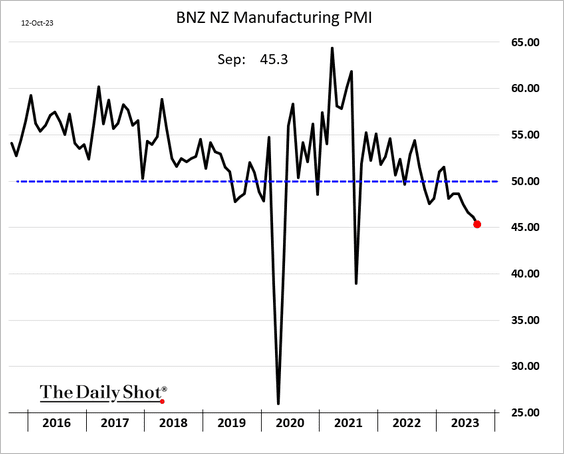
4. New Zealand’s manufacturing contraction accelerated last month.
Back to Index
China
1. China’s CPI surprised to the downside, hitting zero on a year-over-year basis in September.
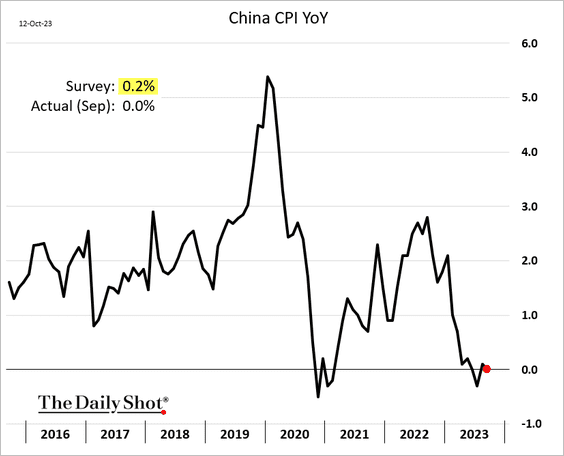
 Source: Reuters Read full article
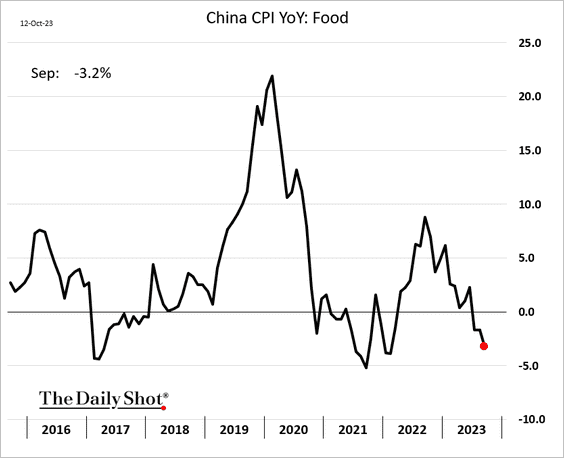
The weakness was driven by falling food prices.
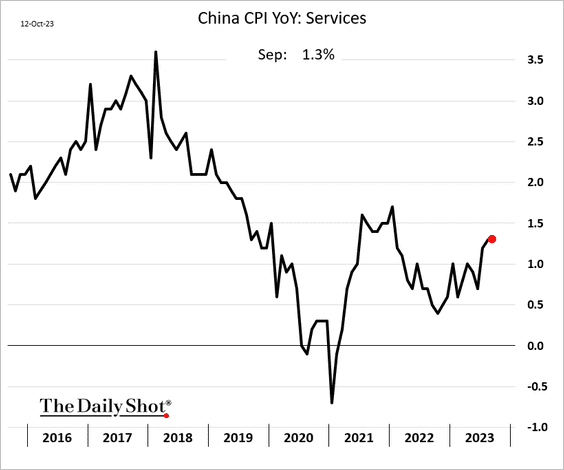
• Core inflation held steady, …
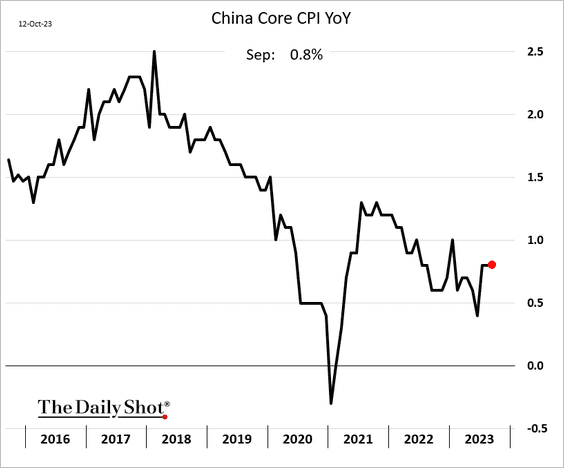
… with services CPI edging higher.
——————–
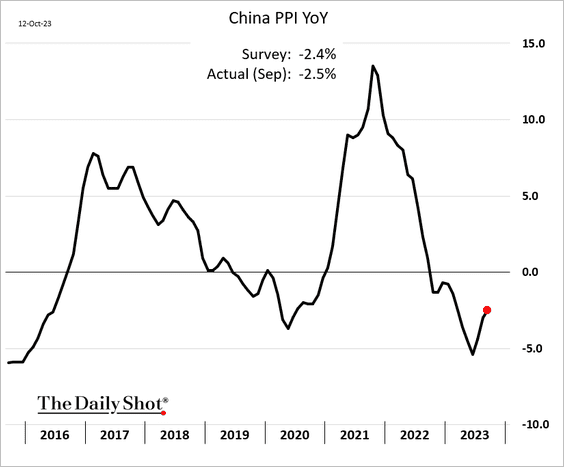
2. The PPI remains negative on a year-over-year basis.
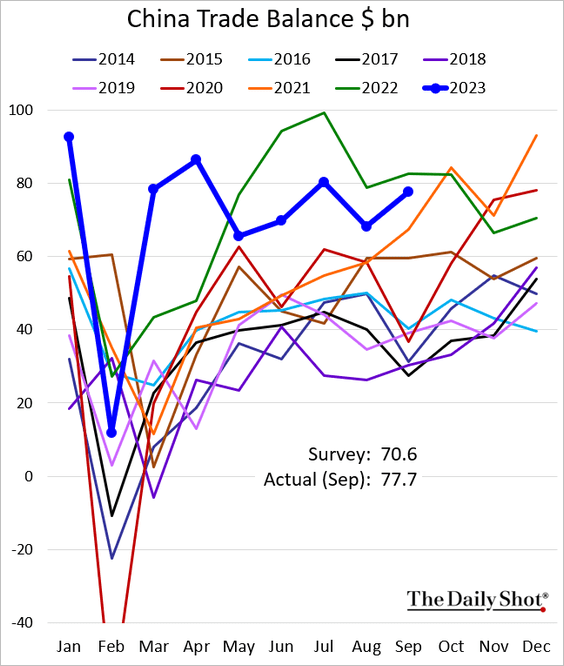
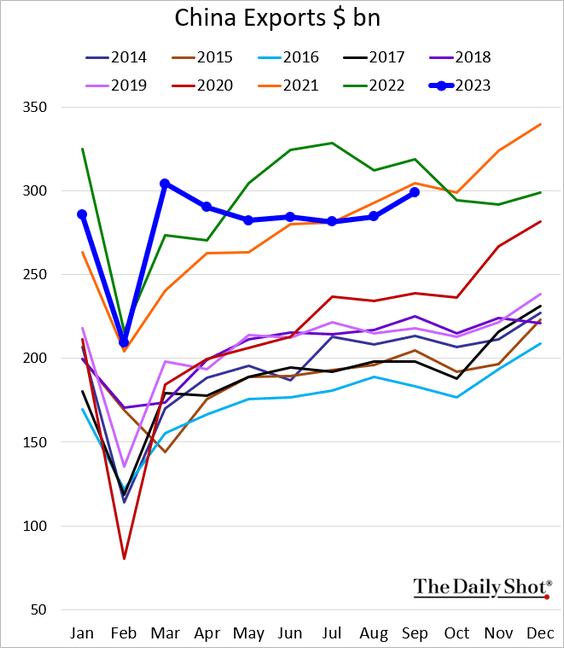
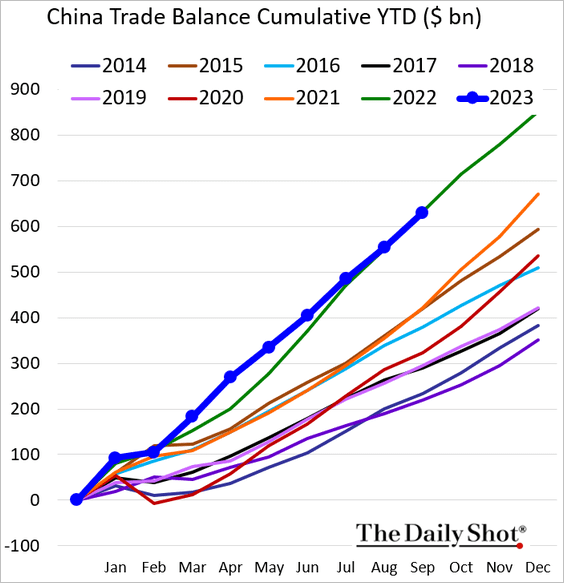
3. Exports improved but remained below last year’s levels.
 Source: South China Morning Post Read full article
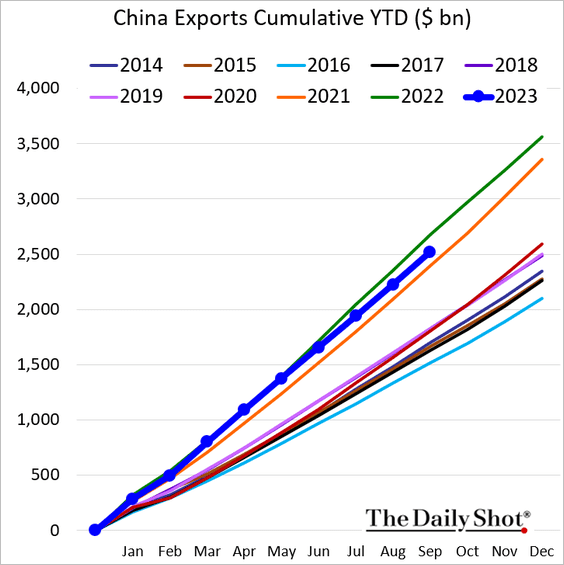
Here are the cumulative year-to-date trends.
• The trade surplus was still below 2021 levels.
——————–
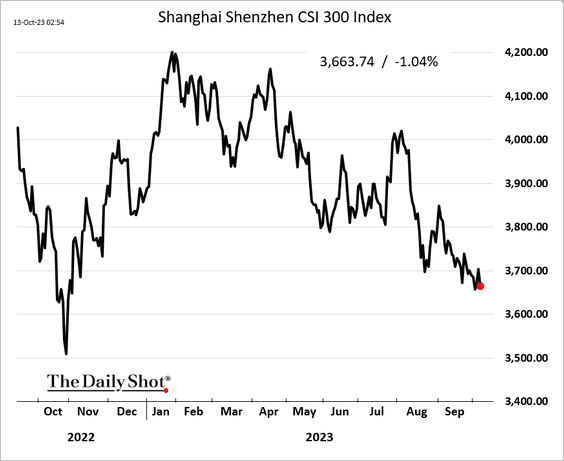
4. What will it take to prop up the stock market?
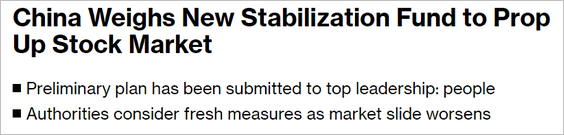 Source: @markets Read full article
Earnings momentum remains strong in the consumer and communication services sectors.
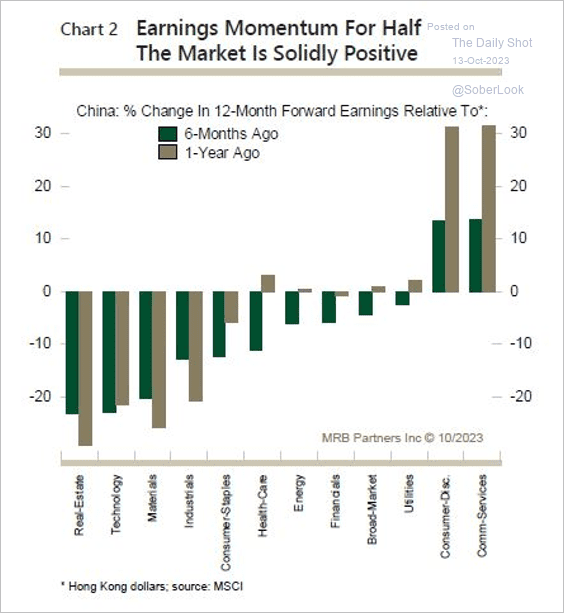 Source: MRB Partners
Back to Index
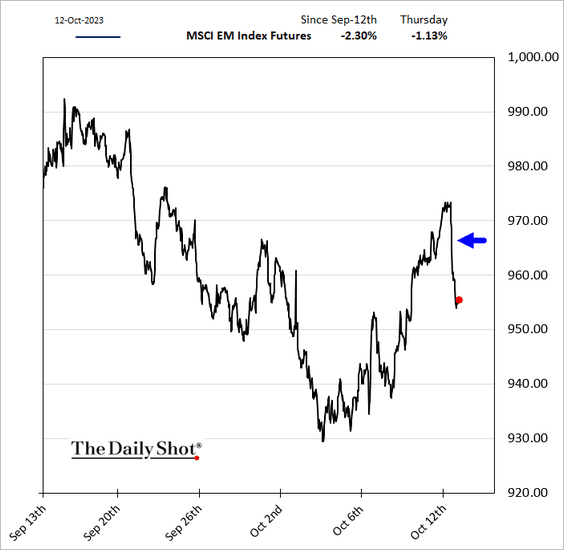
Emerging Markets
1. India’s industrial production was 10% above last year’s level.
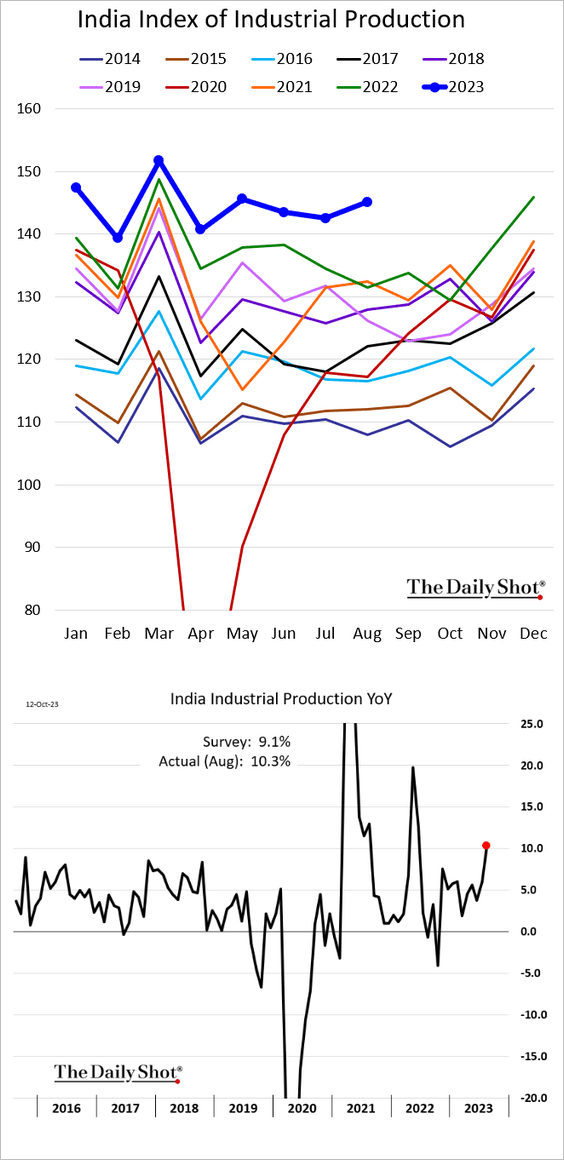
 Source: Reuters Read full article
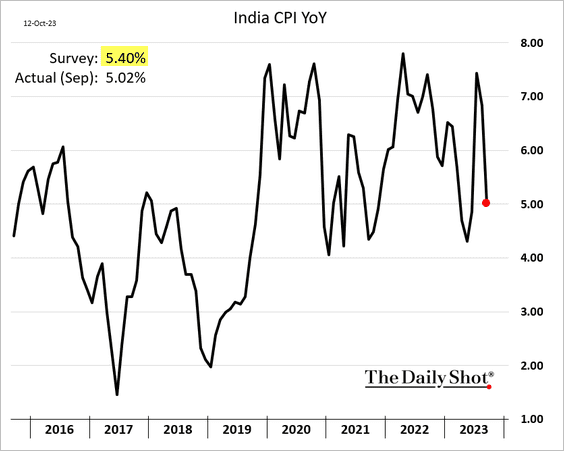
• The CPI surprised to the downside.
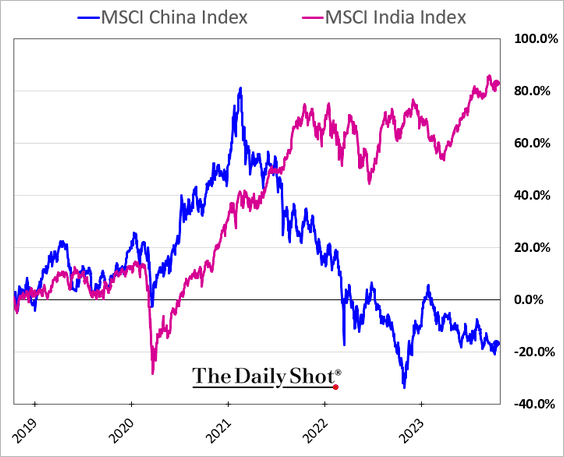
• Indian shares continue to widen their outperformance vs. China.
——————–
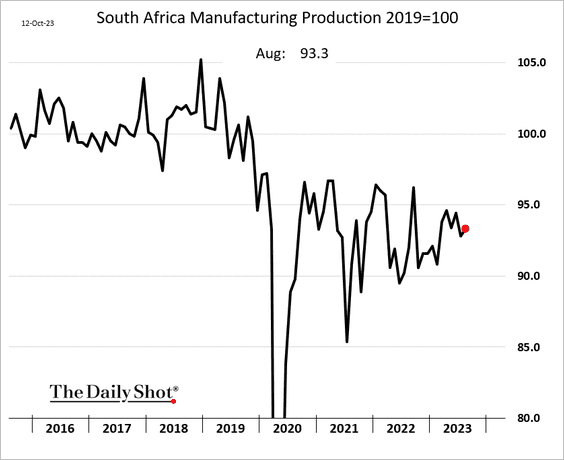
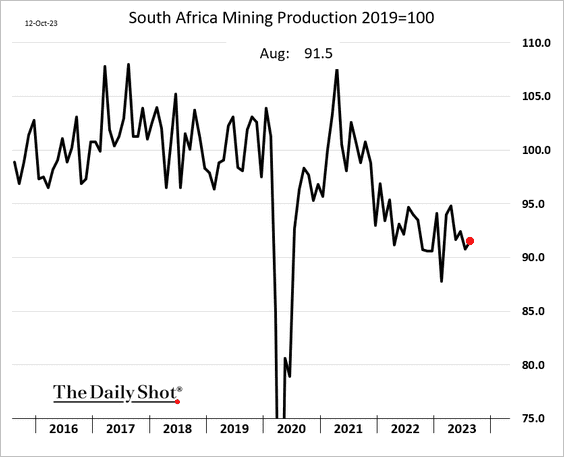
2. South Africa’s manufacturing and mining output increased modestly in August.
——————–
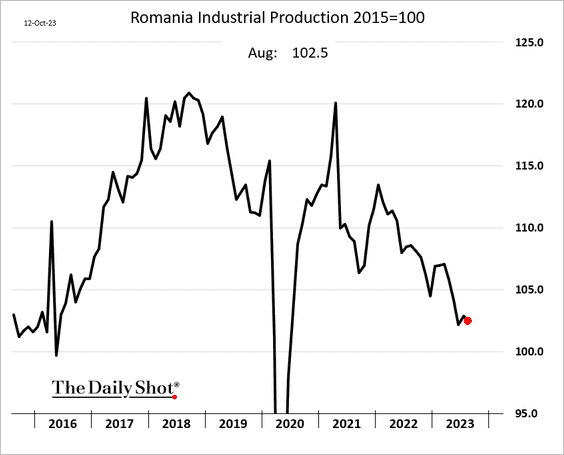
3. Romania’s industrial production continues to trend lower.
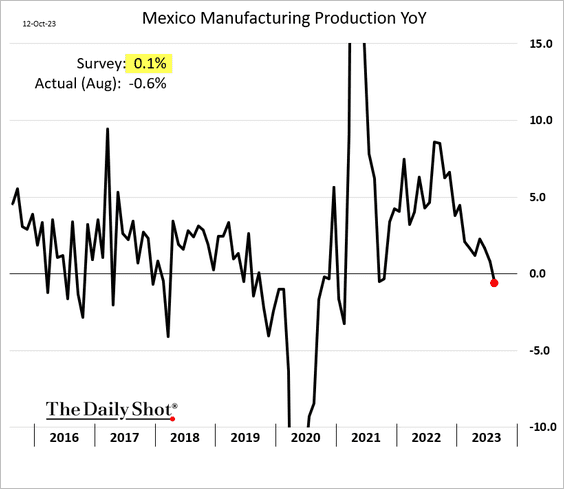
4. Mexican manufacturing output unexpectedly declined in August (on a year-over-year basis).
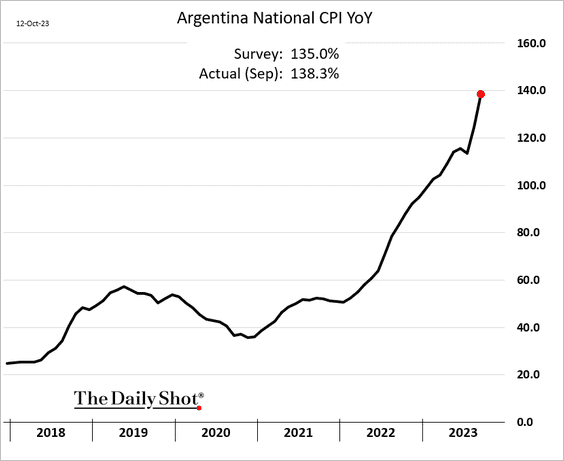
5. Argentina’s CPI is nearing 140%.
Back to Index
Commodities
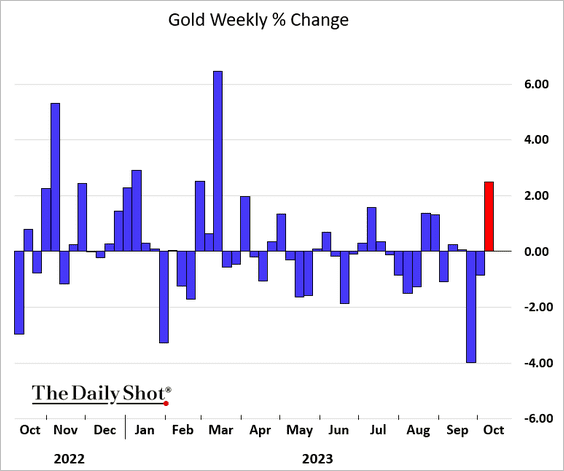
1. It was a good week for gold, bolstered by the unfolding developments in the Middle East
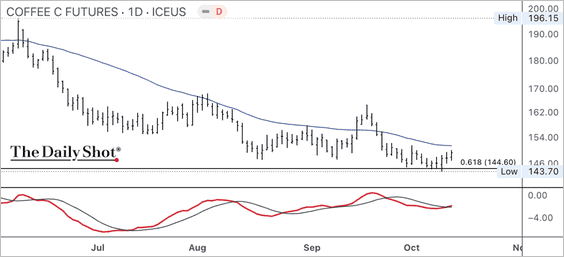
2. The front-month coffee futures price is holding short-term support with improving momentum.
Back to Index
Energy
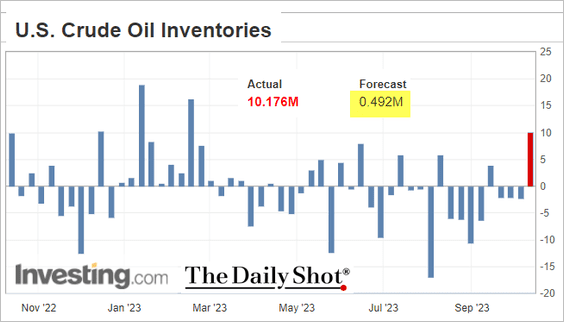
1. US crude oil inventories surged last week.
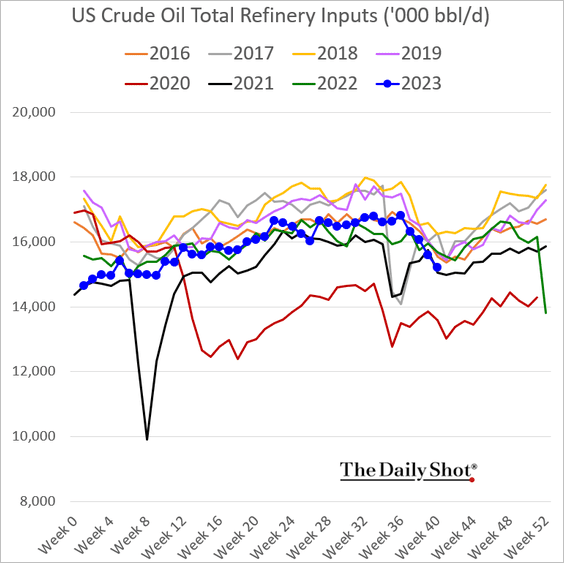
• Refinery runs are at 2021 levels.
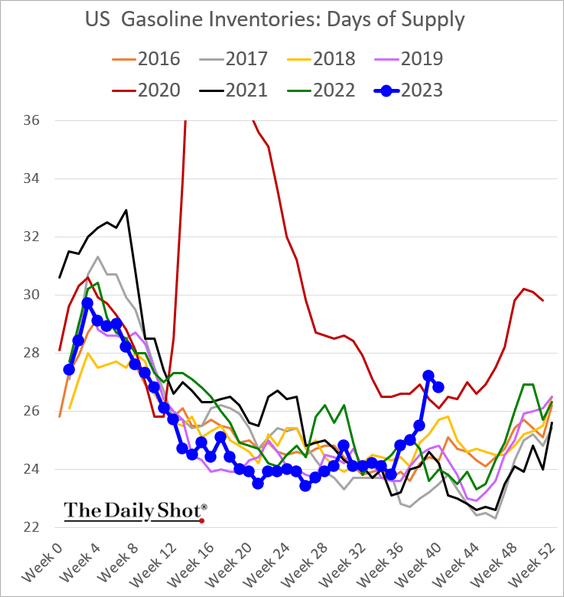
• Gasoline demand rebounded.
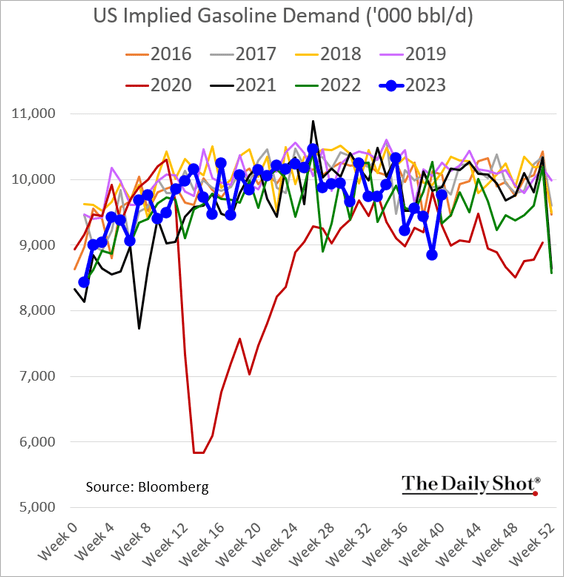
But gasoline inventories remain elevated when measured in days of supply.
——————–
2. European natural gas prices continue to surge, …
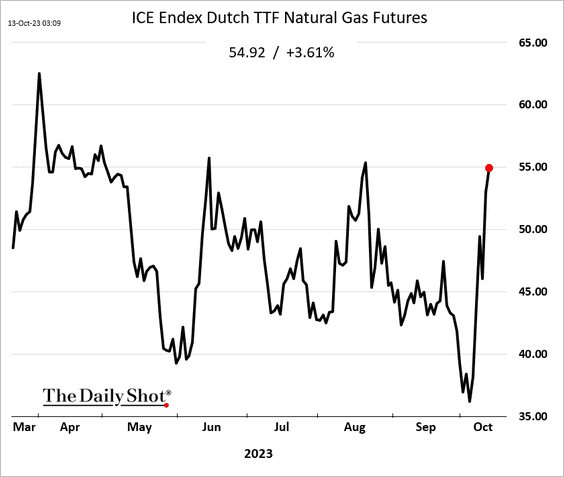
… despite record-high inventories.
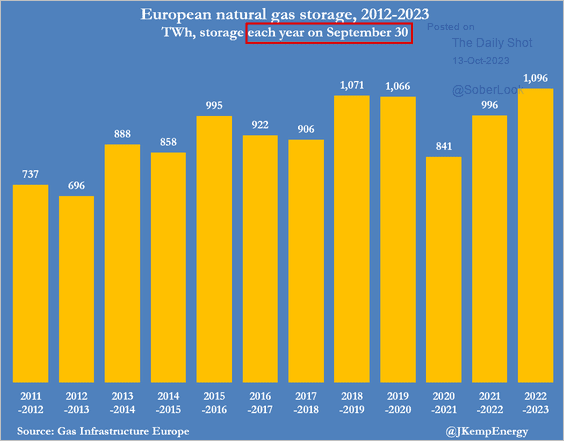 Source: @JKempEnergy
Back to Index
Equities
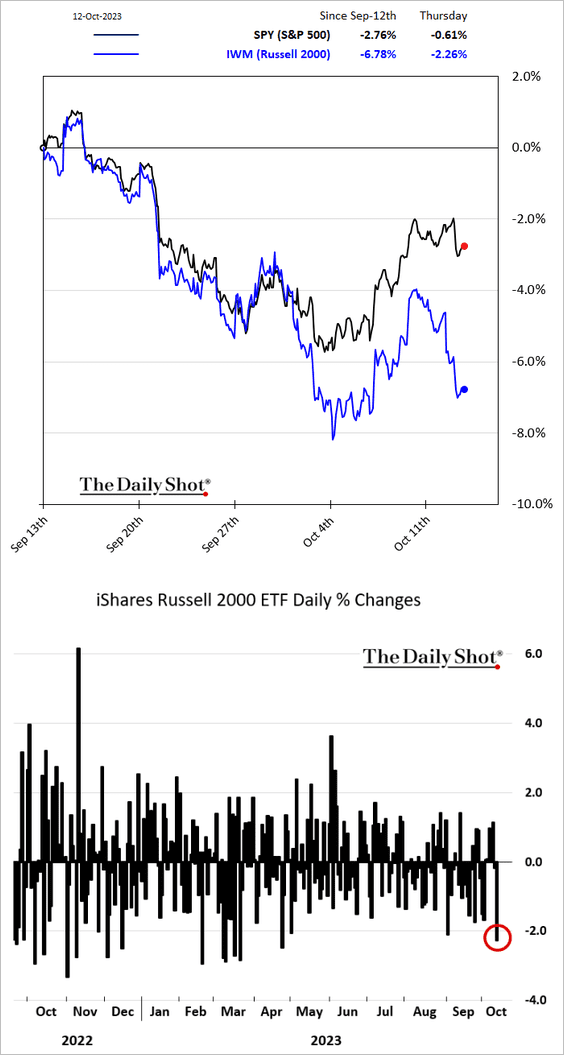
1. The hotter-than-expected CPI report and a rebound in bond yields spelled trouble for small caps.
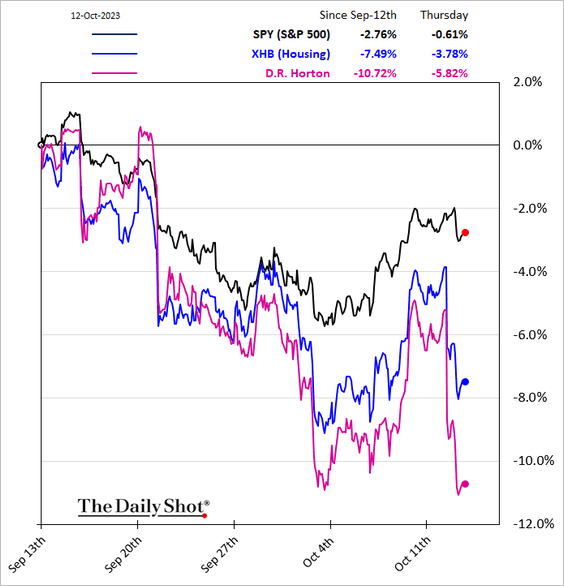
Housing stocks also took a hit.
——————–
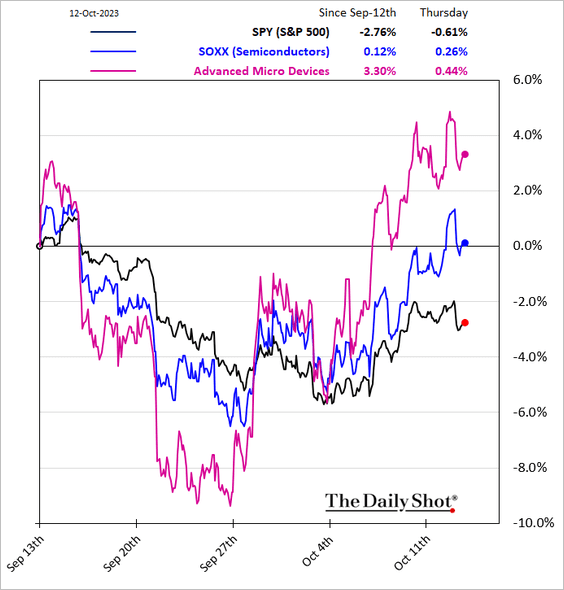
2. Semiconductor shares have been outperforming.
3. Bullish sentiment is in the bottom decile for the first time in almost a year.
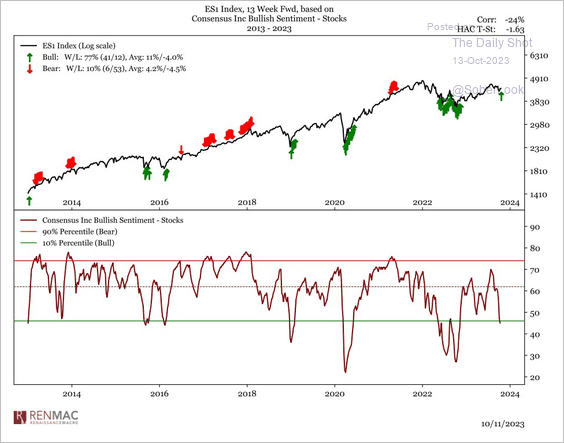 Source: @RenMacLLC
4. A 19% gain over the next 12 months? This forecast is based on Goldman’s target levels for S&P 500 companies.
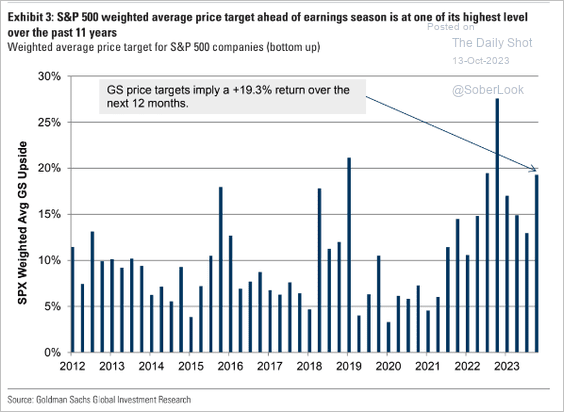 Source: Goldman Sachs; @MikeZaccardi
5. Generally, equities are negatively correlated to fixed income volatility (MOVE index).
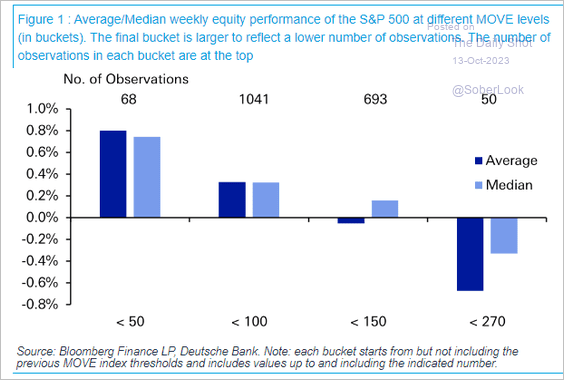 Source: Deutsche Bank Research
6. Options trading has overtaken futures.
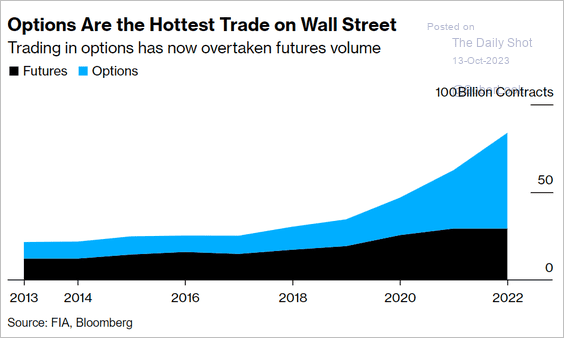 Source: @markets Read full article
Back to Index
Credit
1. Here is a look at cumulative fund flows for US corporate credit markets.
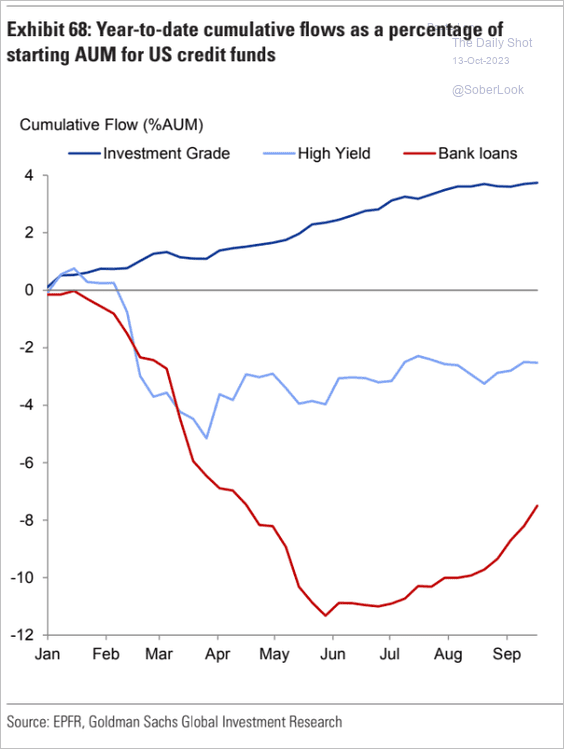 Source: Goldman Sachs
2. Growth in private credit has been outpacing traded markets.
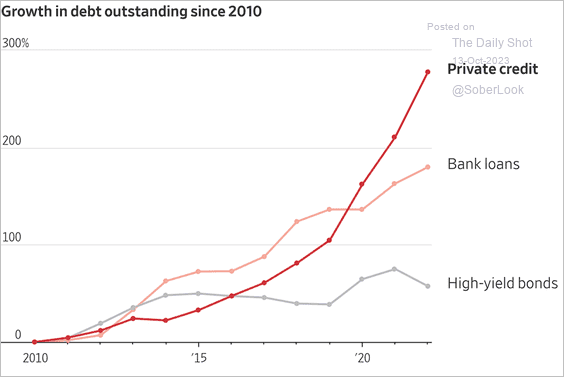 Source: @WSJ Read full article
• Here is the maturity wall for private credit.
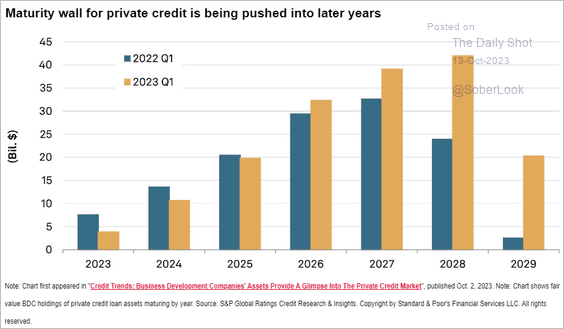 Source: S&P Global Ratings
——————–
3. Interest coverage ratios continue to trend lower.
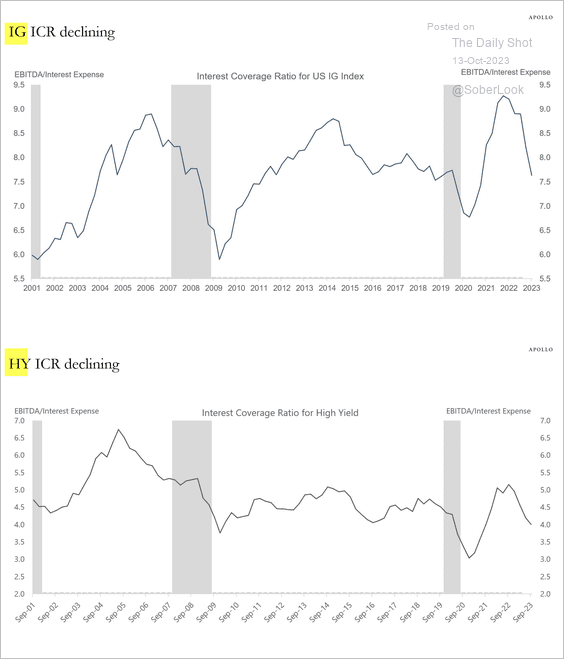 Source: Torsten Slok, Apollo
Back to Index
Rates
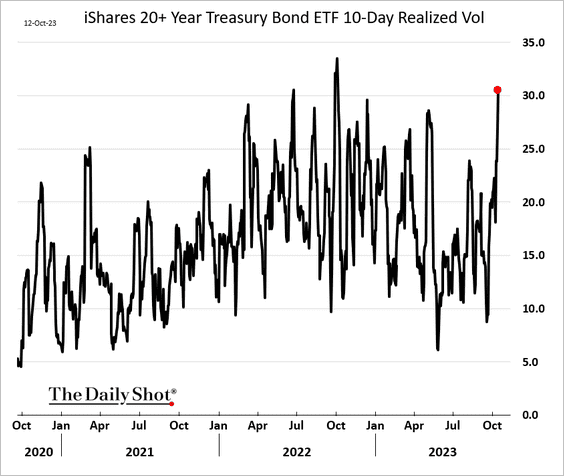
1. Realized volatility in longer-dated Treasuries surged in recent days.
2. Stagflation environments are typically negative for Treasuries.
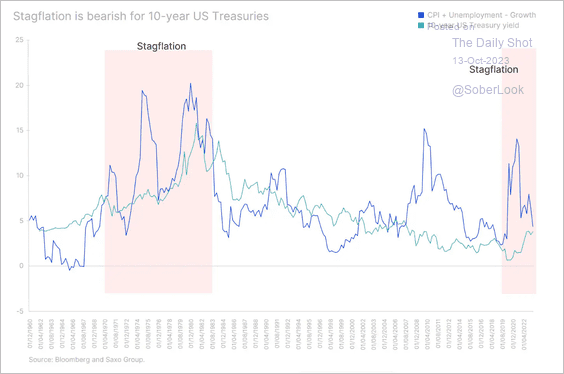 Source: Saxo Bank Read full article
Back to Index
Global Developments
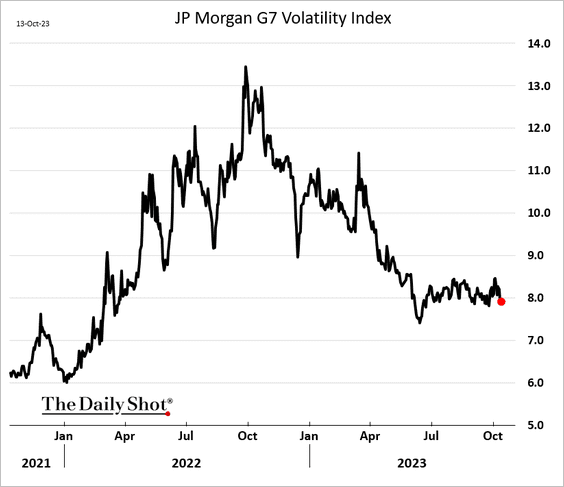
1. Currency market implied volatility remains subdued despite increased geopolitical risks.
2. Here is a look at inflation and real wage growth in the 1970s.
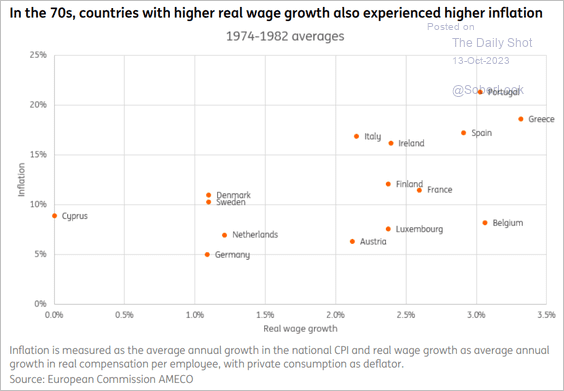 Source: ING
——————–
Food for Thought
1. US labor force participation rates:
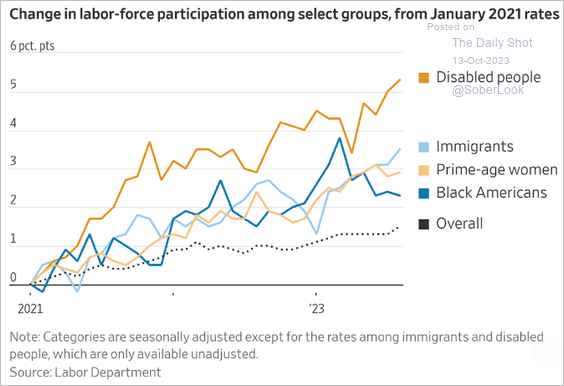 Source: @WSJ Read full article
2. Music piracy:
 Source: Statista
3. Global per capita meat consumption:
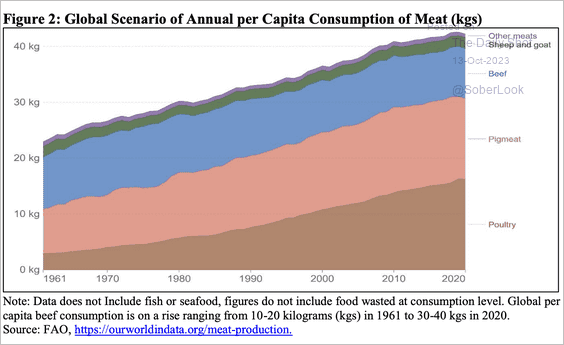 Source: USDA Read full article
4. Causes of death globally:
 Source: Our World in Data Read full article
5. Terrorist activity and arrests in Europe:
 Source: Statista
6. Cruise tourism:
 Source: @chartrdaily
7. Plans to travel to a foreign country for vacation:
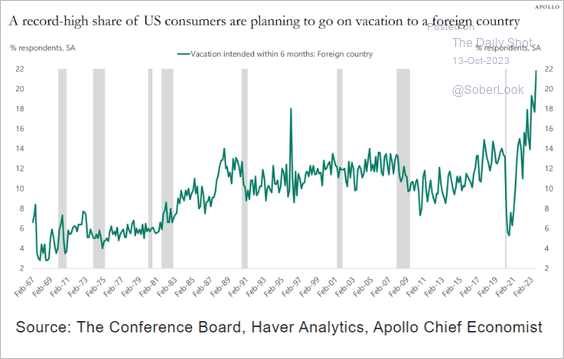 Source: Torsten Slok, Apollo
8. GOP 2024 presidential nomination probabilities in the betting markets:
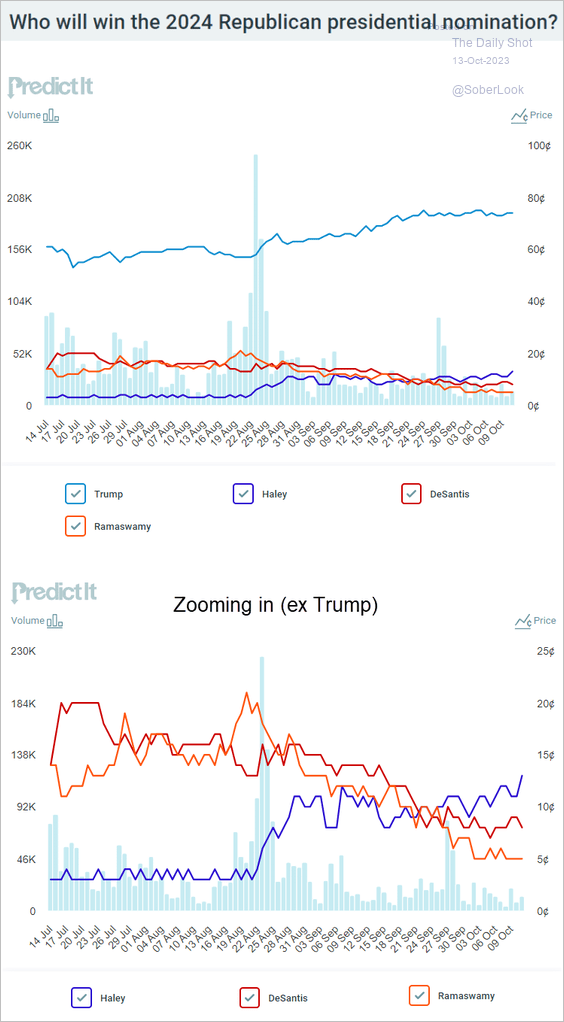 Source: @PredictIt
9. New NFL fans:
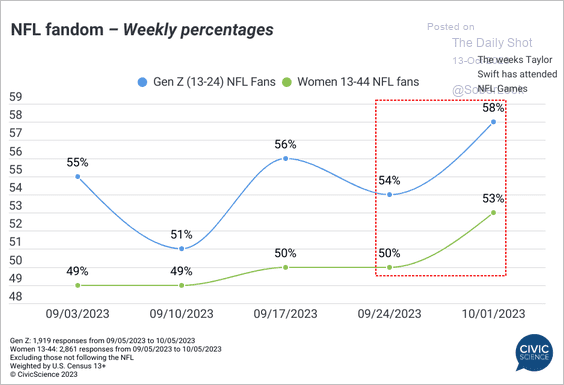 Source: @CivicScience Read full article
——————–
Back to Index