
The Daily Shot: 16-Oct-23
• The United States
• Europe
• China
• Emerging Markets
• Commodities
• Energy
• Equities
• Credit
• Rates
• Global Developments
• Food for Thought
The United States
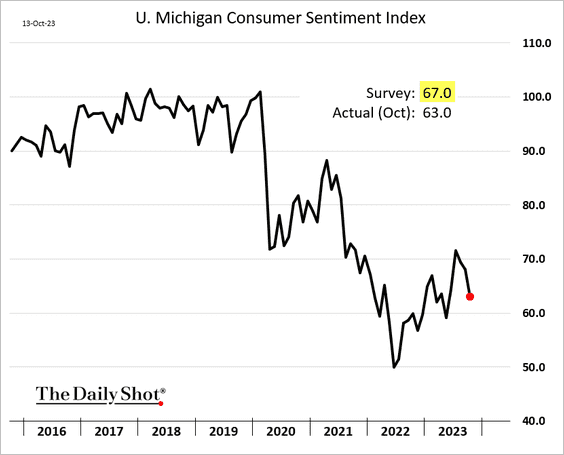
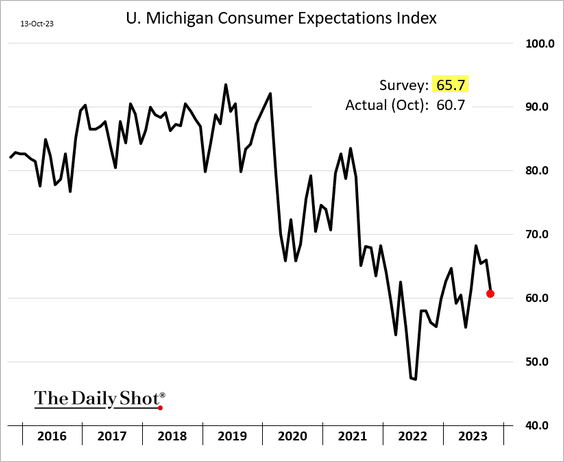
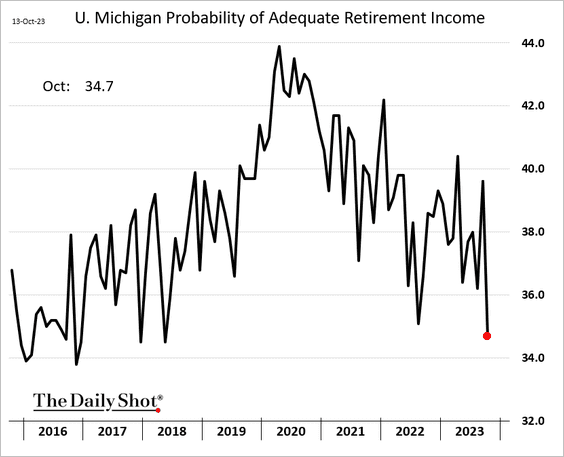
1. The October U. Michigan consumer sentiment indicator declined more than anticipated.
 Source: MarketWatch Read full article
• Here are the contributions to the index.
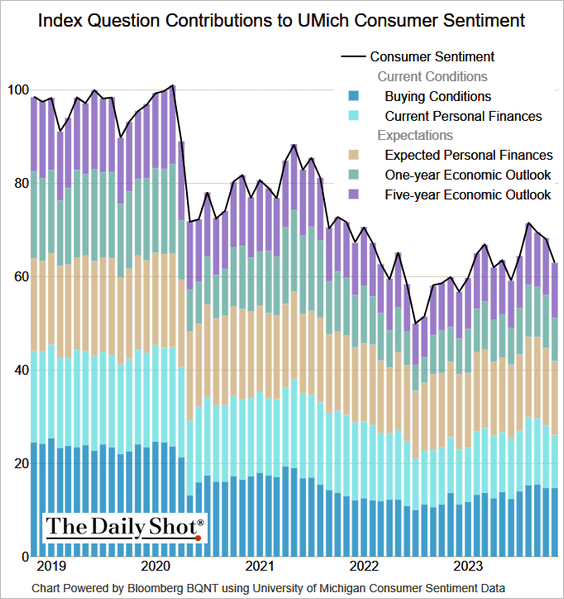 Source: @TheTerminal, Bloomberg Finance L.P.
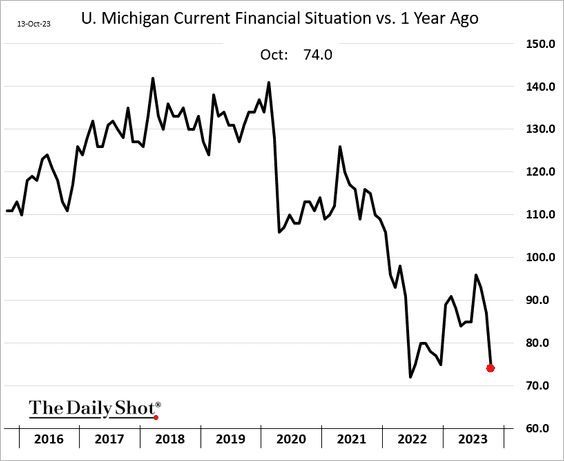
• The resumption of student loan payments, stock market volatility, and persistent inflation have left households feeling less confident about their financial situation (2 charts).
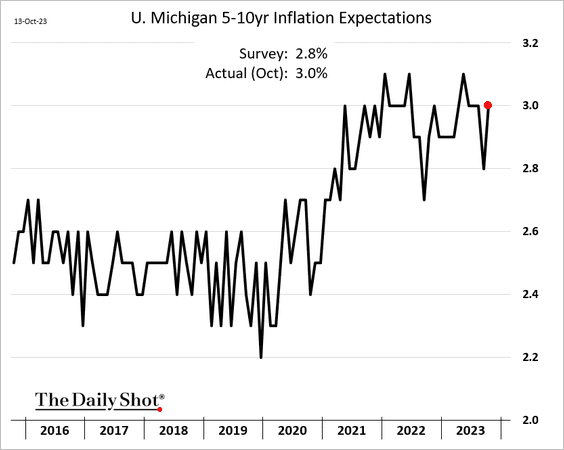
• Inflation expectations rose, topping forecasts.
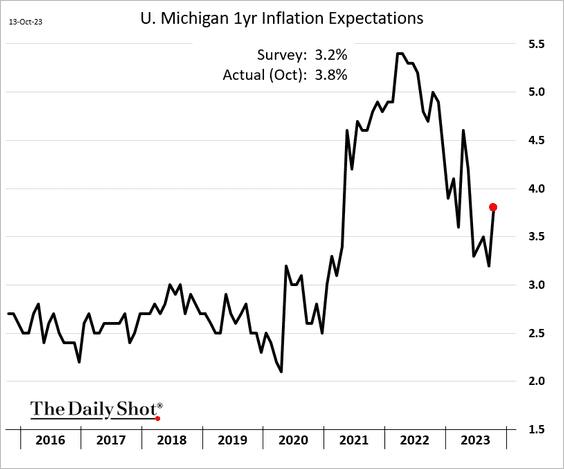
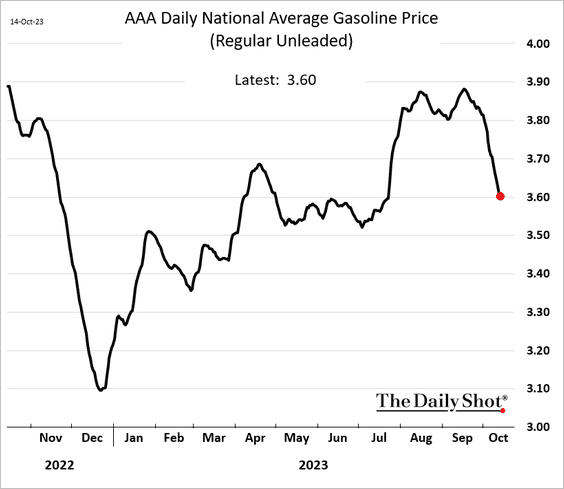
Will lower gasoline prices ease consumer anxiety?
——————–
2. Next, we have some updates on the labor market.
• More new entrants into the labor force are capping wage growth.
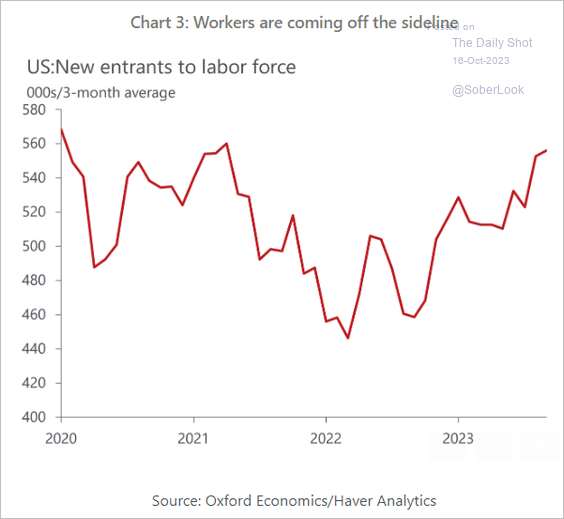 Source: Oxford Economics
• Sectors with the greatest COVID-era employment disruptions have seen the biggest job gains.
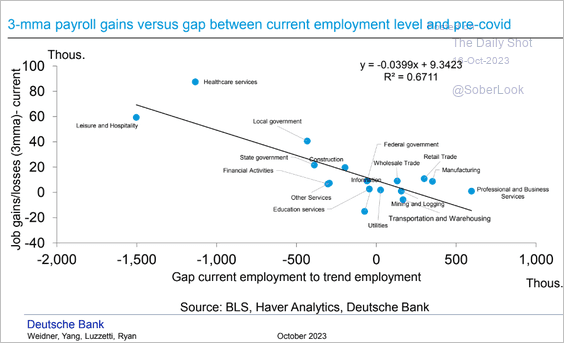 Source: Deutsche Bank Research
• The ADP private payrolls indicator has been a terrible predictor of the official nonfarm payrolls figures.
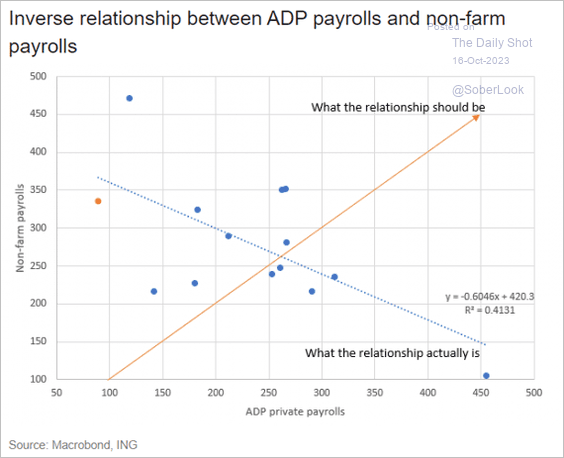 Source: ING
——————–
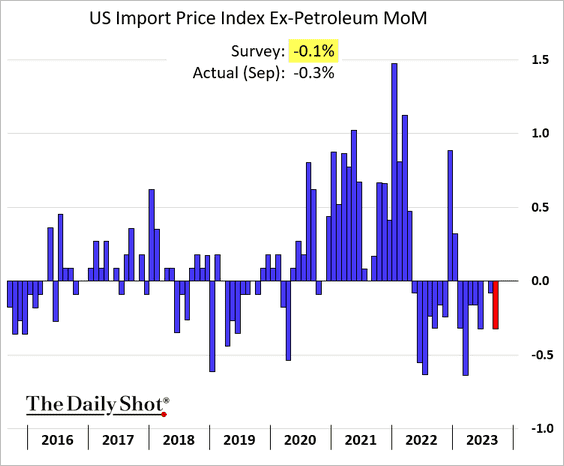
3. US import prices continue to ease, pulled lower by the recent US dollar strength.
4. Manufacturing conditions have improved alongside a steeper Treasury curve.
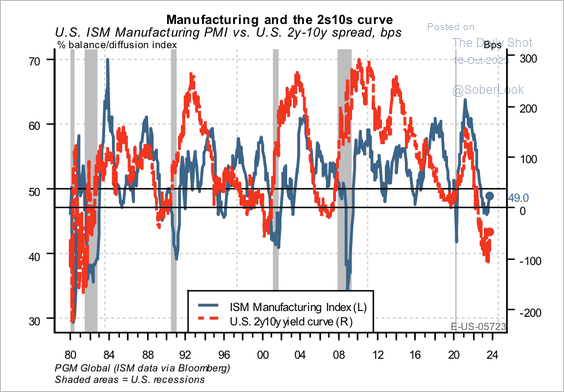 Source: PGM Global
The positive turn in the inventory cycle also signals an upswing in manufacturing activity.
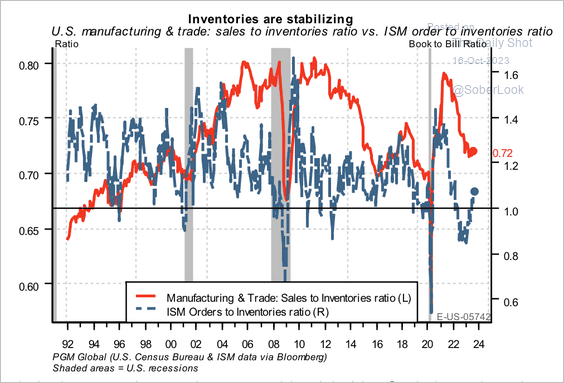 Source: PGM Global
——————–
5. Key recession indicators are still within the historical range of lags.
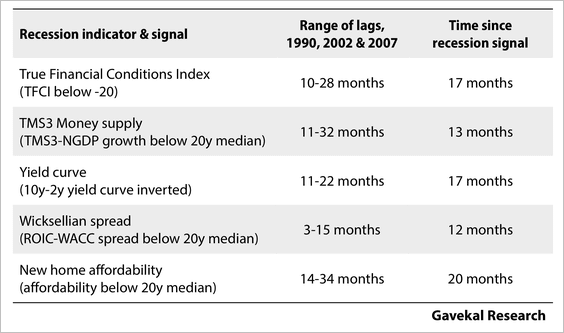 Source: Gavekal Research
6. Response rates to key official economic surveys have been trending lower.
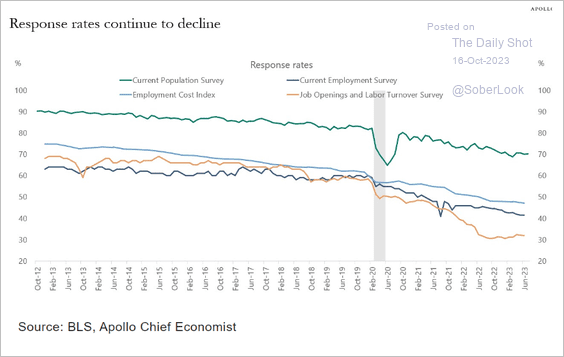 Source: Torsten Slok, Apollo
Back to Index
Europe
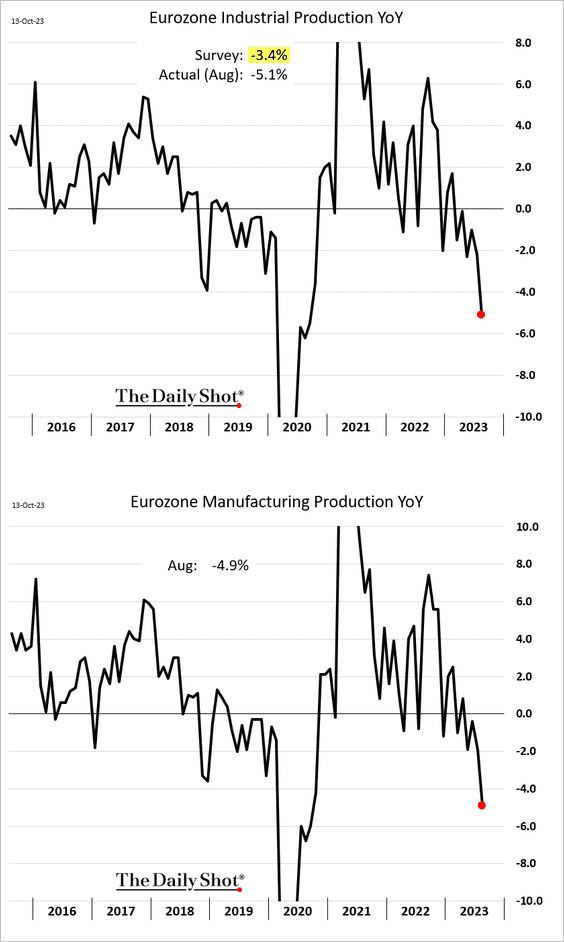
1. Euro-area industrial production edged higher in August, although manufacturing output barely budged from the lowest levels since 2021.
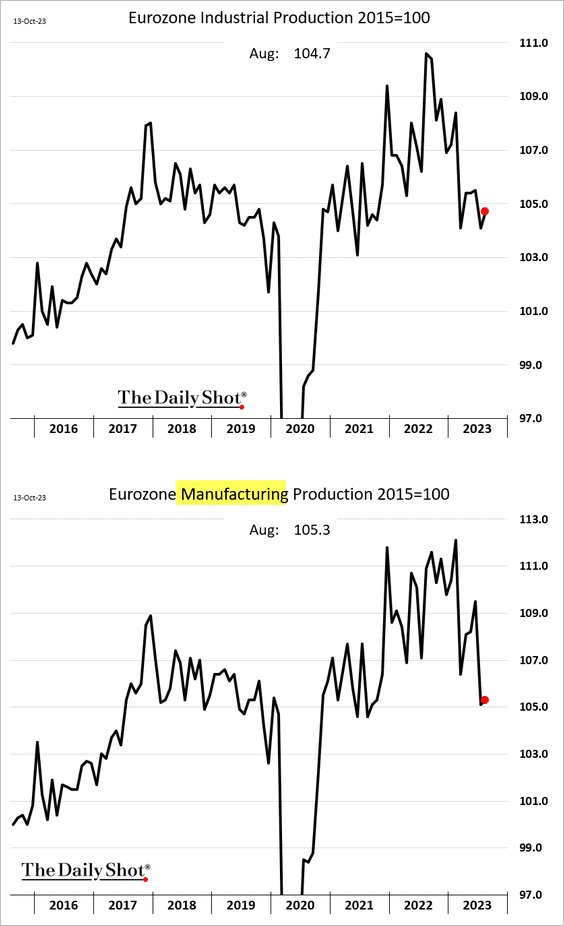
Base effects resulted in large declines on a year-over-year basis.
——————–
2. Here is a look at house price changes in Q2.
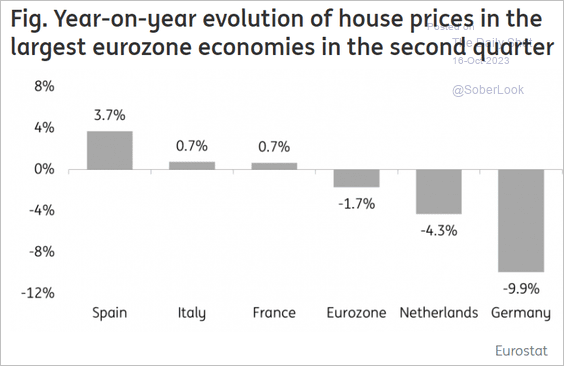 Source: ING
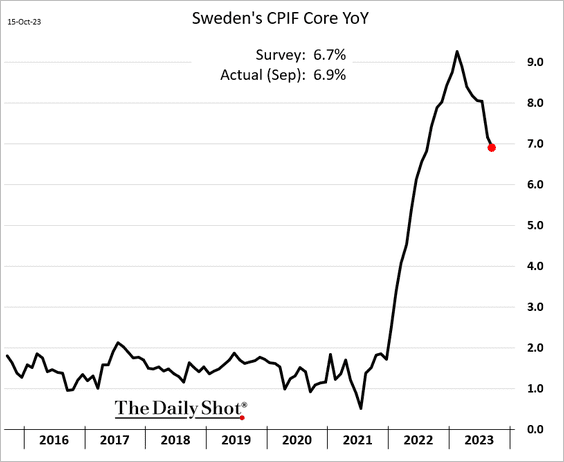
3. Sweden’s core inflation has been easing but was higher than expected last month.
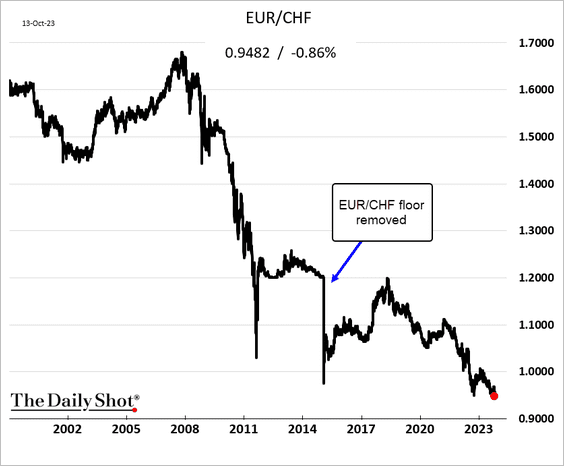
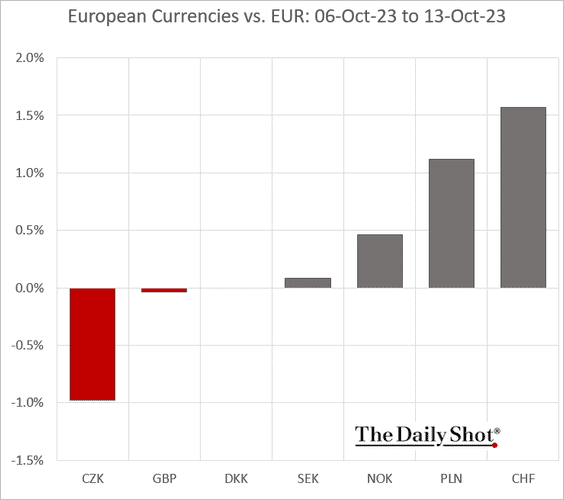
4. Tensions in the Middle East sent the Swiss franc to its strongest close on record vs. the euro.
——————–
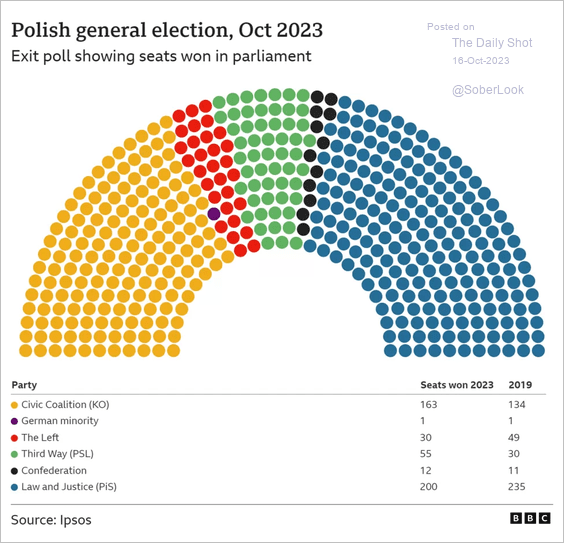
5. Here is a look at Poland’s exit polls.
 Source: BBC Read full article
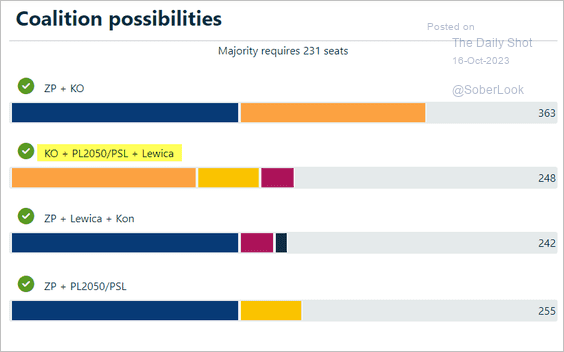
Poland’s ruling party, Zjednoczona Prawica (Law and Justice Party), is likely out. The second option in the chart below appears to be the most likely coalition.
 Source: PolitPro
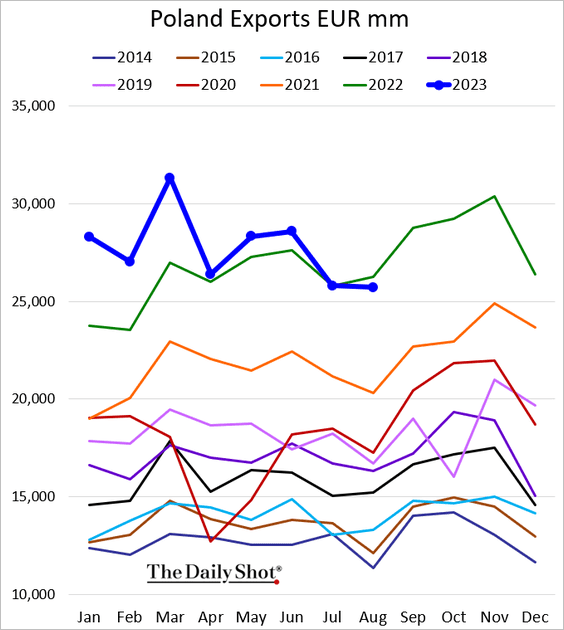
• Separately, Poland’s exports are slowing.
Back to Index
China
1. The PBoC left rates unchanged on the one-year facility but injected a much larger amount of liquidity than anticipated.
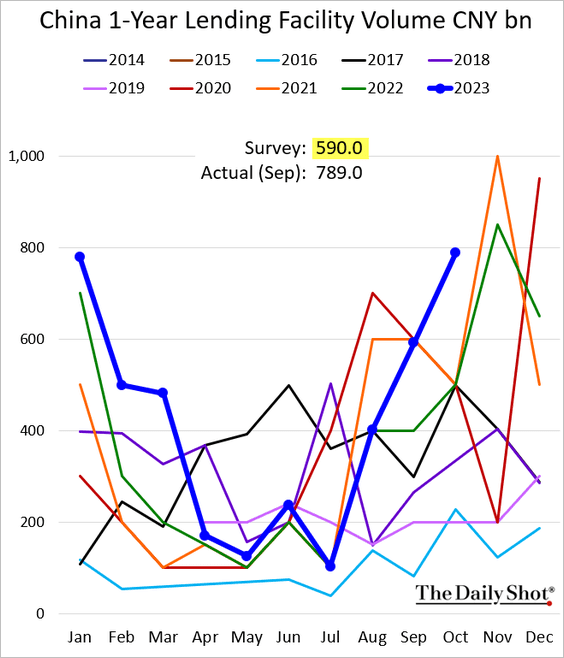
 Source: @markets Read full article
——————–
2. Bank loan growth was below 2022 levels last month, …
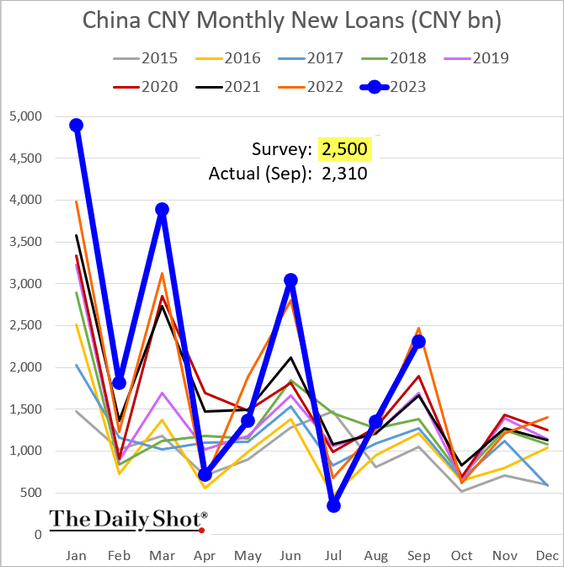
… but aggregate financing surged.
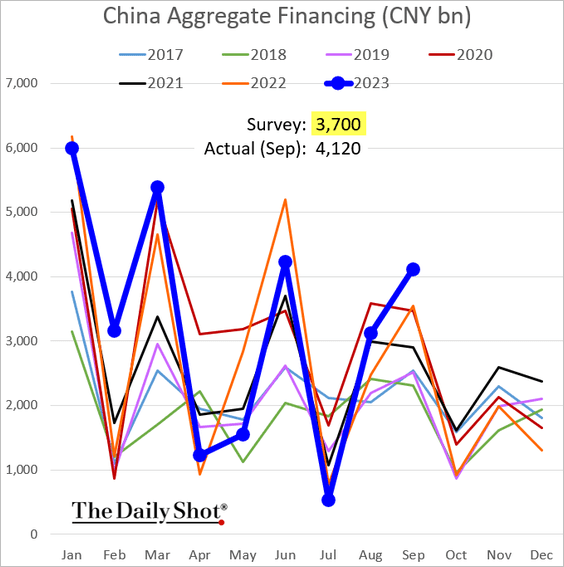
 Source: @markets Read full article
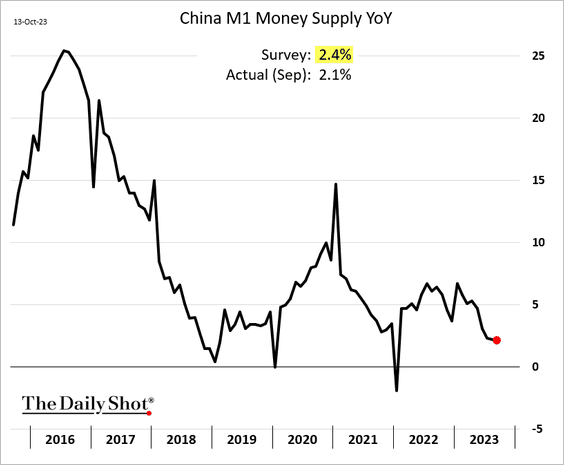
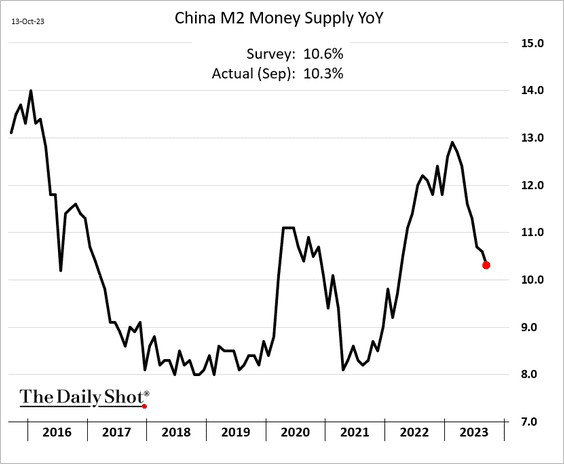
• Growth in China’s money supply continues to ease.
——————–
3. Capital outflows persist.
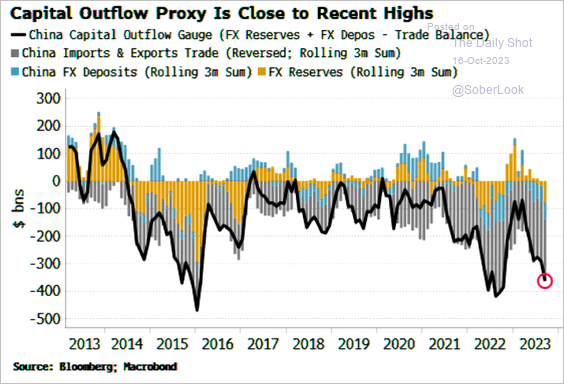 Source: Simon White, Bloomberg Markets Live Blog
Back to Index
Emerging Markets
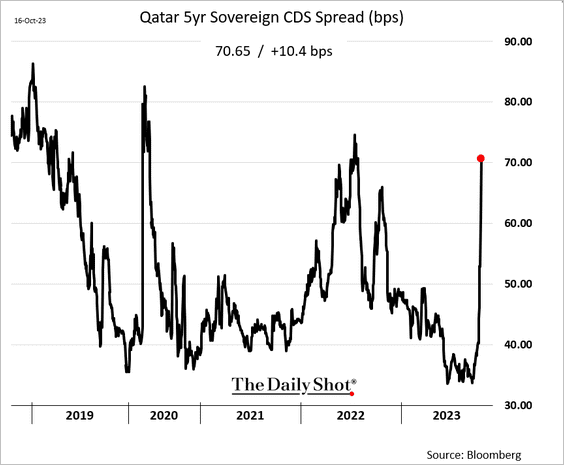
1. Sovereign CDS spreads have widened across the Middle East.
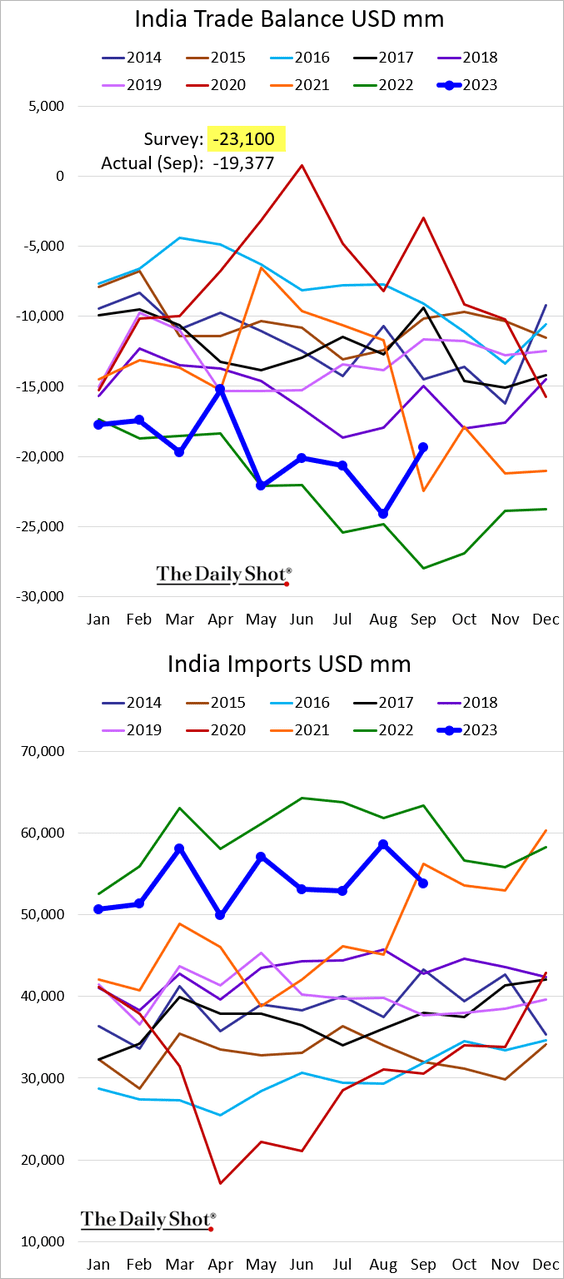
2. India’s trade deficit narrowed in September as imports slowed.
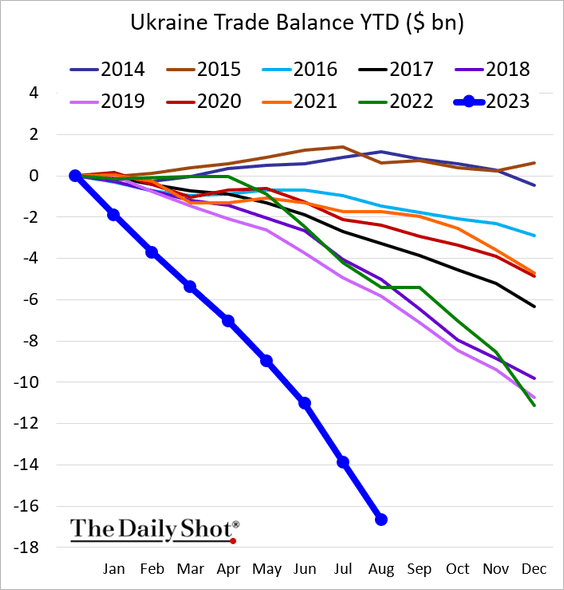
3. Ukraine’s trade deficit continues to widen.
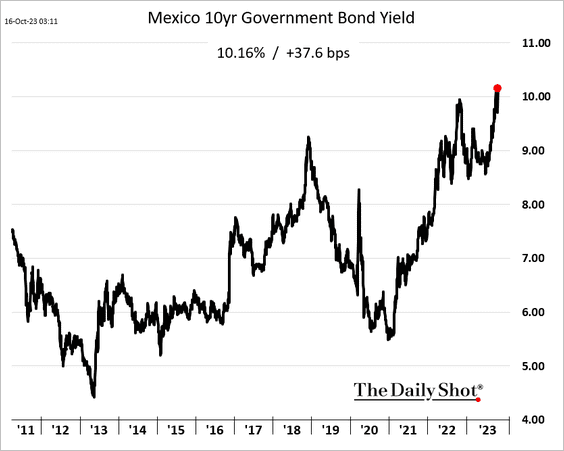
4. Mexico’s bond yields are hitting multi-year highs.
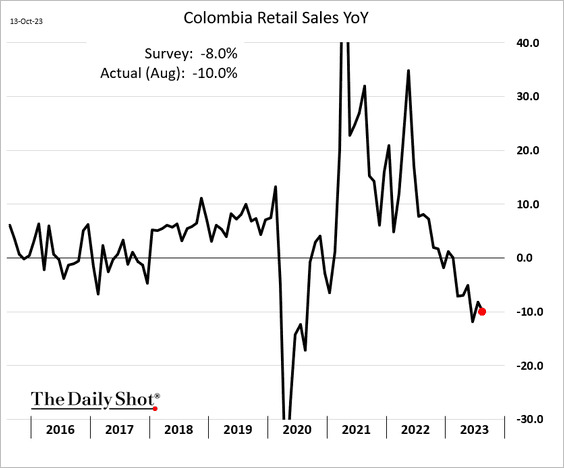
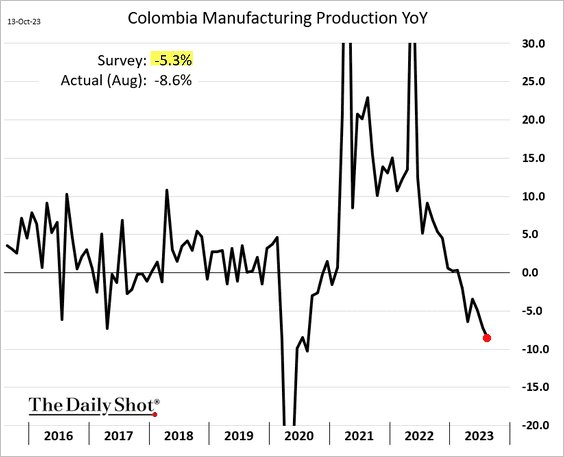
5. Colombia’s economic activity has been slowing (2 charts).
——————–
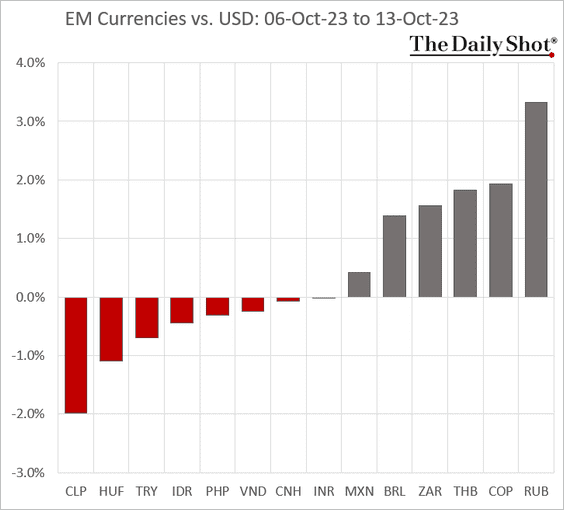
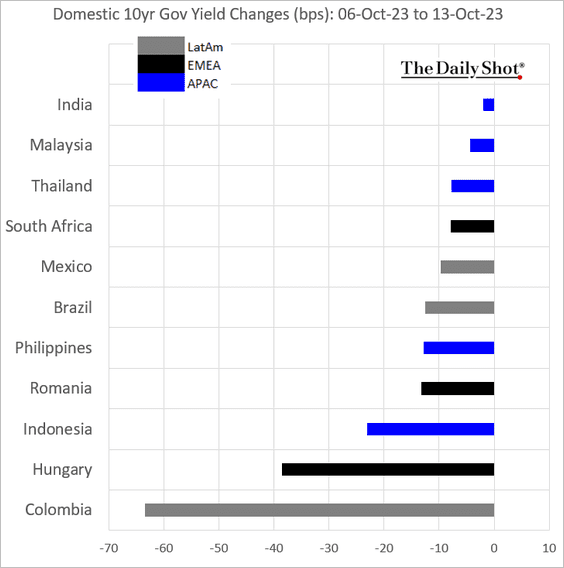
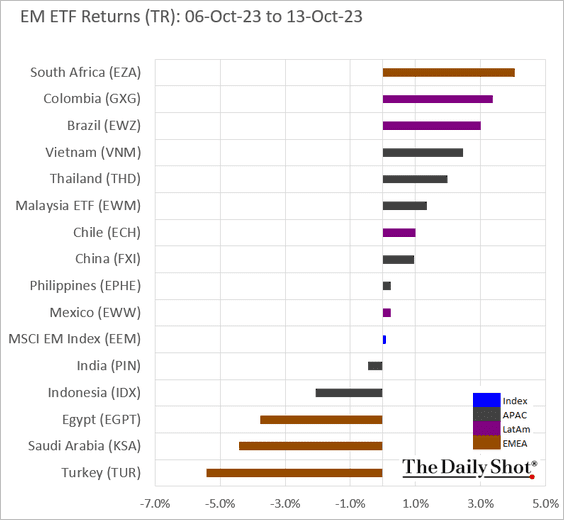
6. Next, we have some performance updates from last week.
• Currencies:
• Bond yields:
• Equity ETFs:
Back to Index
Commodities
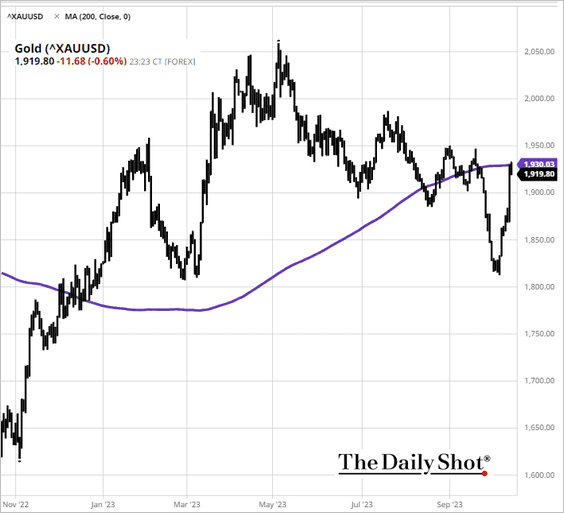
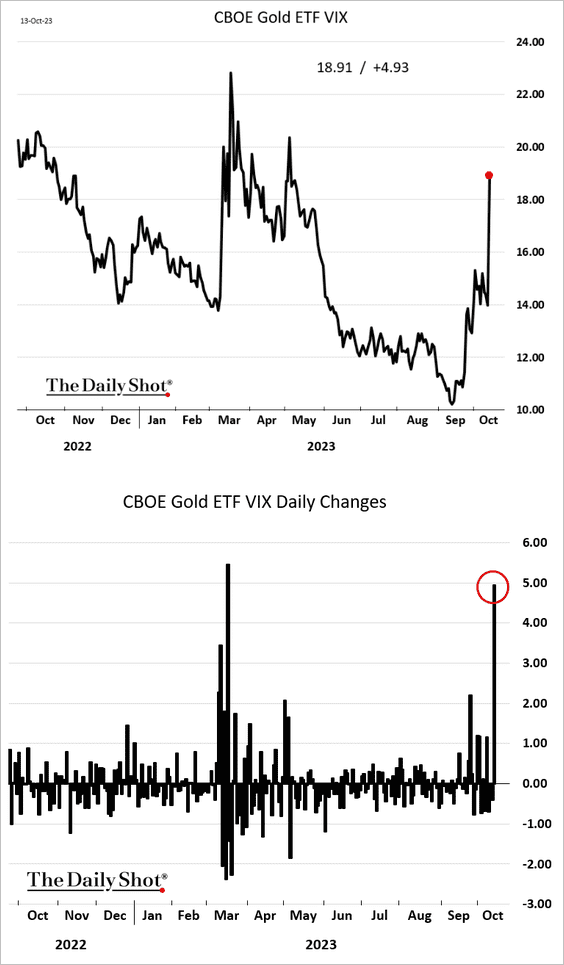
1. Gold surged last week on geopolitical uncertainty but hit resistance at the 200-day moving average.
Gold implied volatility jumped.
——————–
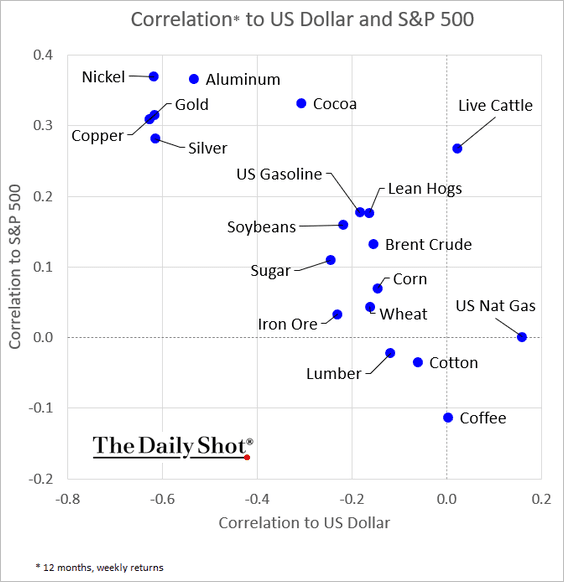
2. How correlated are different commodity markets to US stocks and the dollar?
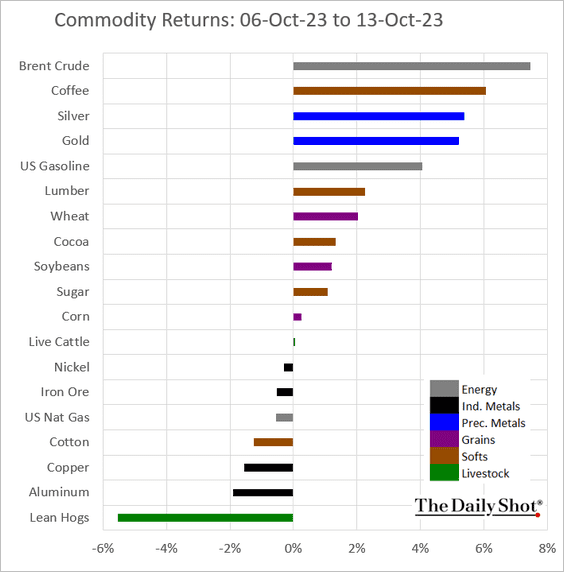
3. Here is a look at last week’s performance across key commodity markets.
Back to Index
Energy
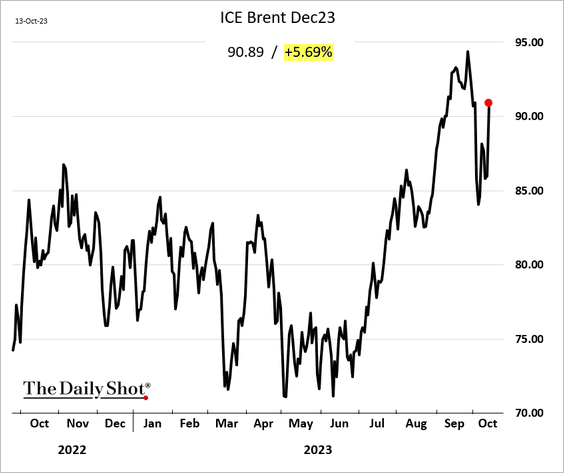
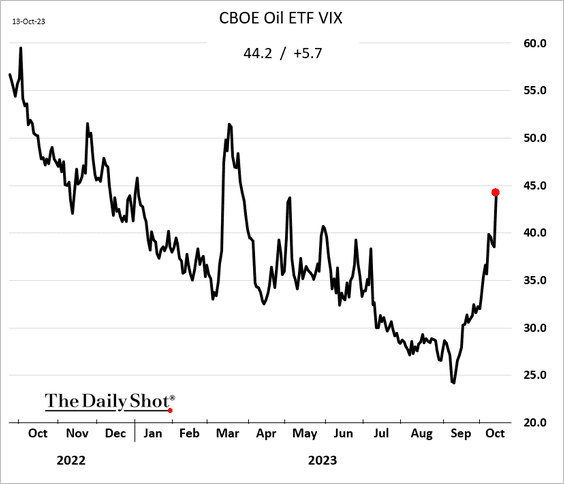
1. Crude oil prices jumped on Friday amid escalating tensions in the Middle East.
Crude oil implied volatility has been surging.
——————–
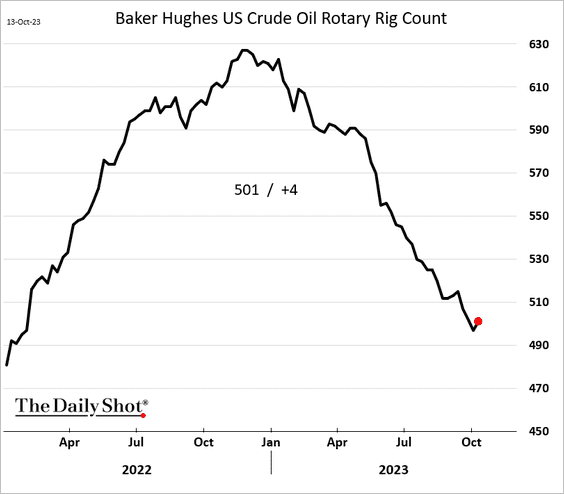
2. The US oil rig count registered a rare increase last week.
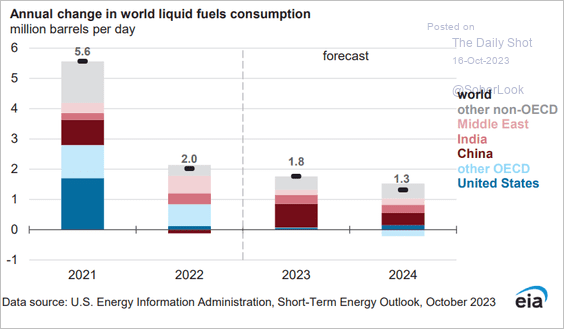
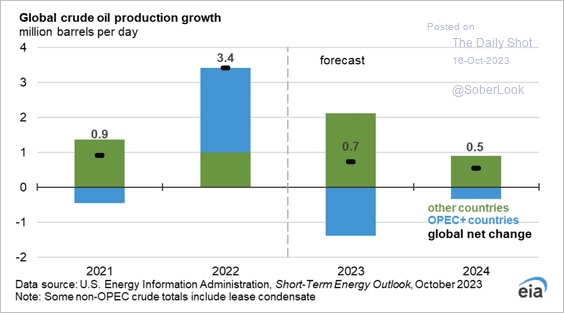
3. Growth in global liquid fuels consumption is expected to slow next year.
 Source: @EIAgov
 Source: @EIAgov
——————–
4. Iran’s crude oil exports remain elevated.
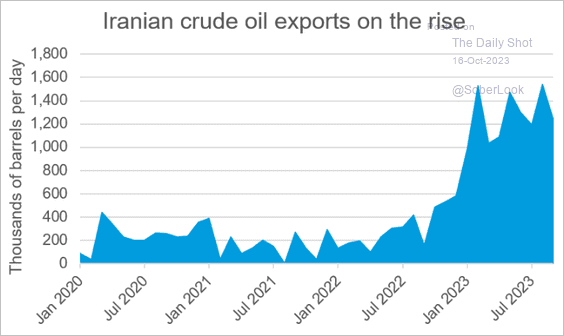 Source: The Real Economy Blog
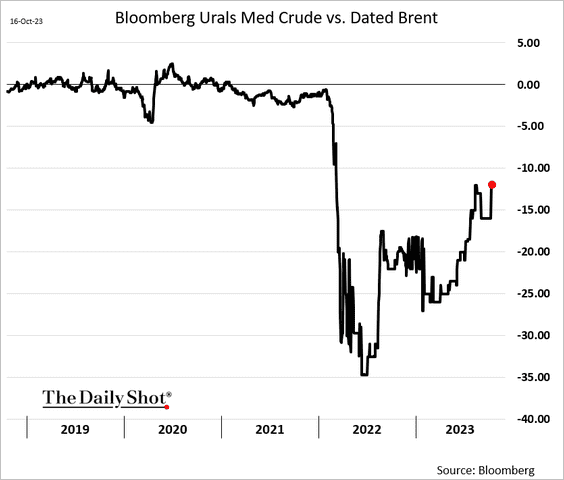
5. The Russian crude oil discount to Brent has been narrowing.
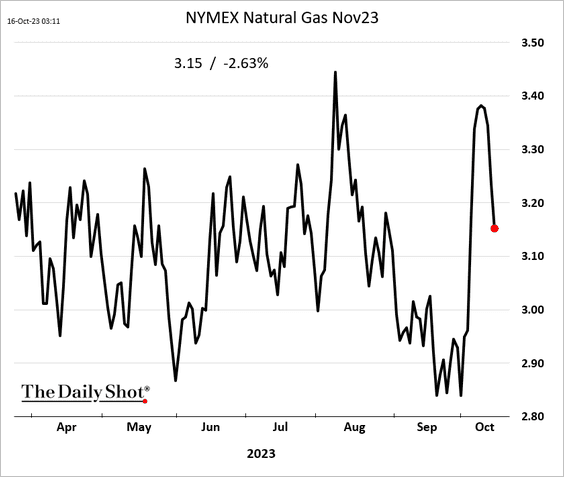
6. US natural gas is reversing this month’s rally.
Back to Index
Equities
1. Let’s begin with some sector updates.
• Here is a look at the Q3 earnings estimates by sector over time.
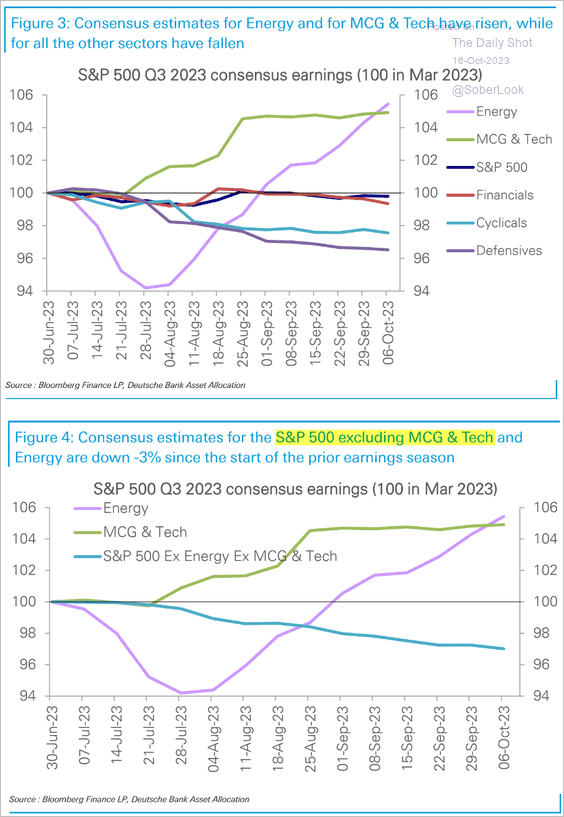 Source: Deutsche Bank Research
• How do investors feel about US stocks? Here is a survey from S&P Global.
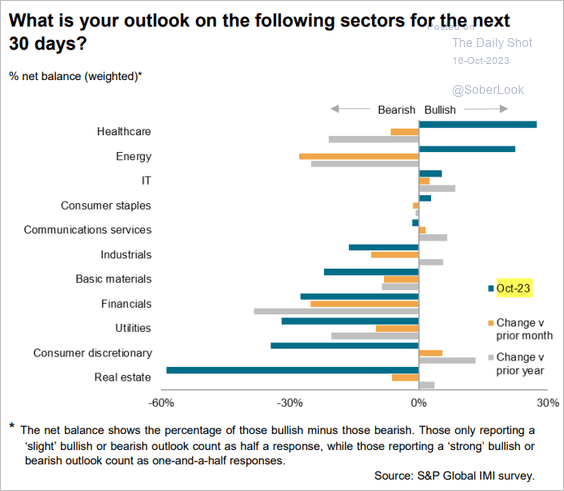 Source: S&P Global Market Intelligence
• Fund flows were negative across most sectors last week.
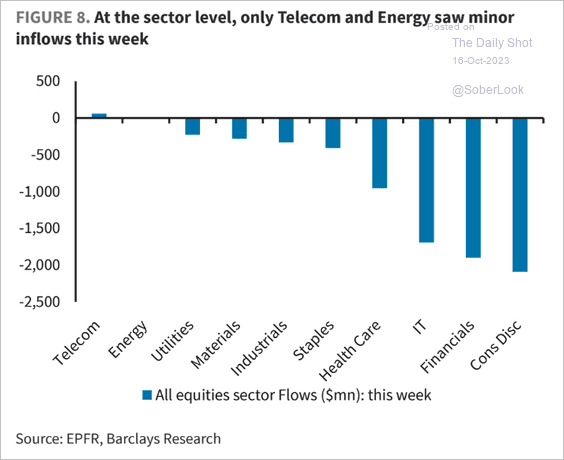 Source: Barclays Research; @dailychartbook
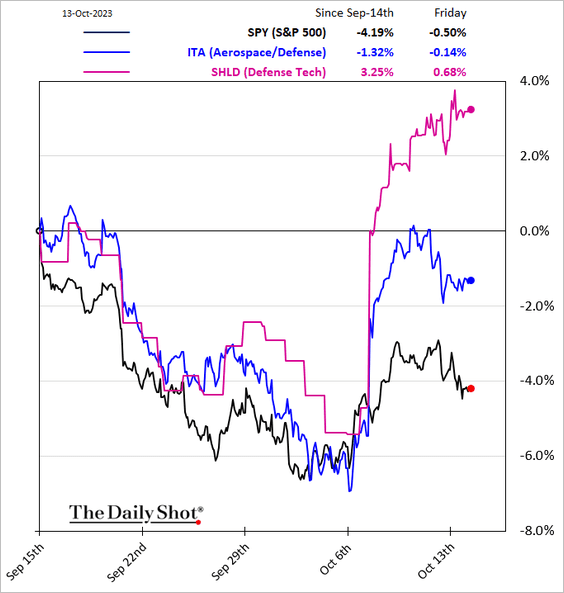
• Aerospace and defense ETFs experienced a surge in inflows. (2 charts)
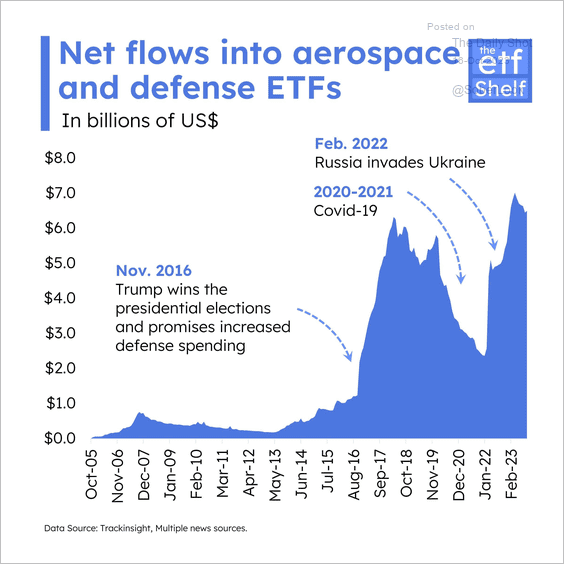 Source: http://theetfshelf.substack.com/
• Breadth among US consumer staples stocks is extremely weak.
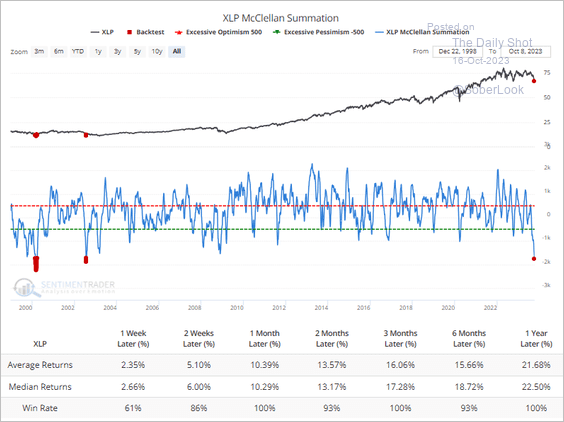 Source: SentimenTrader
• The S&P 500 consumer discretionary sector is holding its uptrend relative to consumer staples but is weakening relative to the equal-weight S&P 500 index. (2 charts)
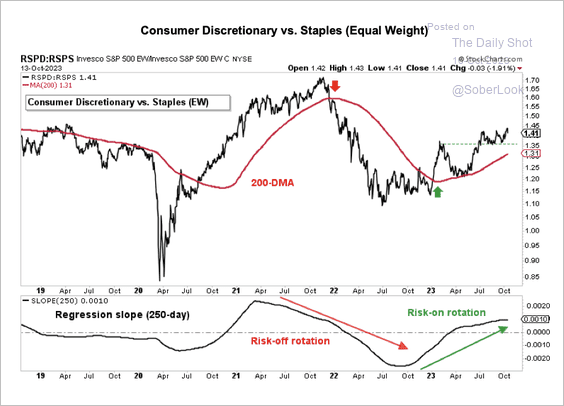 Source: Aazan Habib, Paradigm Capital
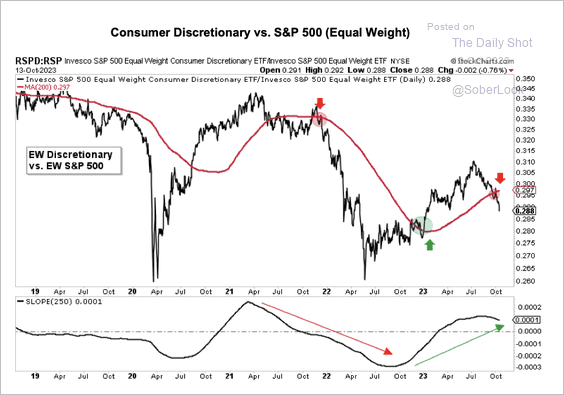 Source: Aazan Habib, Paradigm Capital
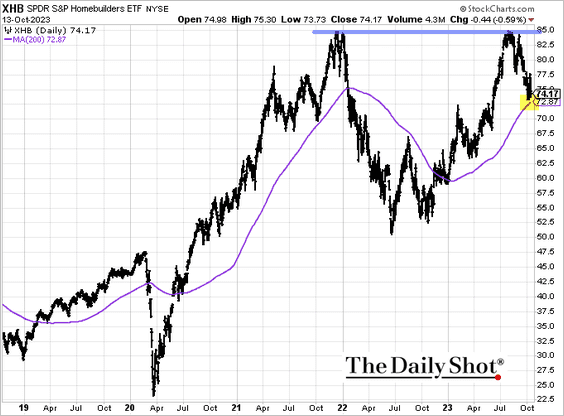
• After hitting resistance at the previous peak, the housing market ETF (XHB) has been trending lower and is now nearing the 200-day moving average.
——————–
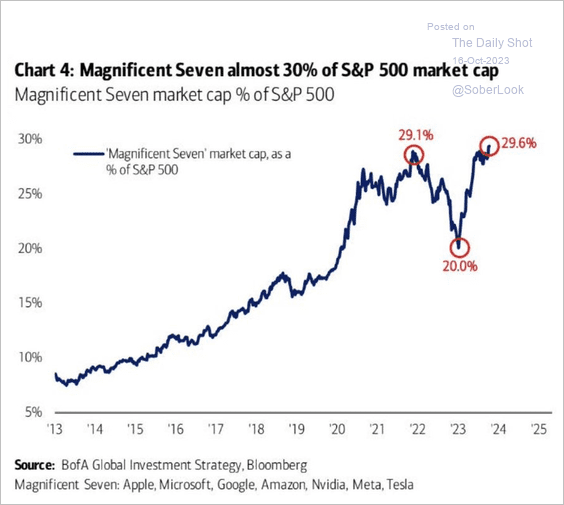
2. The top seven stocks now represent almost 30% of the S&P 500 market cap.
 Source: BofA Global Research
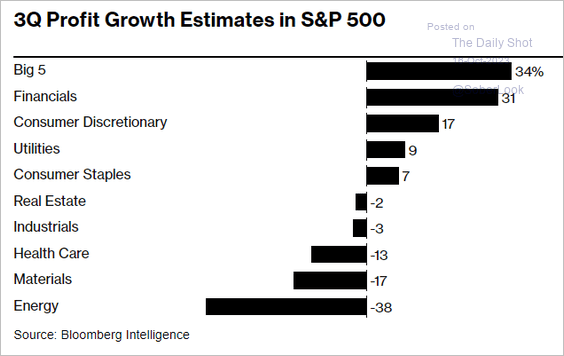
• The “big tech” concentration is powering the S&P 500 profit growth estimates.
 Source: @markets Read full article
——————–
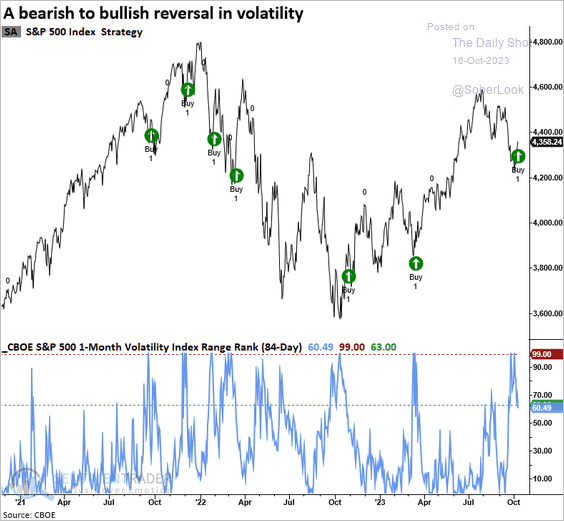
3. VIX rose to the top of its 84-day range and reversed lower, which typically precedes a rebound in the S&P 500.
 Source: SentimenTrader
• Options skew is rebounding.
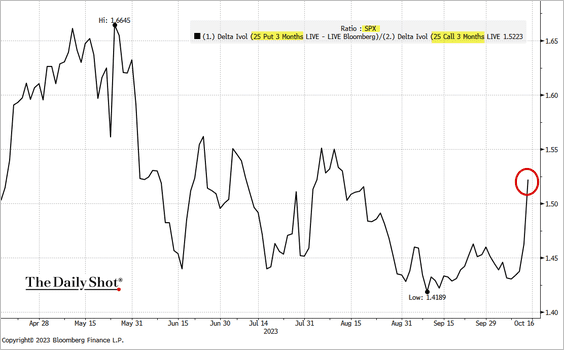 Source: @TheTerminal, Bloomberg Finance L.P.
——————–
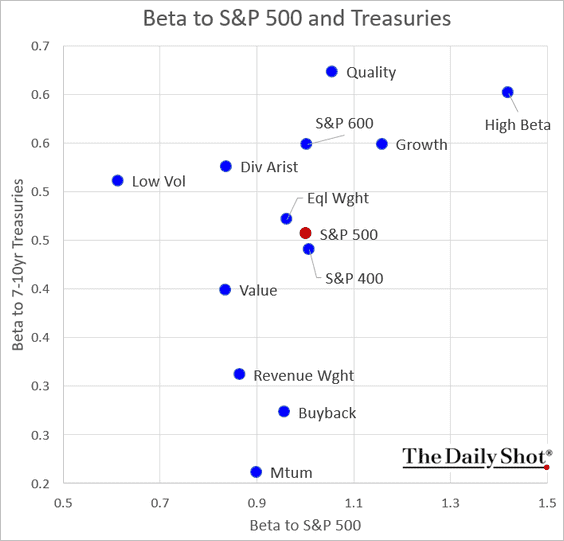
4. How sensitive are equity factors to price movements in the S&P 500 and Treasuries?
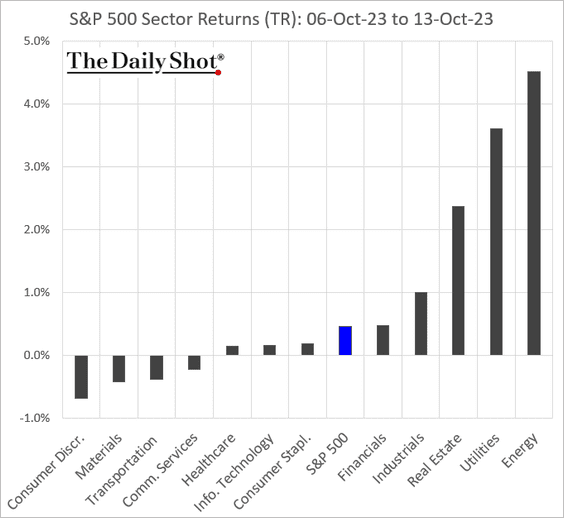
5. Finally, we have some performance data from last week.
• Sectors:
• Equity factors:
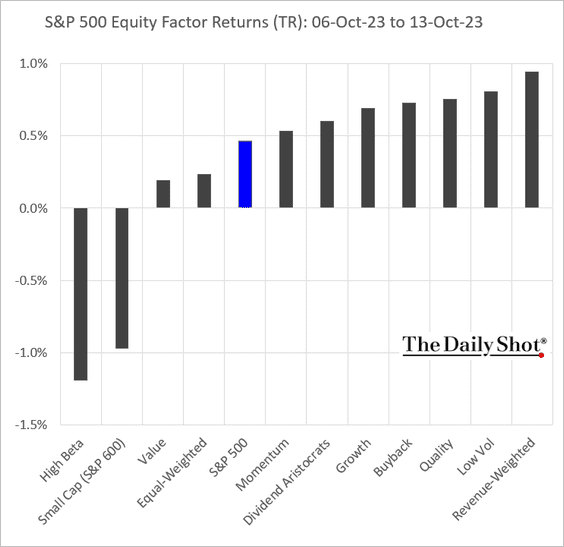
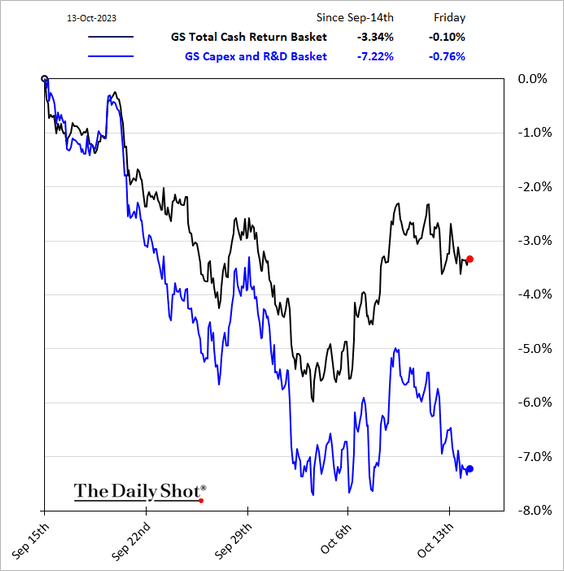
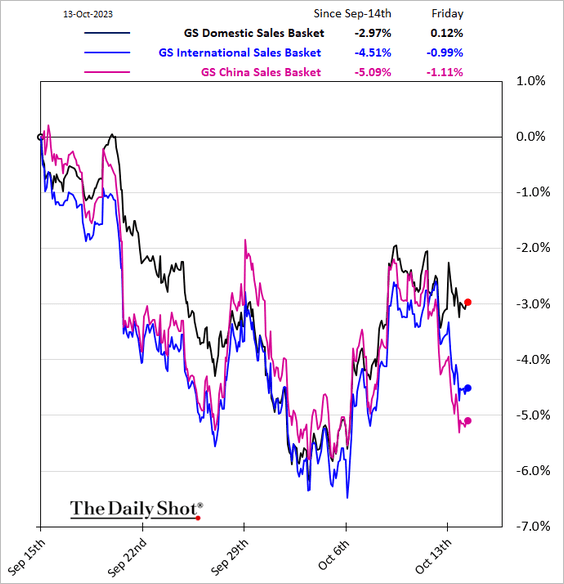
• Macro basket pairs’ relative performance (followed by two trends):
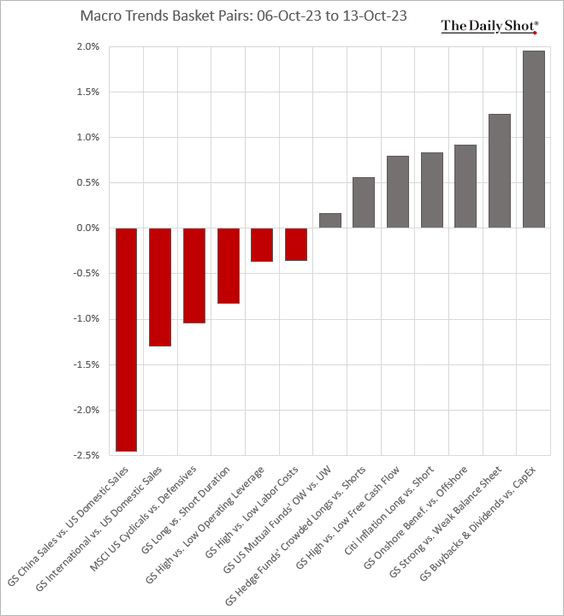
– Investors punished companies focused on CapEx and R&D and rewarded firms with high share buybacks and dividends.
– Companies with high international sales underperformed.
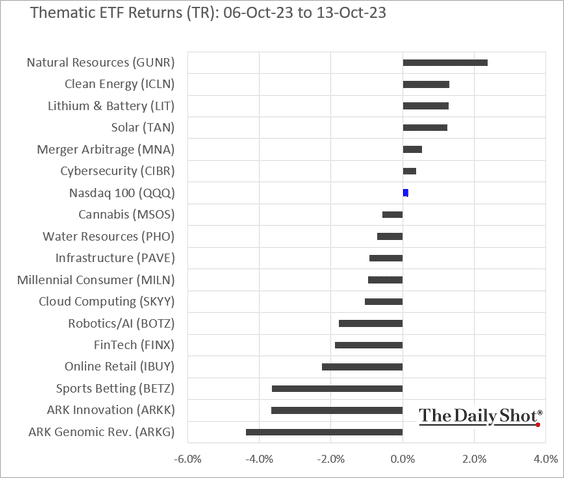
• Thematic ETFs:
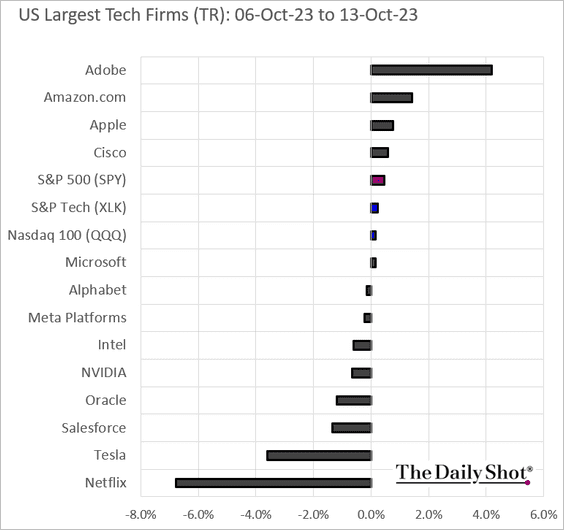
• Largest US tech firms:
Back to Index
Credit
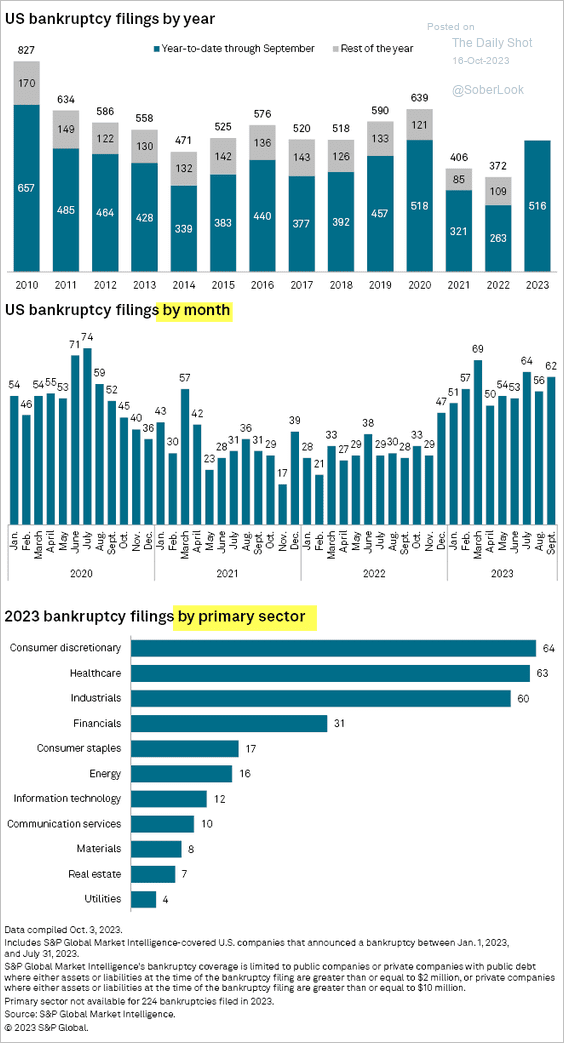
1. US bankruptcy filings remain elevated.
 Source: S&P Global Market Intelligence
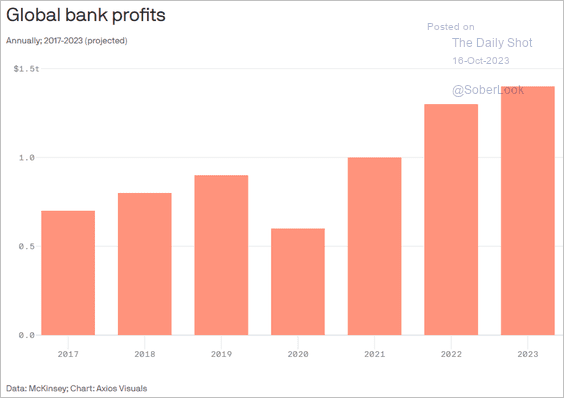
2. What banking crisis?
 Source: @axios Read full article
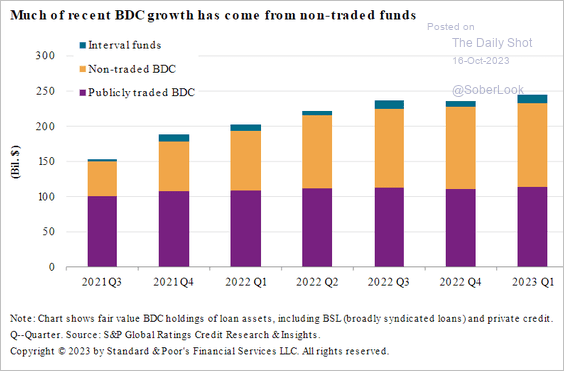
3. BDC growth has been dominated by private BDCs.
 Source: S&P Global Ratings
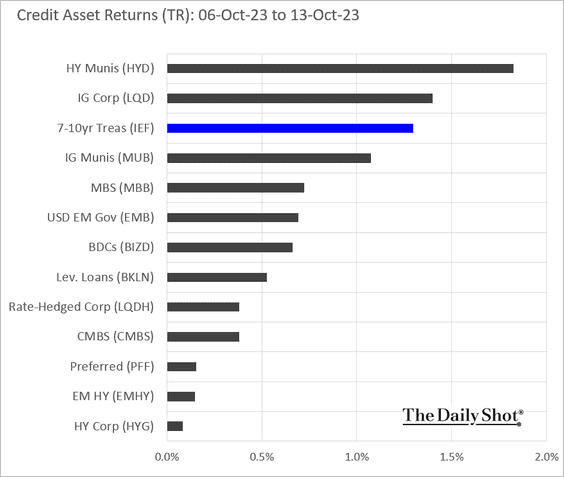
4. Here is a look at last week’s performance.
Back to Index
Rates
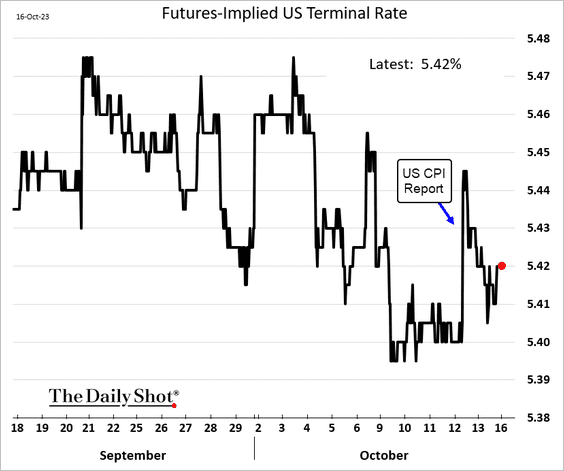
1. Despite the strong CPI report last week, the US terminal rate is holding just above 5.4%.
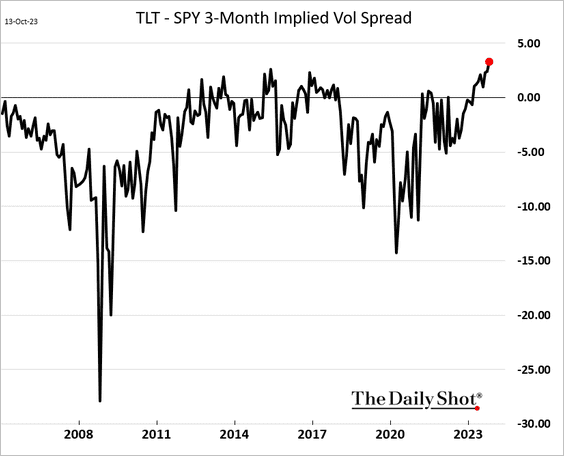
2. Long-term Treasury implied volatility has been outpacing the equity-market equivalent.
 Further reading
3. Treasury term premium is more sensitive to new supply of debt when the correlation between stocks and bonds is positive.
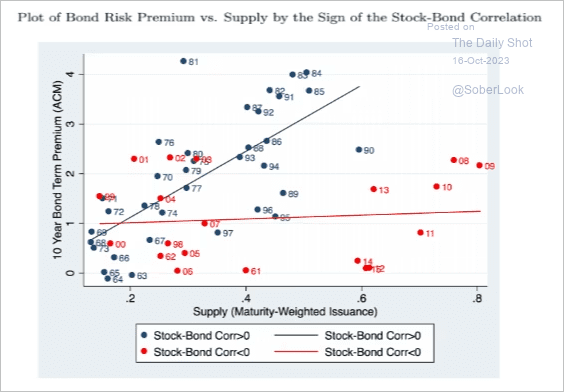 Source: Steve Hou; @financialtimes Read full article
Back to Index
Global Developments
1. Wage growth is slowing.
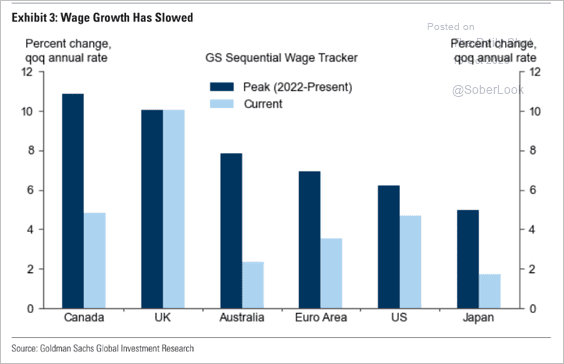 Source: Goldman Sachs; @MikeZaccardi
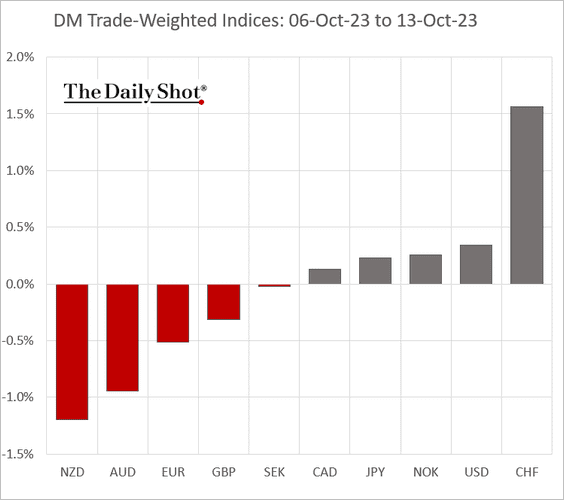
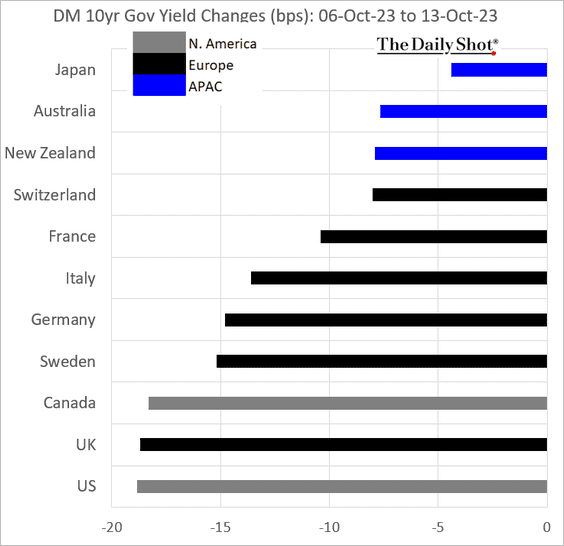
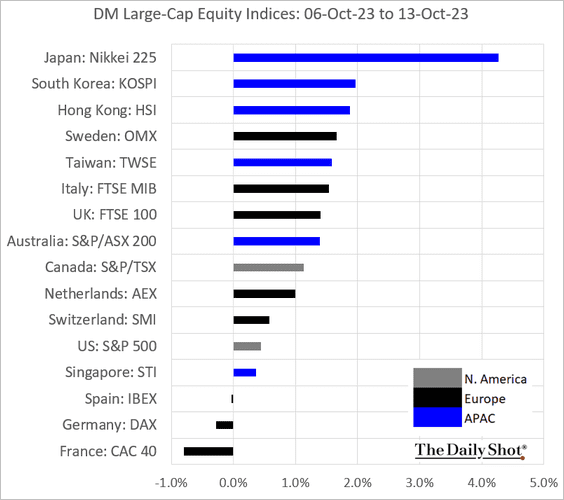
2. Here is a look at last week’s performance across advanced economies.
• Currencies:
• Bond yields:
• Equity indices:
——————–
Food for Thought
1. Definitions of “financially comfortable” and “wealthy” across US metro areas:
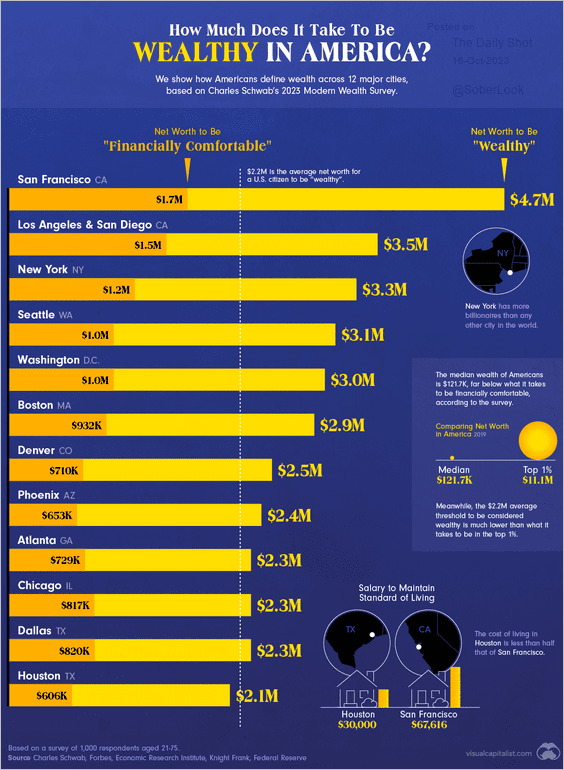 Source: Visual Capitalist Read full article
2. New apartment units:
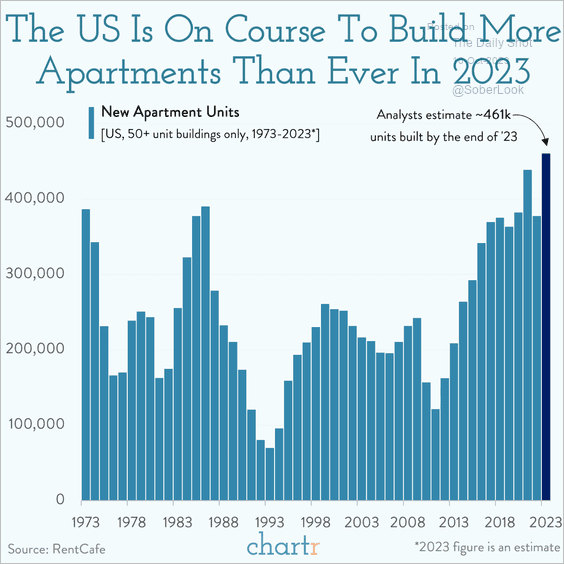 Source: @chartrdaily
3. Reasons for moving:
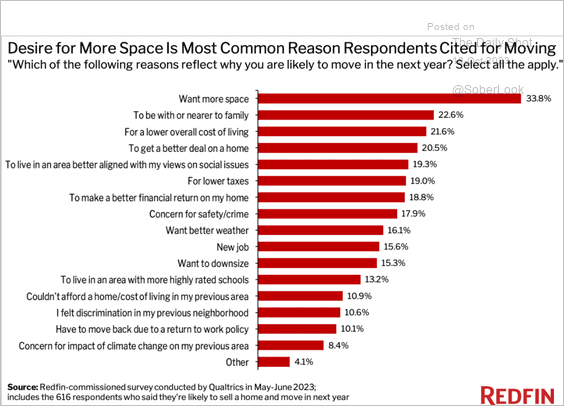 Source: Redfin Read full article
4. Attendance by income at top colleges:
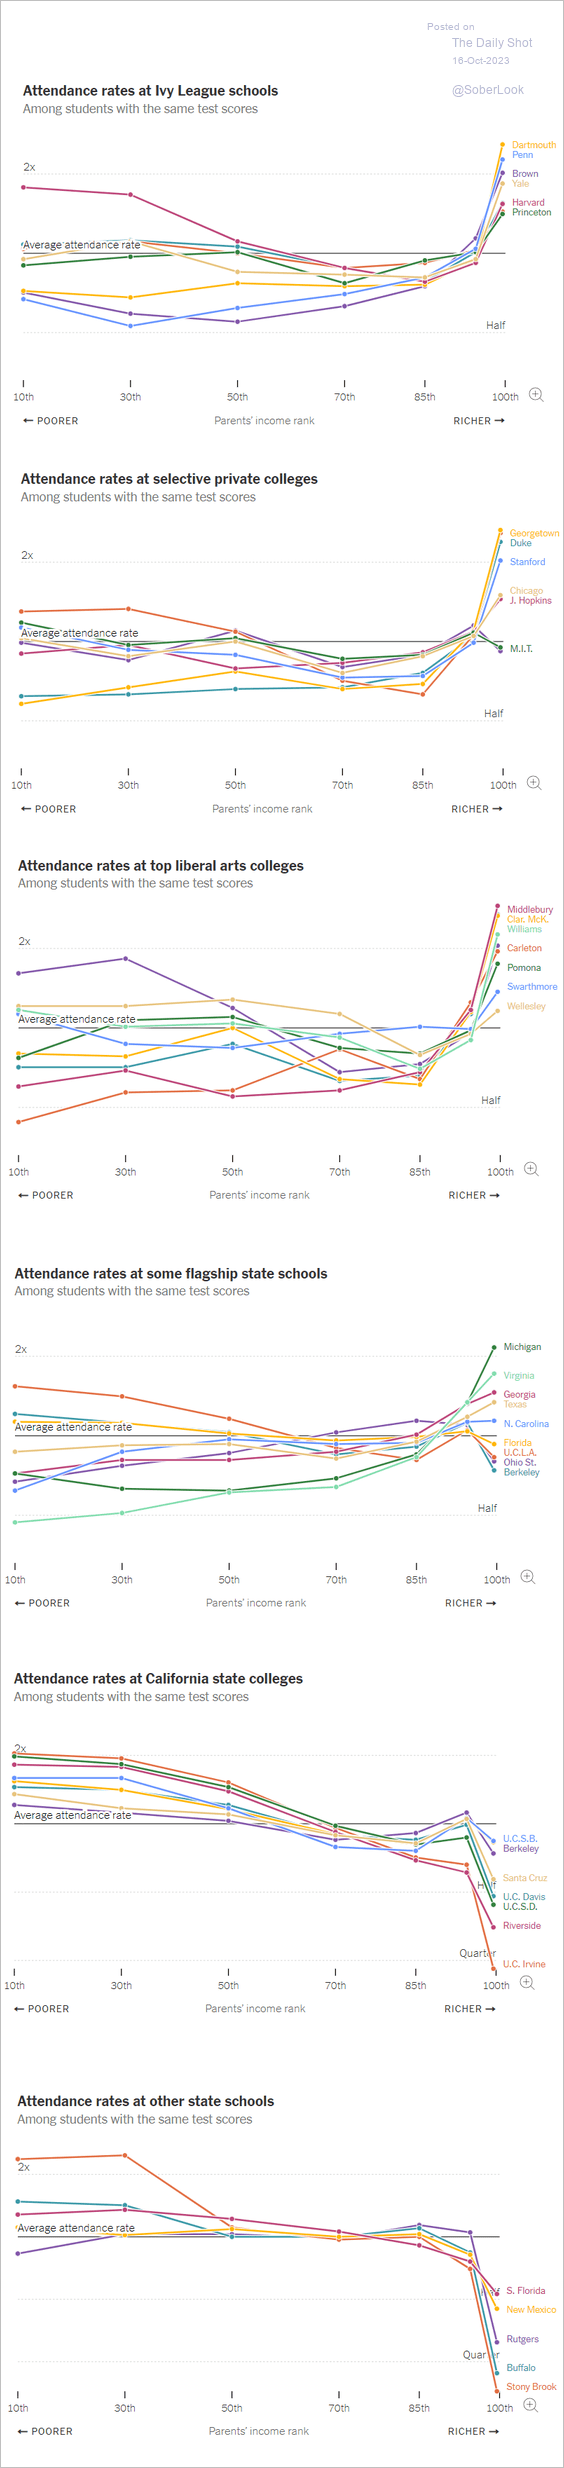 Source: The New York Times Read full article
5. Iran’s stockpile of enriched uranium:
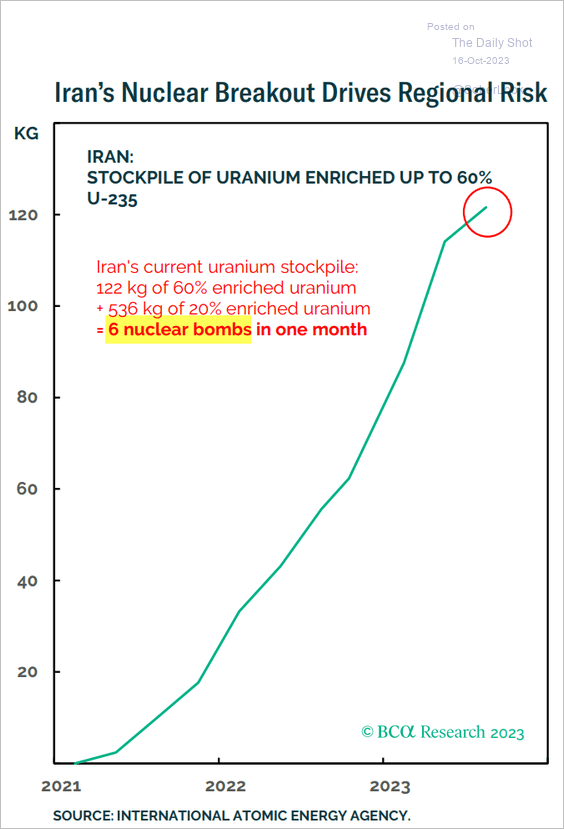 Source: BCA Research
6. Colombia’s cocaine production:
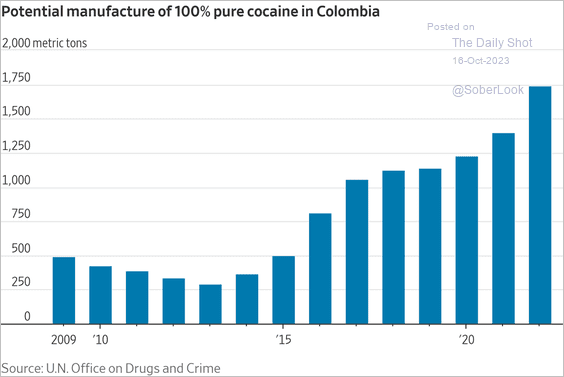 Source: @WSJ Read full article
7. Views on Kevin McCarthy’s removal:
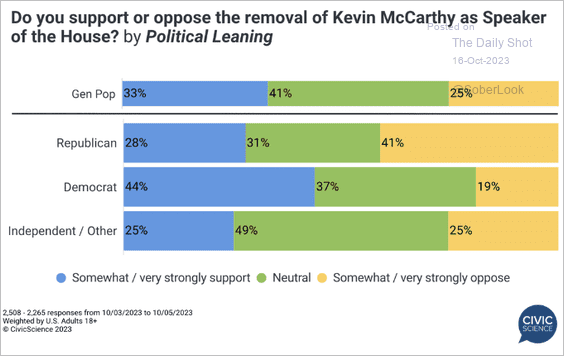 Source: @CivicScience Read full article
8. US workers’ attire on the job:
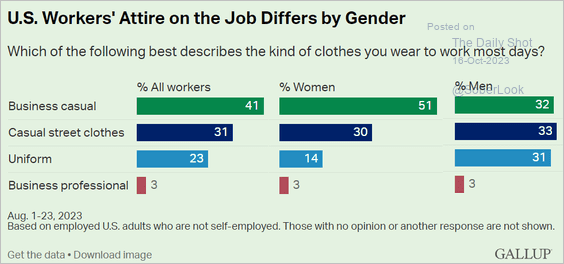 Source: Gallup Read full article Further reading
——————–
Back to Index