
The Daily Shot: 18-Oct-23
• The United States
• Canada
• The United Kingdom
• Europe
• Japan
• China
• Commodities
• Equities
• Credit
• Rates
• Global Developments
• Food for Thought
The United States
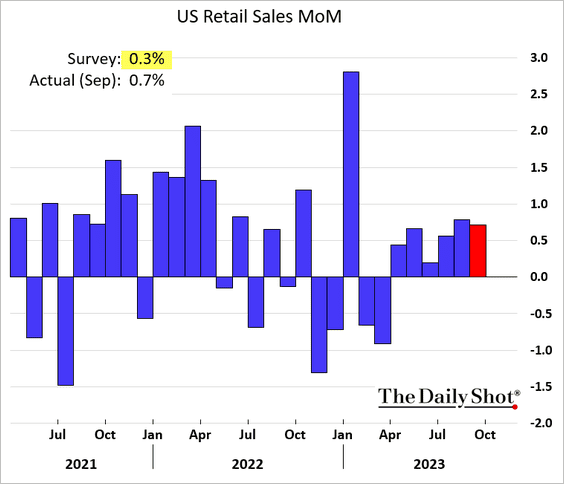
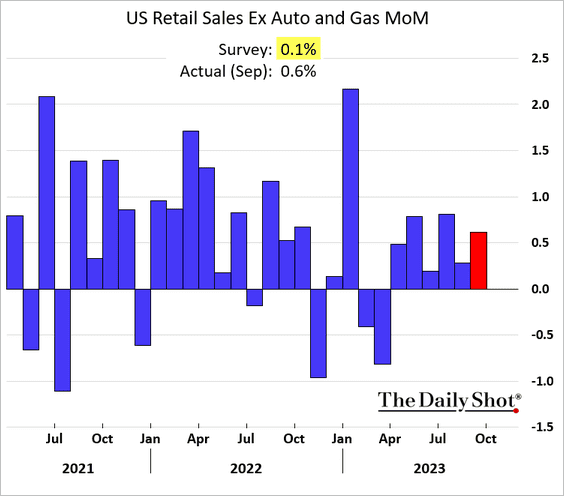
1. Retail sales remained remarkably strong last month, topping forecasts.
 Source: CNBC Read full article
• Gains were relatively broad (2 charts).
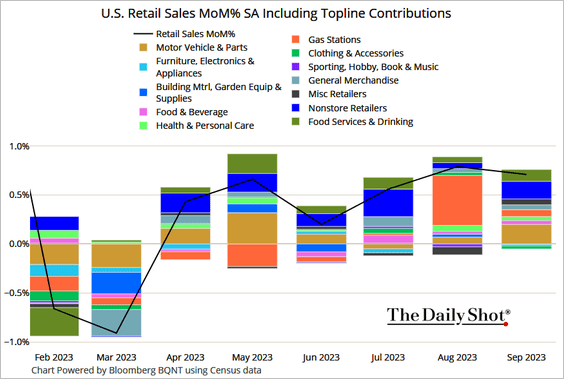 Source: @TheTerminal, Bloomberg Finance L.P.
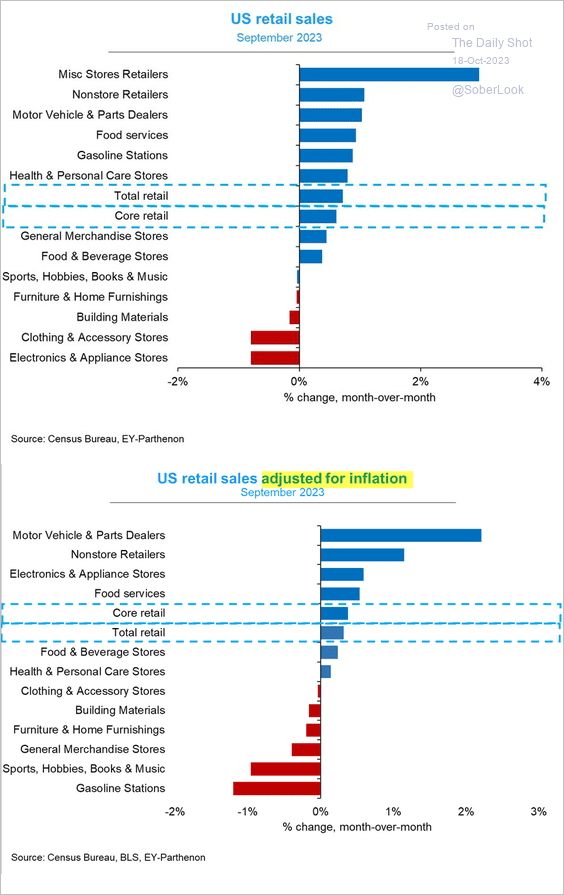 Source: @GregDaco
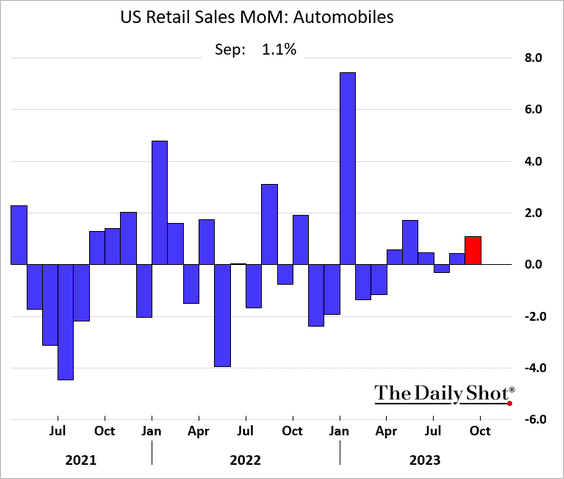
• Automobile sales increased.
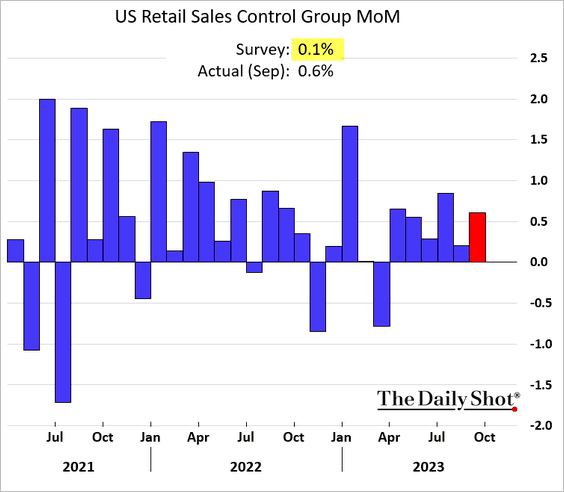
• “Core” retail sales also exceeded forecasts (2 charts).
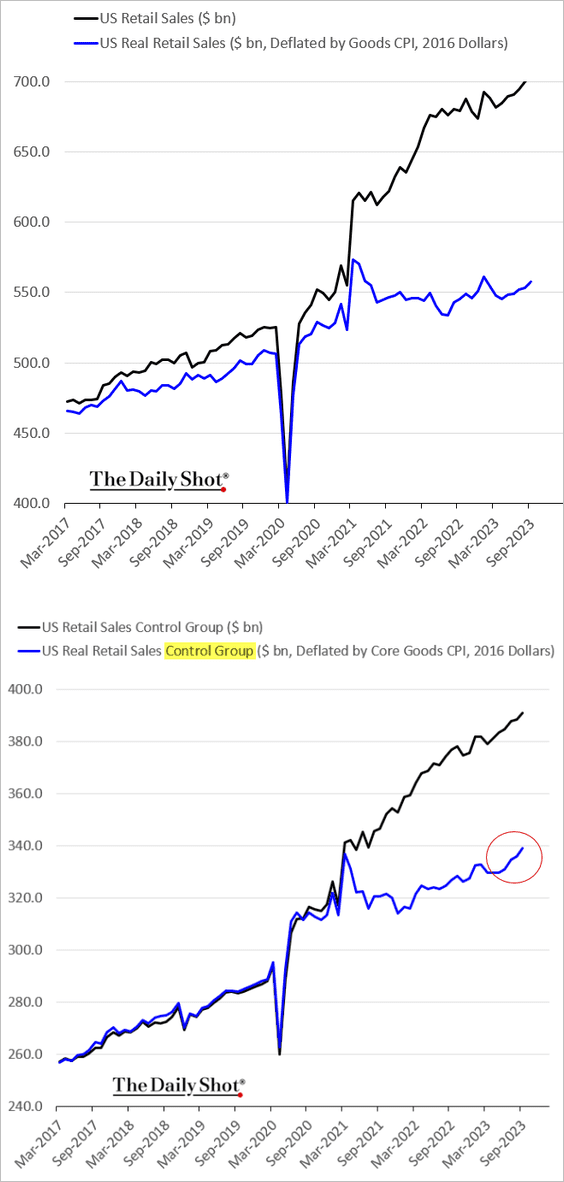
• Here is a look at retail sales levels (nominal and real).
——————–
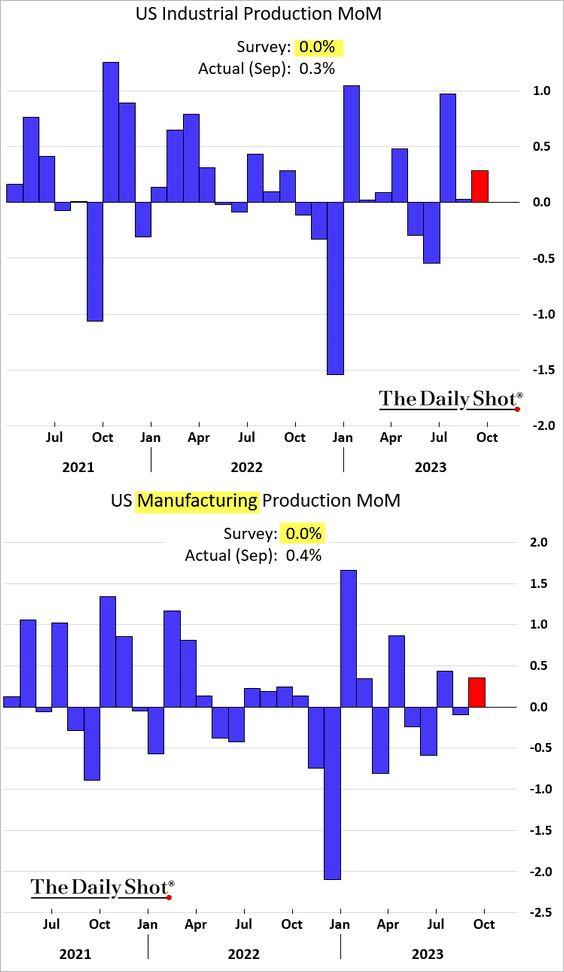
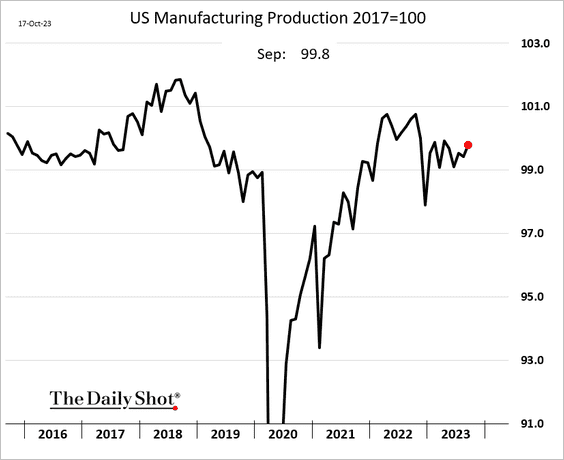
2. Industrial production also surprised to the upside, with robust gains in manufacturing output.
 Source: MarketWatch Read full article
Here is the manufacturing production level.
——————–
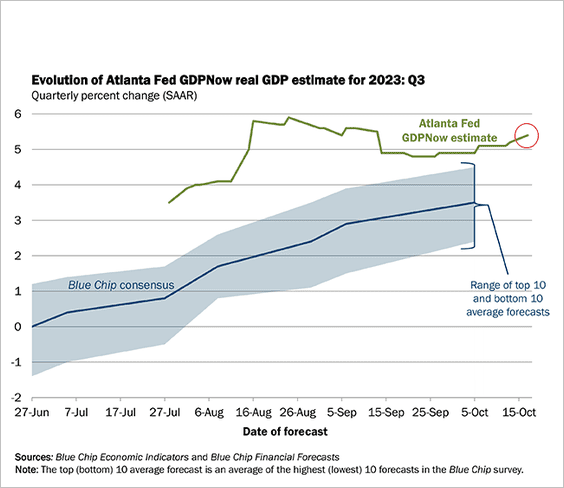
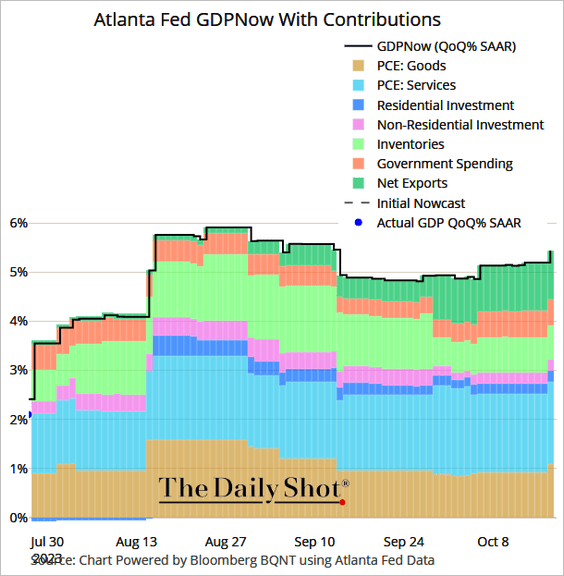
3. Impressive performance in retail sales and industrial production boosted the GDPNow Q3 growth forecast (well above 4%, annualized).
Here are the contributions to the index (“PCE” refers to consumer spending).
 Source: @TheTerminal, Bloomberg Finance L.P.
——————–
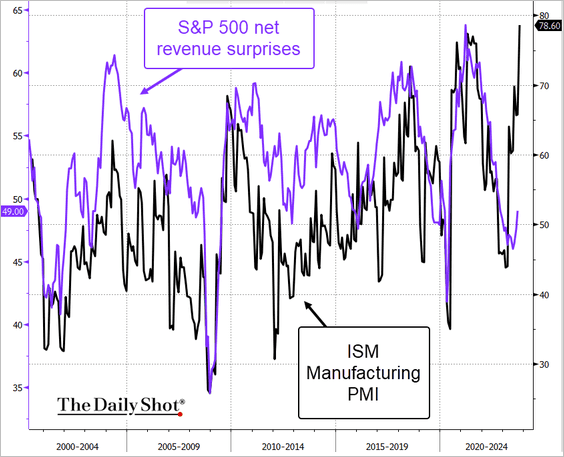
4. S&P 500 revenue surprises signal improvements in US factory activity.
 Source: @TheTerminal, Bloomberg Finance L.P.
• Leading indicators point to a rebound in global manufacturing activity as well.
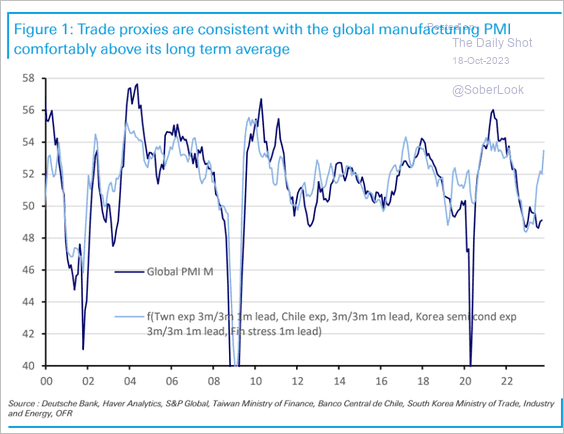 Source: Deutsche Bank Research
——————–
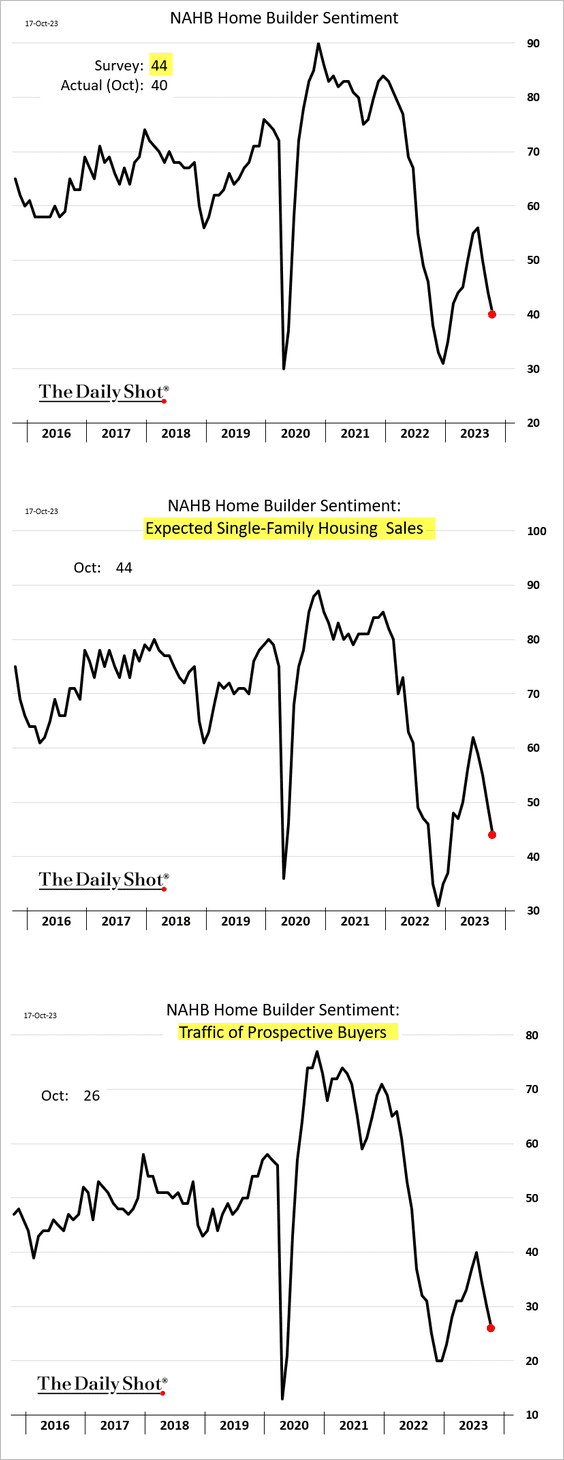
5. The NAHB homebuilder optimism index deteriorated further as mortgage rates surged.
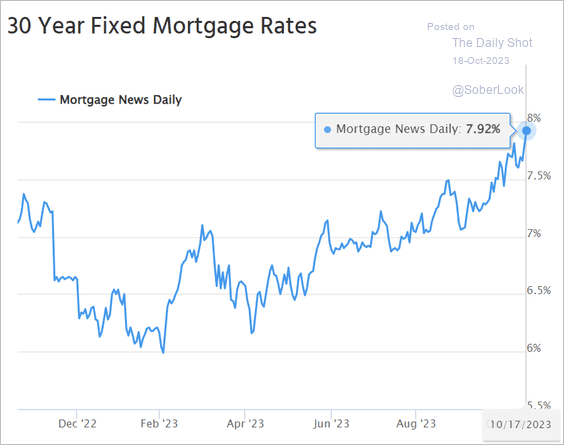
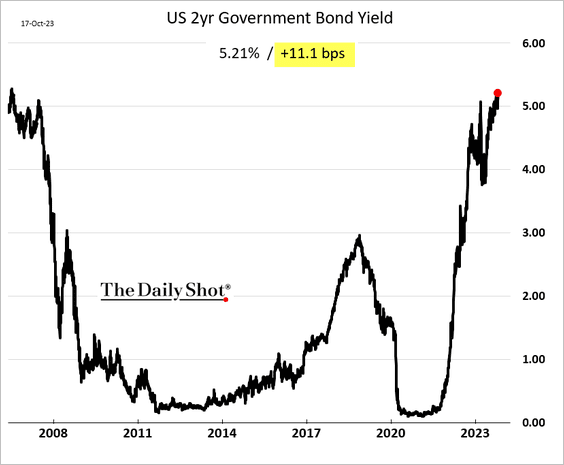
6. Robust economic data sent Treasury yields to multi-year highs, …
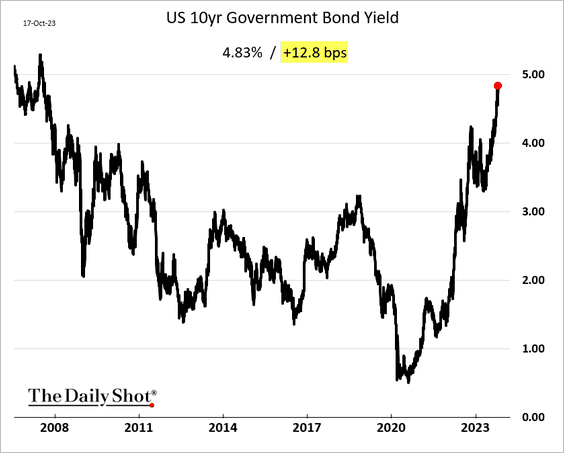
… with the 30-year mortgage rate now nearing 8%.
 Source: Mortgage News Daily
The 2-year Treasury yield climbed above 5.2% for the first time since 2006.
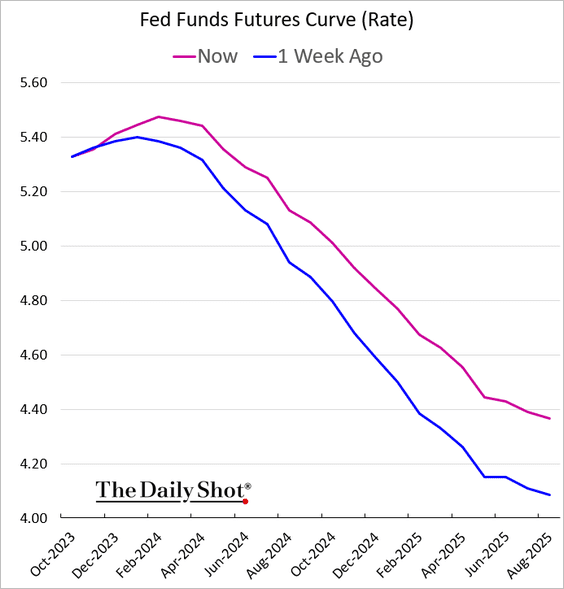
7. Fed rate cut expectations continue to moderate, …
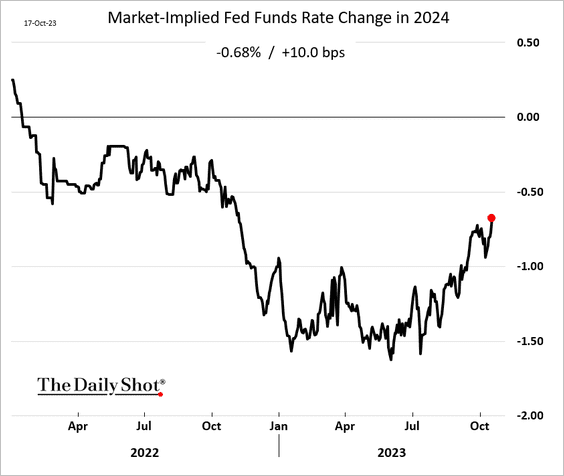
… with the implied fed funds rate trajectory shifting higher.
——————–
8. China has been re-routing exports to the US via Southeast Asia to avoid tariffs.
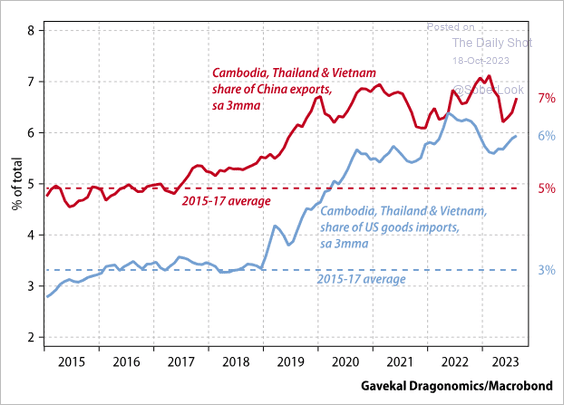 Source: Gavekal Research
Back to Index
Canada
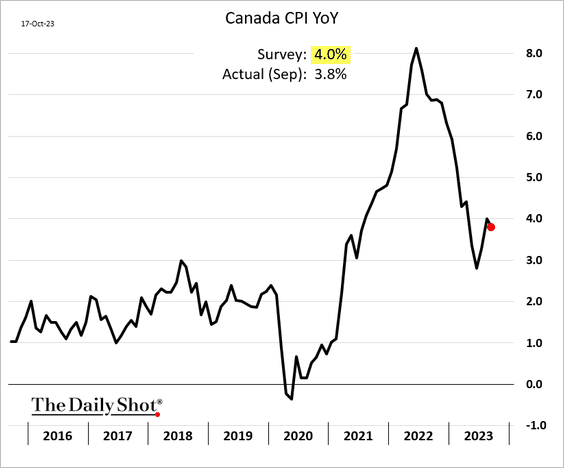
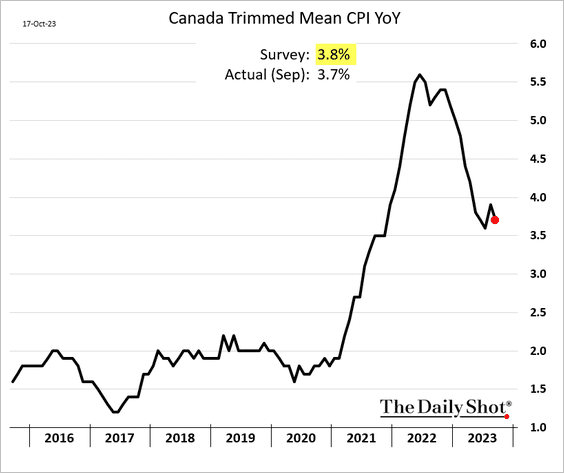
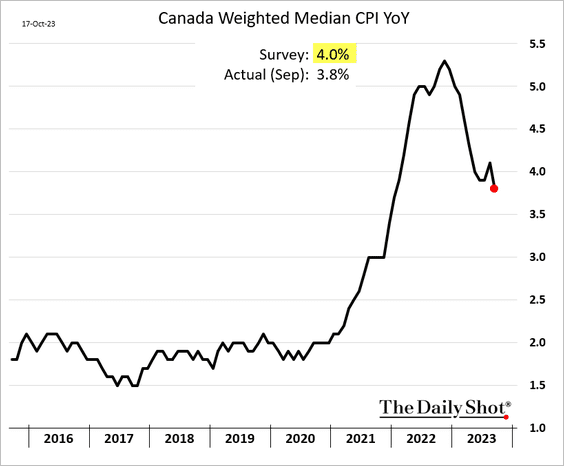
1. Inflation showed signs of easing, with the headline and core CPI figures coming in below forecasts.
• Headline:
• Core (2 charts):
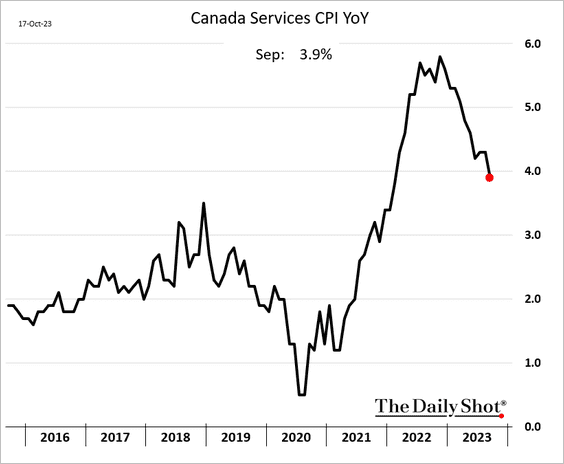
• Services:
——————–
2. Will immigration levels remain elevated?
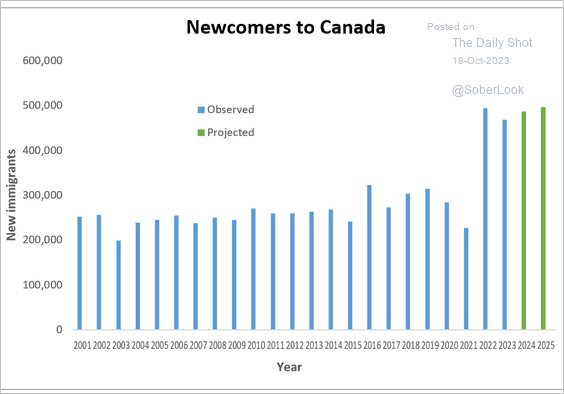 Source: Real Economy Blog
Back to Index
The United Kingdom
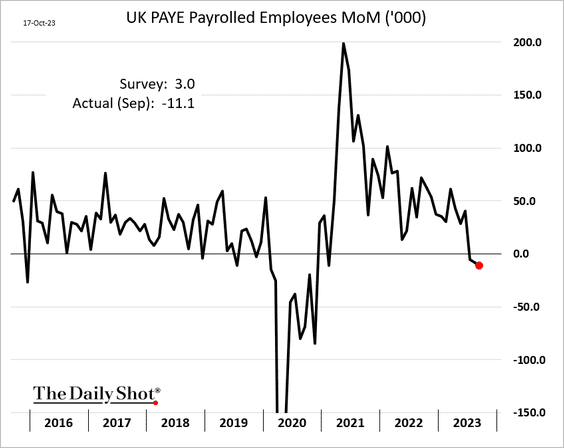
1. The payrolls estimate declined again, pointing to a softening labor market.
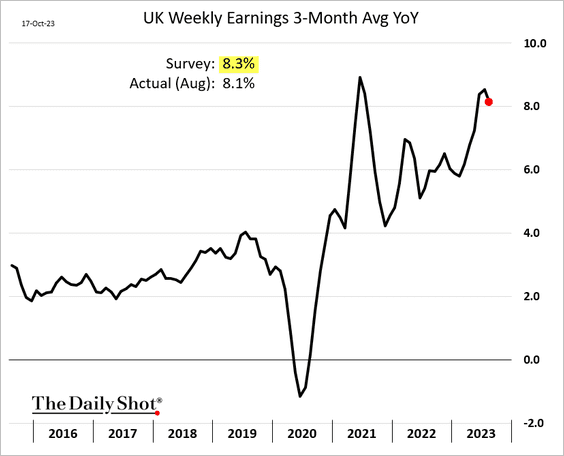
2. Wage growth appears to be peaking.
Back to Index
Europe
1. Germany’s ZEW expectations indicator showed a sharp improvement this month.
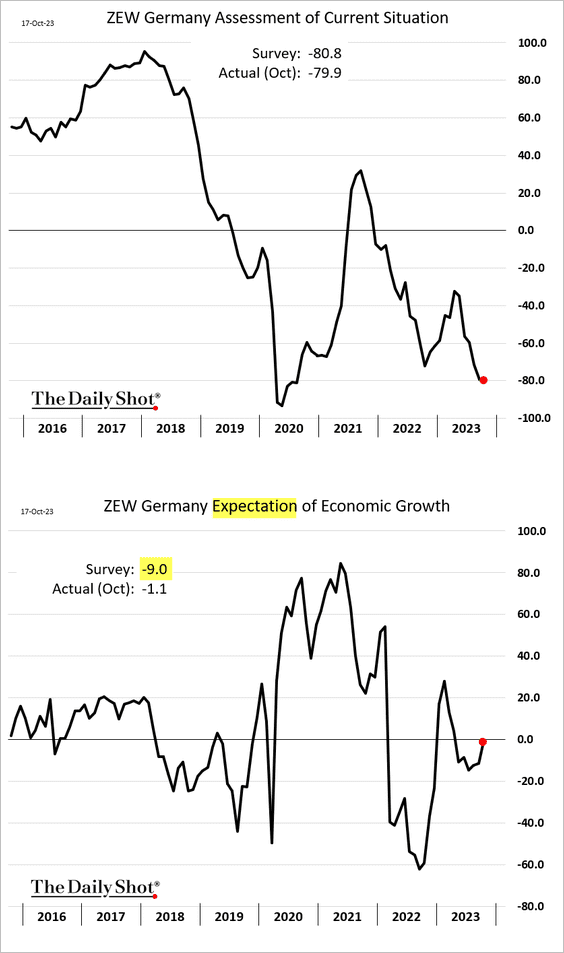
 Source: Reuters Read full article
——————–
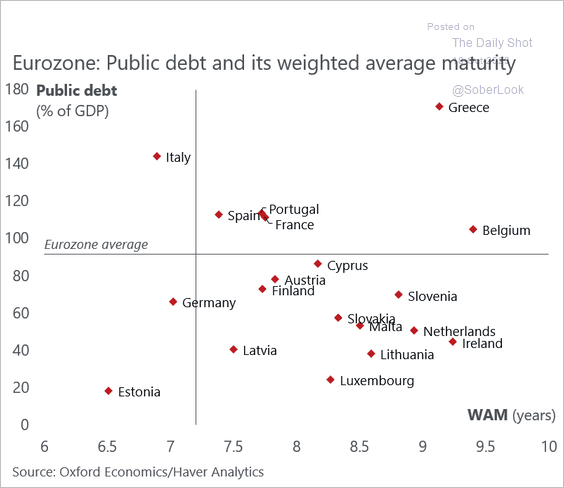
2. Here is a look at debt-to-GDP ratios and weighted-average bond maturities (WAM).
 Source: @DanielKral1
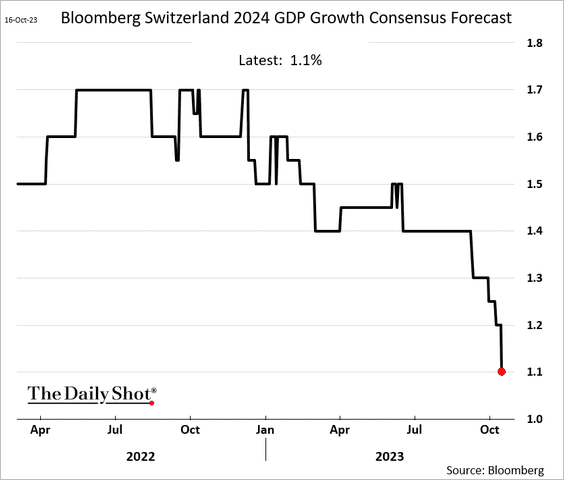
3. Economists are rapidly cutting their forecasts for Swiss GDP growth next year.
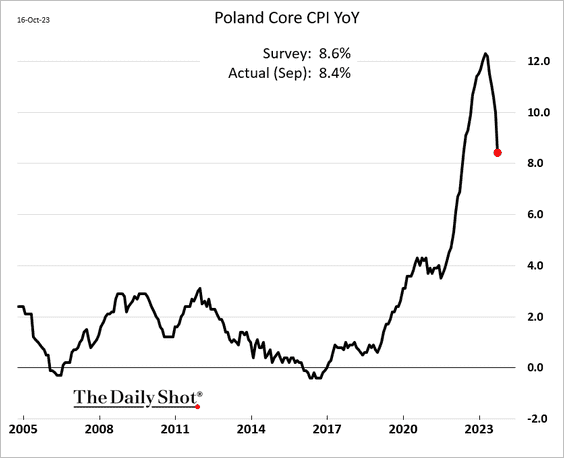
4. Poland’s inflation is slowing rapidly.
Back to Index
Japan
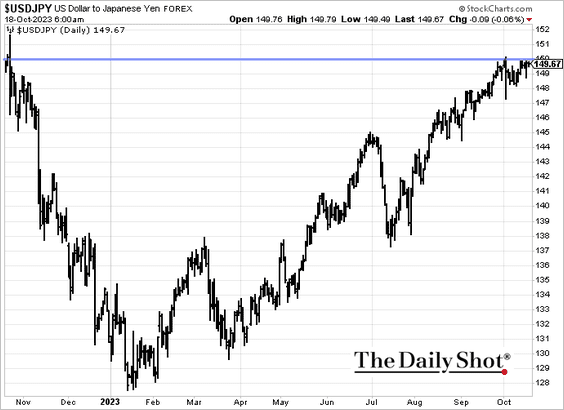
1. USD/JPY continues testing 150, a level where increased government intervention risk looms.
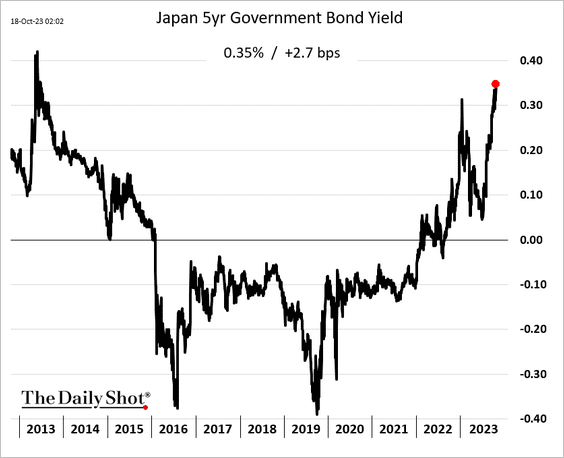
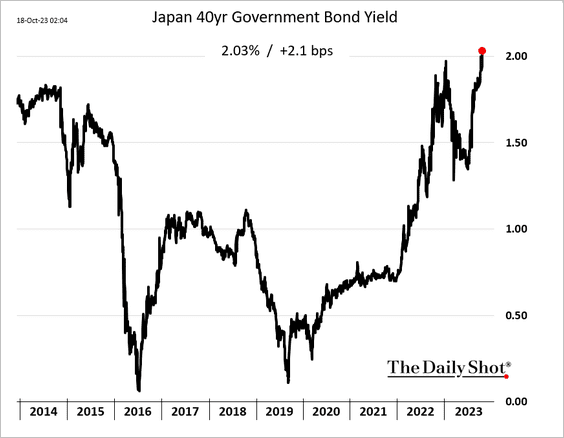
2. JGB yields are hitting multi-year highs.
• 5yr yield:
• 40yr yield (record high):
——————–
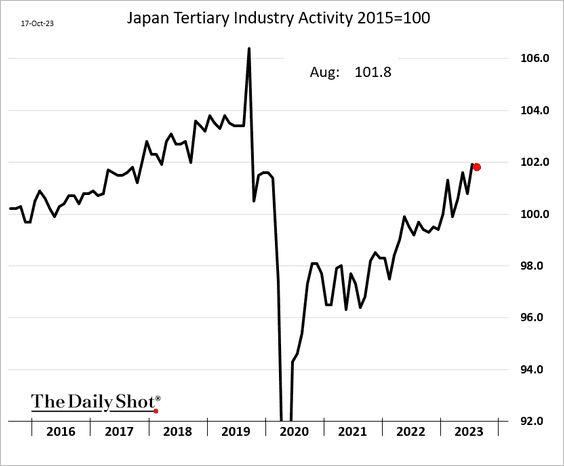
3. Service activity took a pause in August.
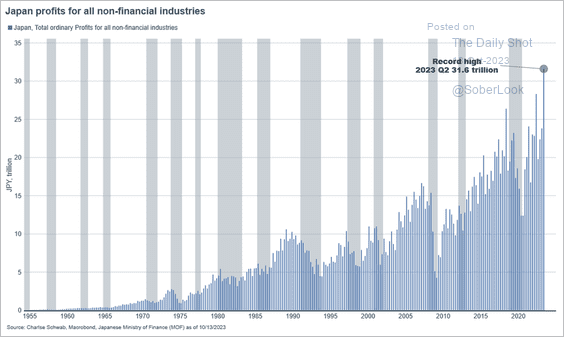
4. Corporate profits have been very strong.
 Source: @JeffreyKleintop
Back to Index
China
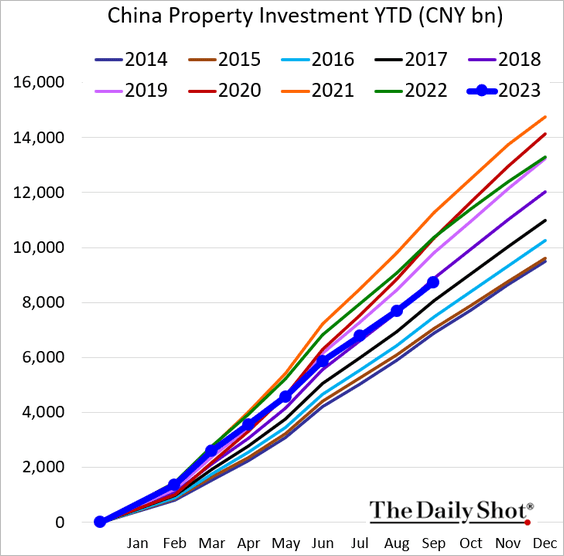
1. Economic indicators topped expectations.
– Q3 GDP growth:
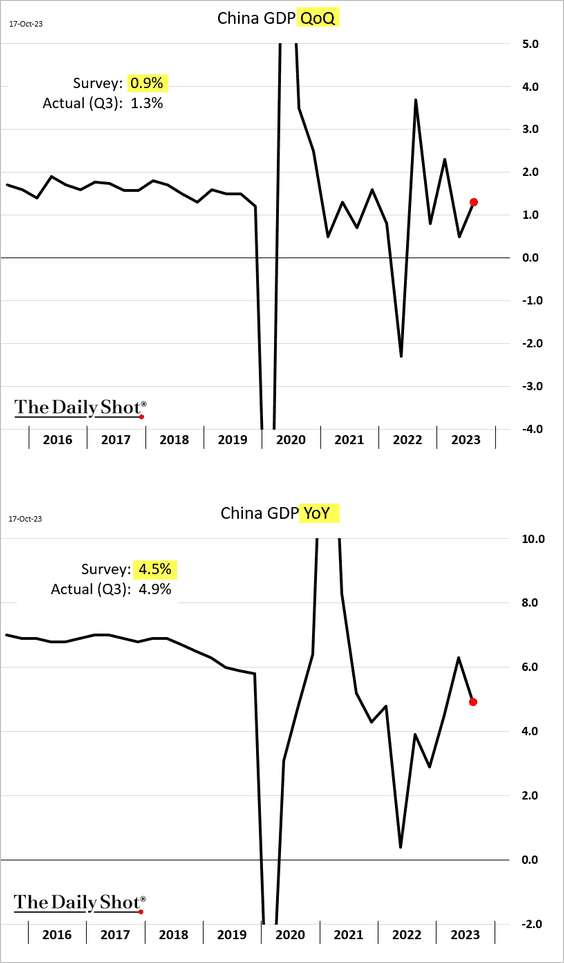
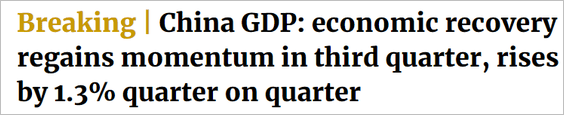 Source: South China Morning Post Read full article
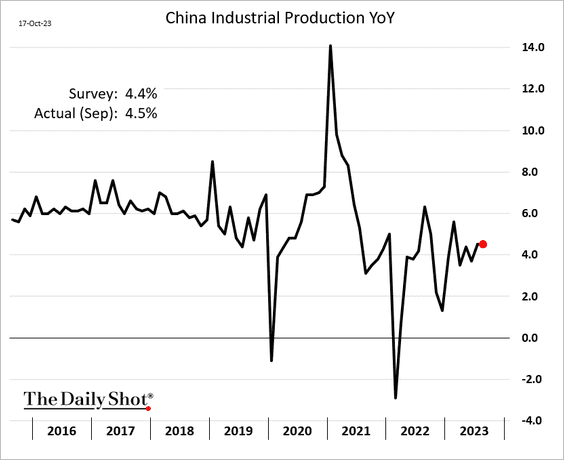
– Industrial production:
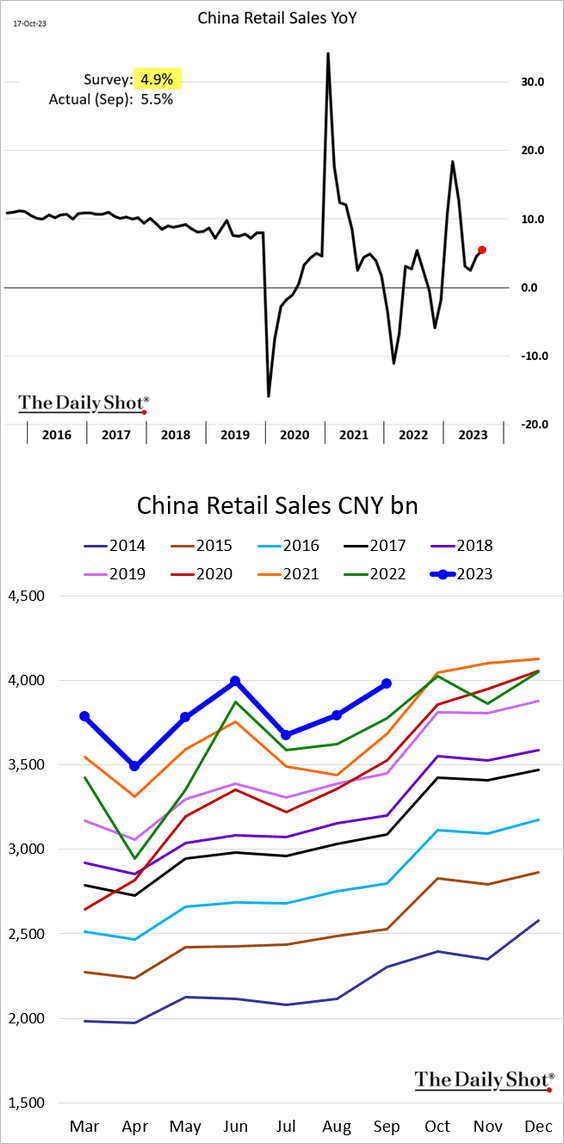
– Retail sales:
• Property investment remains soft.
——————–
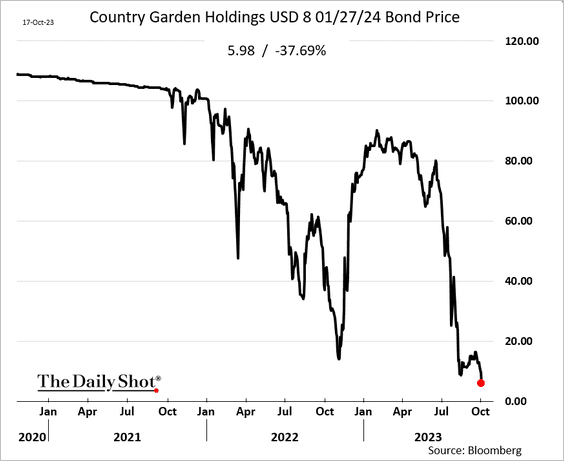
2. Country Garden missed its offshore debt coupon payment.
 Source: Reuters Read full article
• The company’s bond price tumbled further.
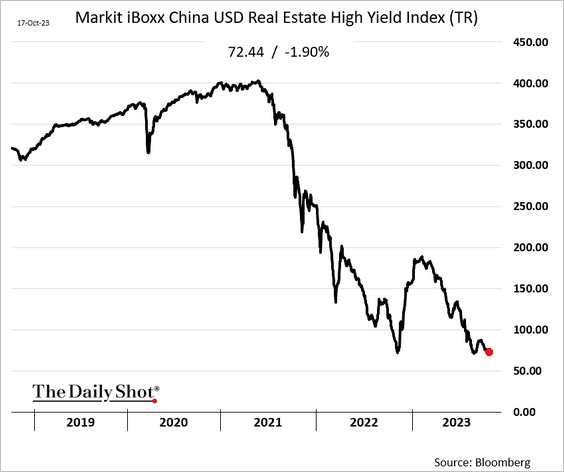
• Here is the index of USD-denominated developer debt.
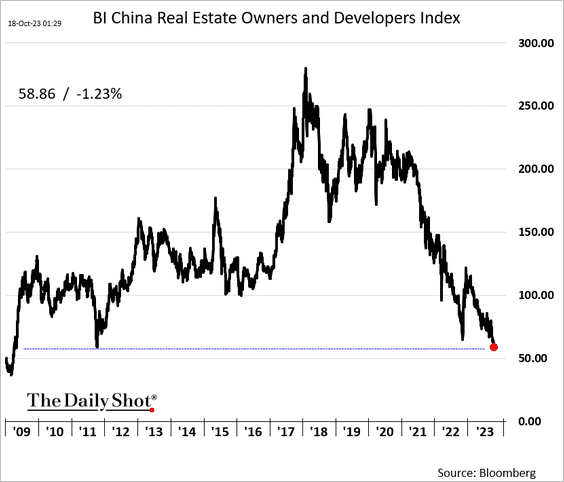
• Bloomberg’s real estate equity index hit the lowest level since 2009.
——————–
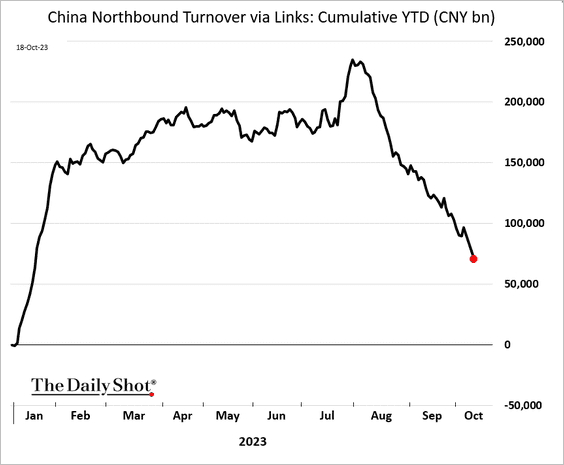
3. Beijing is struggling to contain the equity market rout, …
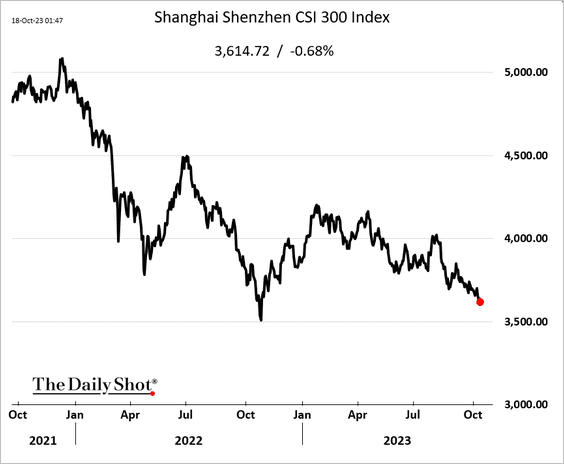
… as Hong Kong and foreign investors continue to pull capital out of mainland markets.
Back to Index
Commodities
1. The global corn market is expected to be in surplus next year, according to Capital Economics.
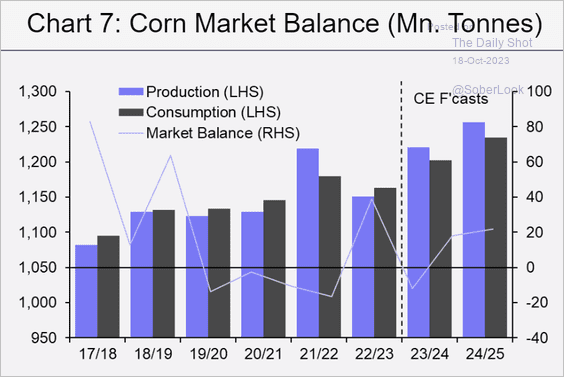 Source: Capital Economics
But the wheat market will be in deficit.
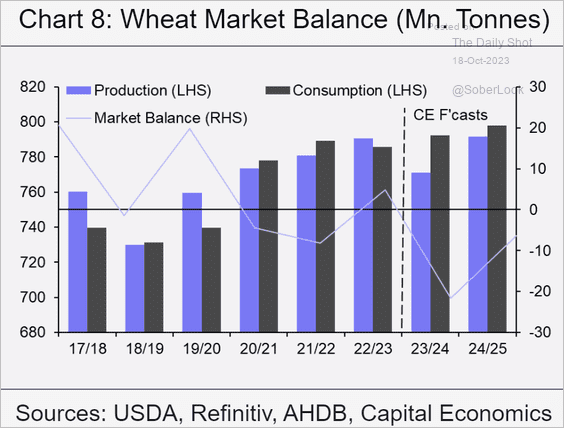 Source: Capital Economics
——————–
2. Sugar futures hit the highest level since 2011.
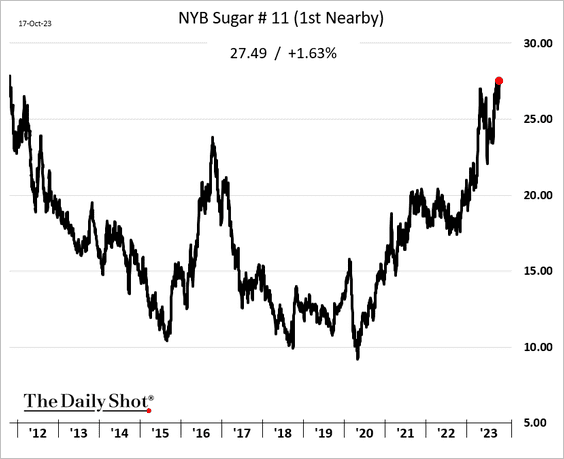
 Source: barchart.com Read full article
Back to Index
Equities
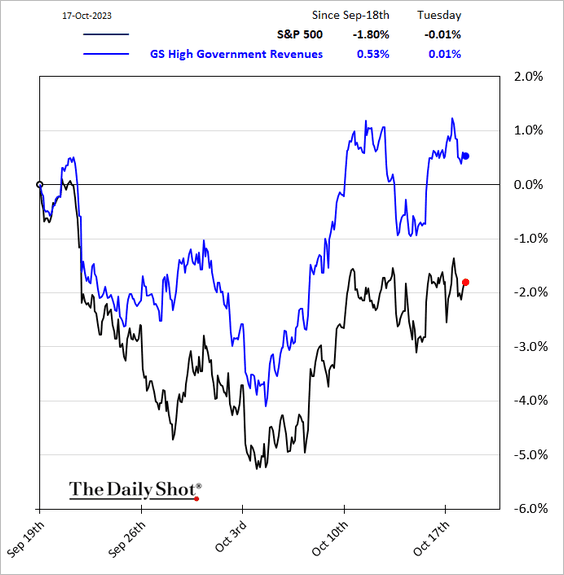
1. For now, the market is not too concerned about the looming government shutdown in November.
2. November is typically a strong month for inflows into equity ETFs and mutual funds.
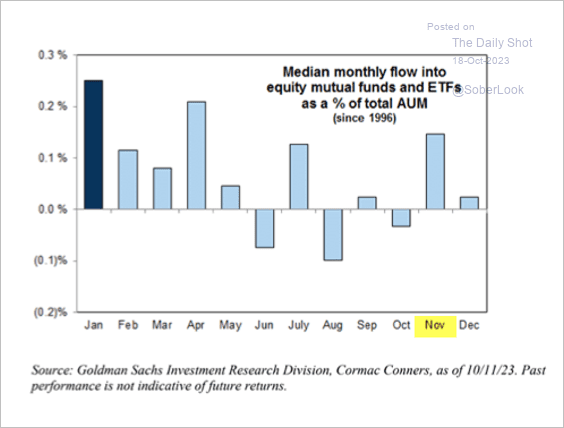 Source: Goldman Sachs
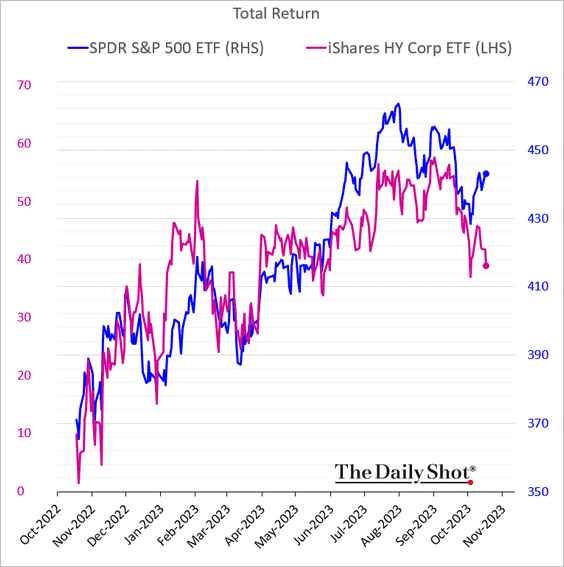
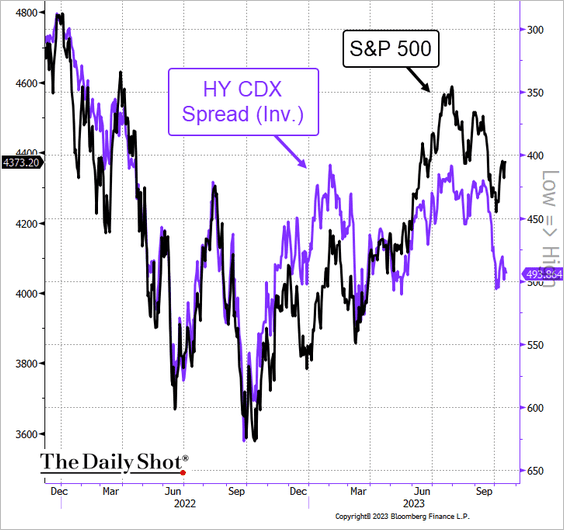
3. Equities have diverged from credit.
• The S&P 500 vs. high-yield bond prices
• The S&P 500 vs. the HY CDX spread:
 Source: @TheTerminal, Bloomberg Finance L.P.
——————–
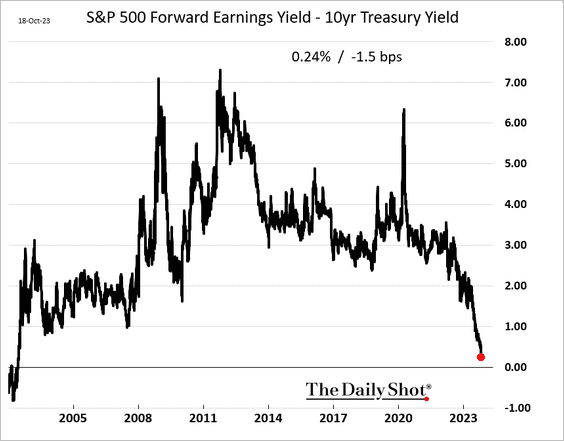
4. The S&P 500 equity risk premium is nearing zero for the first time in over two decades.
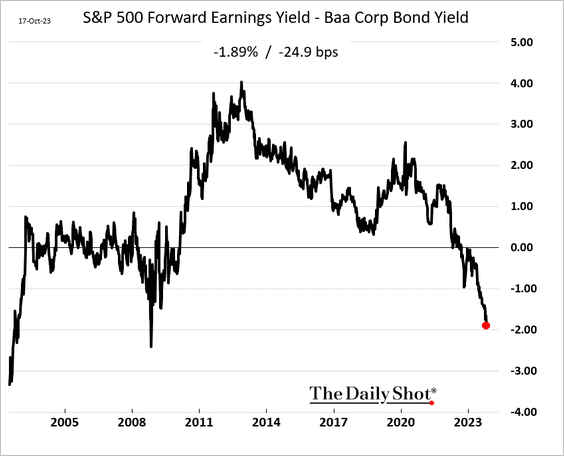
The S&P 500 forward earnings yield is now almost 2% below the yield offered by BBB-rated corporate bonds.
——————–
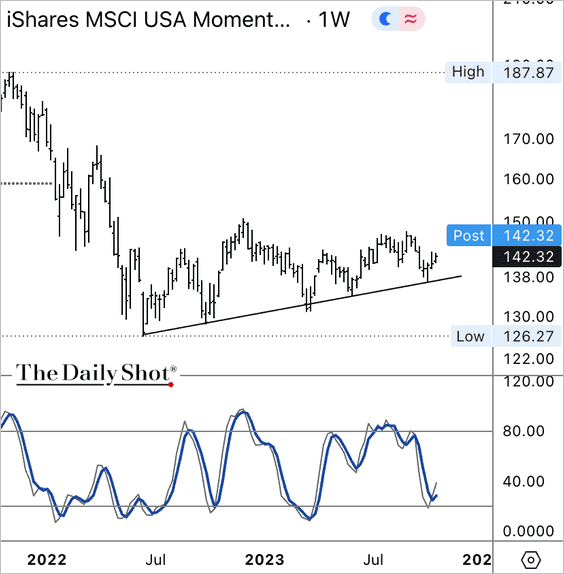
5. The iShares MSCI US Momentum Factor ETF (MTUM) is improving from oversold levels.
6. US small-cap stocks are entering a seasonally strong period.
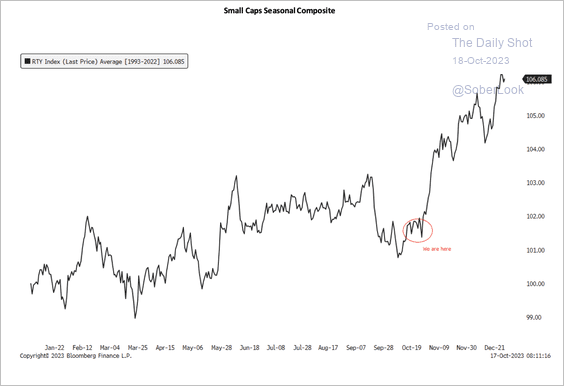 Source: Aazan Habib, Paradigm Capital
7. Here is a look at the evolution of market capitalization and income contribution by sector.
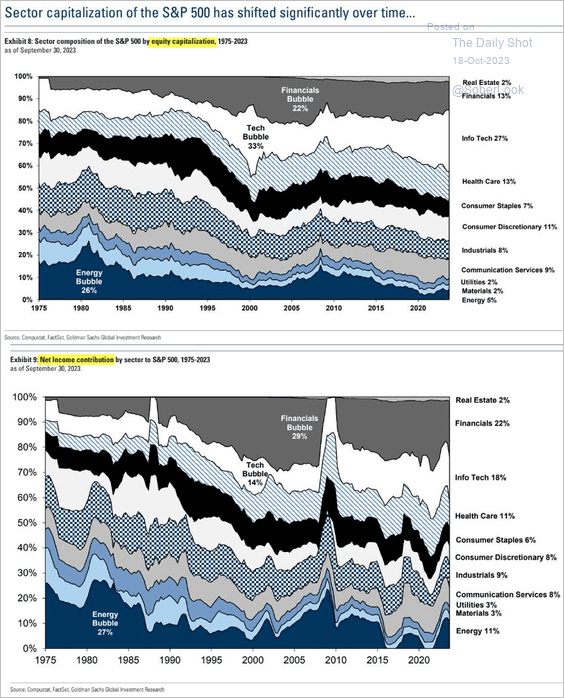 Source: Goldman Sachs; @MikeZaccardi
Back to Index
Credit
1. Near-term US high-yield maturity wall continues to climb.
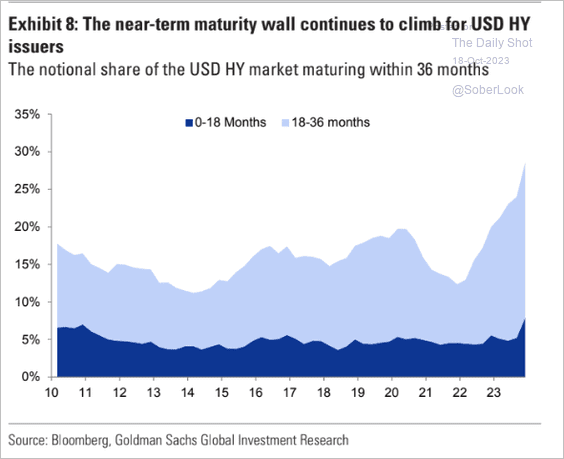 Source: Goldman Sachs; @MikeZaccardi
• The European high-yield market has a greater share of debt maturing in three years relative to the US.
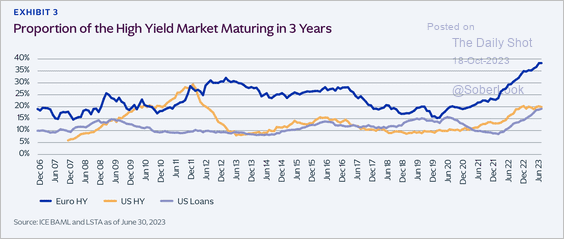 Source: KKR
——————–
2. Investment-grade firms are in for a refinancing shock. This chart shows the spread between the IG index average yield and the current coupon.
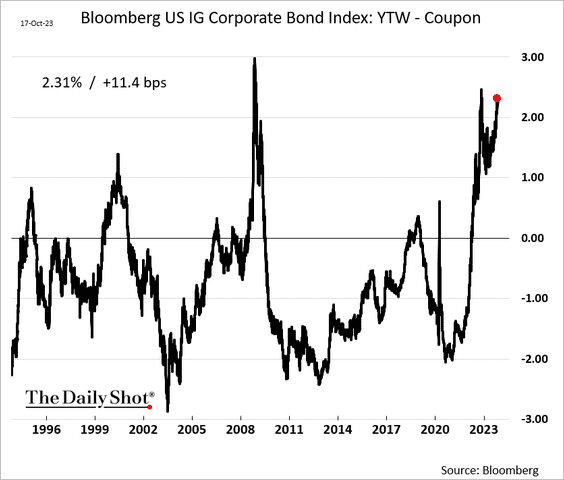 h/t Simon White
3. US investment-grade yields are at mid-2009 levels, while spreads are notably tighter. According to Breckinridge, this gap could compress if a recession occurs.
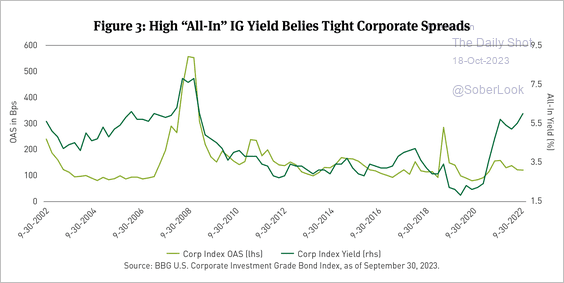 Source: Breckinridge Capital Advisors Read full article
4. Banks’ deposit costs will keep climbing even after the Fed pauses rate hikes.
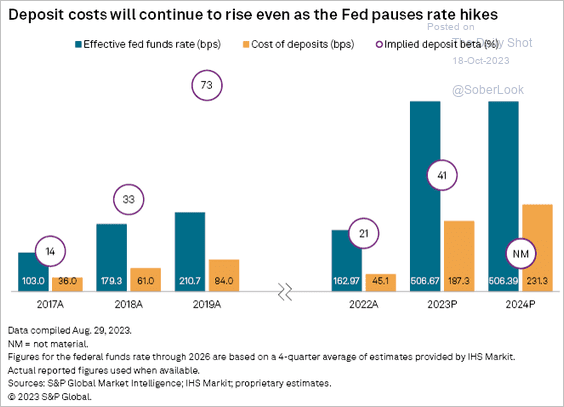 Source: S&P Global Market Intelligence
Back to Index
Rates
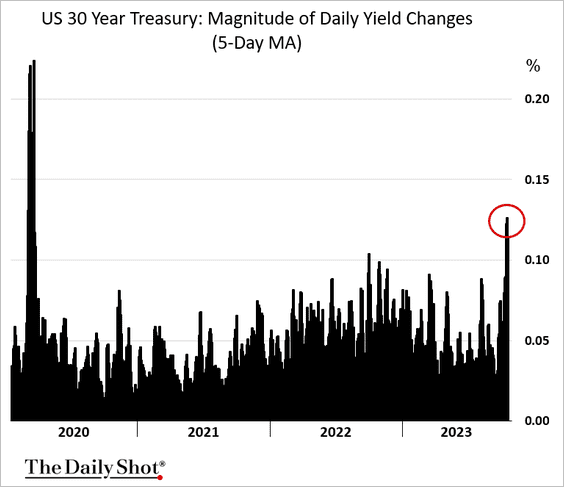
1. Longer-dated Treasury yield volatility surged in recent weeks.
 Further reading
2. According to Capital Economics, Treasury yields are peaking.
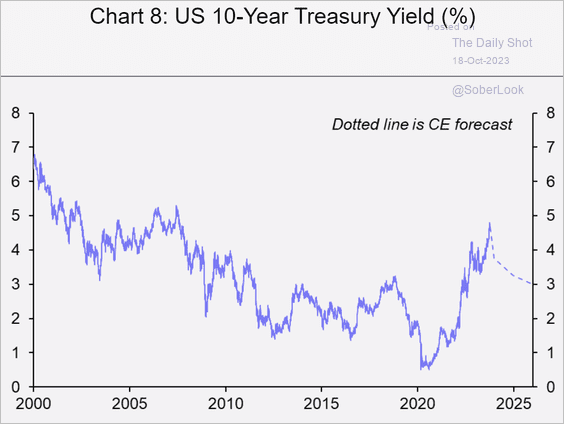 Source: Capital Economics
Back to Index
Global Developments
Is the IMF too upbeat on economic growth? Here is a comparison with the forecasts from Oxford Economics.
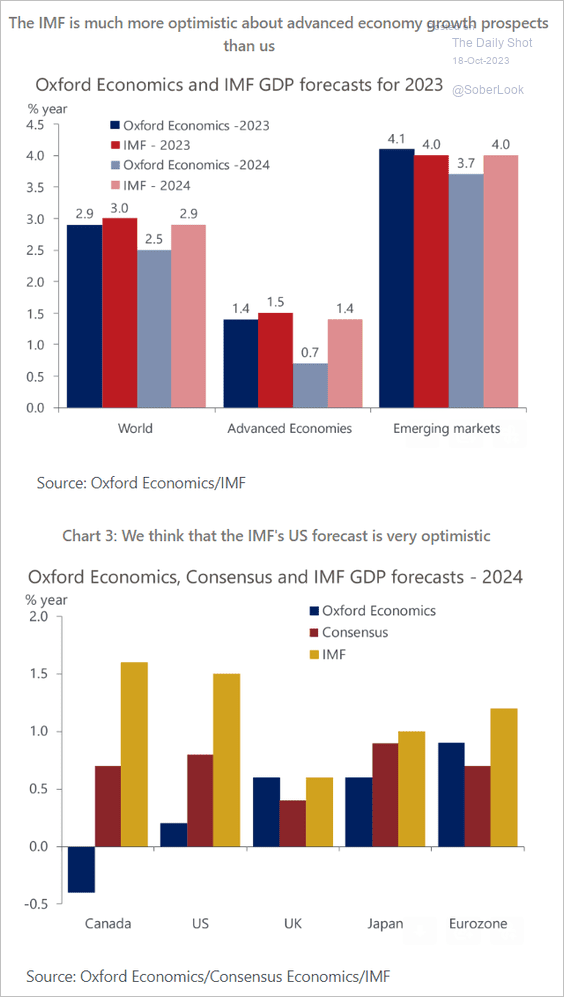 Source: Oxford Economics
——————–
Food for Thought
1. Union membership as a share of employment in the US:
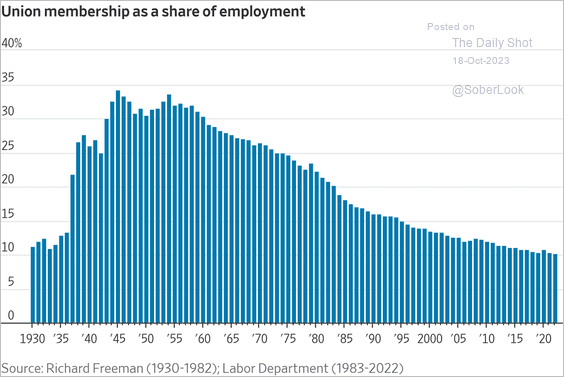 Source: @WSJ Read full article
2. Global electricity sources by fuel type:
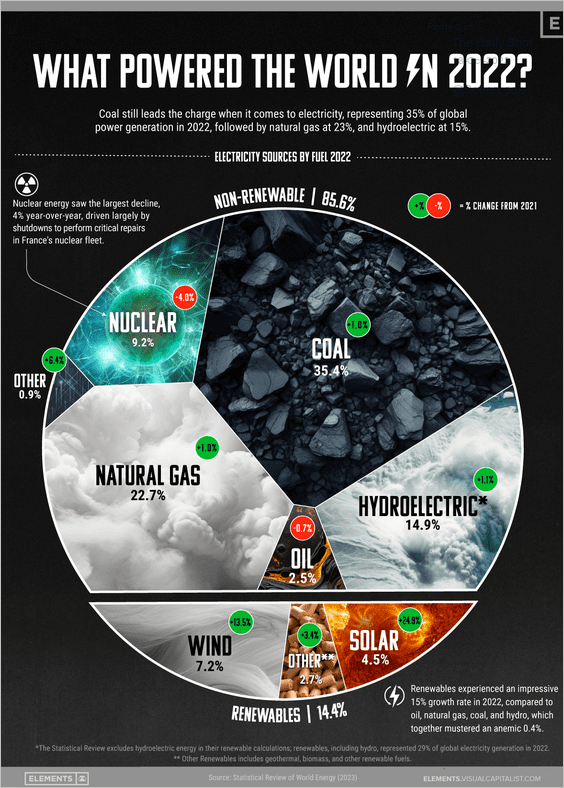 Source: Visual Capitalist Read full article
3. Americans without health insurance:
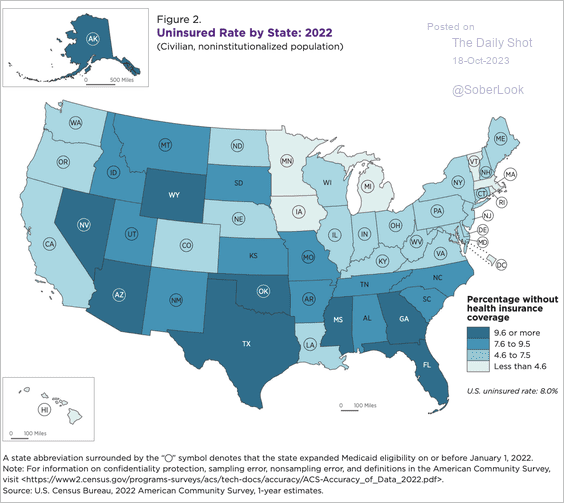 Source: US Census Bureau Read full article
4. The US Department of Defense spending on R&D and cyberspace activities (2 charts):
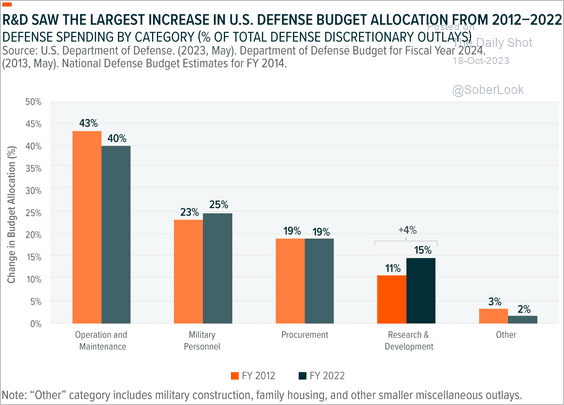 Source: Global X ETFs Read full article
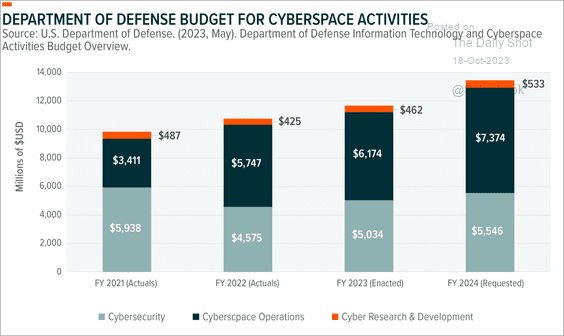 Source: Global X ETFs Read full article
——————–
5. Internet shutdowns:
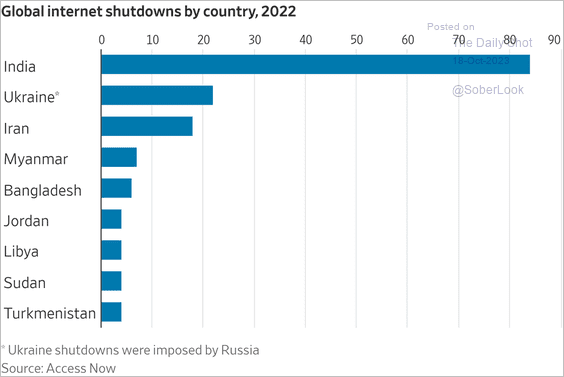 Source: @WSJ Read full article
6. The luxury watch market:
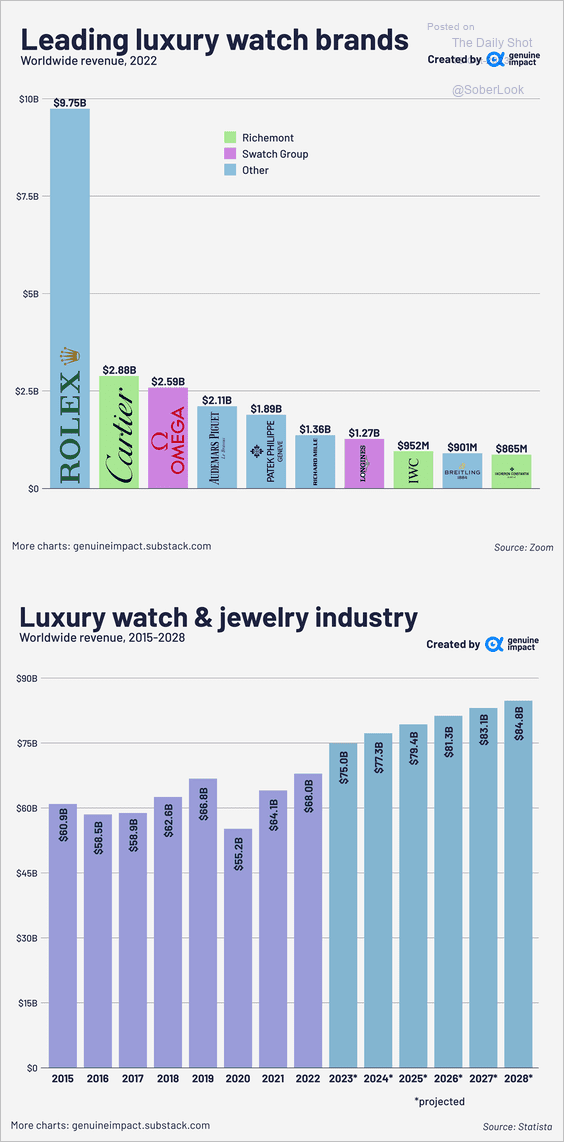 Source: @genuine_impact
• Secondhand luxury watch market prices:
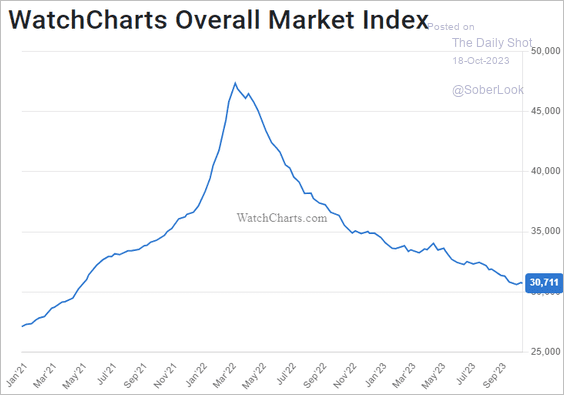 Source: WatchEnthusiasts
——————–
7. Staying connected with your pet:
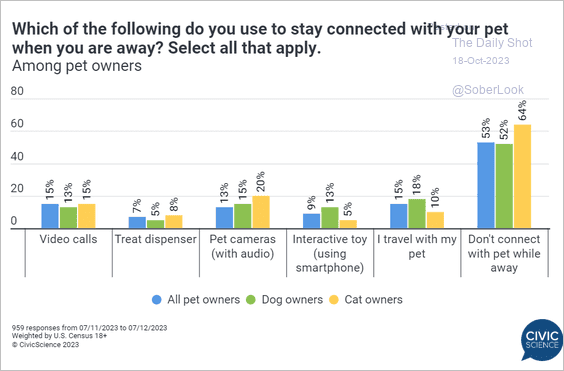 Source: @CivicScience Read full article
——————–
Back to Index