
The Daily Shot: 19-Oct-23
• The United States
• The United Kingdom
• The Eurozone
• Asia-Pacific
• China
• Emerging Markets
• Cryptocurrency
• Commodities
• Energy
• Equities
• Alternatives
• Credit
• Rates
• Global Developments
• Food for Thought
The United States
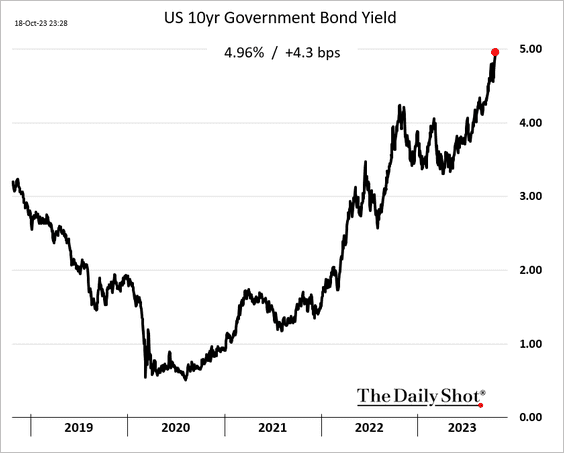
1. Treasury yields continue to surge.
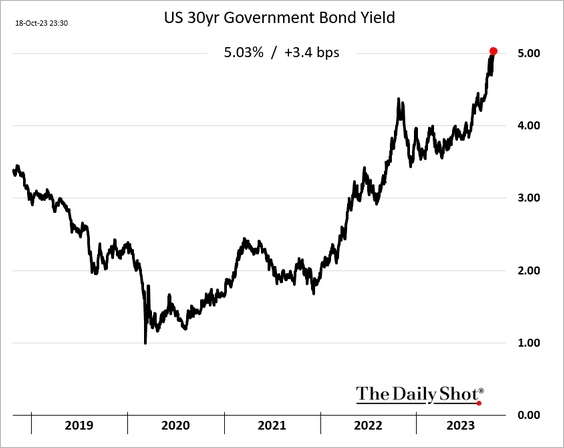
• The 10-year yield is nearing 5%, …
… and the long bond is already there.
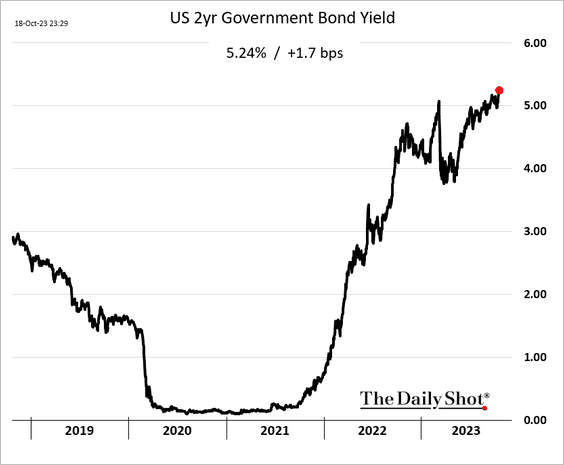
Here is the 2-year note.
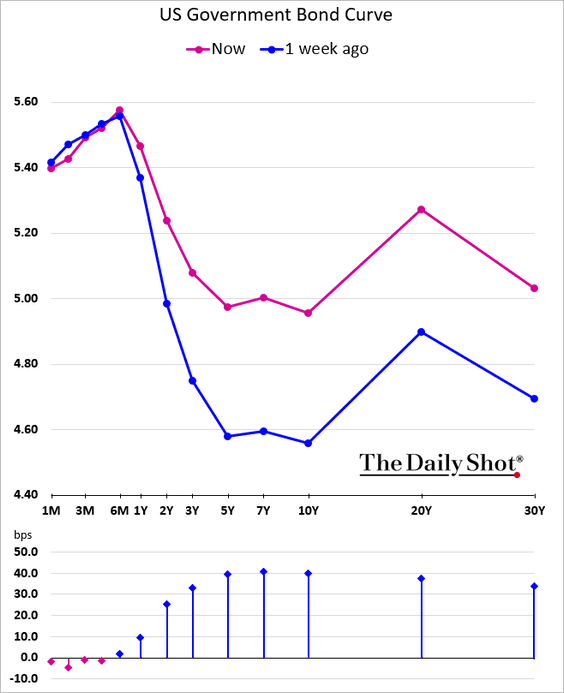
• Bear steepening continues.
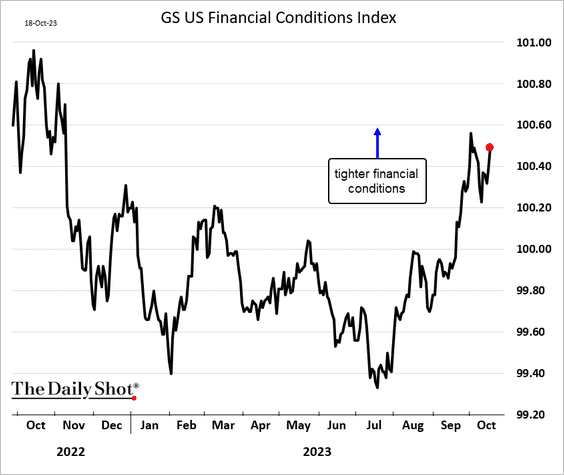
• Financial conditions are tightening.
• The 30-year mortgage rate hit 8%, according to Mortgage News Daily.
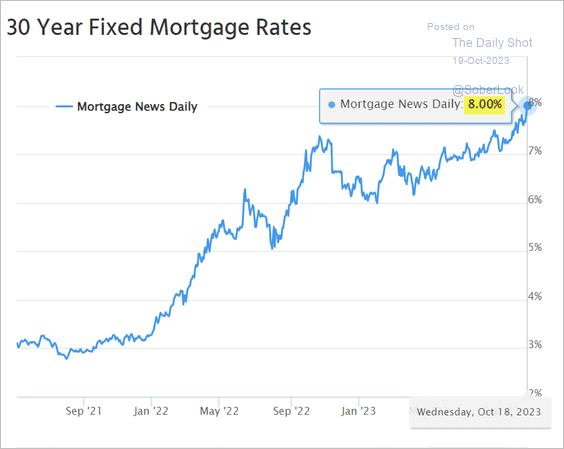 Source: Mortgage News Daily
——————–
2. Next, we have some updates on the housing market.
• Mortgage applications continue to weaken.
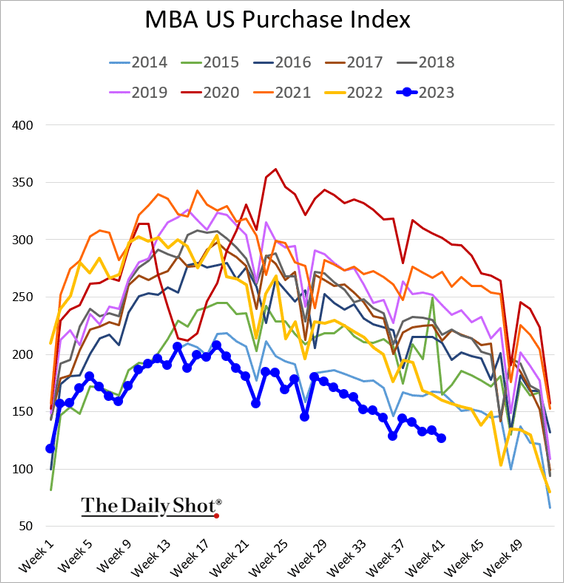
While the weekly seasonal adjustments on this index tend to be unreliable, it’s worth noting that the adjusted index of mortgage demand reached a multi-year low last week.
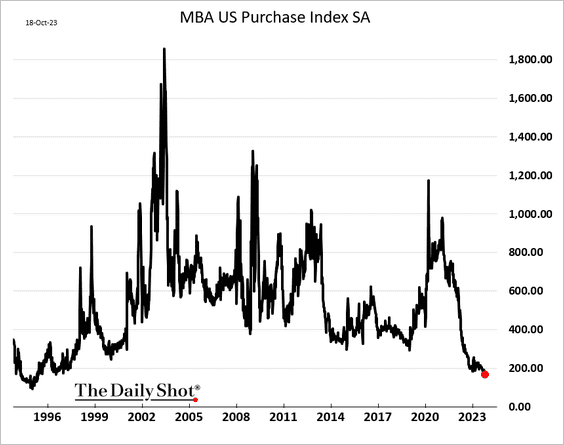
 Source: @markets Read full article
• Housing starts got a boost from single-family home construction last month, …
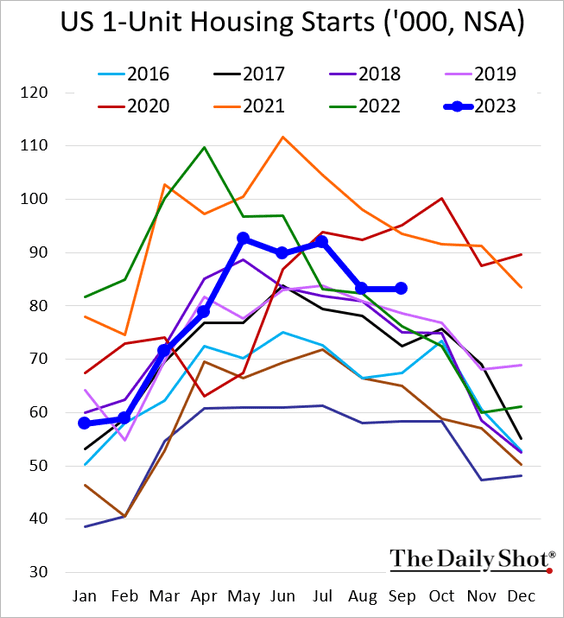
… which is up 9% vs. last year.
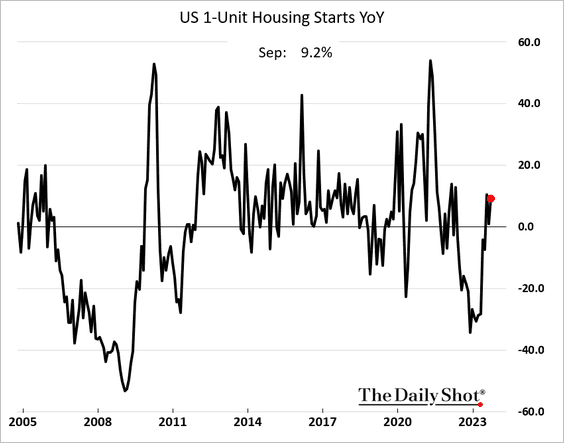
 Source: Reuters Read full article
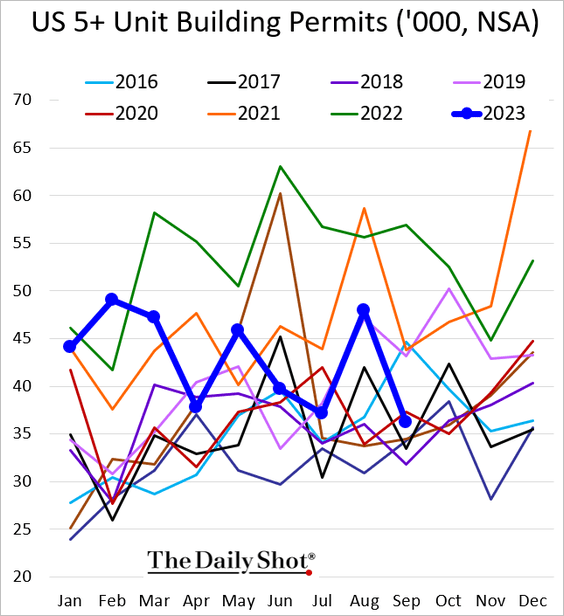
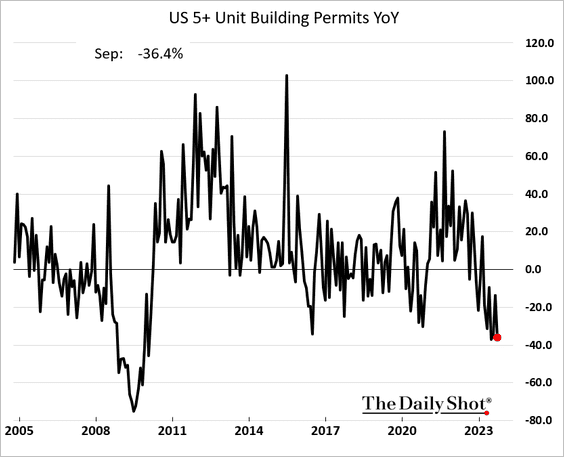
– Building permits softened, …
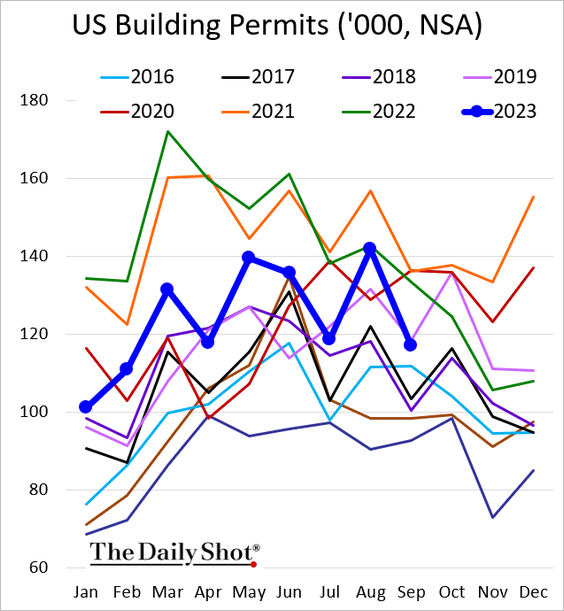
… with multifamily activity struggling (2 charts).
——————–
• Unlike many other advanced economies, the United States has not seen a commensurate increase in the number of homes to match its population growth.
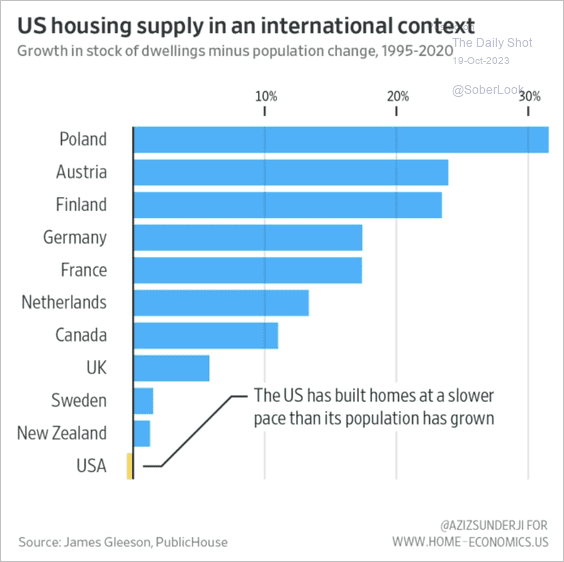 Source: @financialtimes Read full article
• How much do new homebuyers need to earn to afford a median-priced home?
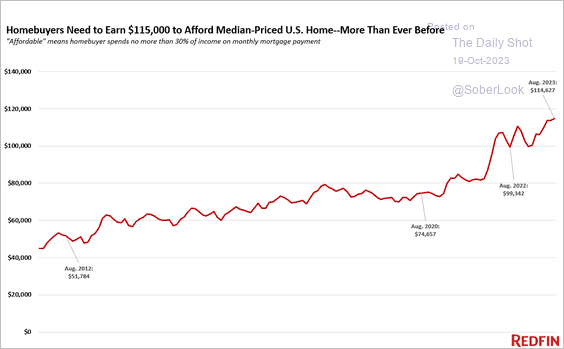 Source: Redfin
• This has been a challenging year for existing-home sales.
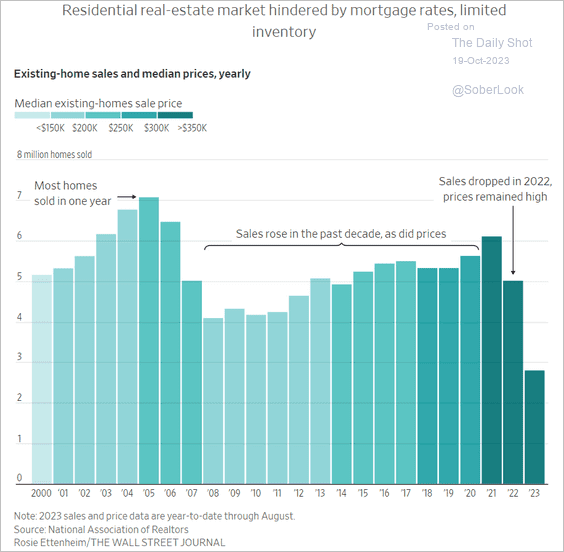 Source: @WSJ Read full article
• The duration of Americans residing in their homes has extended.
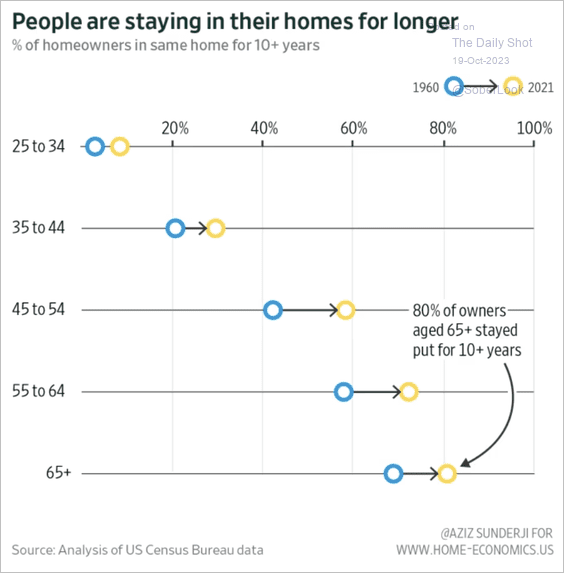 Source: @financialtimes Read full article
——————–
3. The Fed’s Beige Book suggests a relatively stable growth.
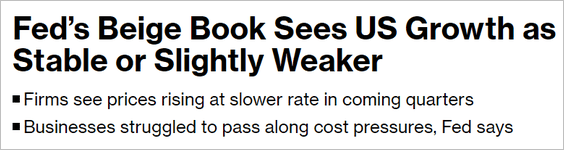 Source: @economics Read full article
Sentiment is weaker but above recessionary levels, according to Oxford Economics.
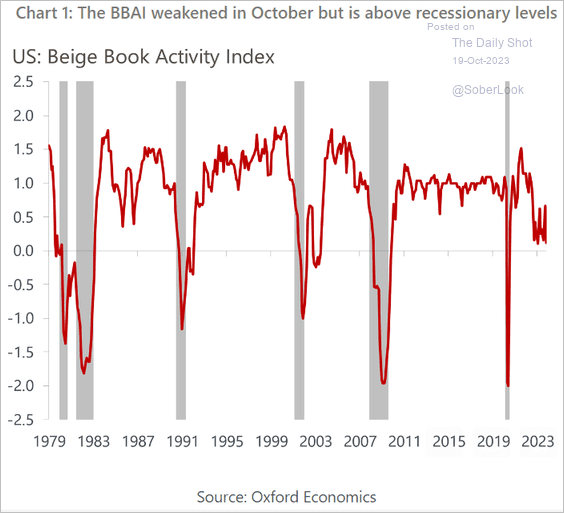 Source: Oxford Economics
Businesses were very concerned about rising rates.
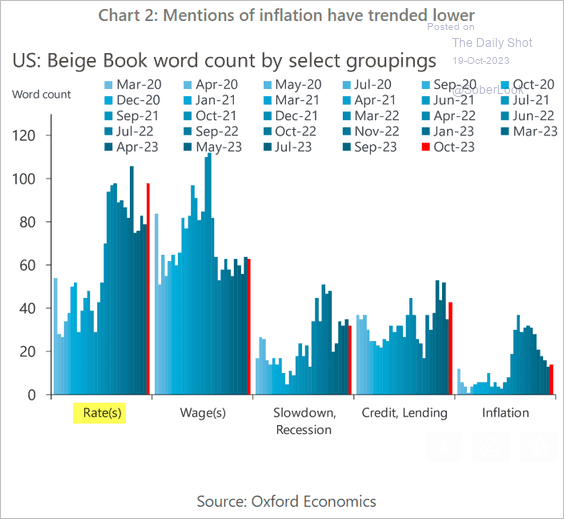 Source: Oxford Economics
——————–
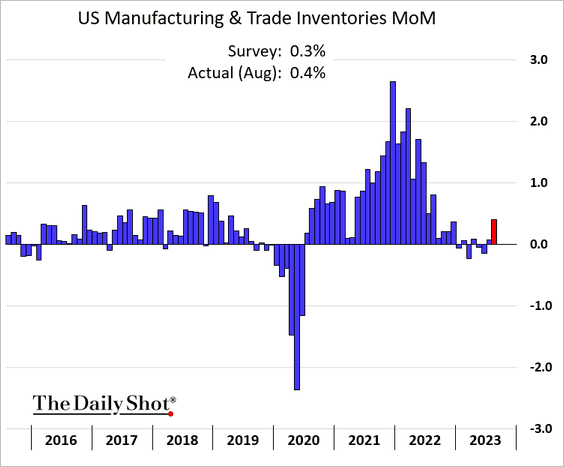
4. Business inventories jumped in August.
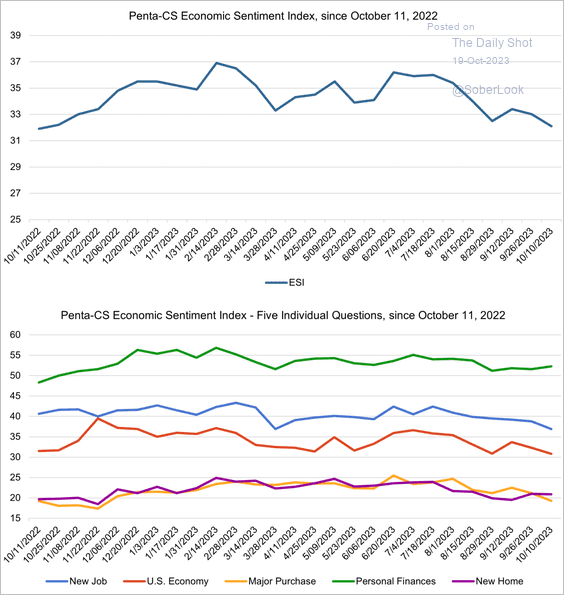
5. Consumer sentiment deteriorated further this month, according to the Penta-CivicScience Economic Sentiment Index.
 Source: Penta/CivicScience
Back to Index
The United Kingdom
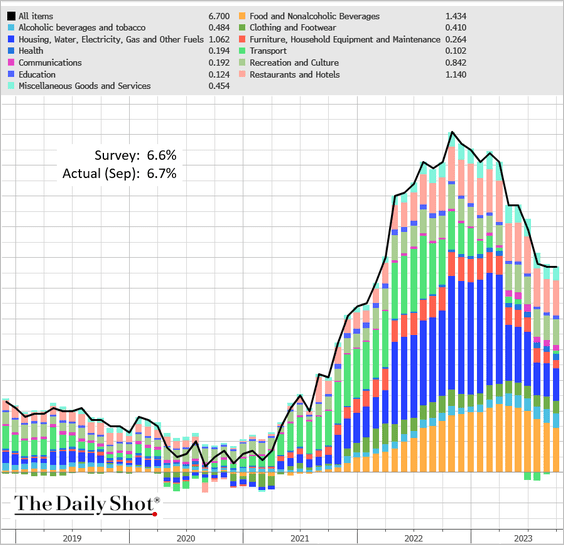
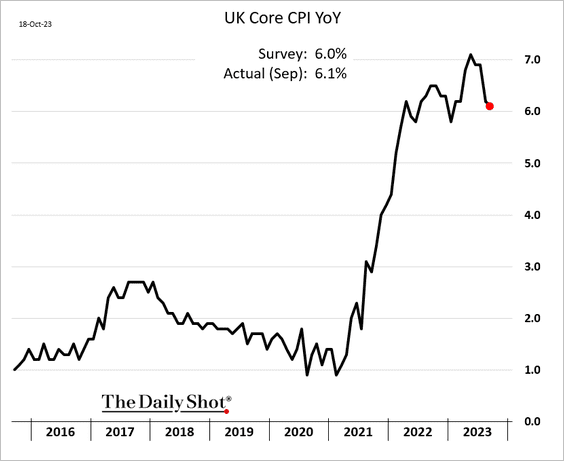
1. The CPI report was a bit firmer than expected.
 Source: @TheTerminal, Bloomberg Finance L.P.
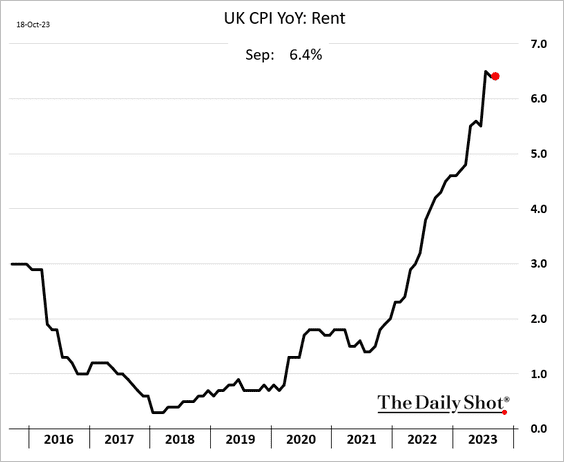
• Core inflation is holding above 6% (year-over-year), …
… boosted by services inflation, …
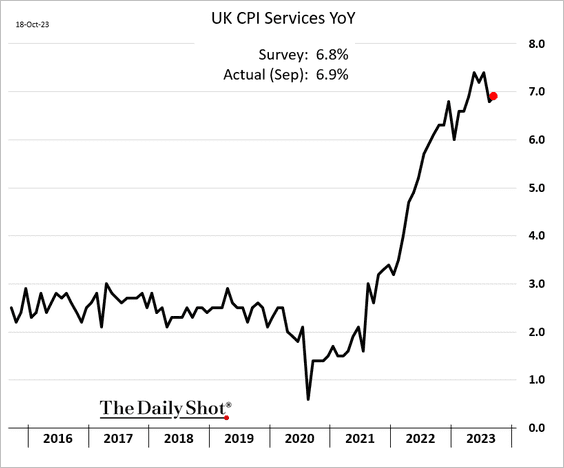
… particularly rent (2 charts).
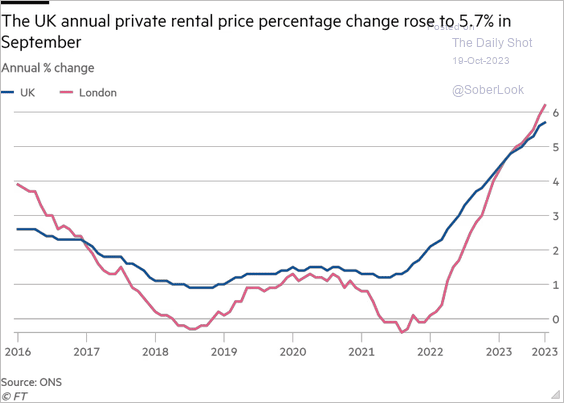 Source: @financialtimes Read full article
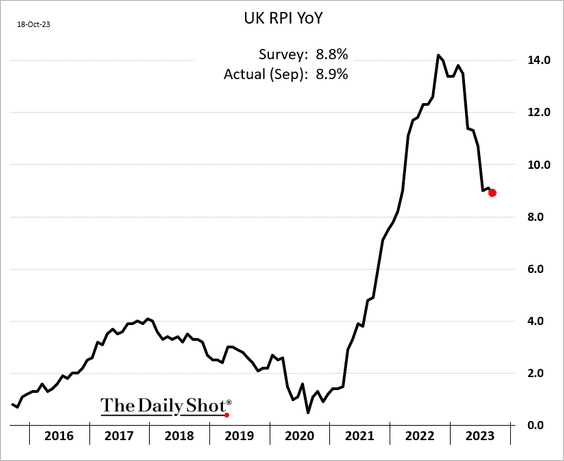
• Retail inflation is moderating but is still near 9%.
——————–
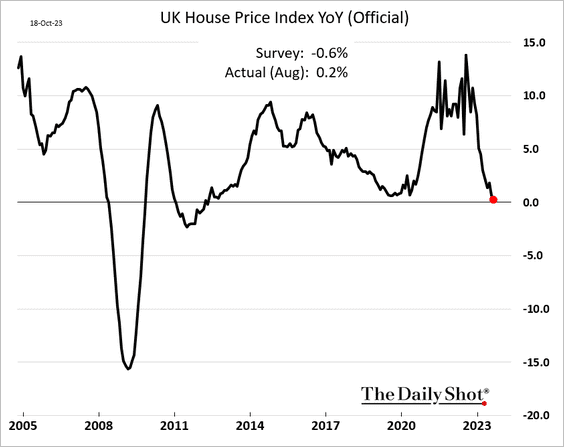
2. The official measure of home price appreciation held in positive territory in August (the market expected a decline.)
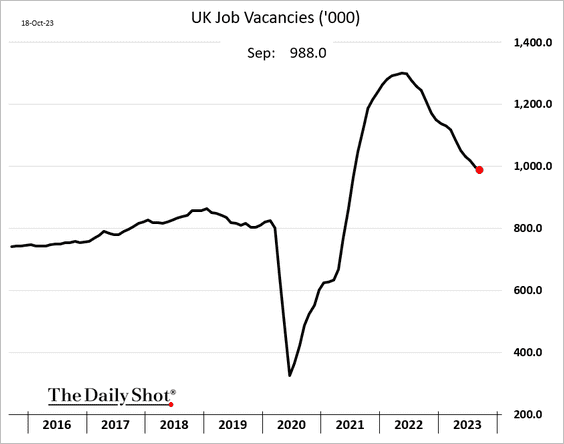
3. Job vacancies continue to trend lower.
Back to Index
The Eurozone
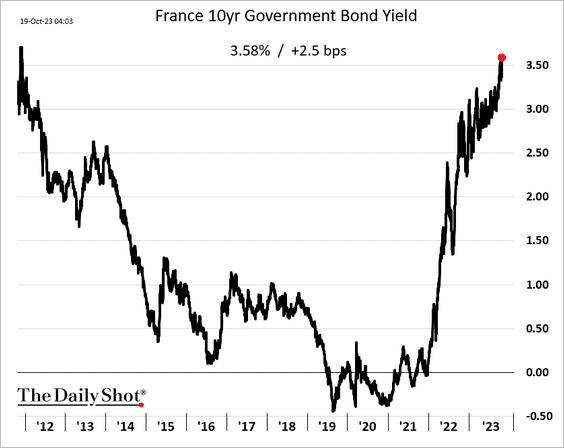
1. Euro-area bond yields are climbing, with the French 10-year rate reaching the highest level in over a decade.
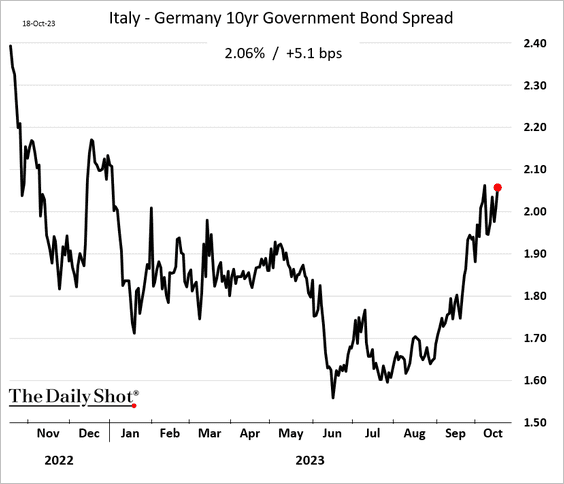
• Italian bond spreads have been widening.
——————–
2. The final CPI report confirmed moderating core inflation.
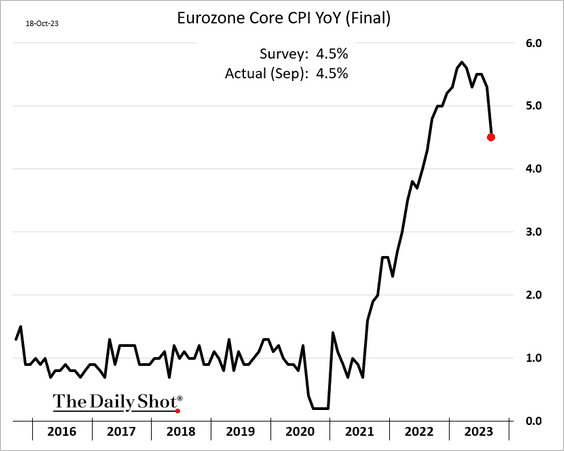
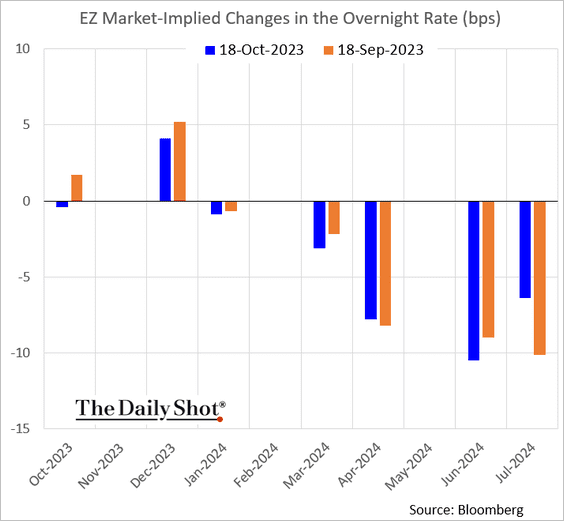
The market sees little chance of another ECB rate hike.
Back to Index
Asia-Pacific
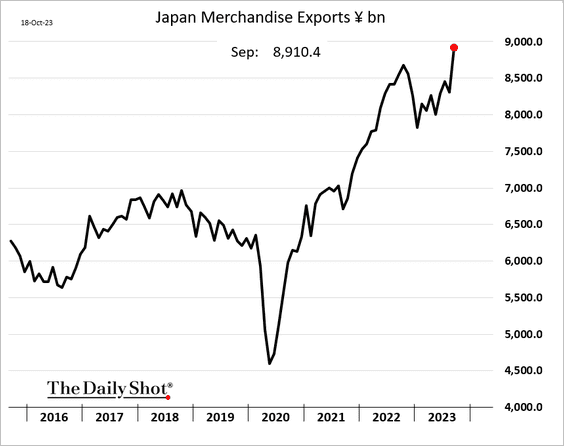
1. Japan’s trade deficit was narrower than expected last month, …
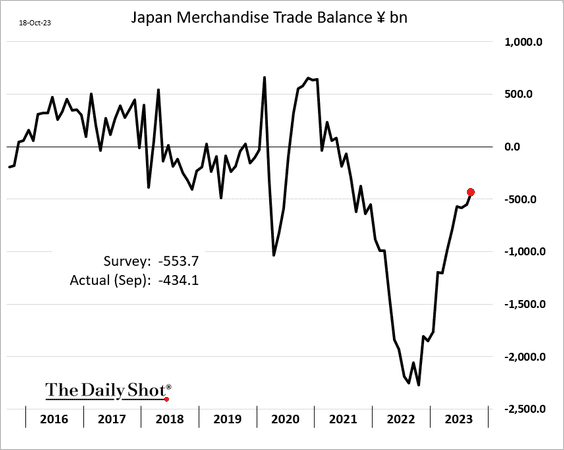
… as exports hit a record high.
——————–
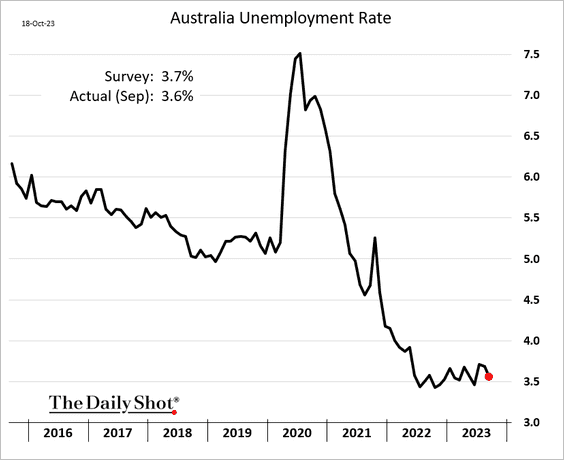
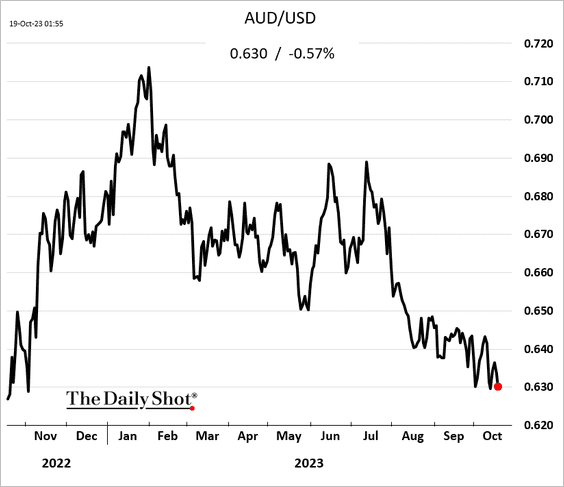
2. The Australian employment report was disappointing, revealing a significant drop in the number of full-time positions.
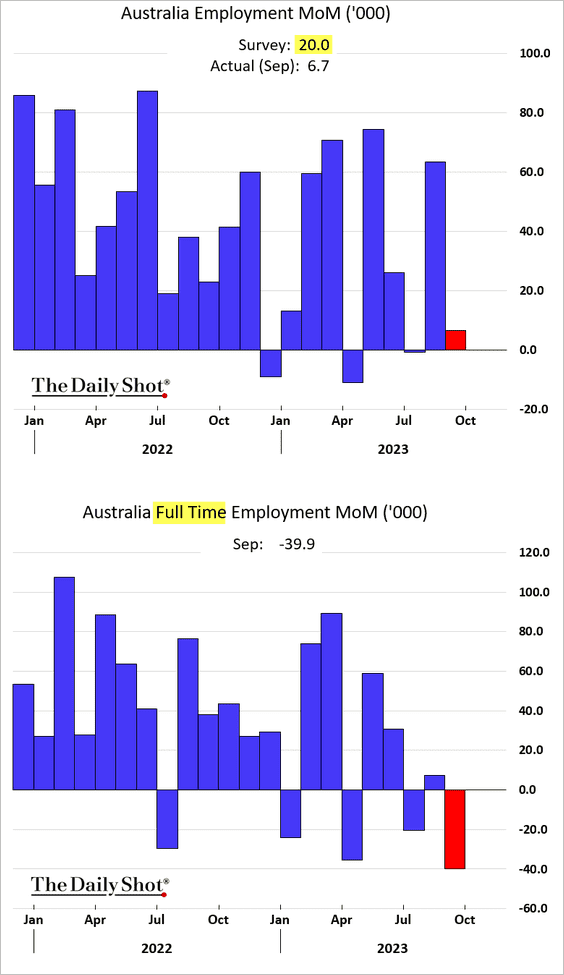
– The unemployment rate remains very low.
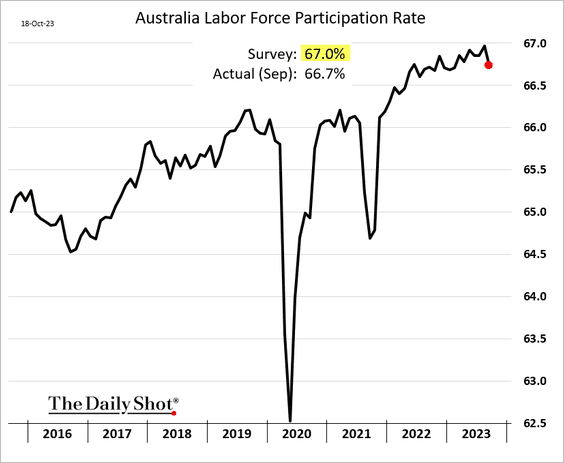
– Labor force participation declined.
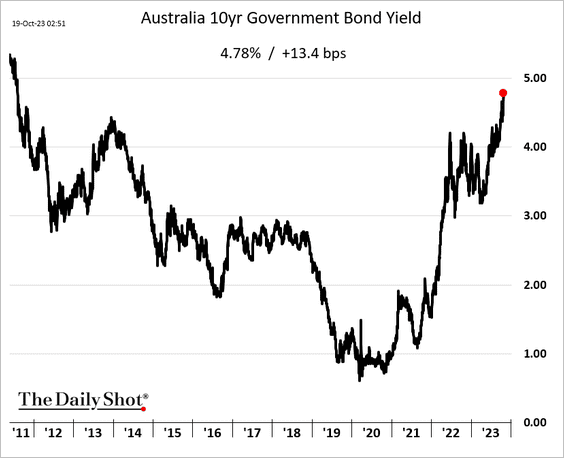
• Nonetheless, the 10-year government bond yield hit a multi-year high.
• The Aussie dollar softened.
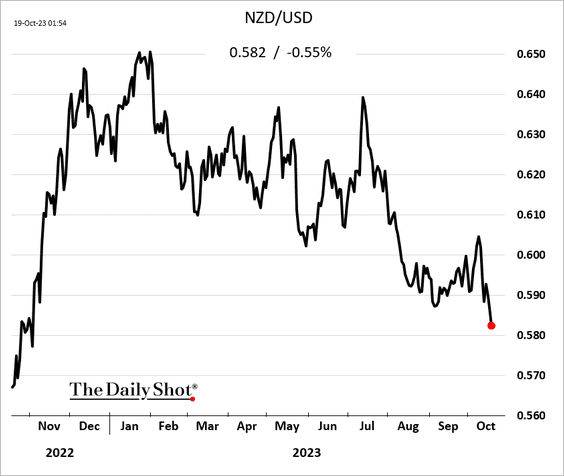
3. The Kiwi dollar is tumbling vs. USD.
Back to Index
China
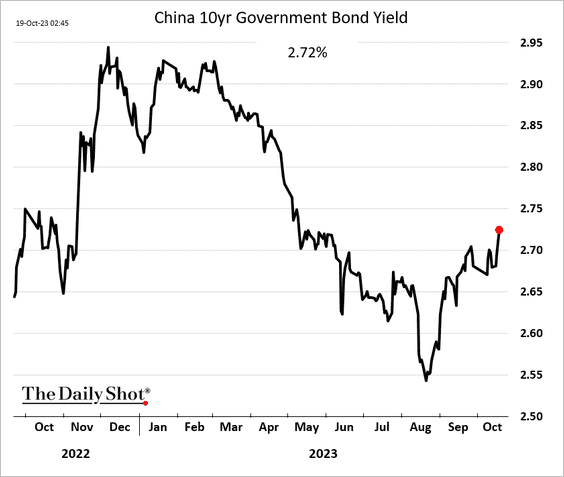
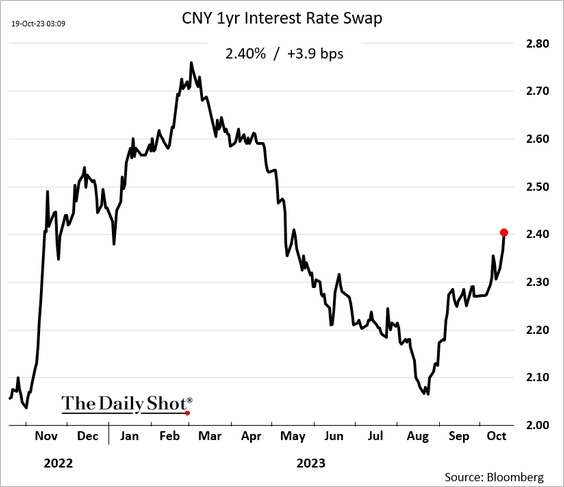
1. Market rates are rising, which further tightens China’s financial conditions.
• The 10-year yield:
• The 1-year interest rate swap:
——————–
2. The Shanghai Shenzhen CSI 300 Index is nearing 3,500. Will we see a much more forceful stock market intervention from Beijing at that level?
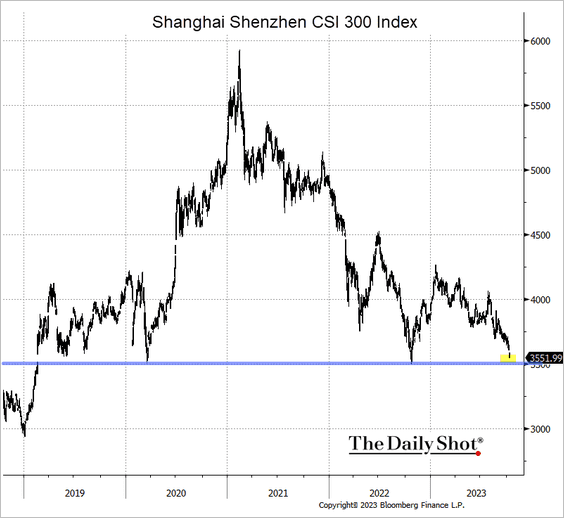 Source: @TheTerminal, Bloomberg Finance L.P.
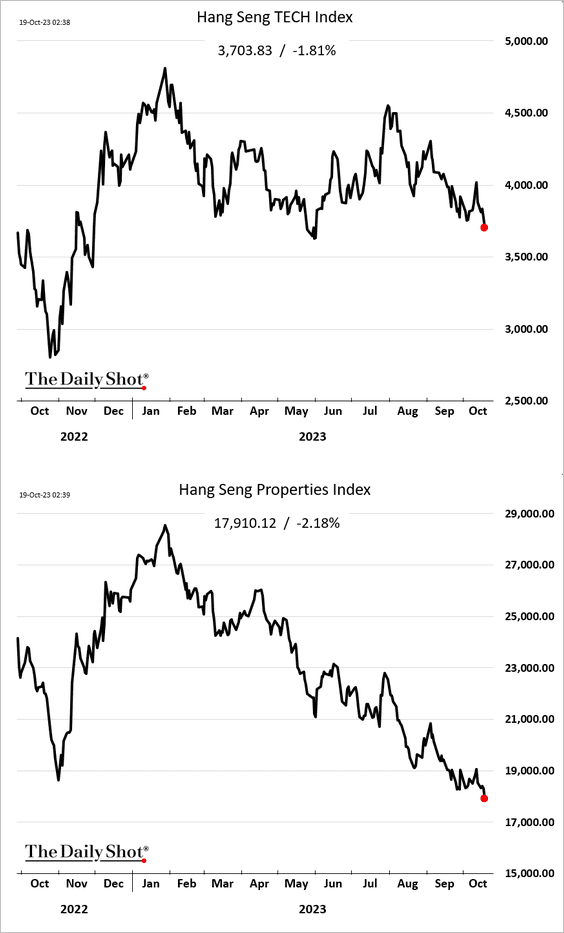
Stocks are falling in Hong Kong as well.
——————–
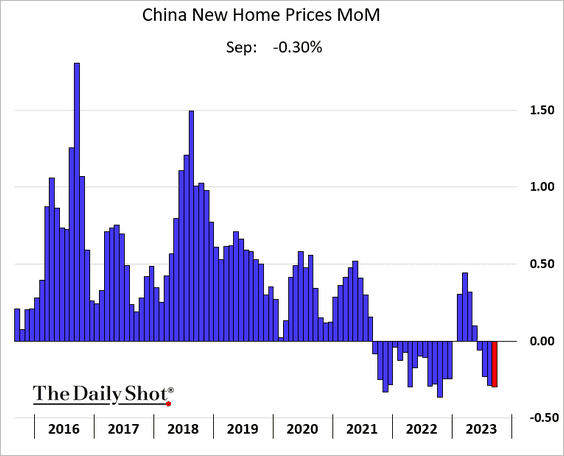
3. China reported its fourth consecutive decline in new home prices.
Back to Index
Emerging Markets
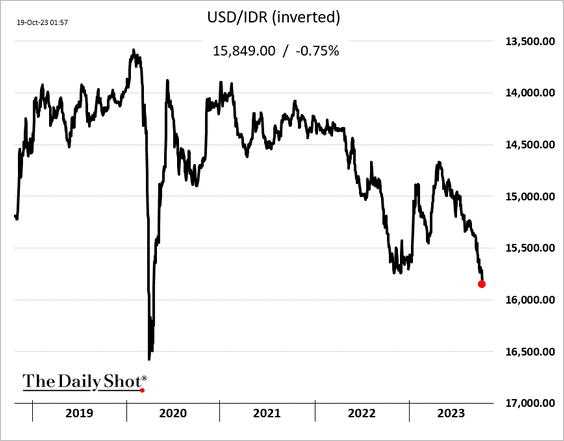
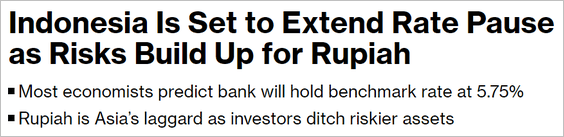
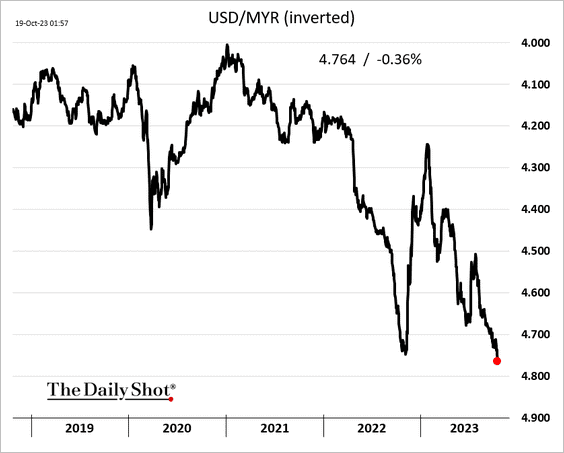
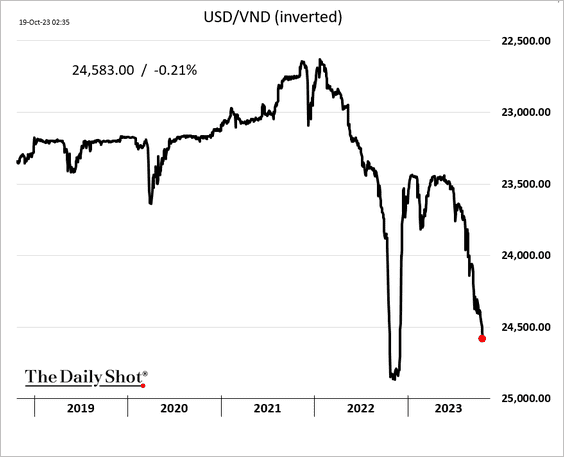
1. Asian currencies are under pressure.
• The Indonesian rupiah:
 Source: @economics Read full article
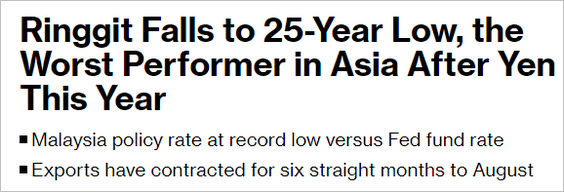
• The Malaysian ringgit:
 Source: @markets Read full article
• The Vietnamese dong:
——————–
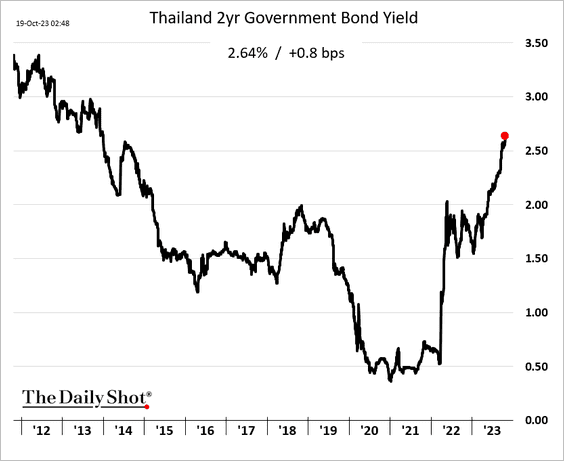
2. Thai bond yields continue to climb.
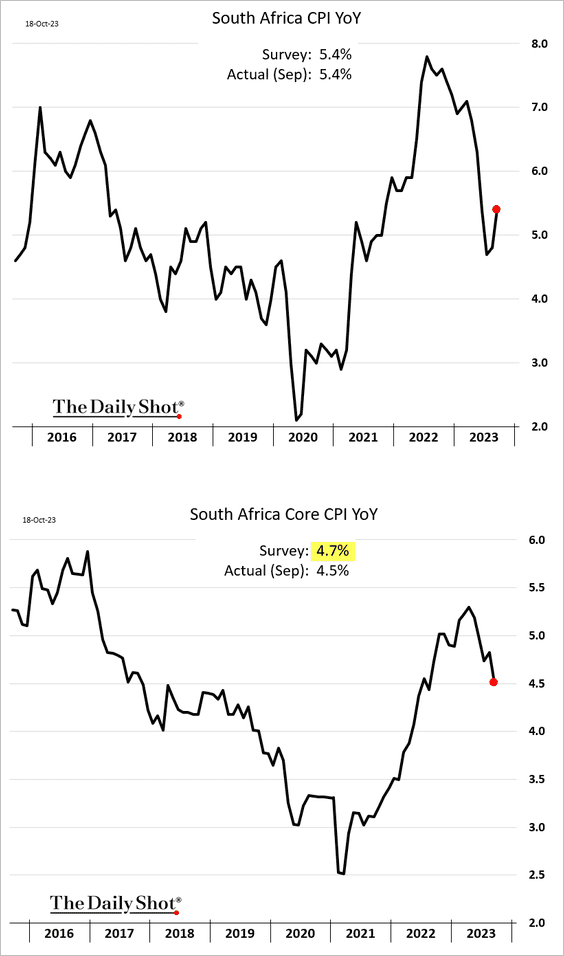
3. South Africa’s September core inflation was below forecasts.
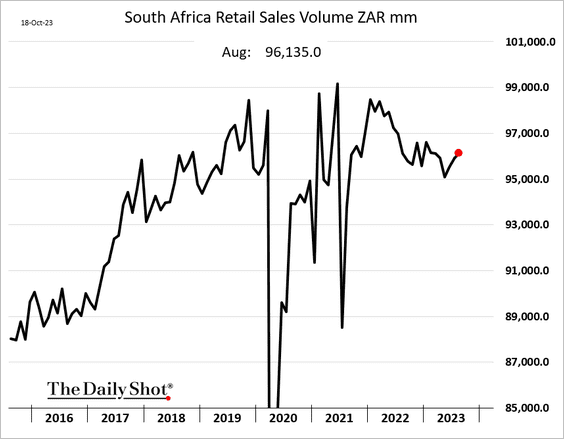
• Retail sales are rebounding.
——————–
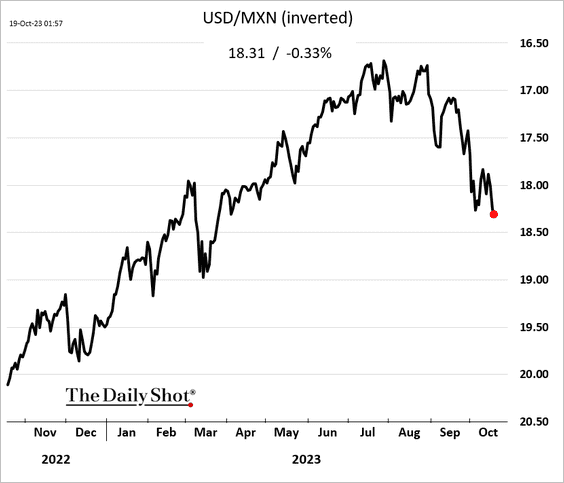
4. The Mexican peso is rolling over.
 Source: FXS Read full article
• Brazil and Mexico are now the top oil producers in the LatAm region.
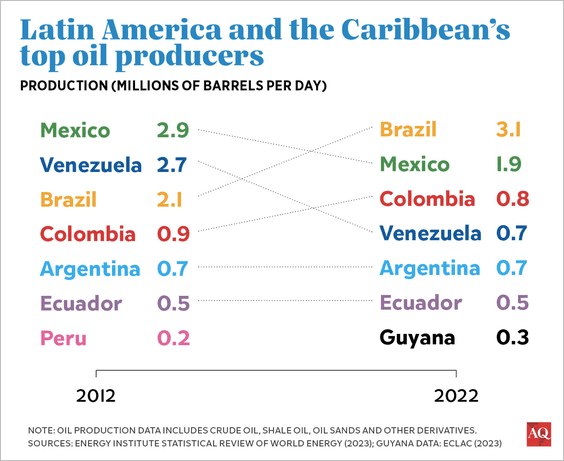 Source: Americas Quarterly Read full article
——————–
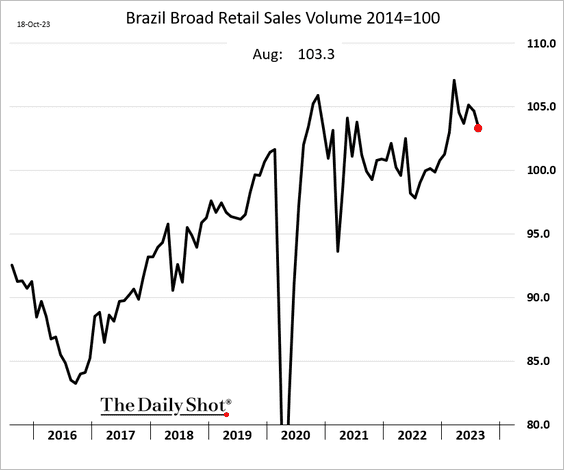
5. Brazil’s retail sales have been slowing.
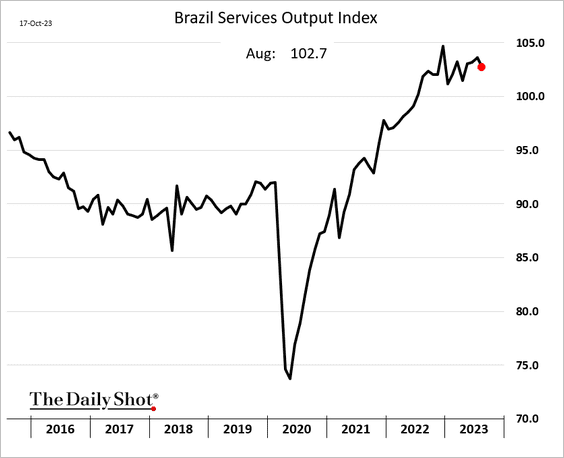
• Services output declined in August.
——————–
6. MRB Partners expects EM sovereign bond spreads to tighten further as central banks cut rates in the context of “higher-for-longer” rates in developed markets.
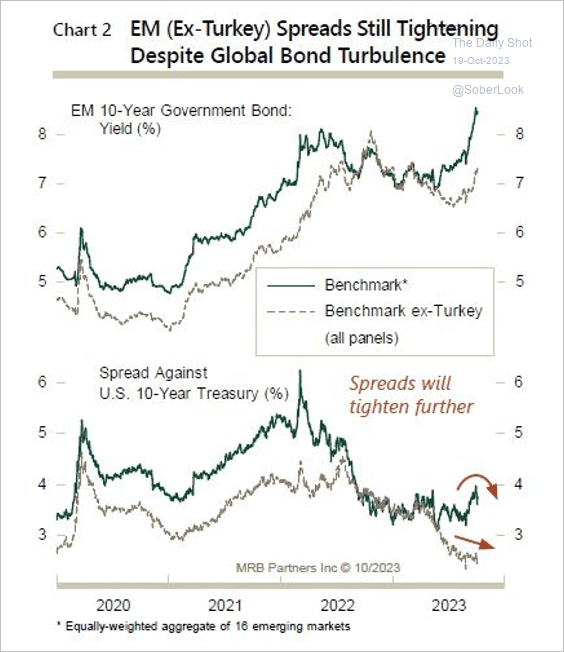 Source: MRB Partners
Back to Index
Cryptocurrency
1. Bitcoin Cash (BCH) and BTC have outperformed other top cryptos over the past week.
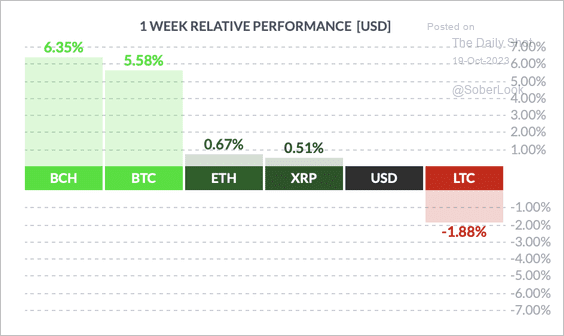 Source: FinViz
By the way, BCH has improved the most in Kaiko’s liquidity rankings over the past quarter.
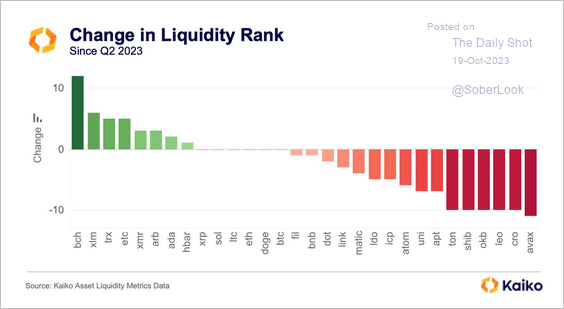 Source: @KaikoData
——————–
2. A record 76% of the Bitcoin network is locked up with long-term holders (based on their average cost basis recorded on the blockchain).
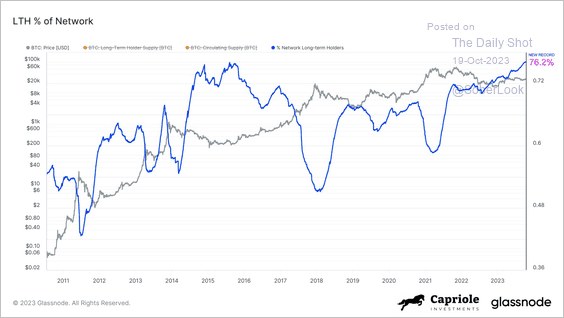 Source: @caprioleio
3. Bitcoin’s correlation with the MSCI World Index increased over the past few months.
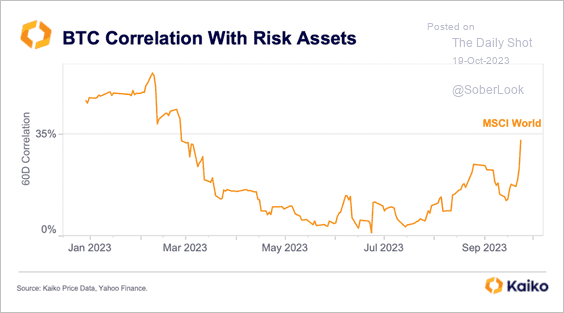 Source: @KaikoData
Back to Index
Commodities
1. Gold broke above the 200-day moving average this week.
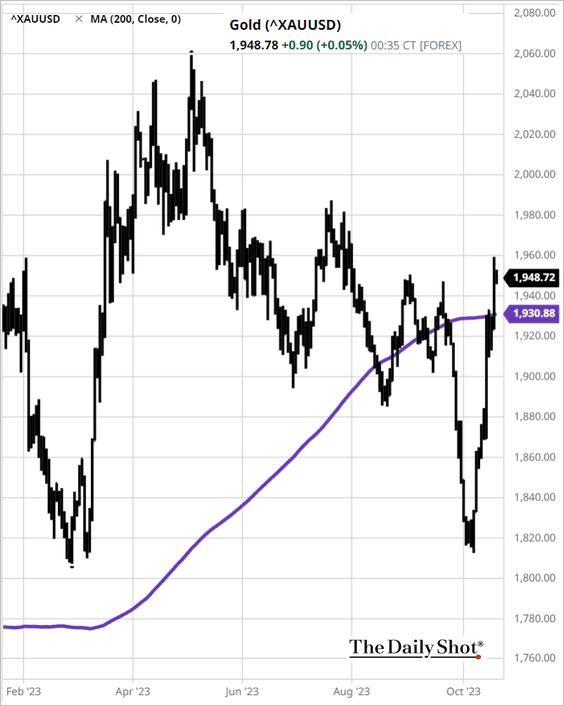 Source: barchart.com
• How did gold perform during previous geopolitical events?
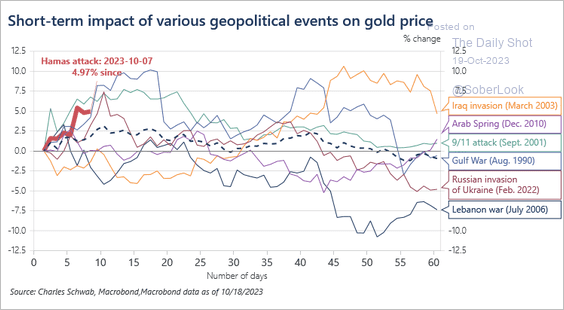 Source: @JeffreyKleintop
2. Silver held resistance at the 200-day moving average.
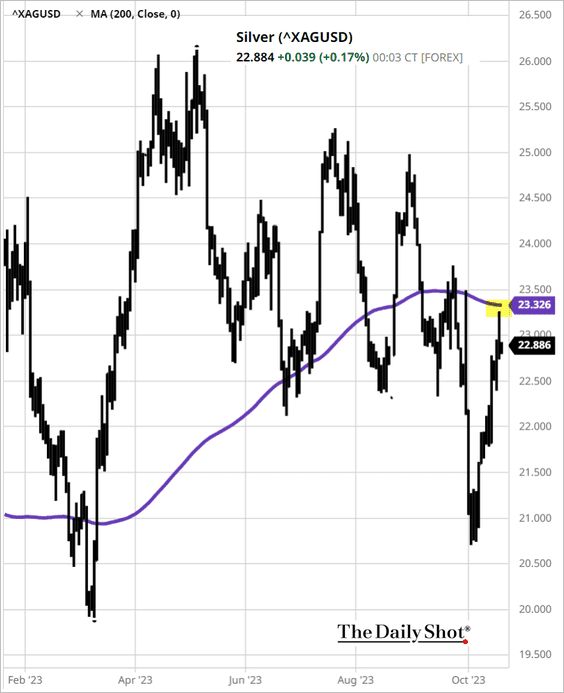 Source: @TheTerminal, Bloomberg Finance L.P.
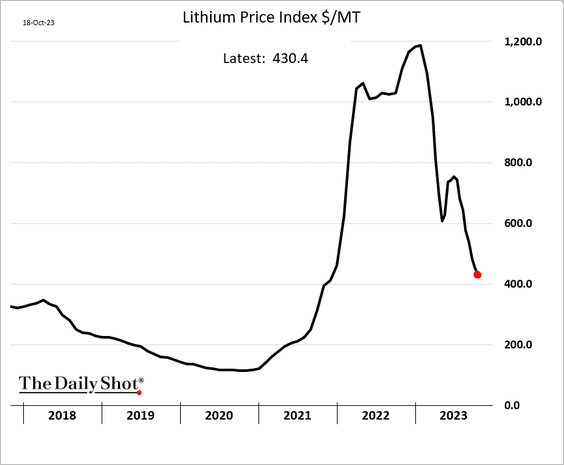
3. Lithium shares are under pressure, …
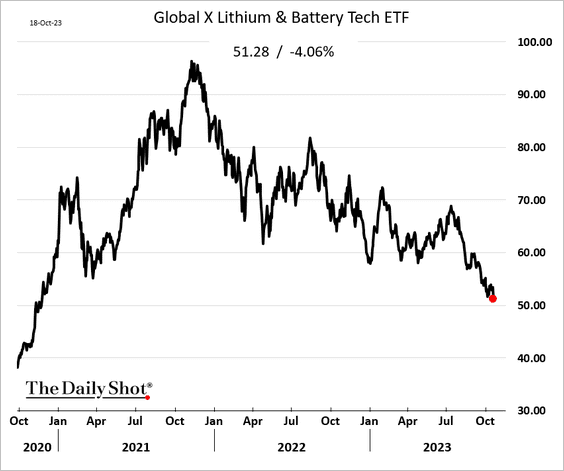
 Source: Morningstar Read full article
… as lithium prices keep moving lower.
——————–
4. This chart shows Ukraine’s and Russia’s wheat production.
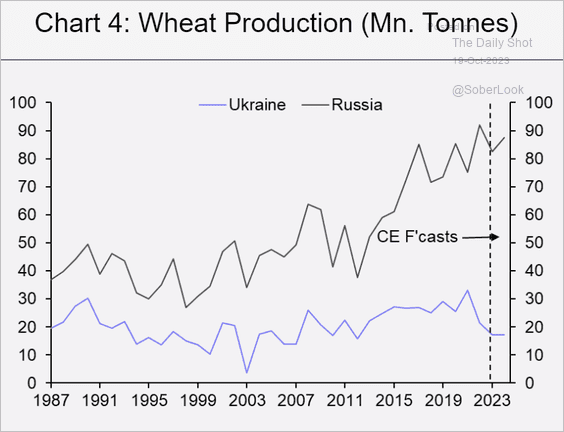 Source: Capital Economics
Back to Index
Energy
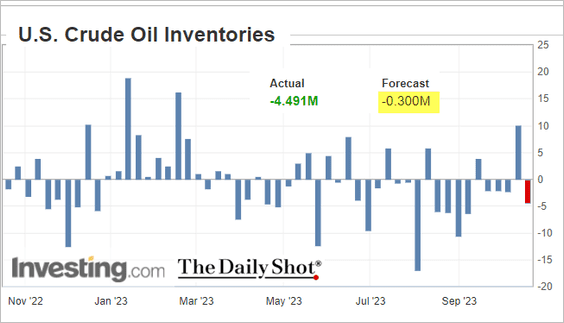
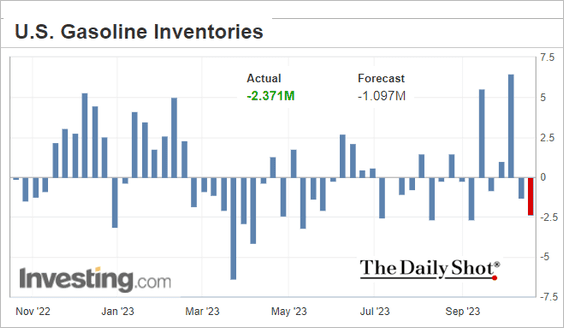
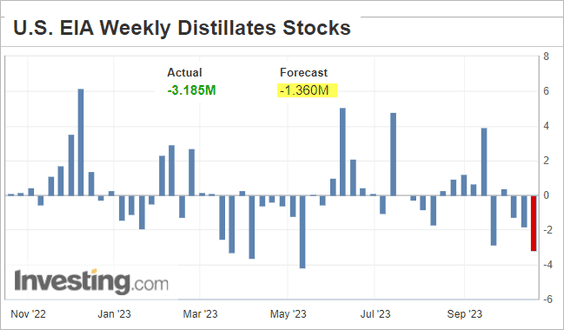
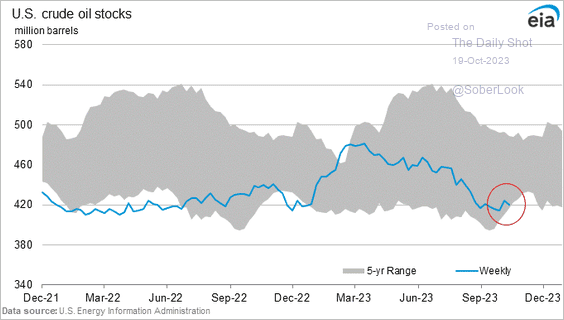
1. US crude oil and refined product stockpiles declined more than expected last week.
– Oil (week-over-week, mm bbl):
– Gasoline:
– Distillates:
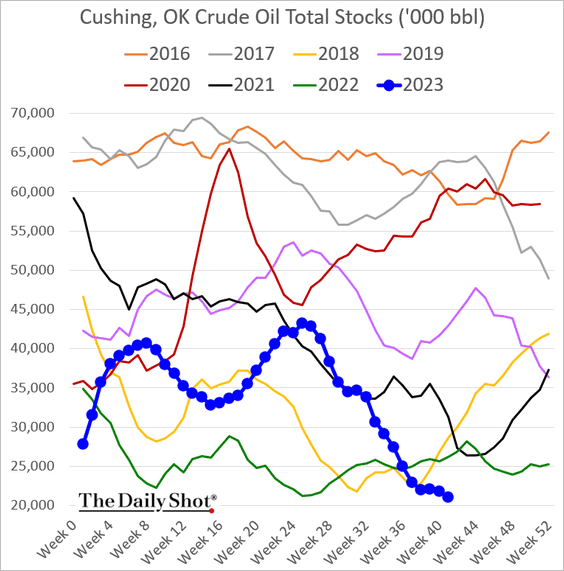
• Inventories at Cushing, OK, the settlement hub for NYMEX crude (WTI), are at multi-year lows.
This chart shows total crude inventories.
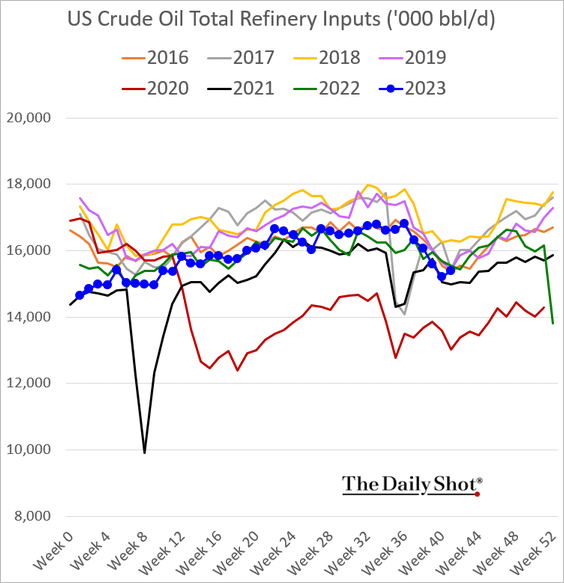
• Implied crude oil demand jumped last week.
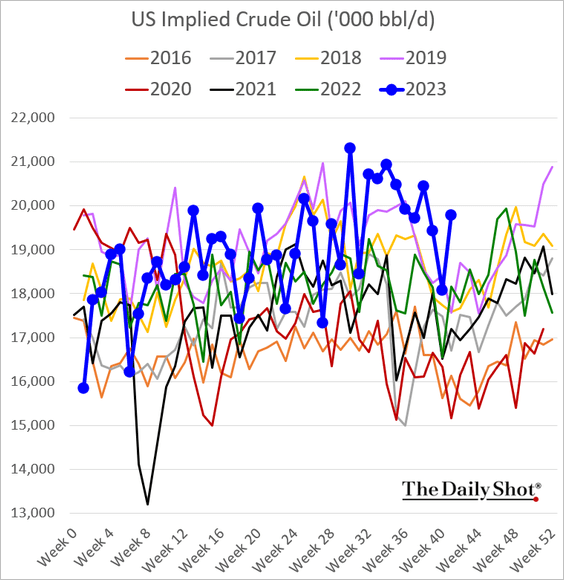
– Refinery runs were back near last year’s levels.
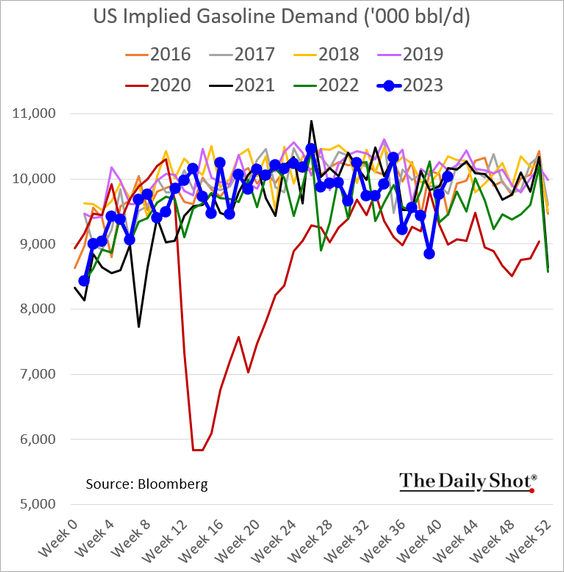
• Gasoline demand has recovered.
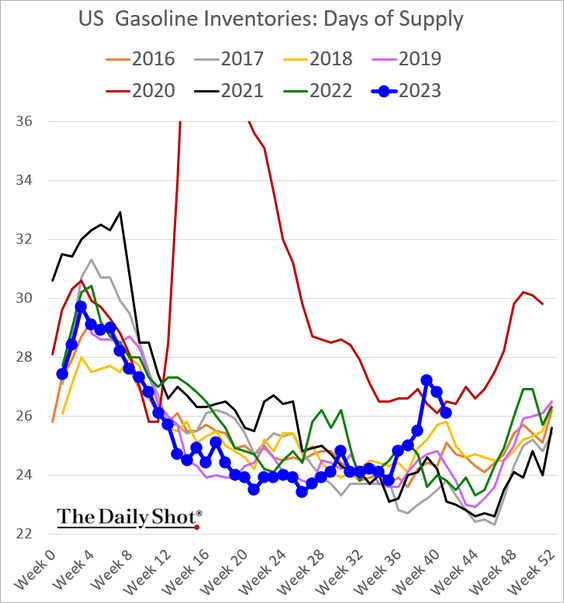
Measured in days of supply, gasoline inventories are easing but remain well above last year’s levels.
——————–
2. Oil prices jumped on Wednesday.
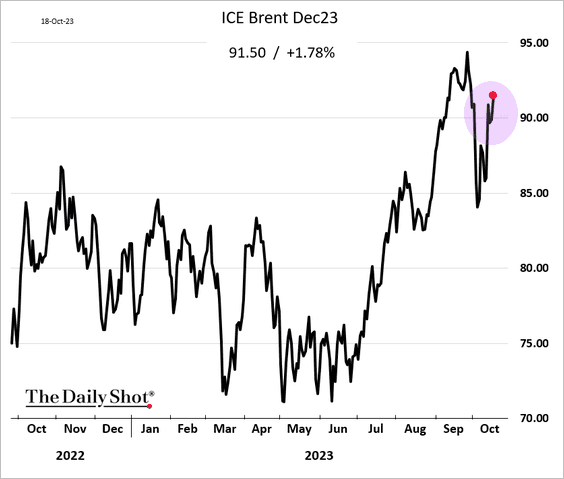
 Source: Reuters Read full article
——————–
3. Crack spreads remain depressed globally.
• US:
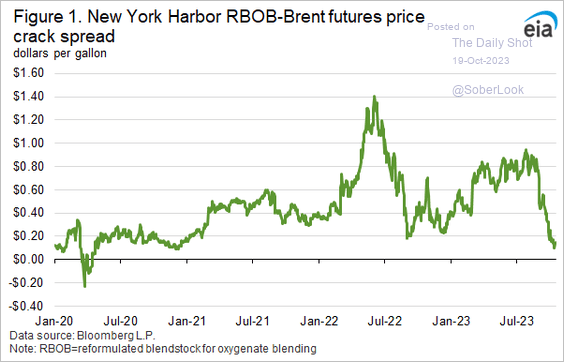 Source: @EIAgov
• Europe and Asia:
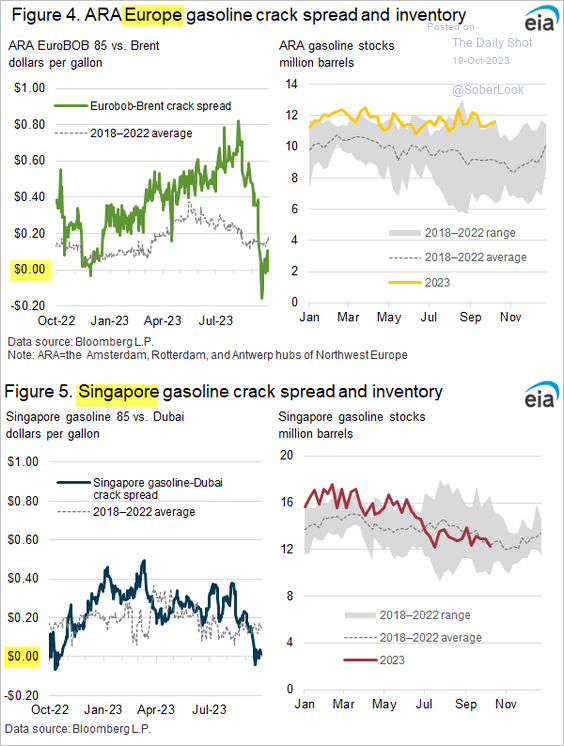 Source: @EIAgov
——————–
4. China’s petroleum product demand has been outpacing economic activity.
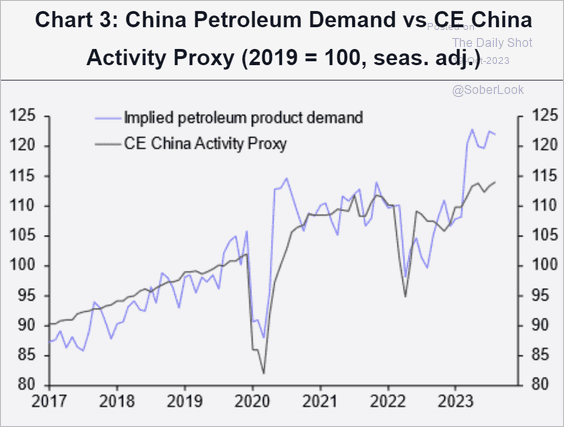 Source: Capital Economics
5. US natural gas production is now below last year’s levels.
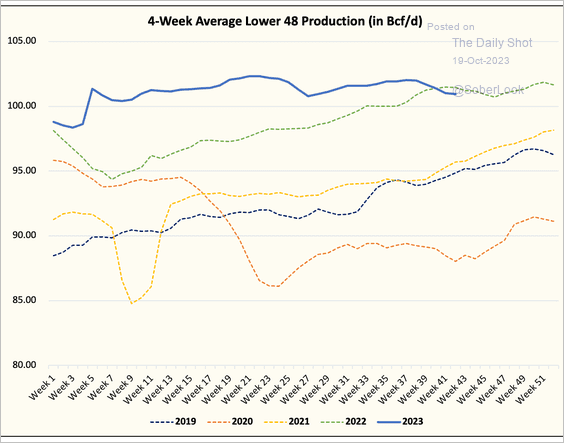 Source: @HFI_Research
Back to Index
Equities
1. Let’s begin with sector performance over the past five business days.
– Consumer discretionary:
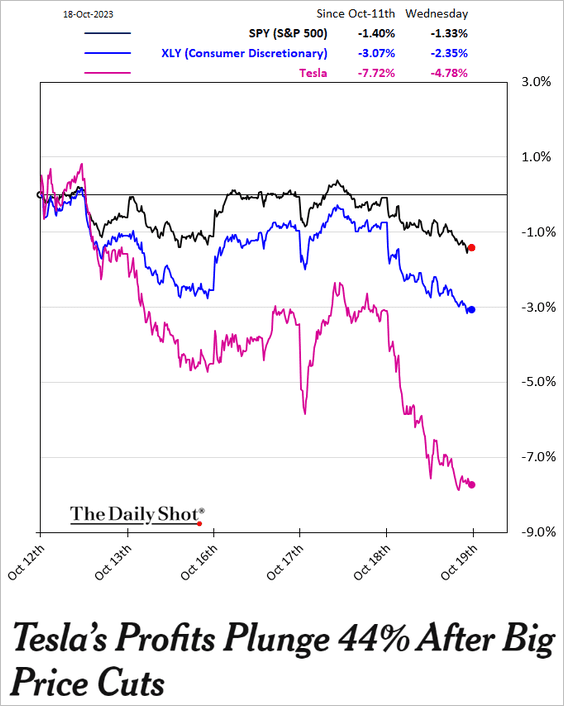 Source: The New York Times Read full article
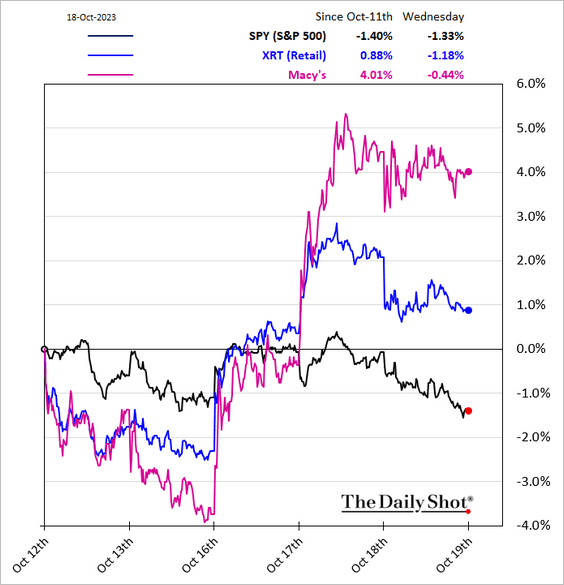
– Retail:
– Semiconductors:
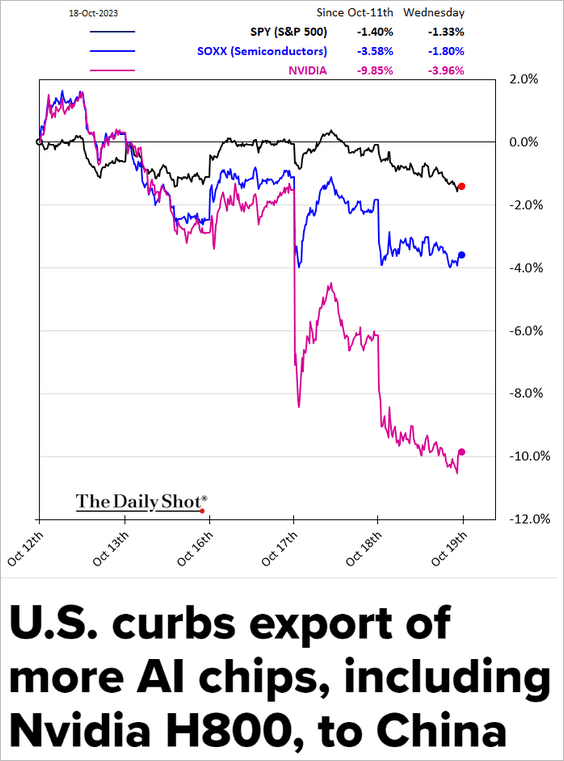 Source: CNBC Read full article
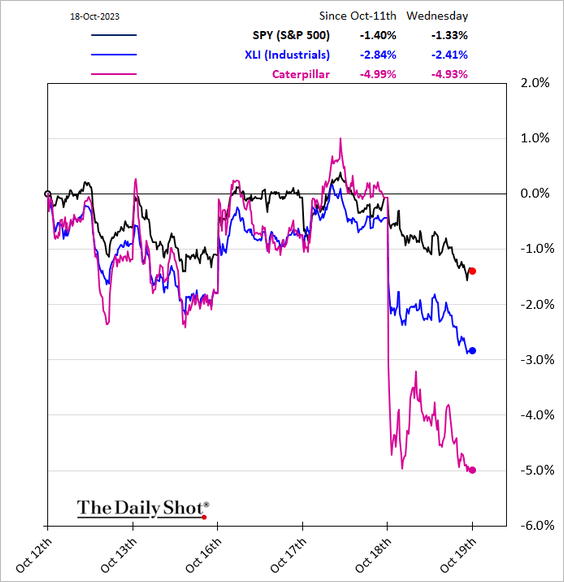
– Industrials:
– Transportation:
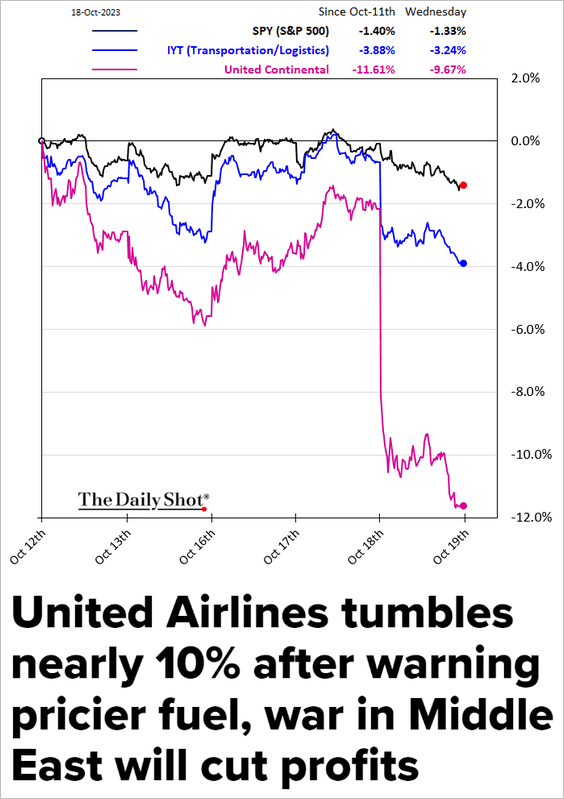 Source: CNBC Read full article
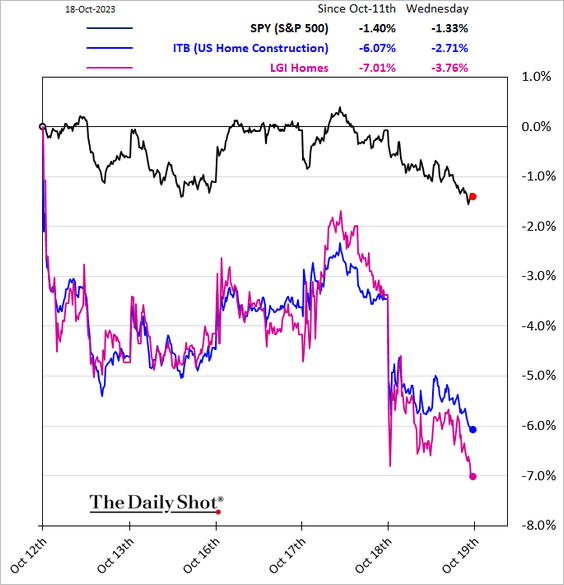
– Housing:
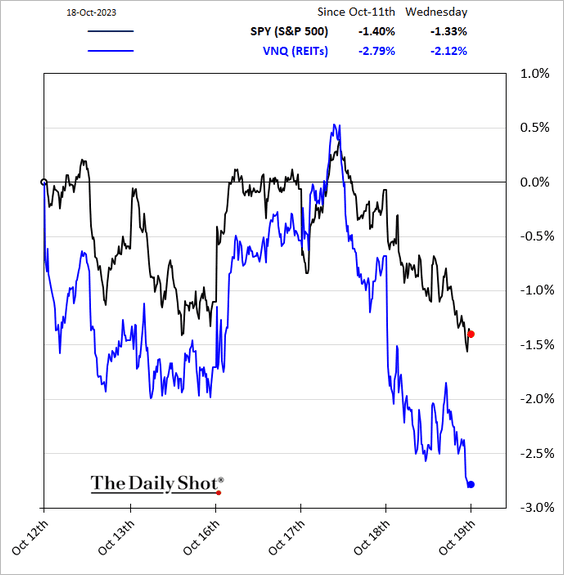
– REITs:
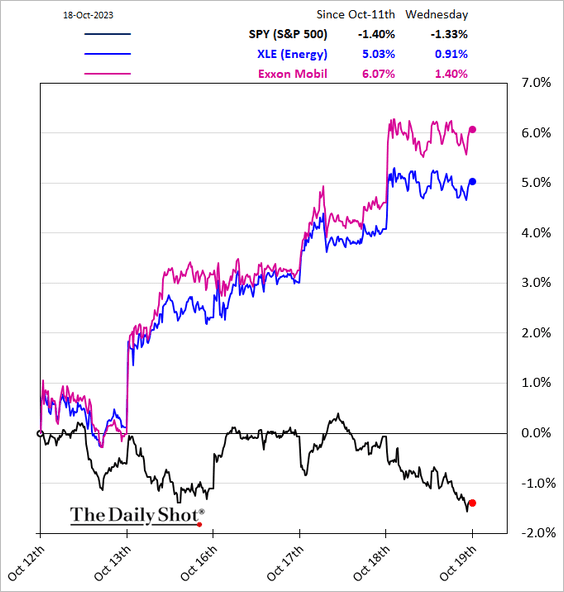
– Energy:
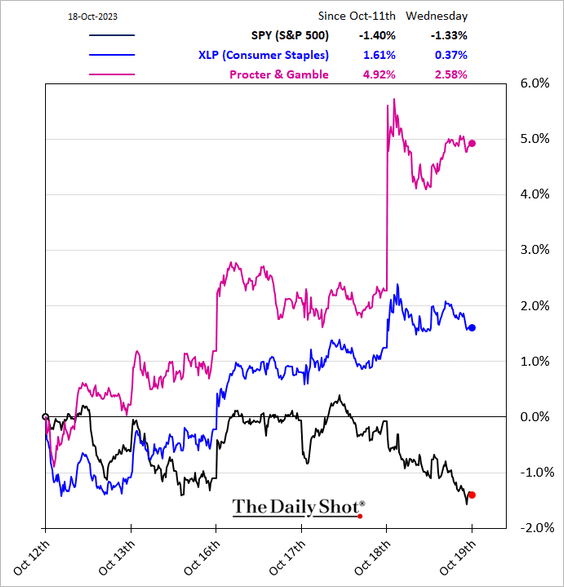
• Defensives have been outperforming.
– Healthcare:
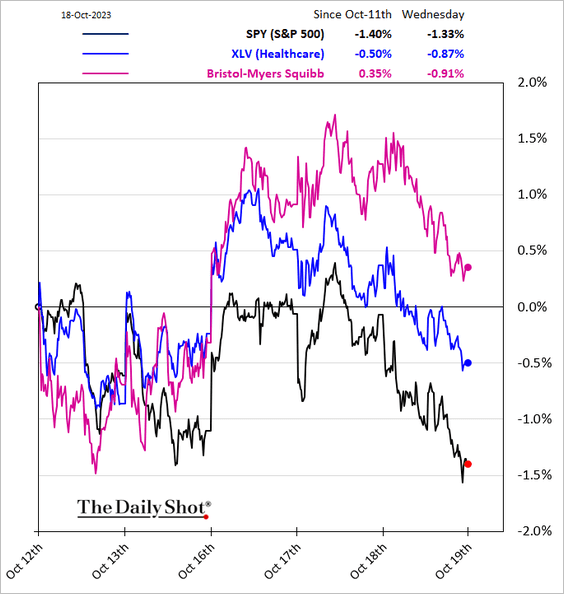
– Consumer staples:
——————–
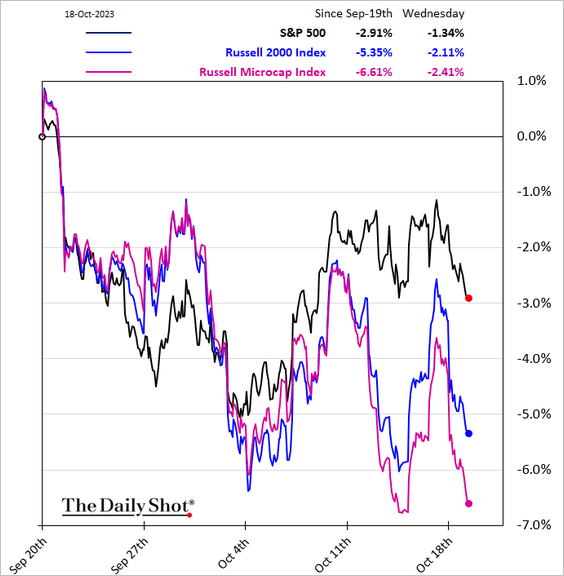
2. The Russell 2000 Index is trading at the bottom of its year-long price range.
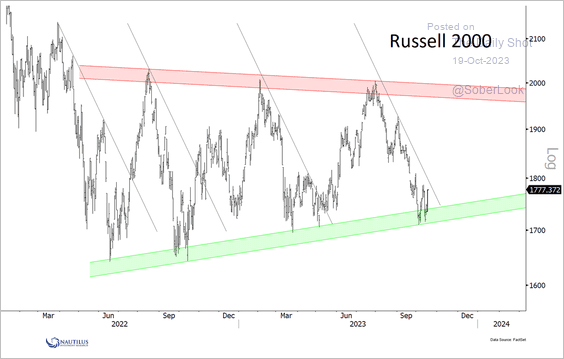 Source: @NautilusCap
• Microcaps are nearing the recent lows.
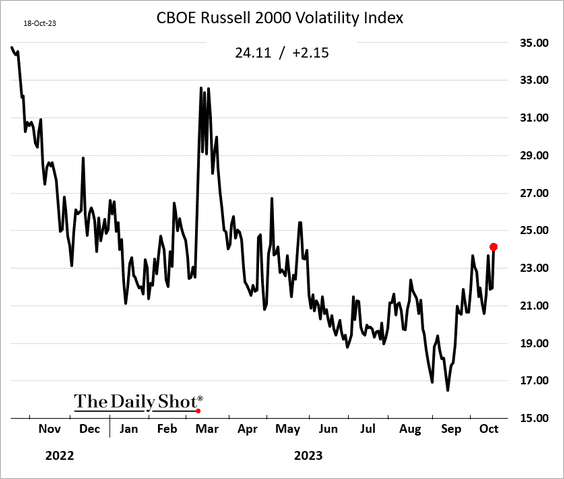
• Small-cap implied volatility is at the highest level since May.
——————–
3. The average S&P 500 stock valuation is reasonable, with the forward P/E ratio for the equal-weighted index below 15x. Of course, with Treasury yields at 5%, valuations may need to be even lower.
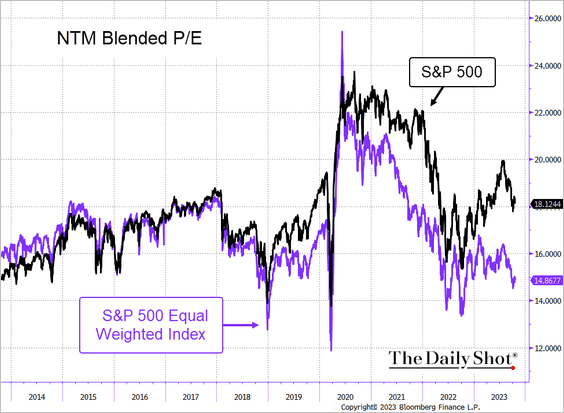 Source: @TheTerminal, Bloomberg Finance L.P.
The valuation distortions come from the tech mega-caps.
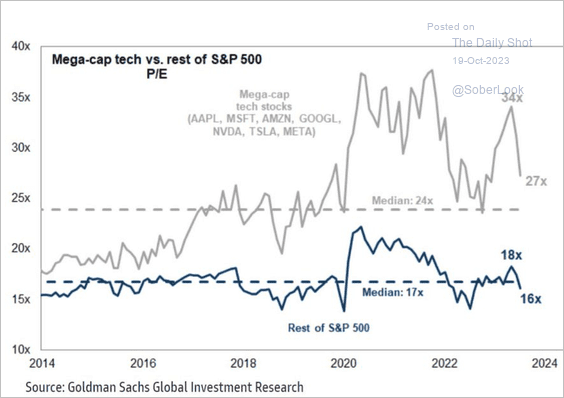 Source: Goldman Sachs
——————–
4. CTAs are very bearish.
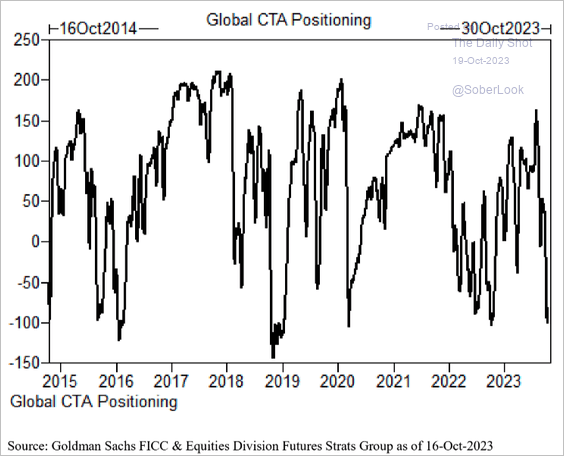 Source: Goldman Sachs; @dailychartbook
• Fund manager cash levels remain relatively high, which could support risk appetite into year-end.
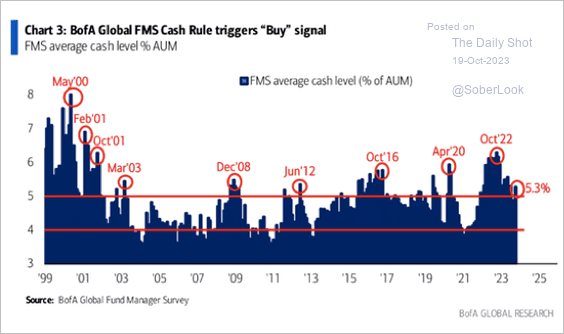 Source: BofA Global Research
——————–
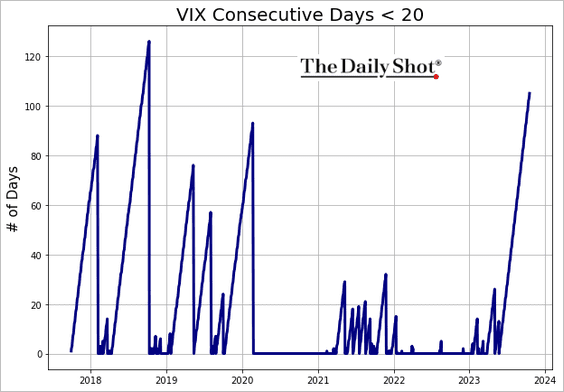
5. VIX has been below 20 for 105 days in a row.
6. Share buybacks are elevated but are running below 2022 levels (for this time of the year).
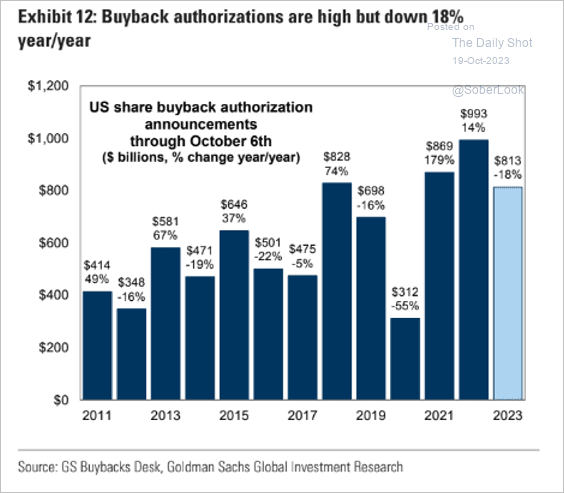 Source: Goldman Sachs; @MikeZaccardi
Back to Index
Alternatives
1. The number of hedge funds focused on foreign exchange has been steadily declining over the past decade.
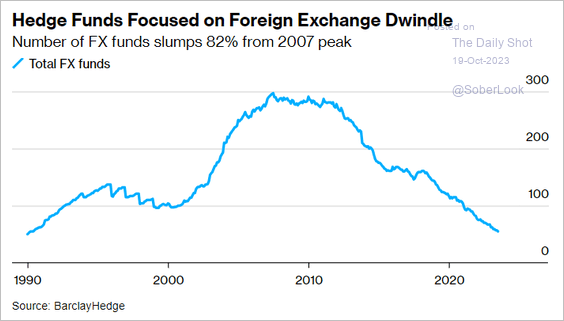 Source: @markets Read full article
2. US private equity deal-making declined further in Q3 (2 charts).
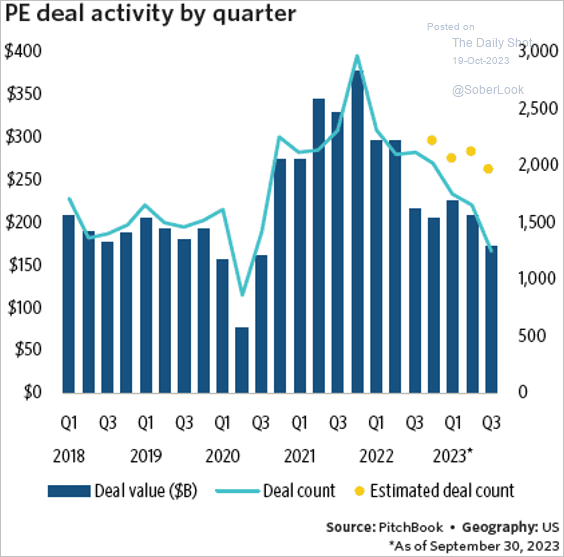 Source: PitchBook
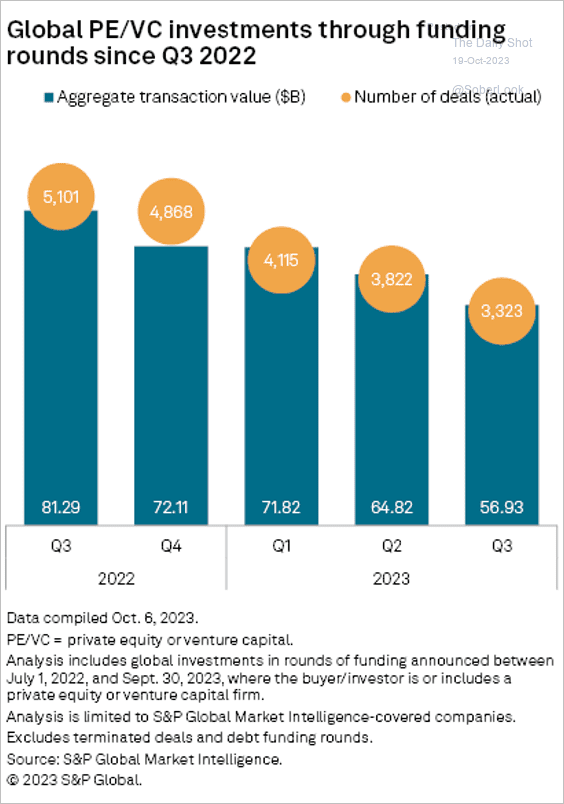 Source: S&P Global Market Intelligence
• Exits slowed again.
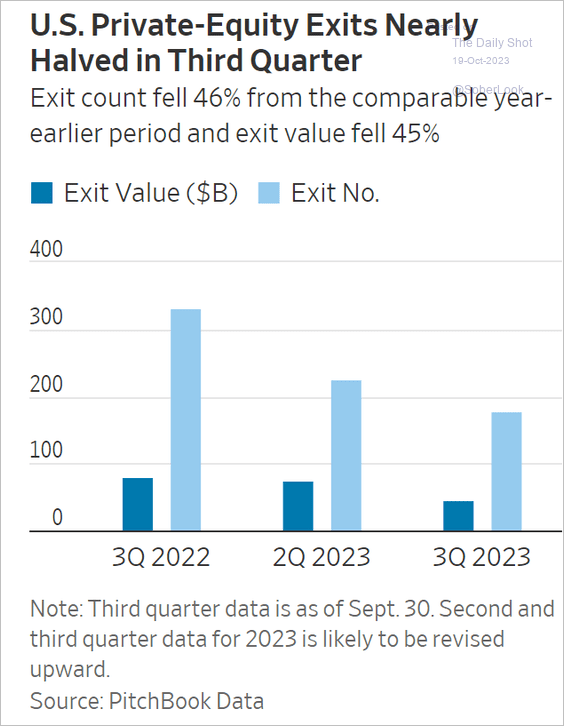 Source: @WSJ Read full article
3. With leverage costs at multi-year highs, growth deals outpace buyouts.
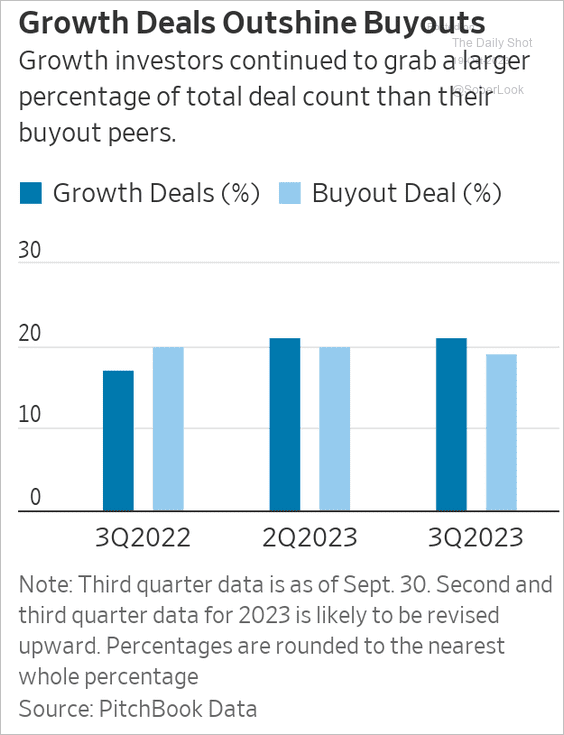 Source: @WSJ Read full article
4. Here is a look at private debt fundraising activity.
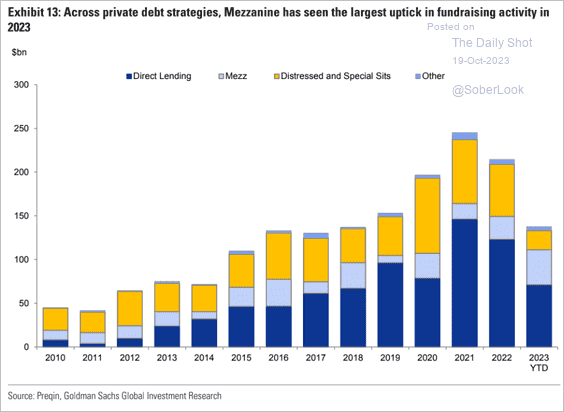 Source: Goldman Sachs
5. Startups valued between $10 and $100 million devote more of their payroll to engineering than any other function. Engineering and product development are the only two functions where the percentage of payroll is higher than the percentage of headcount.
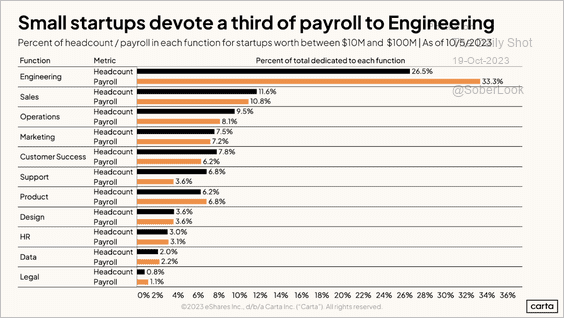 Source: Carta
Back to Index
Credit
1. US corporate investment-grade spreads remain subdued despite the rise in Treasury yields.
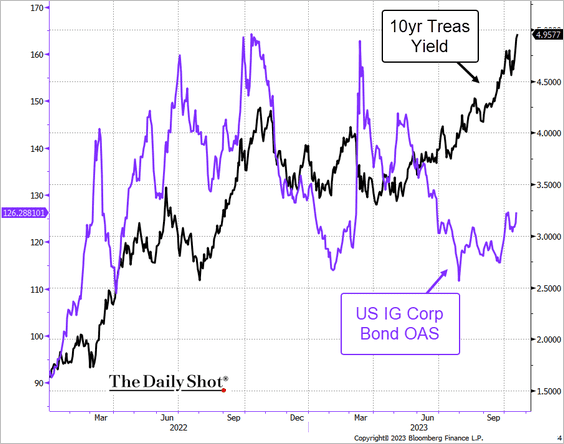 Source: @TheTerminal, Bloomberg Finance L.P.
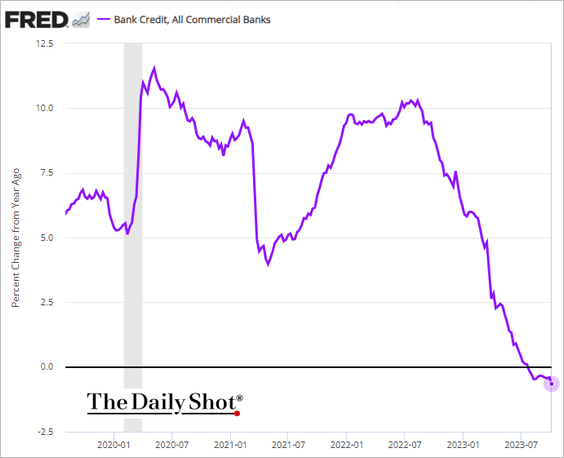
2. US total bank credit continues to decline on a year-over-year basis.
3. Direct lending strategies have been outperforming since the financial crisis.
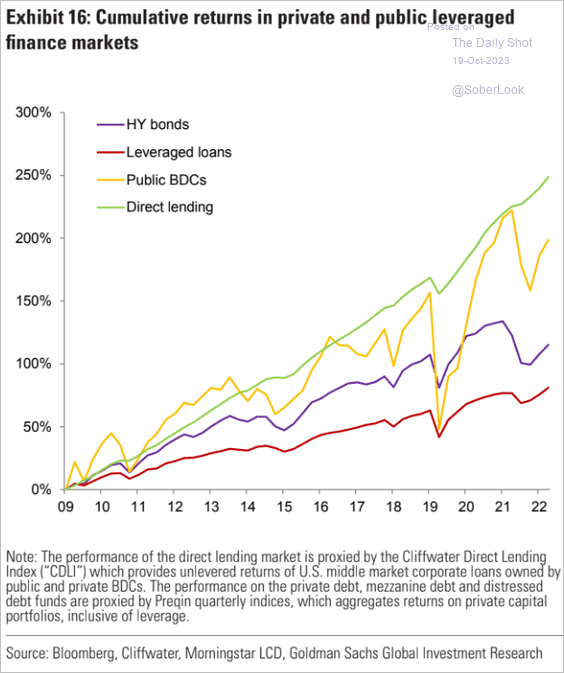 Source: Goldman Sachs
4. How much will office property prices decline in major US metropolitan areas?
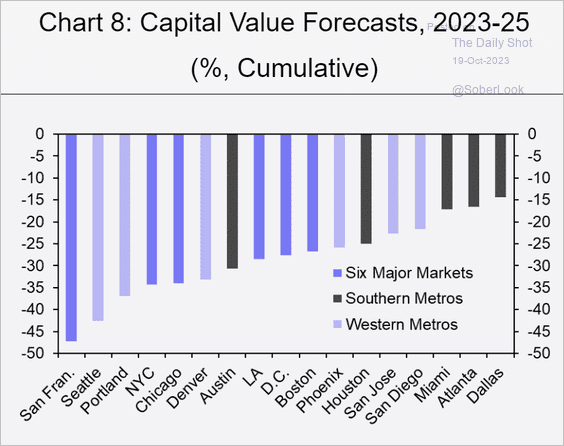 Source: Capital Economics
• Office vacancy rates are at multi-year highs.
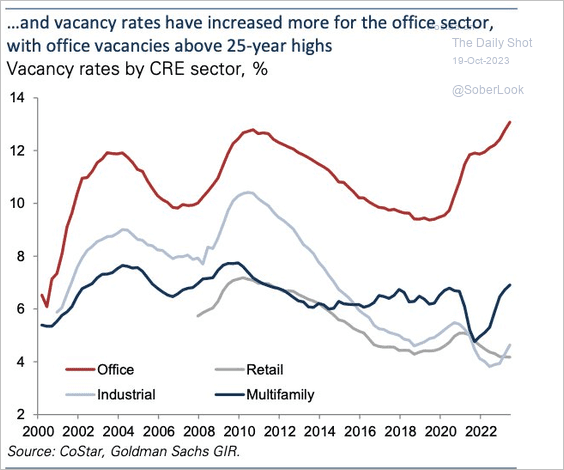 Source: Goldman Sachs; @TheTranscript_
• Opportunities ahead for distressed commercial real estate buyers?
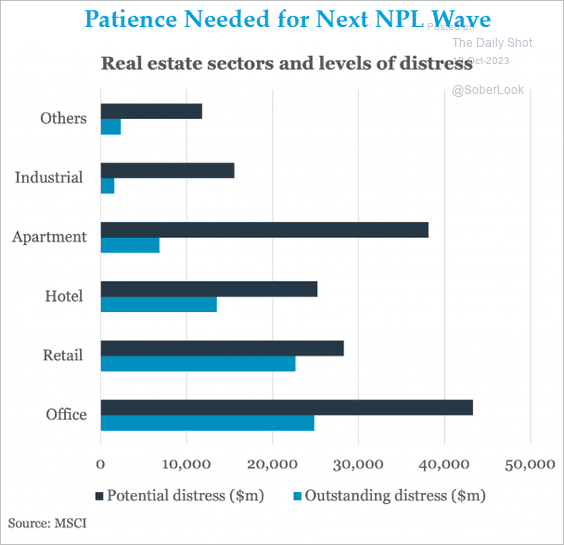 Source: @theleadleft
Back to Index
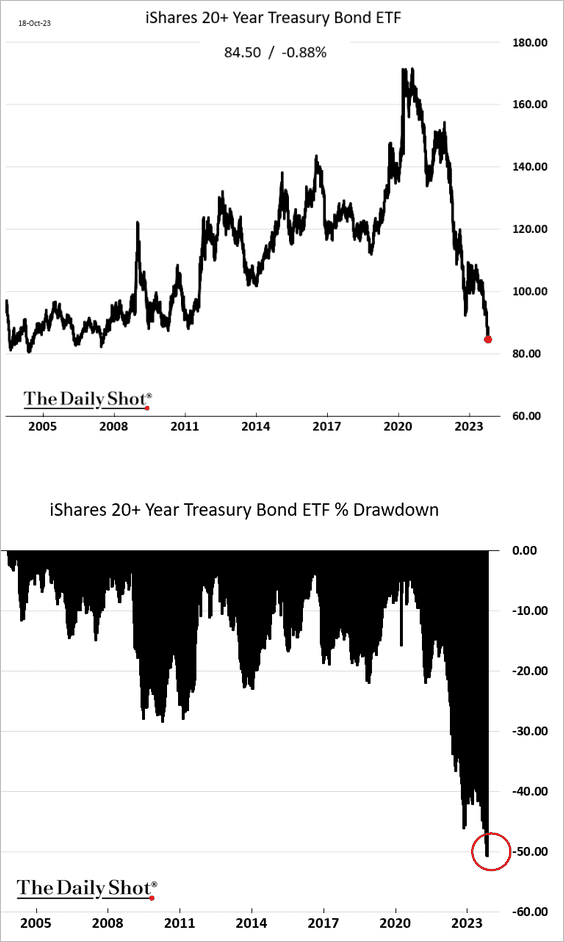
Rates
1. The drawdown in longer-dated Treasuries now exceeds 50%.
2. Pressure on Treasuries is no longer just about the Fed and inflation risks.
 Source: @economics Read full article
3. Who has been buying Treasuries?
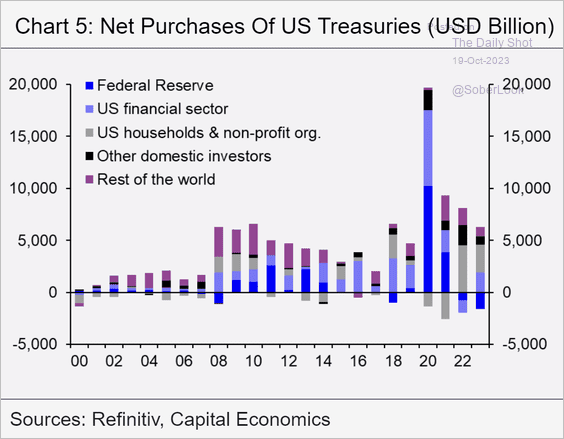 Source: Capital Economics
• Here is a look at Treasury ownership over time.
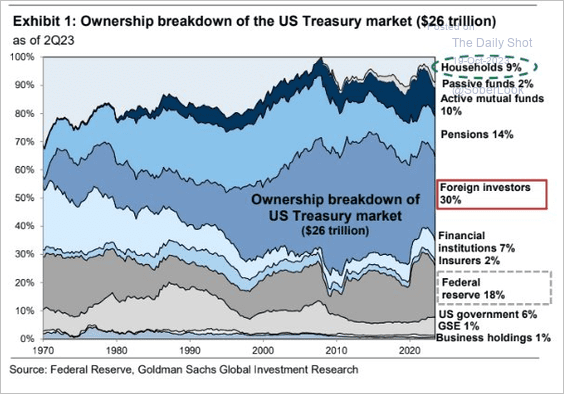 Source: Goldman Sachs; @MikeZaccardi
——————–
4. US real yields are above the real potential GDP growth.
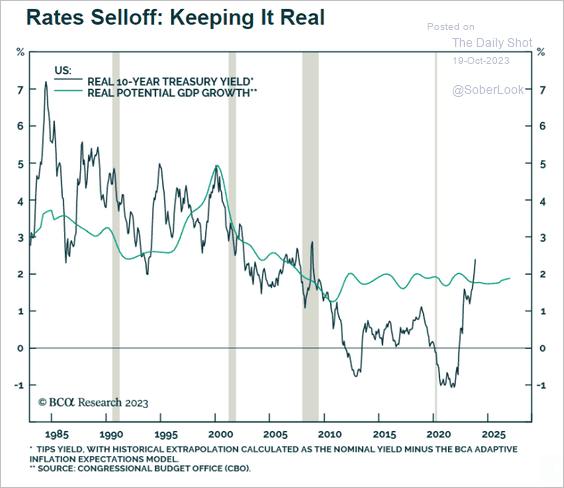 Source: BCA Research
Back to Index
Global Developments
1. Momentum behind the dollar’s recent rally has slowed.
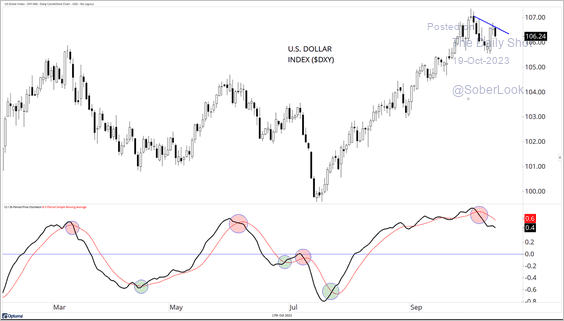 Source: @DavidCoxRJ
2. According to Oxford Economics, EM equities and US high-yield bonds are likely to deliver the highest returns over the next five years.
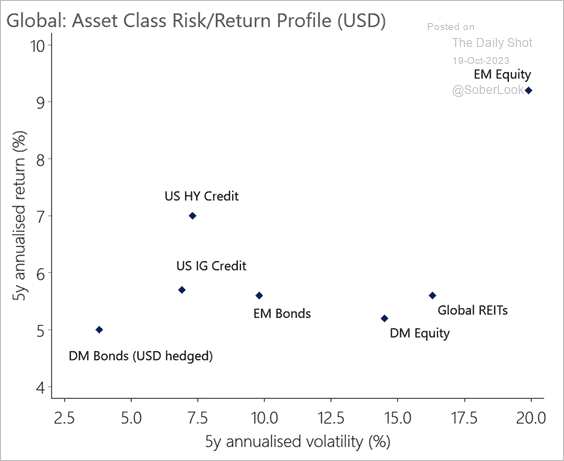 Source: Oxford Economics
——————–
Food for Thought
1. Reducing spending to cover student loan payments:
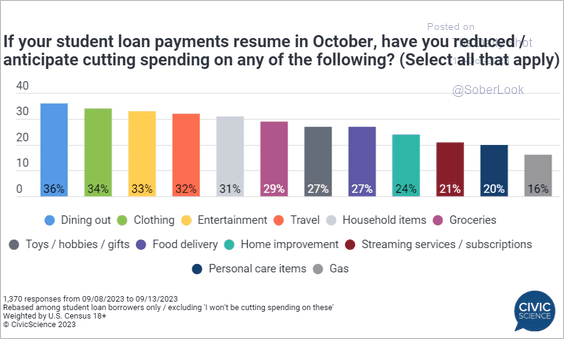 Source: @CivicScience Read full article
2. The composition of US federal revenue:
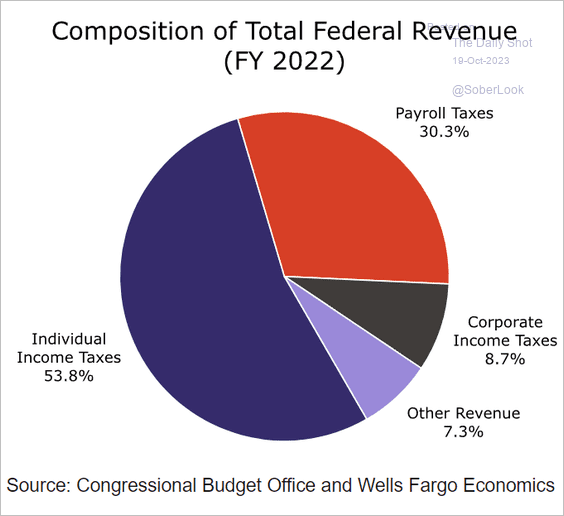 Source: Wells Fargo Securities
3. Changes in transportation energy consumption:
![]() Source: @EIAgov Read full article
Source: @EIAgov Read full article
4. CO2 emissions:
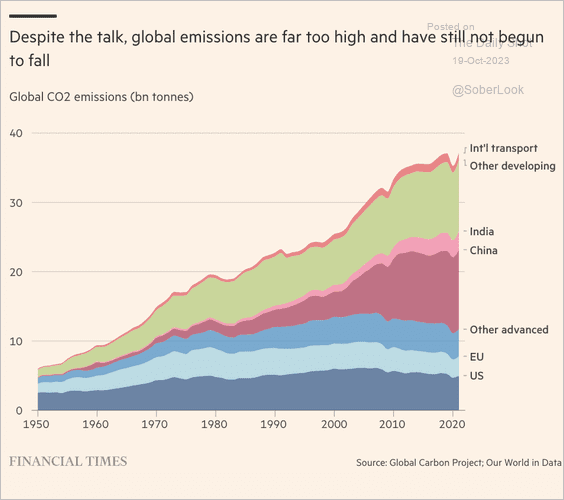 Source: @financialtimes Read full article
5. Carbon credits vs. carbon emissions (see comment):
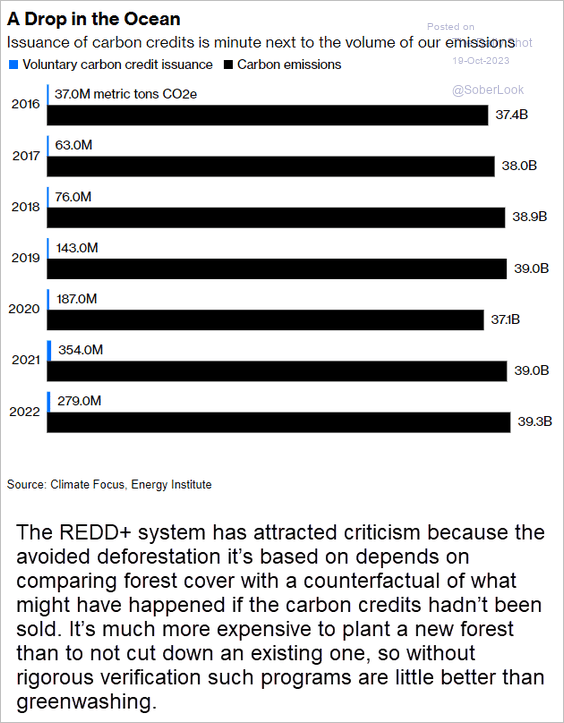 Source: @davidfickling, @opinion Read full article
6. Adoption of new technologies:
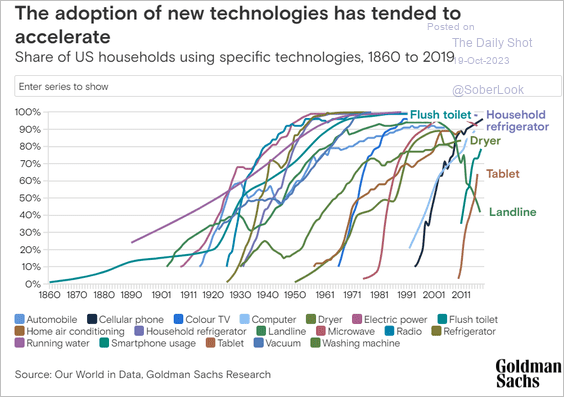 Source: Goldman Sachs
7. Bedtimes and wake-up times around the world (local time):
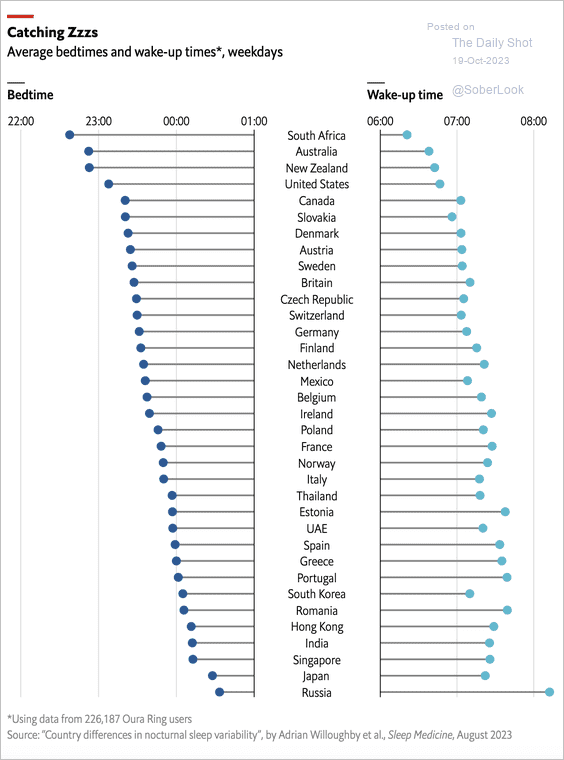 Source: The Economist Read full article
——————–
Back to Index