
The Daily Shot: 23-Oct-23
• The United States
• Canada
• The United Kingdom
• The Eurozone
• Europe
• Asia-Pacific
• China
• Emerging Markets
• Commodities
• Energy
• Equities
• Alternatives
• Credit
• Rates
• Global Developments
• Food for Thought
The United States
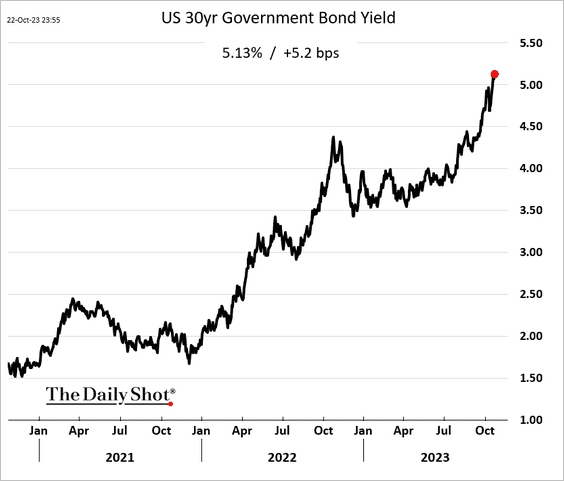
1. Treasury yields rose sharply last week, …
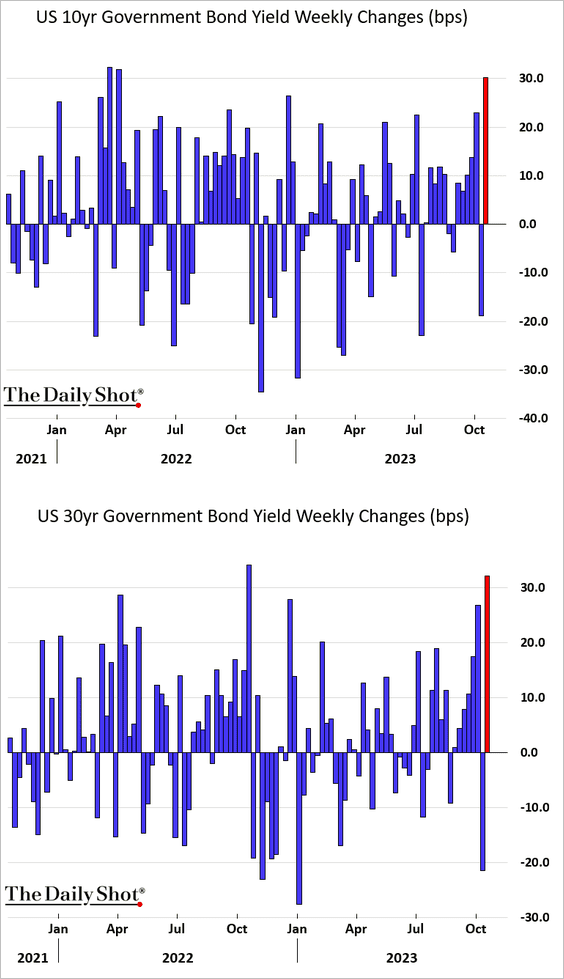
… climbing further this morning.
• The tightening in US financial conditions since the September FOMC meeting is equivalent to some 80 basis points worth of Fed rate hikes, according to Goldman (2 charts).
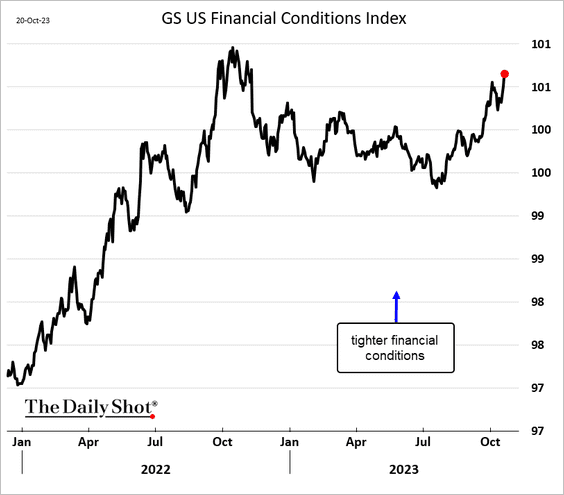
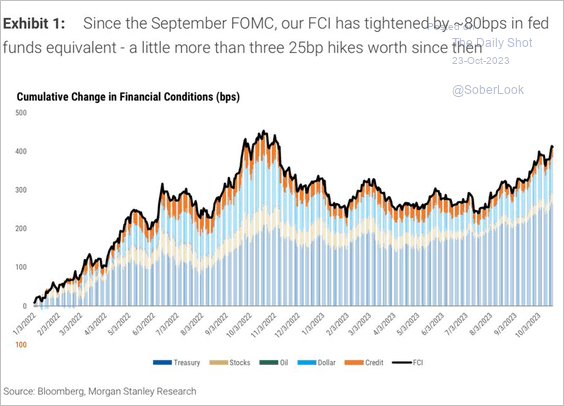 Source: Goldman Sachs
——————–
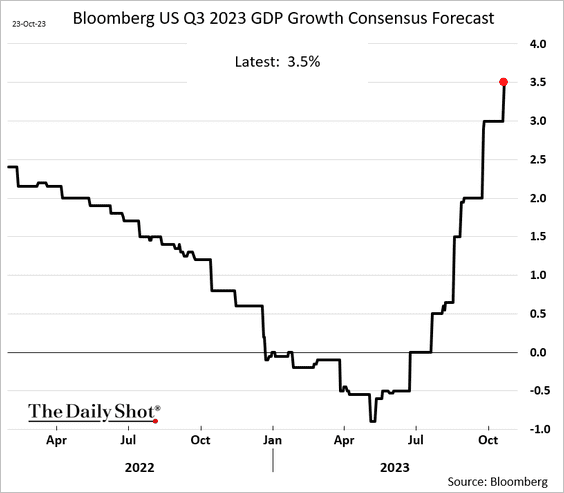
2. Economic activity has been surprising to the upside. This chart shows the consensus estimate (over time) for last quarter’s GDP growth.
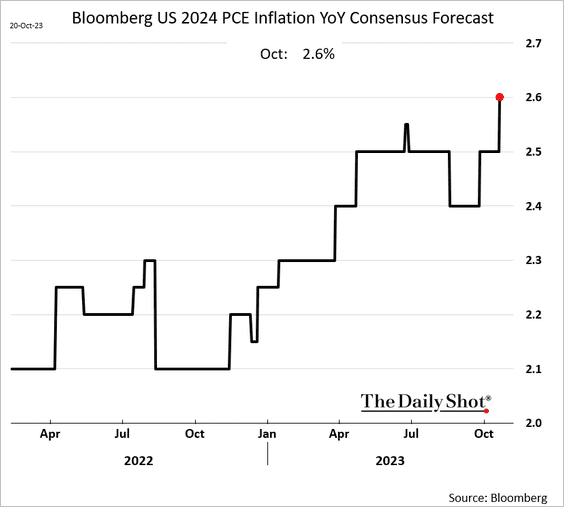
• Economists have been raising their inflation forecasts for 2024.
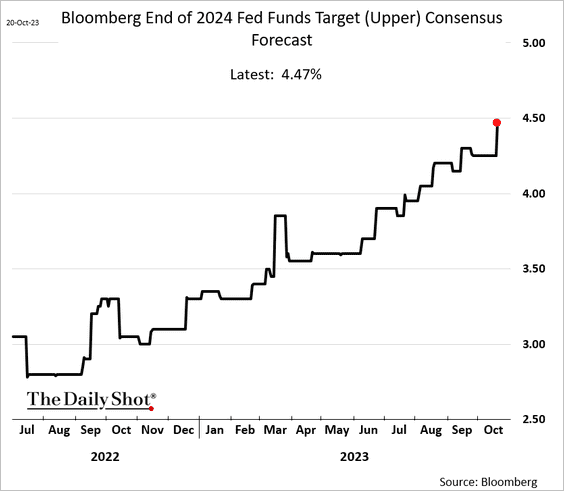
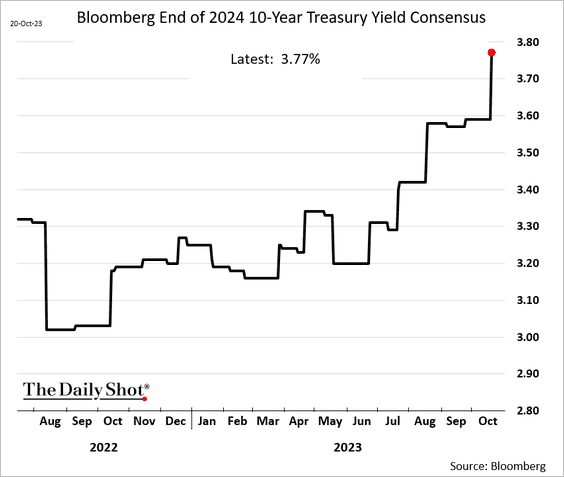
• As a result, fewer rate cuts are expected next year, …
… with forecasters boosting their projections for Treasury yields.
——————–
3. Household wealth has grown in recent years, which could support consumption. (2 charts)
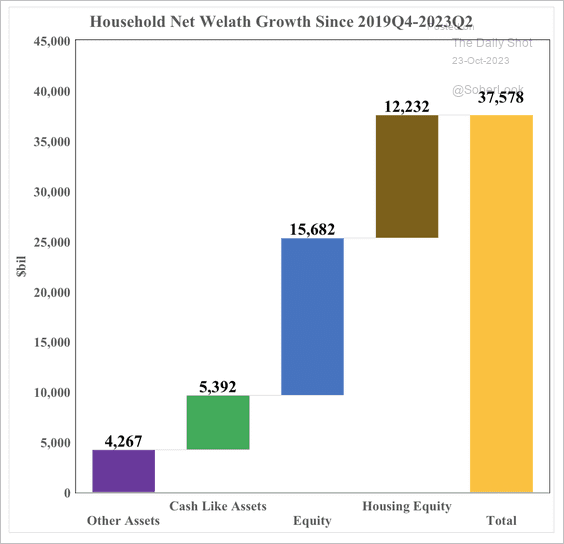 Source: SOM Macro Strategies
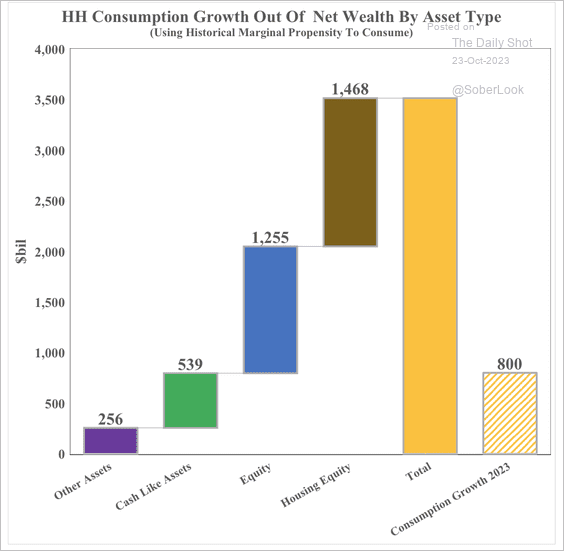 Source: SOM Macro Strategies
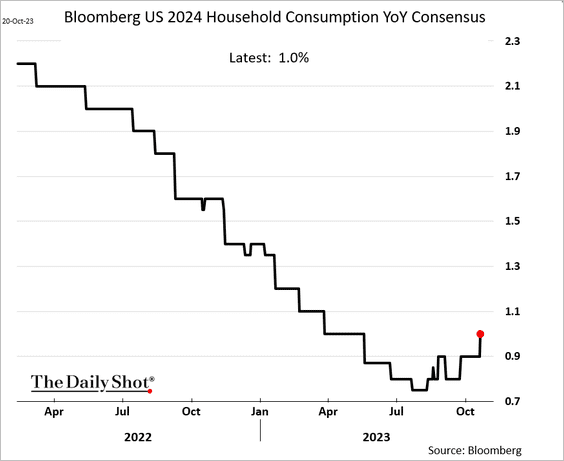
• Economists have raised their projections for consumer spending growth next year.
——————–
4. Subprime auto loan delinquencies hit a record high.
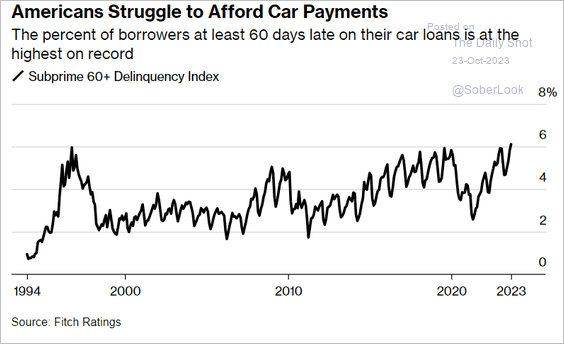 Source: @wealth Read full article
——————–
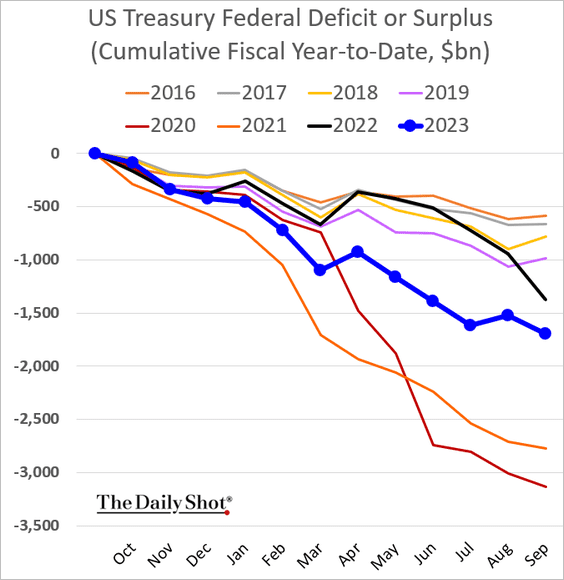
5. The budget deficit was wider than expected in September, ending the year nearly $1.7 trillion in the red.
 Source: CNBC Read full article
Back to Index
Canada
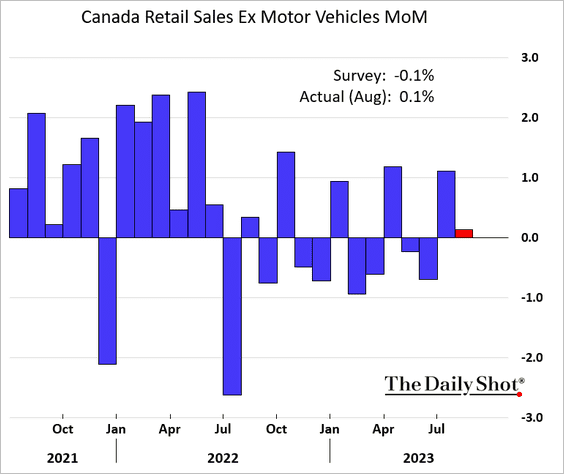
1. Core retail sales edged higher in August.
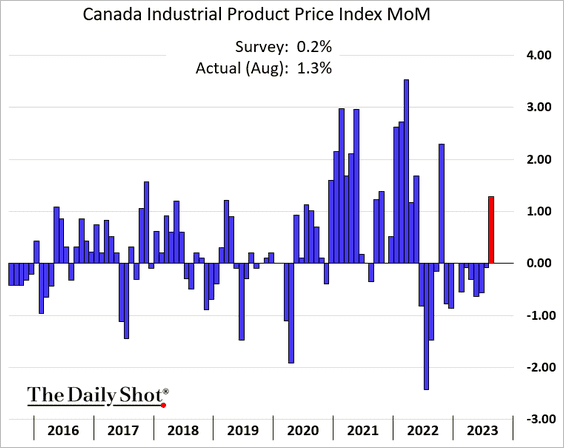
2. Industrial PPI jumped.
Back to Index
The United Kingdom
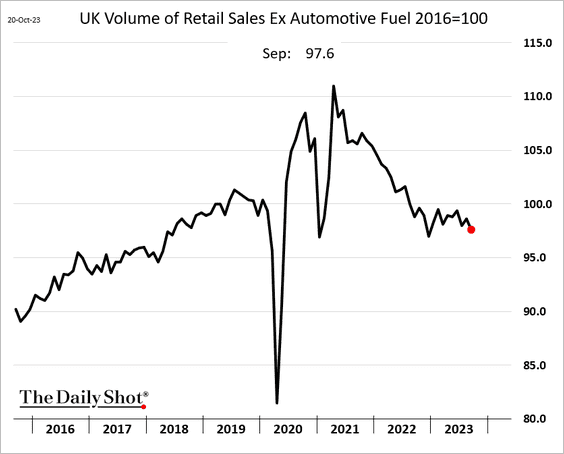
1. Retail sales slumped further last month.
2. Government borrowing was lower than expected in September.
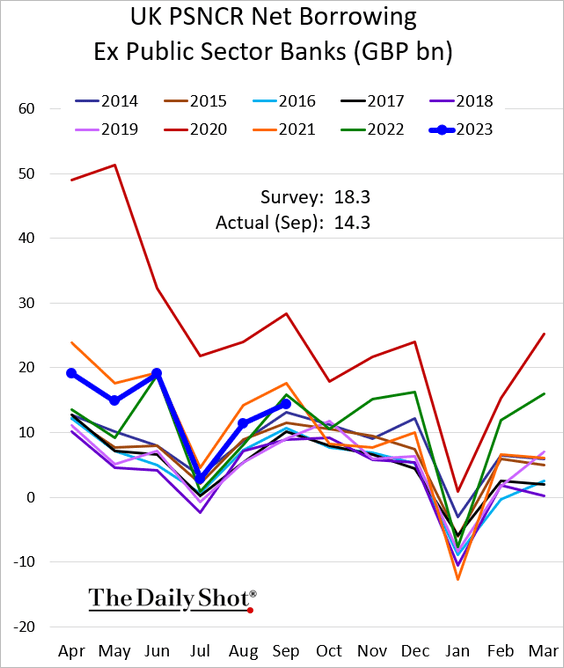
 Source: Reuters Read full article
Back to Index
The Eurozone
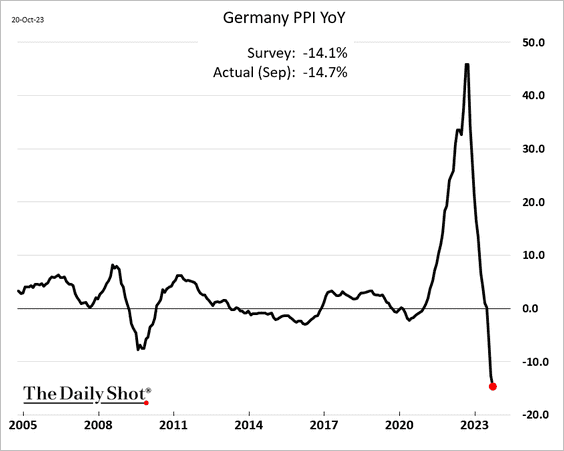
1. Here is Germany’s PPI (year-over-year).
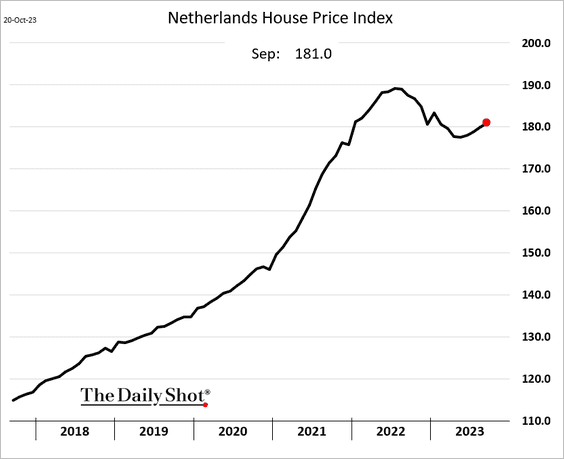
2. Dutch home prices are climbing again.
• How did higher rates impact the housing market in the Eurozone?
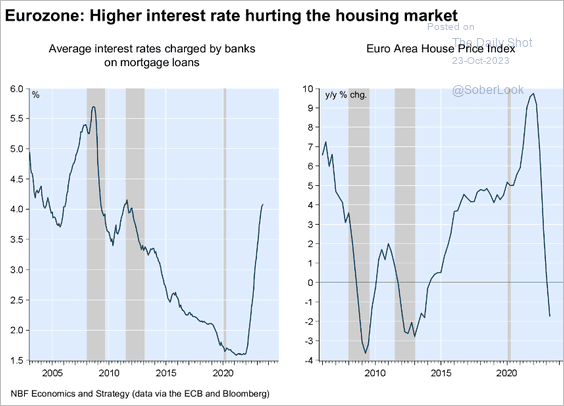 Source: Economics and Strategy Group, National Bank of Canada
——————–
3. Forecasters expect the ECB to keep rates higher for longer.
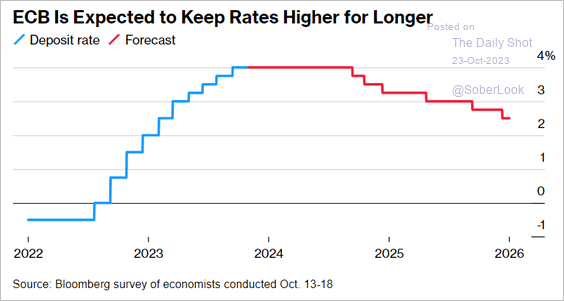 Source: @economics Read full article
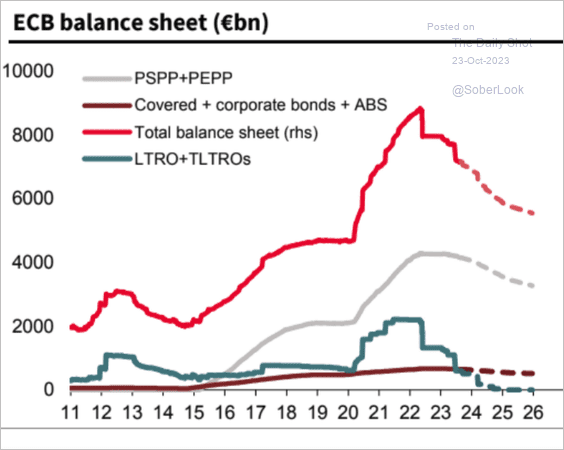
4. This chart shows the ECB’s (Eurosystem) balance sheet and SocGen’s projections.
 Source: SocGen; @AyeshaTariq
Back to Index
Europe
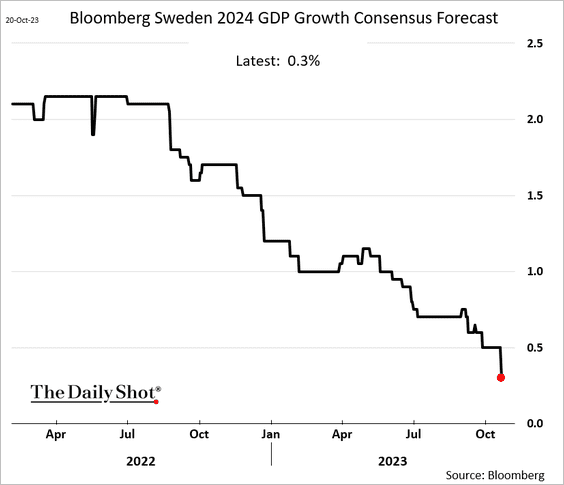
1. Sweden’s unemployment rate topped expectations again.
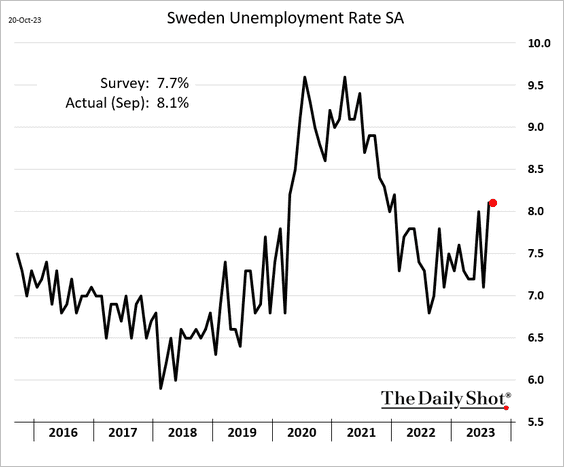
Economists have been downgrading their forecasts for Sweden’s GDP growth in 2024.
——————–
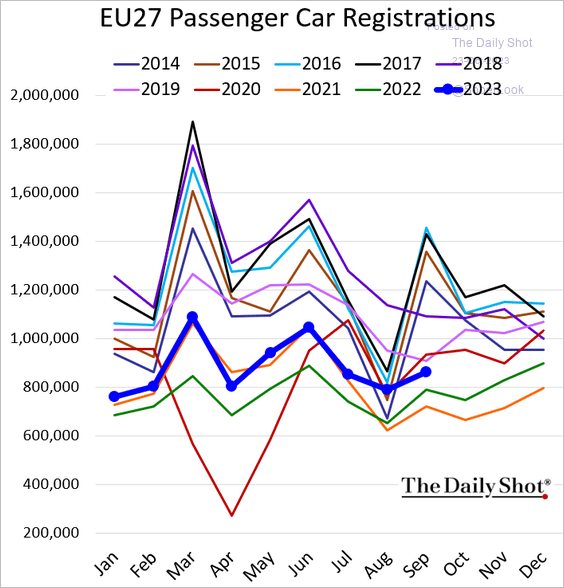
2. EU vehicle registrations remain above last year’s levels.
 Source: ACEA
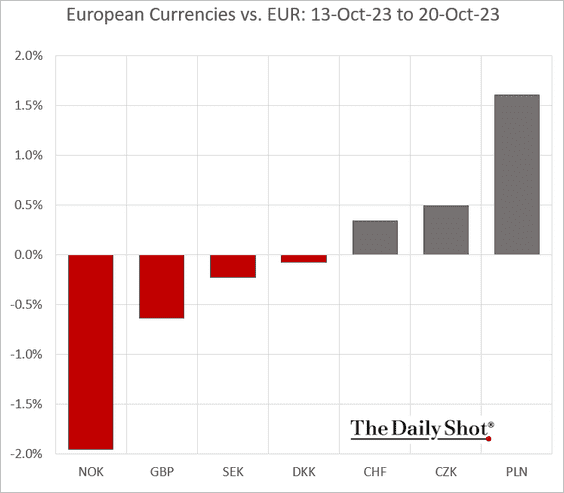
3. How did European currencies perform against the euro last week?
Back to Index
Asia-Pacific
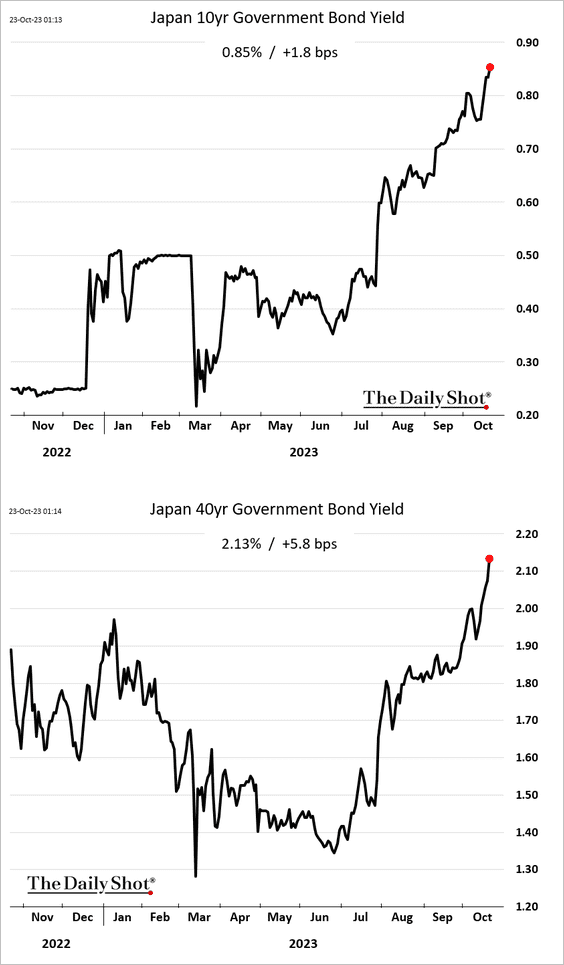
1. JGB yields keep climbing.
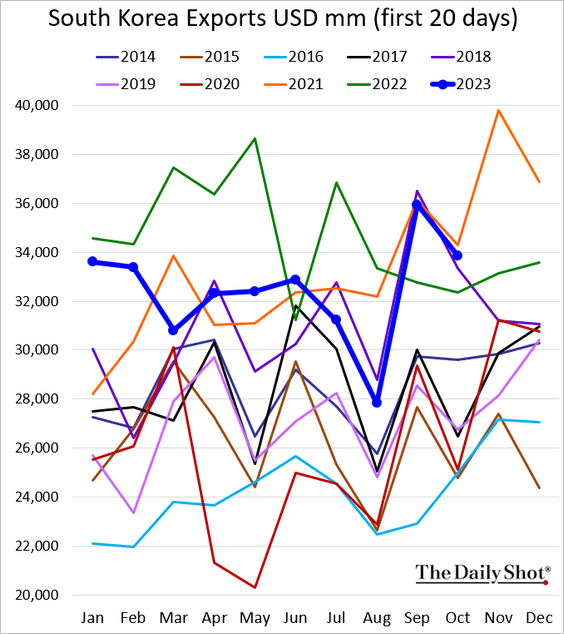
2. South Korea’s exports held up well this month.
Back to Index
China
1. The Shanghai Shenzhen CSI 300 Index hit the lowest level since 2019.
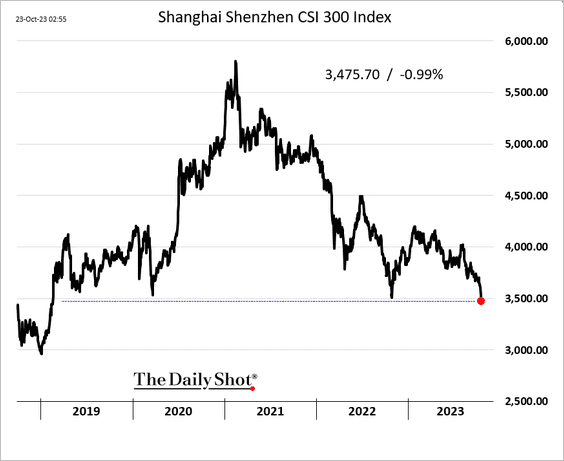
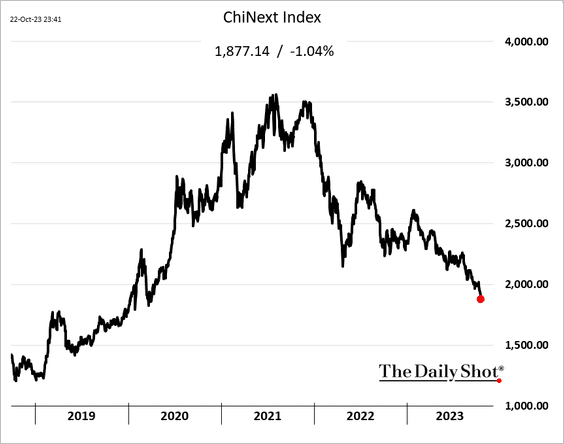
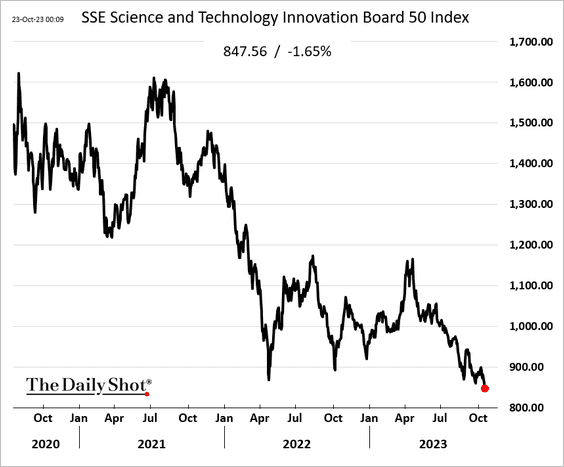
• “New-economy”/tech stocks are tumbling.
 Source: @markets Read full article
——————–
2. Bank clients have been moving funds abroad.
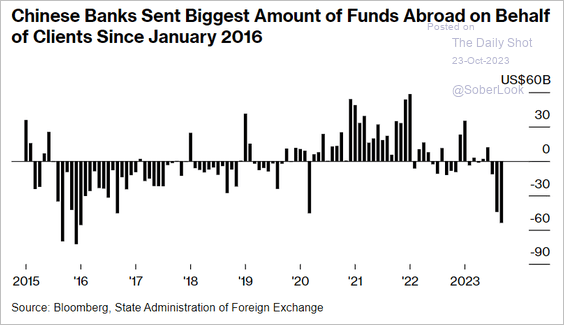 Source: @markets Read full article
Capital flows were negative again last month.
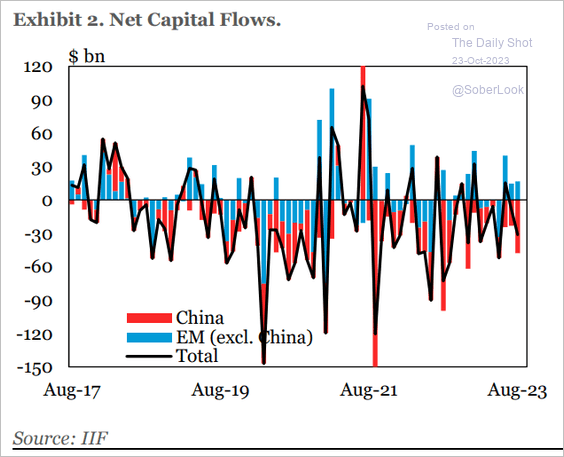 Source: IIF
——————–
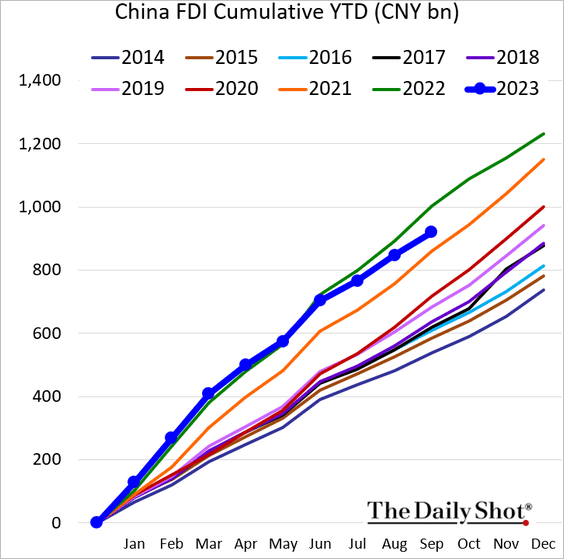
3. Foreign direct investment is diverging from last year’s path.
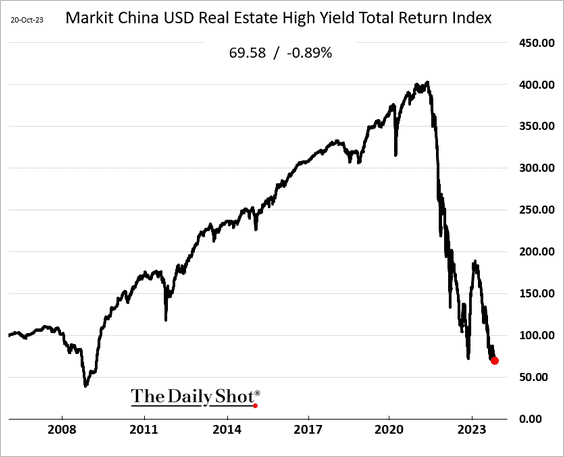
4. Developers’ offshore bonds continue to multi-year lows.
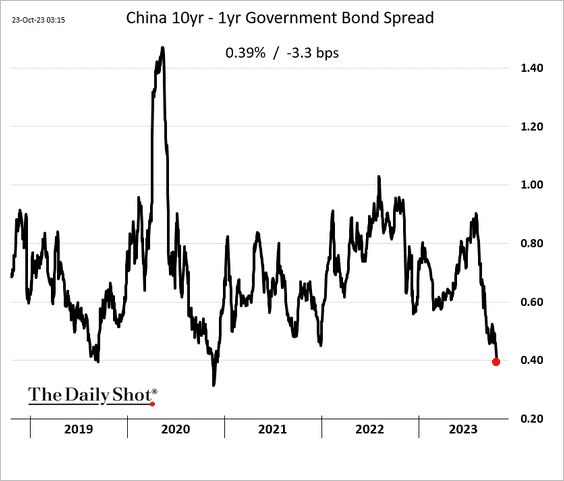
5. The yield curve keeps flattening.
Back to Index
Emerging Markets
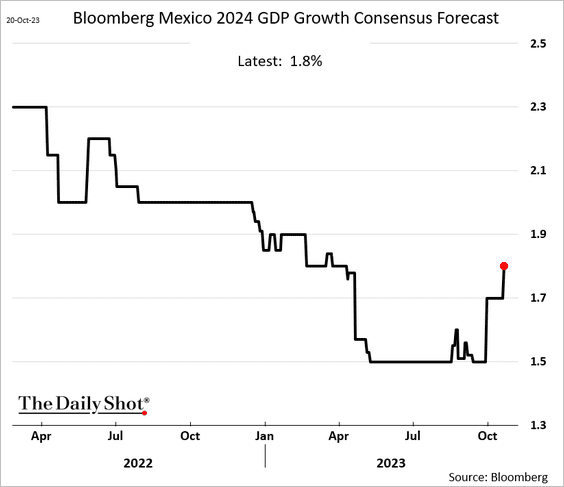
1. Economists upgraded Mexico’s growth forecasts for next year.
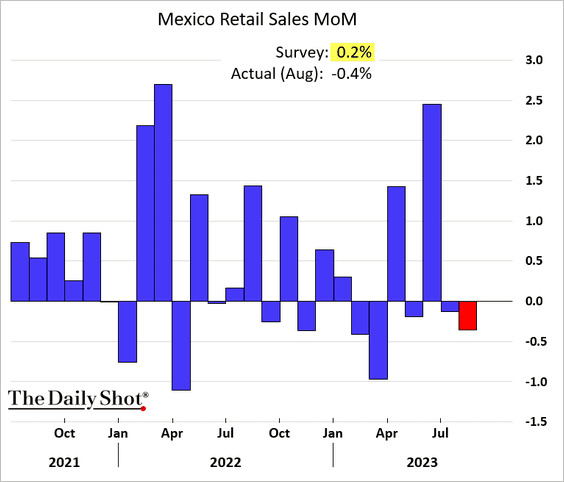
• Mexican retail sales declined again in August.
——————–
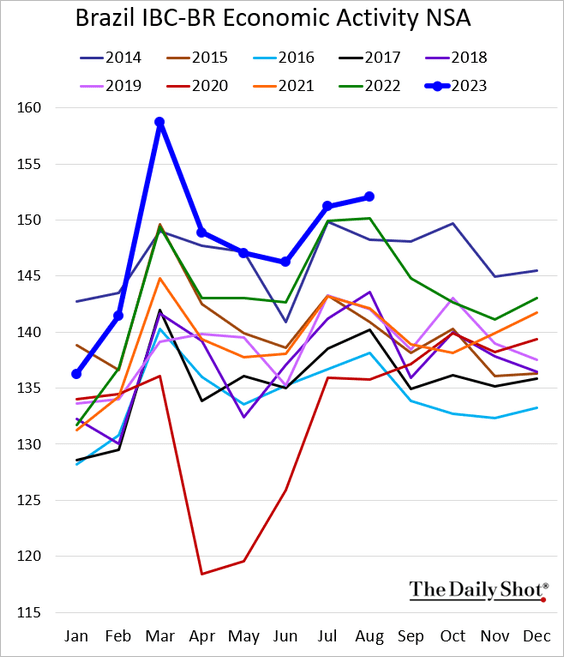
2. Brazil’s economic activity is holding above last year’s levels.
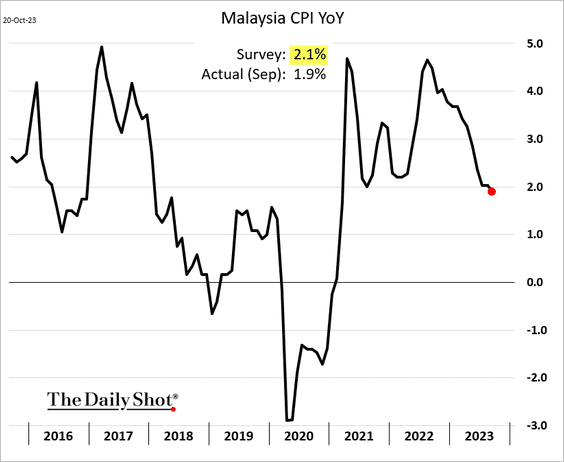
3. Malaysia’s CPI surprised to the downside.
4. Breadth has been extremely weak in the MSCI EM Index, which typically precedes price rebounds.
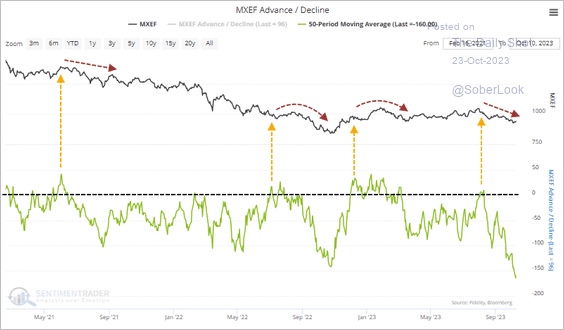 Source: SentimenTrader
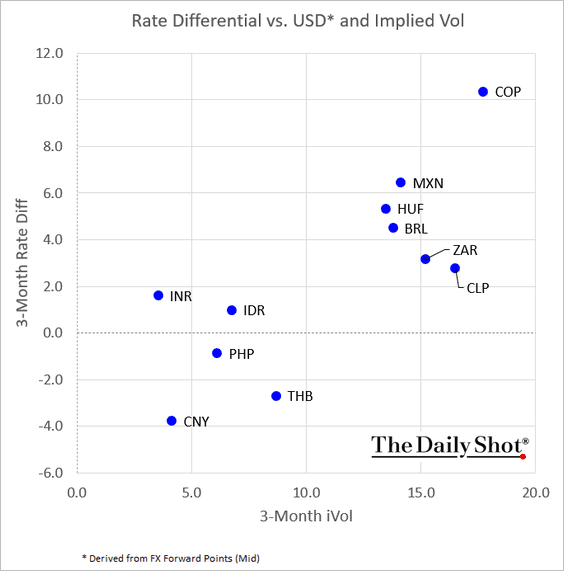
5. This scatterplot shows rate differentials (implied by the FX forward market) and implied volatility for select EM currencies.
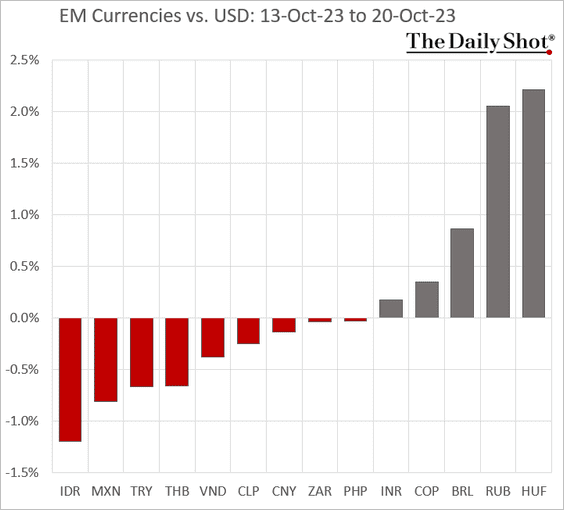
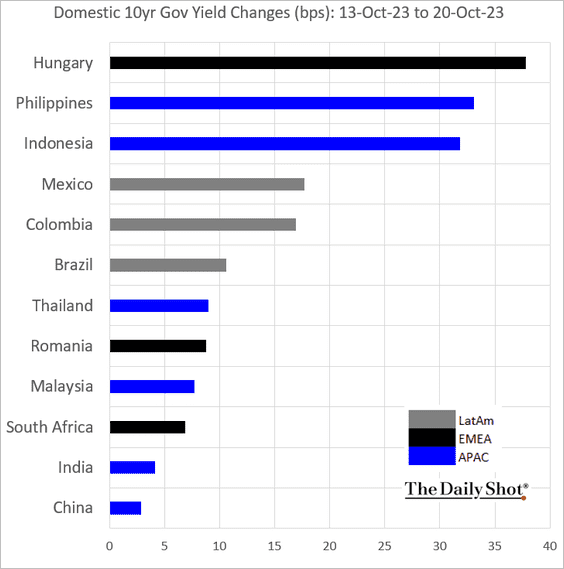
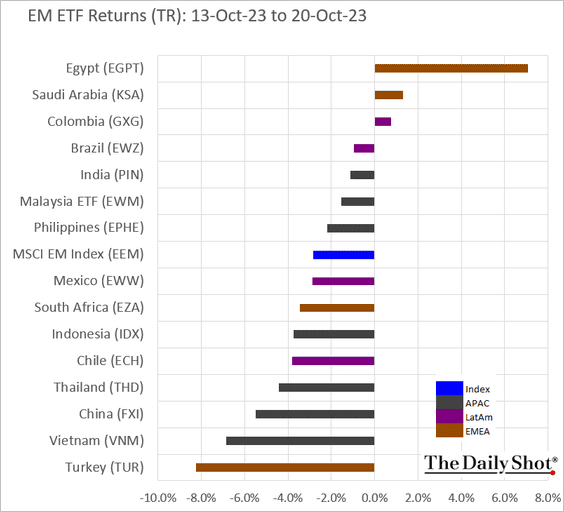
6. Finally, we have last week’s performance data.
• Currencies:
• Bond yields:
• Equity ETFs:
Back to Index
Commodities
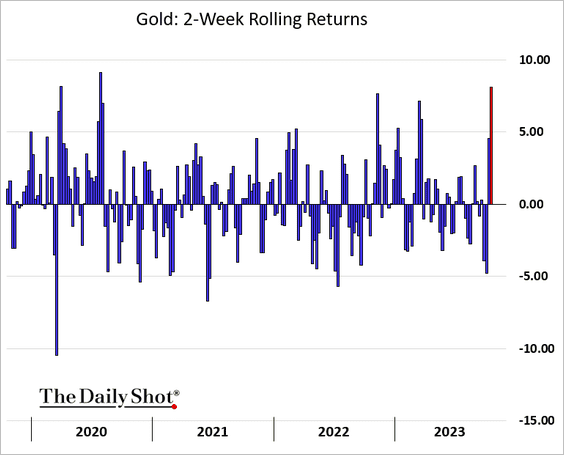
1. It’s been a great couple of weeks for gold.
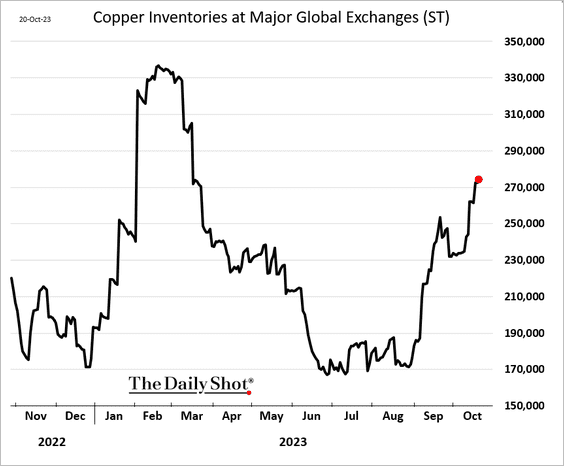
2. Copper keeps trending lower, …
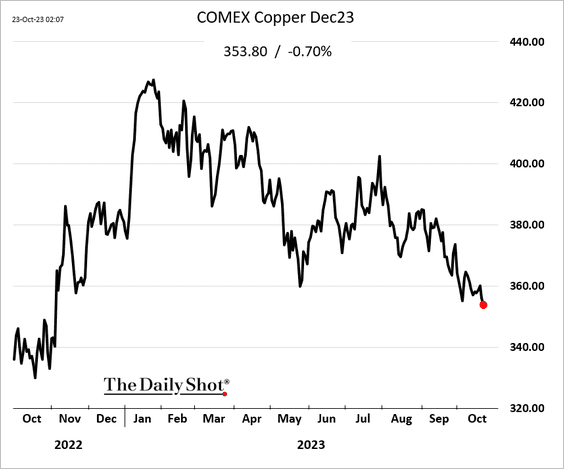
… amid rising inventories.
• CTAs have been betting against copper.
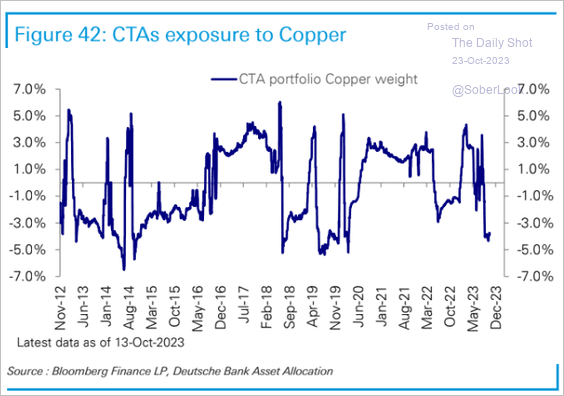 Source: Deutsche Bank Research
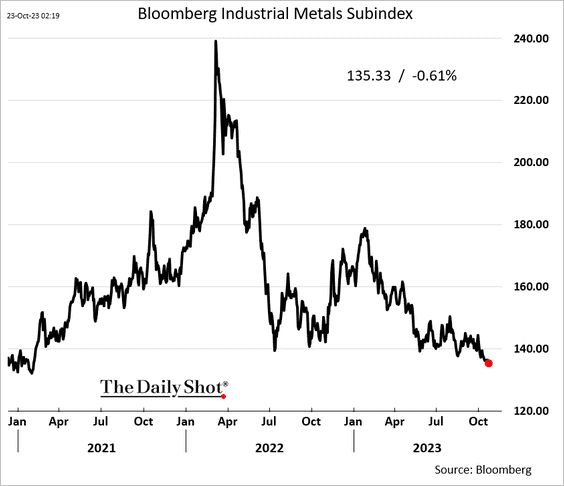
• Here is Bloomberg’s industrial commodities index.
——————–
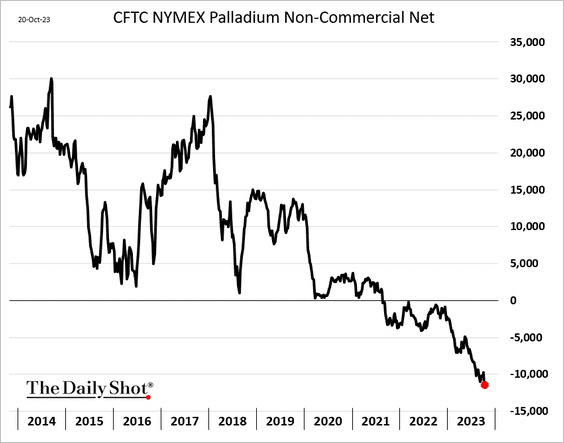
3. Speculative accounts are boosting their bets against palladium.
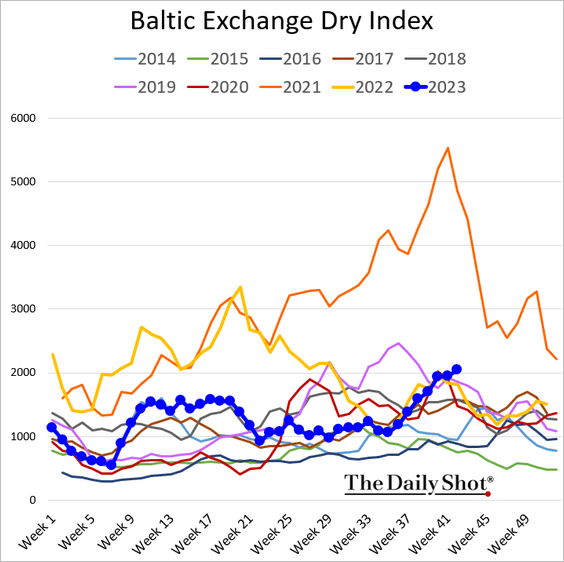
4. Dry bulk shipping costs have been rising.
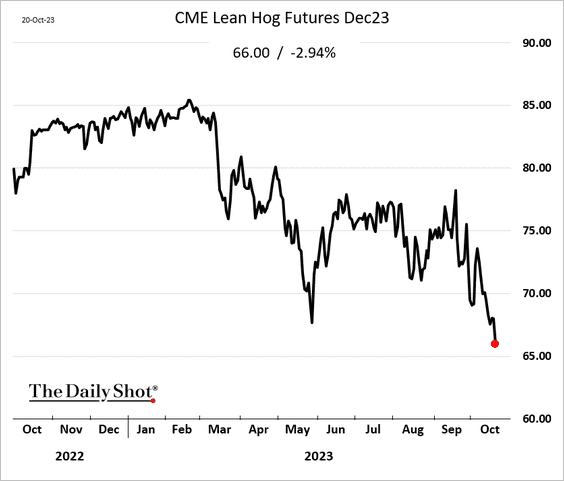
5. Hog futures took a hit last week.
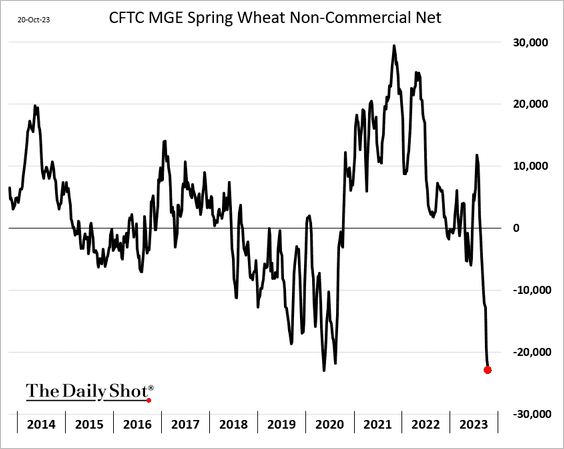
6. Speculators continue to bet against wheat futures.
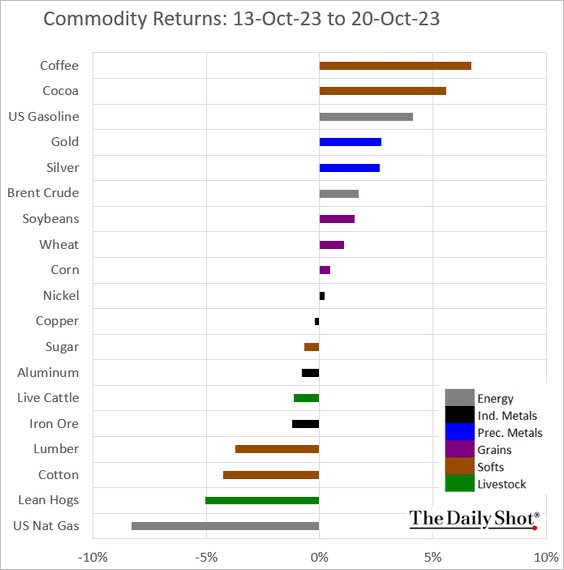
7. Finally, we have last week’s performance across key commodity markets.
Back to Index
Energy
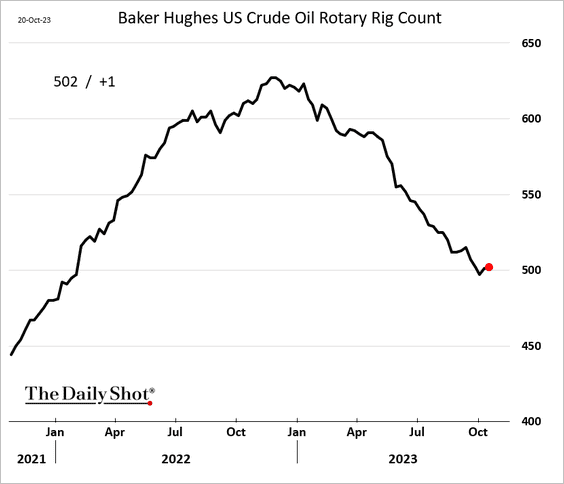
1. The US rig count increased again.
 Source: Reuters Read full article
——————–
2. Peak oil demand likely occurred in 1978.
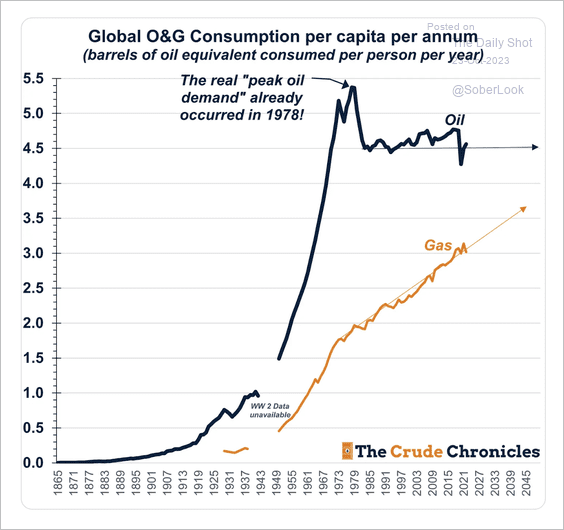 Source: The Crude Chronicles
Global oil demand growth tracks population growth over time.
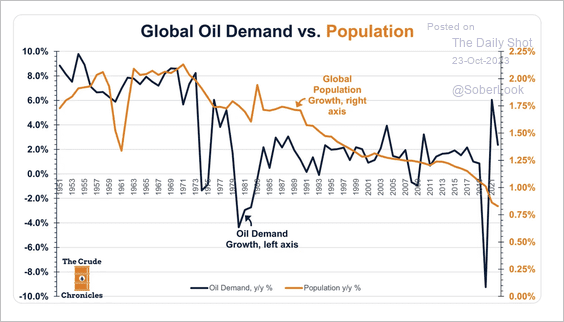 Source: The Crude Chronicles
——————–
3. Clean energy ETFs continue to see outflows.
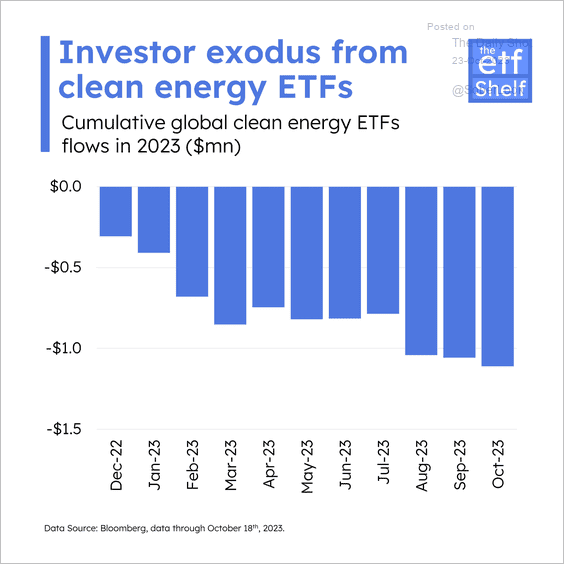 Source: The ETF Shelf
Back to Index
Equities
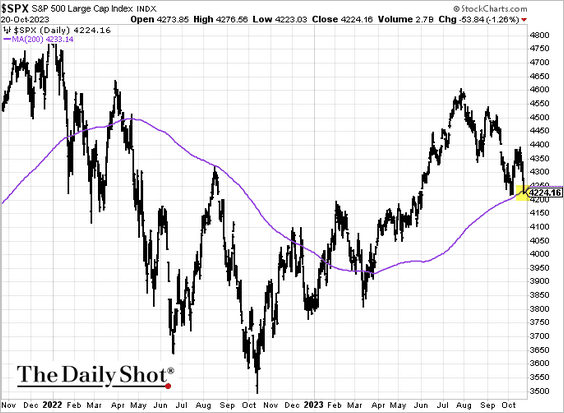
1. The S&P 500 closed below its 200-day moving average.
2. Seasonals suggest the S&P 500 could trade in a choppy range before a December rally.
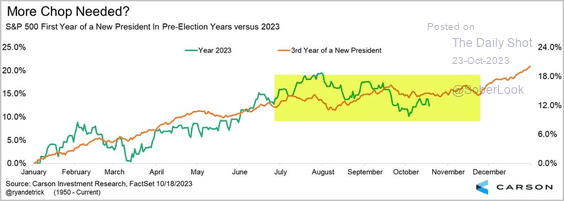 Source: @RyanDetrick
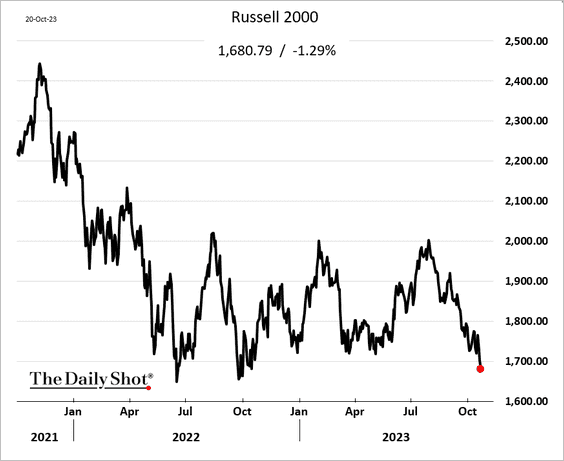
3. The Russell 2000 index is nearing multi-year lows.
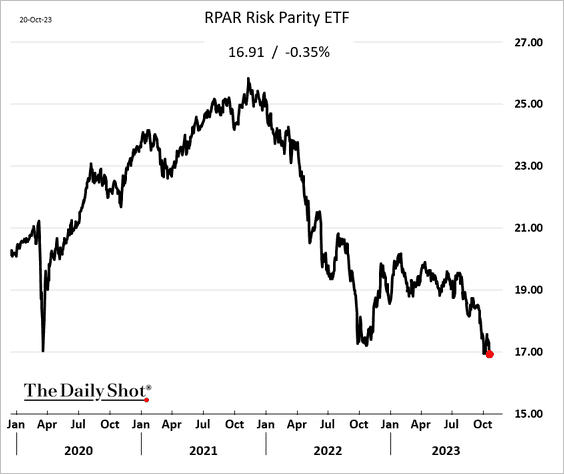
4. Risk parity strategies have been struggling.
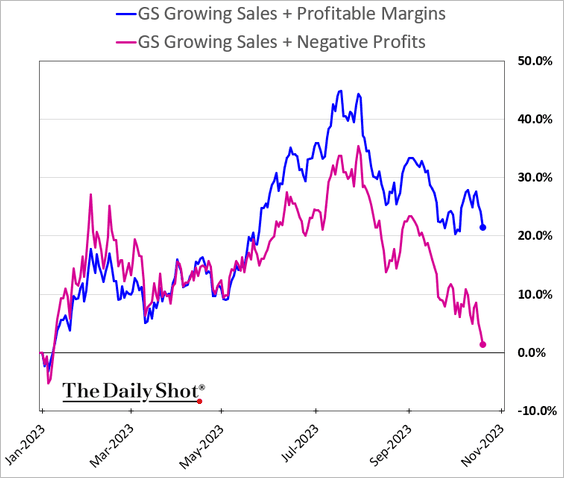
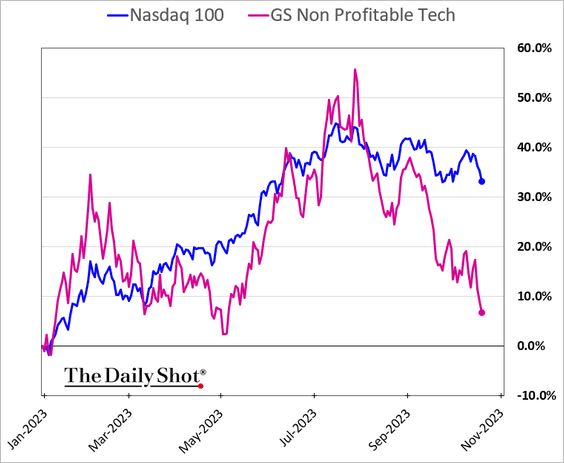
5. The next few charts show growing risk aversion in the market.
• Investors increasingly want profitable companies (2 charts).
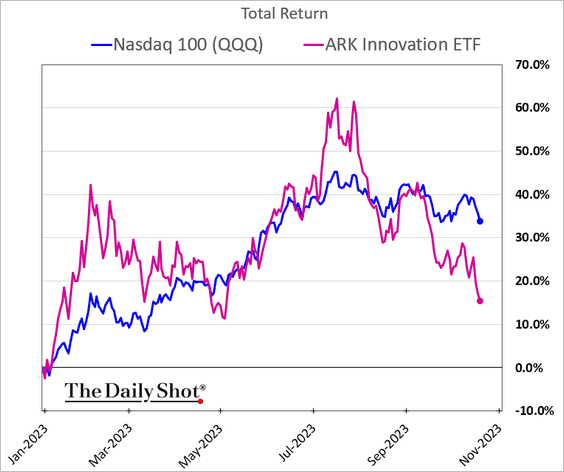
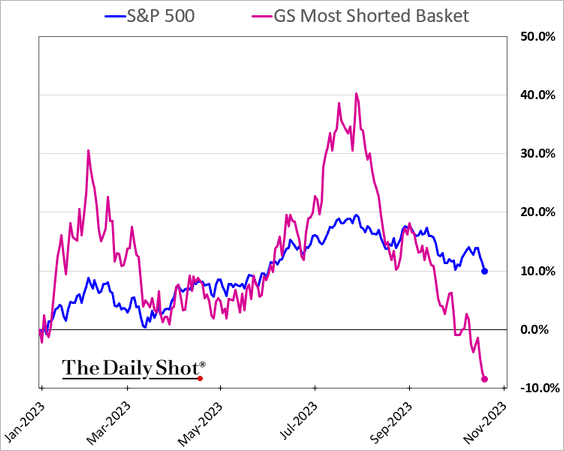
• Speculative stocks are out of favor (2 charts).
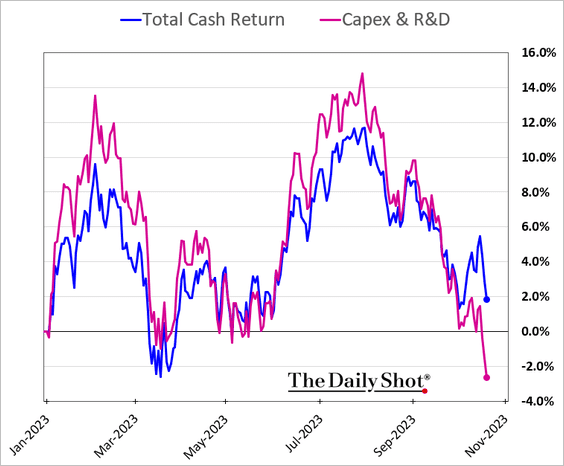
• There is more of a preference for firms that pay dividends and buy back shares to those investing in R&D.
——————–
6. Hedge funds are very cautious.
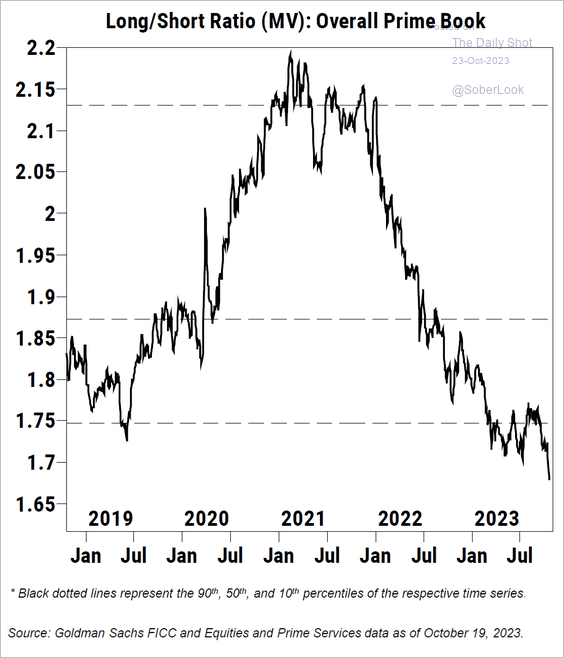 Source: Goldman Sachs
7. According to SentimenTrader, the S&P 500 sector breadth is at the widest spread in about 70 years.
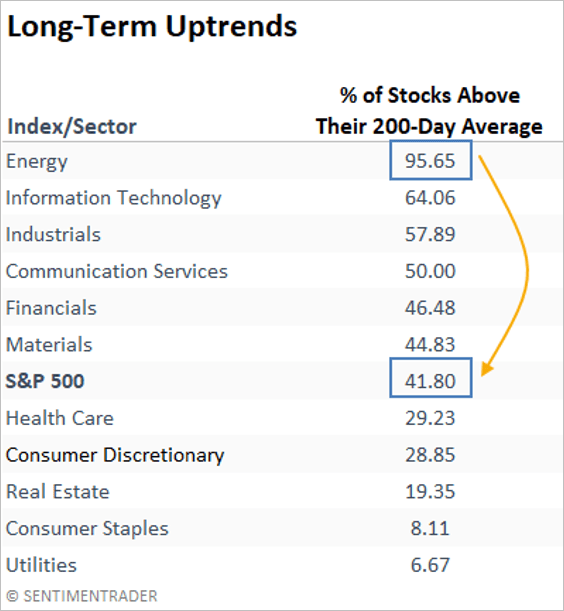 Source: SentimenTrader
8. The VIX curve is in backwardation, signaling heightened risk aversion (2 charts).
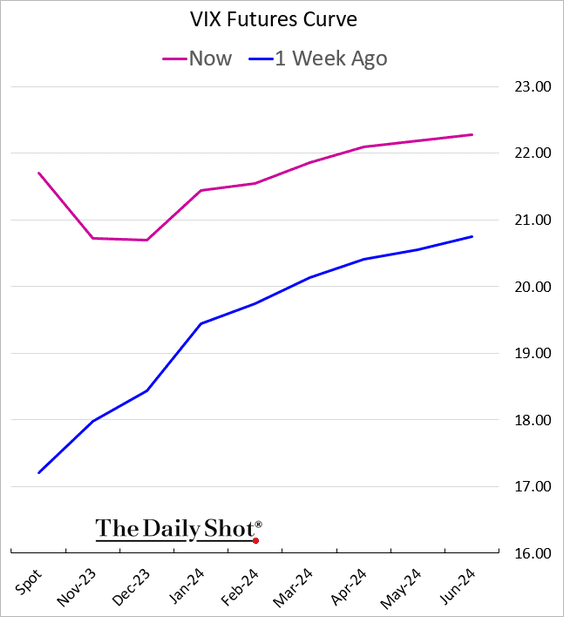
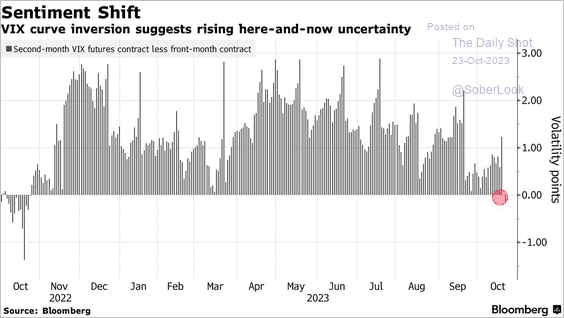 Source: @markets Read full article
——————–
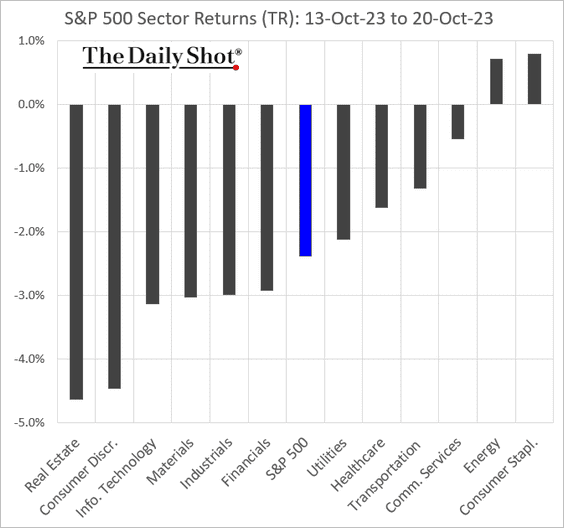
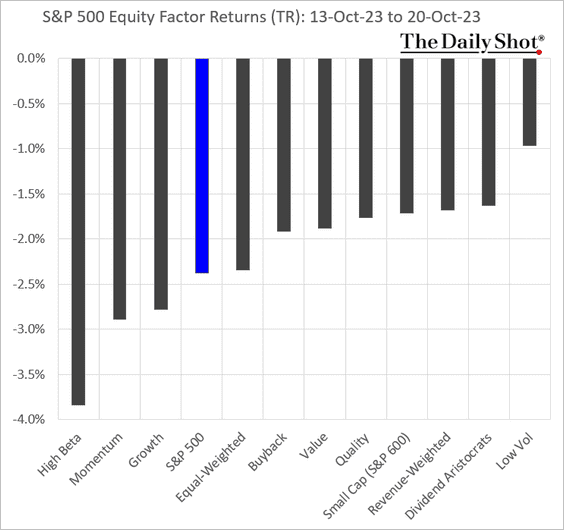
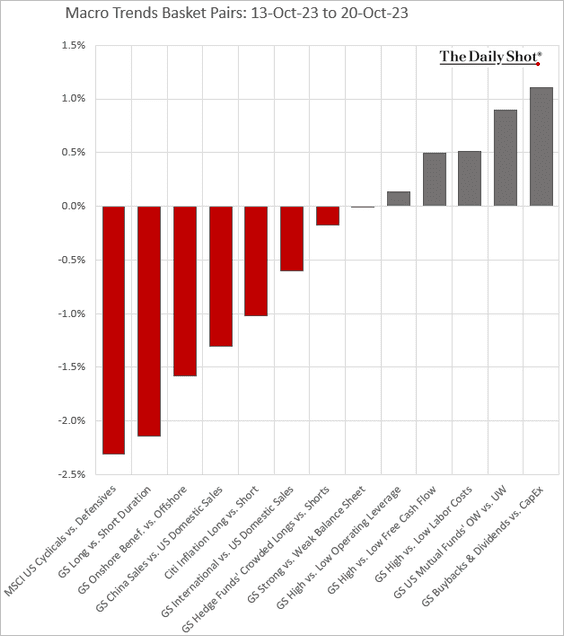
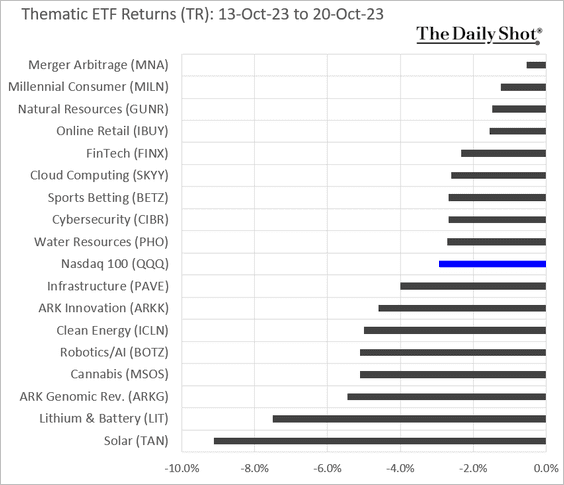
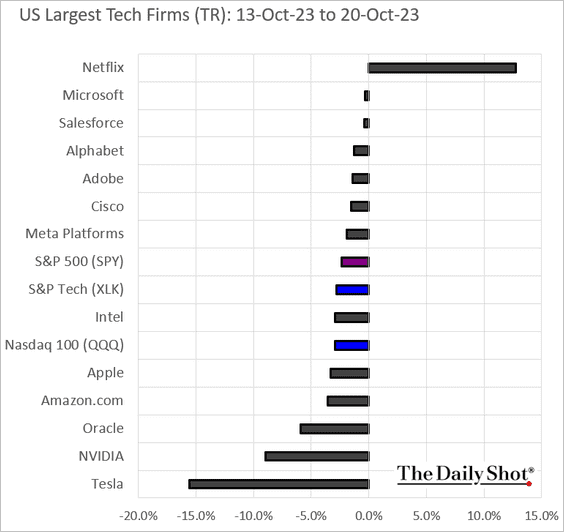
9. Finally, we have some performance data from last week.
• Sectors:
• Equity factors:
• Macro basket pairs’ relative performance:
• Thematic ETFs:
• Largest US tech firms:
Back to Index
Alternatives
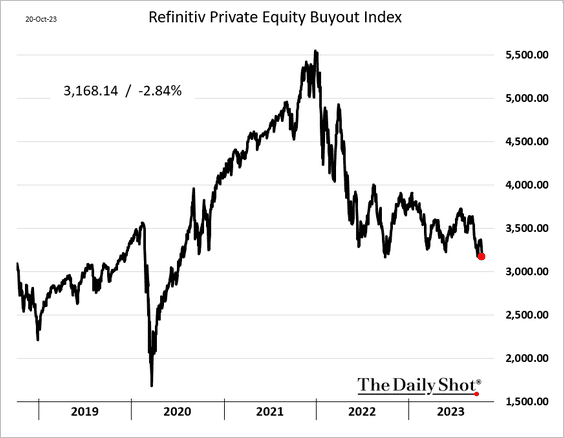
1. Public shares of PE firms have been under pressure.
2. Amidst reduced risk appetite in the leveraged buyout market, US private equity firms are now stepping up for a roughly 50% equity stake to facilitate syndicated loan deals.
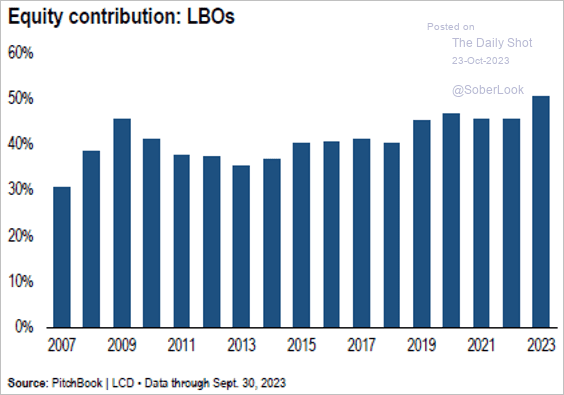 Source: PitchBook
Back to Index
Credit
1. CLO issuance has been sluggish compared to recent years.
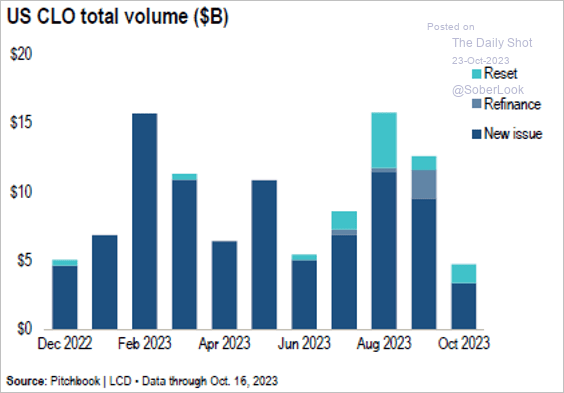 Source: PitchBook
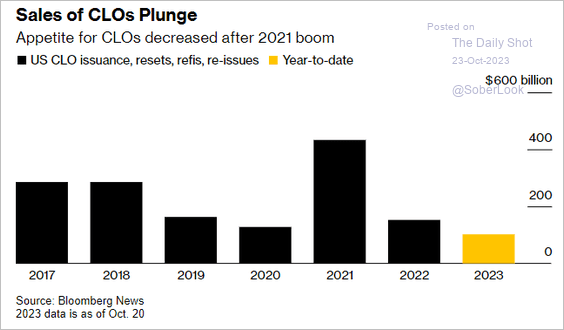 Source: @markets Read full article
——————–
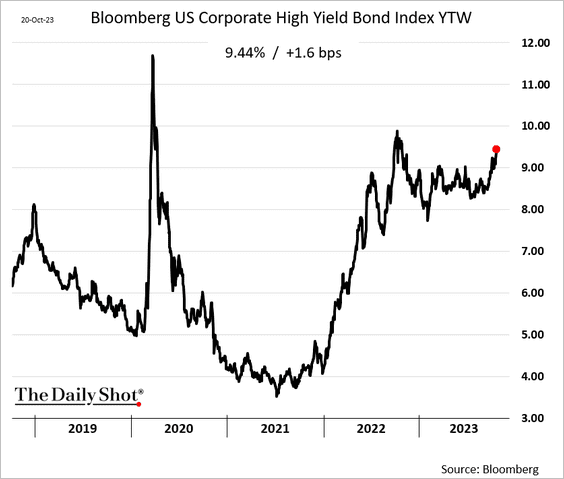
2. HY bond yields continue to climb.
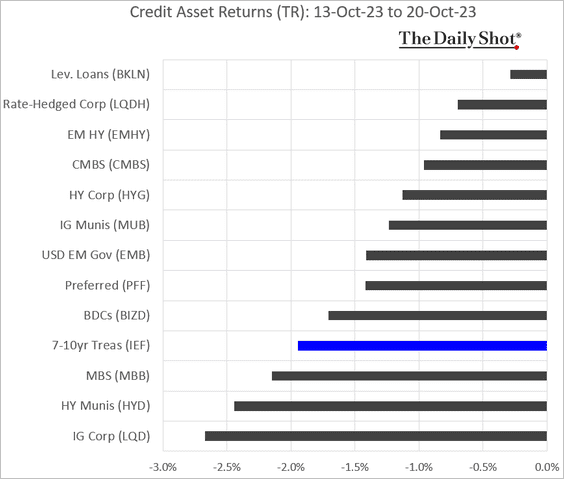
3. Here is last week’s performance across credit asset classes.
Back to Index
Rates
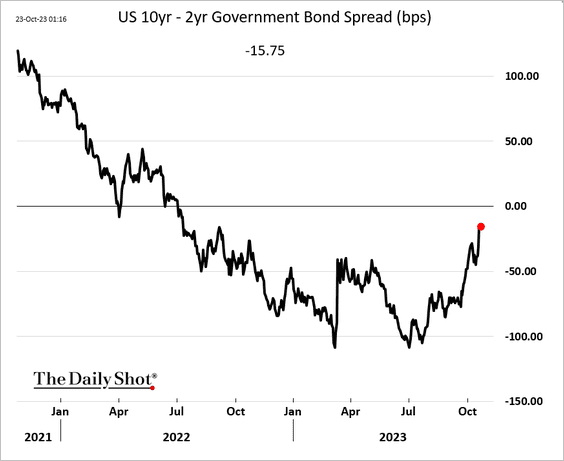
1. The Treasury curve continues to flatten.
2. The spread between the 10-year Treasury yield and its 200-day moving average is the most extreme since its cycle peak in 1981.
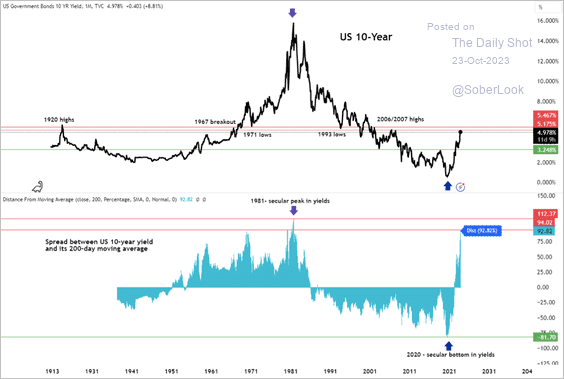 Source: Aazan Habib, Paradigm Capital
3. The divergence between the copper-to-gold ratio and the 10-year Treasury yield has reached new extremes.
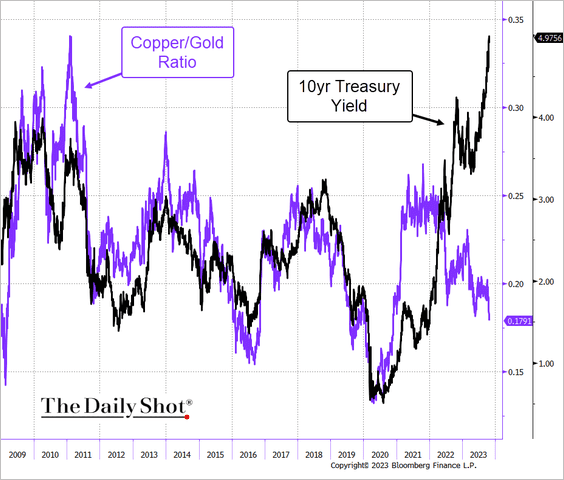 Source: @TheTerminal, Bloomberg Finance L.P.
4. Retail investors have been purchasing TLT (iShares 20+ Year Treasury Bond ETF) amidst a massive decline in long-dated Treasury prices.
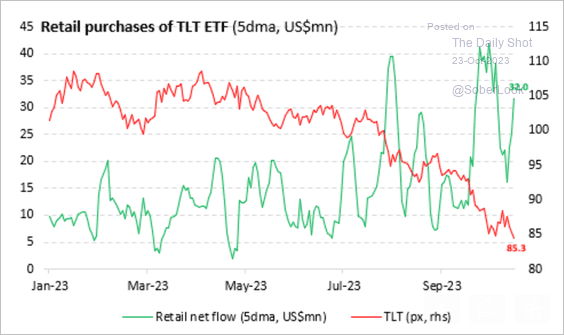 Source: Vanda Research
Back to Index
Global Developments
1. According to World Economics, companies accelerated price increases this month.
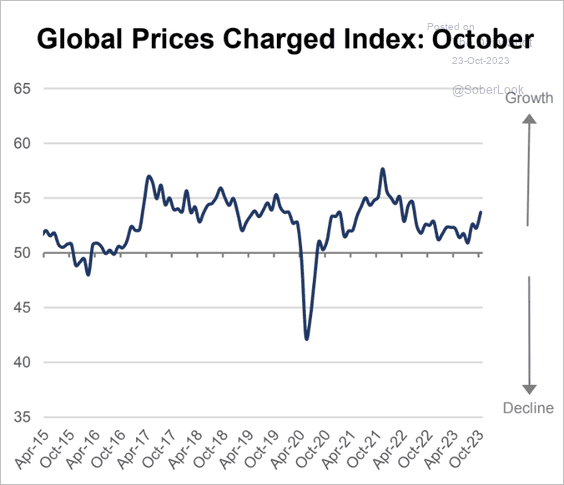 Source: World Economics
2. Depressed consumer confidence points to slower economic growth ahead.
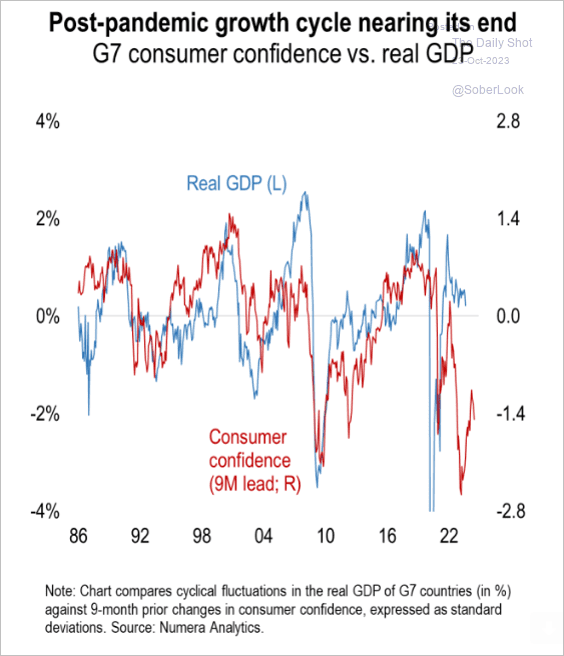 Source: Numera Analytics (@NumeraAnalytics)
3. Here is a look at institutional investor sentiment by asset class.
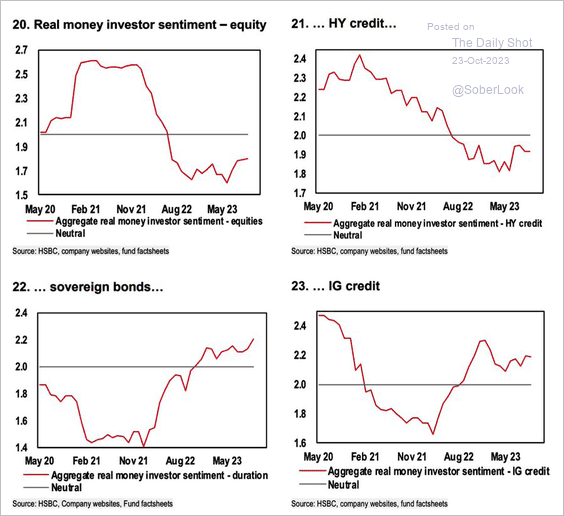 Source: HSBC; @WallStJesus
4. Most sovereign debt markets experienced increases in term premiums this year.
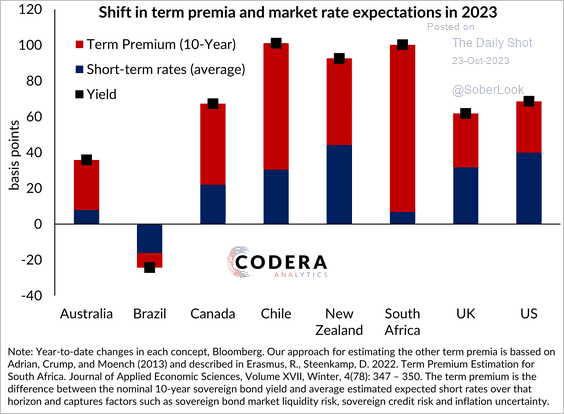 Source: Codera Analytics Read full article
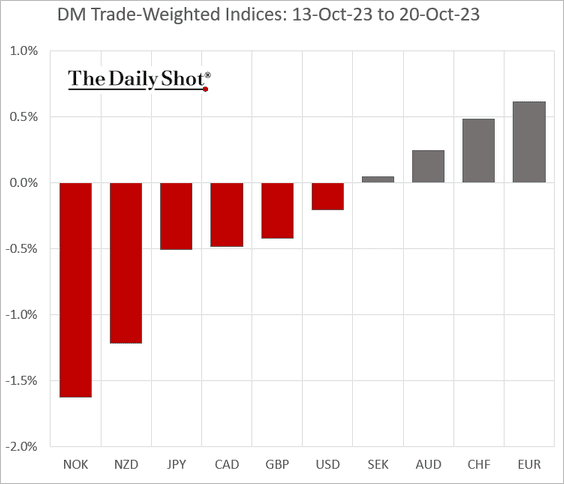
5. Finally, we have last week’s performance data for select economies.
• Currencies:
• Bond yields:
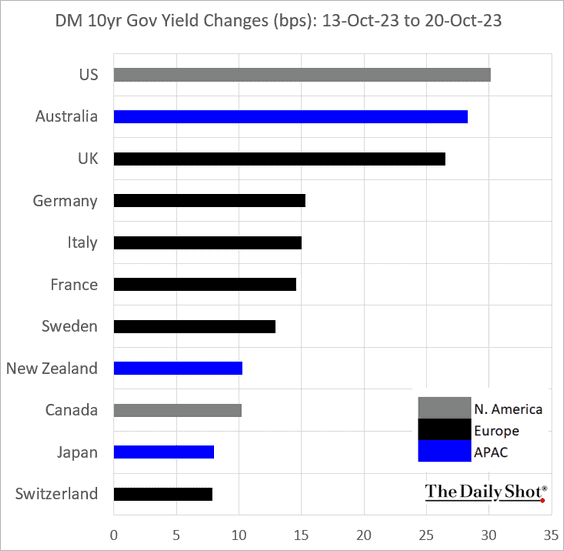
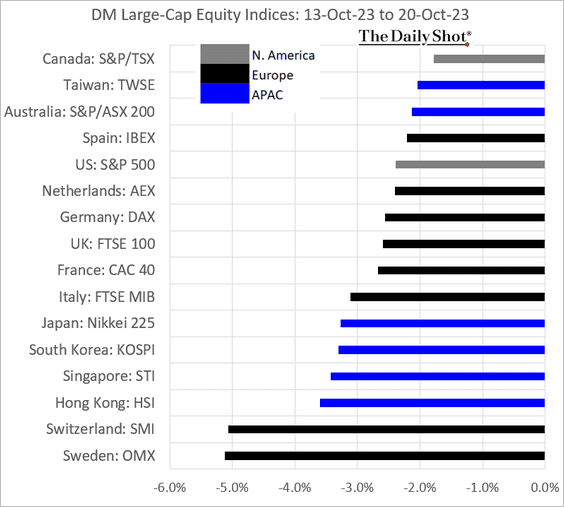
• Equity indices:
——————–
Food for Thought
1. US federal debt held by the public:
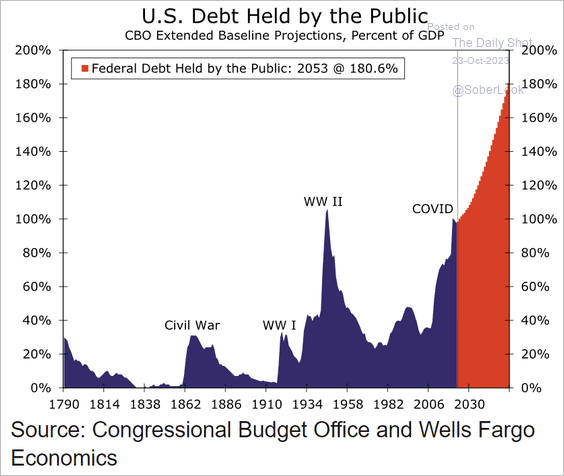 Source: Wells Fargo Securities
2. Grocery delivery users:
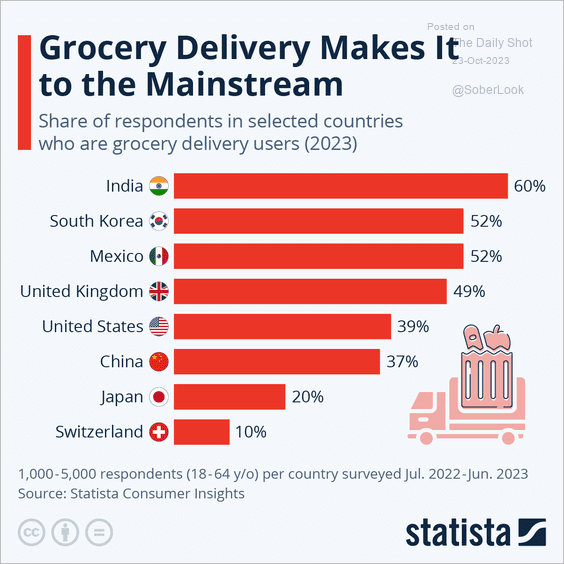 Source: Statista
3. Changes in arms exports:
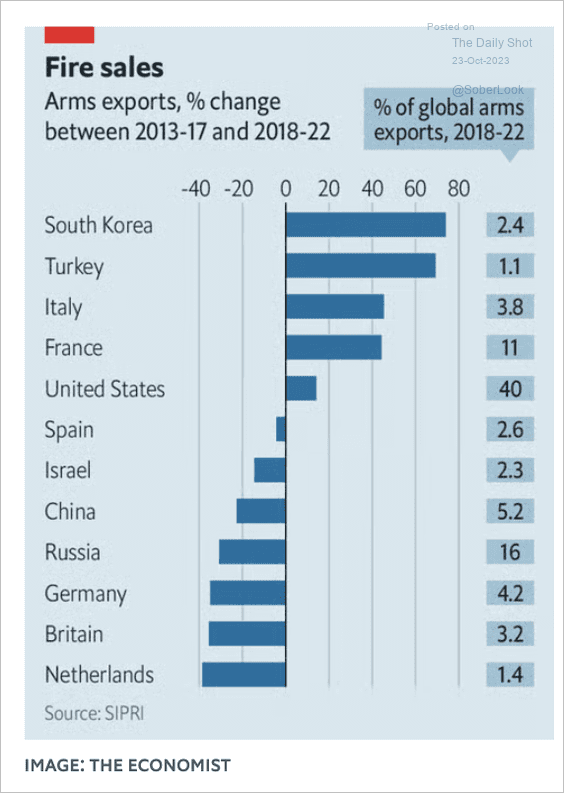 Source: The Economist Read full article
4. Gaza population density:
 Source: @axios Read full article
5. The cost of supporting Russia:
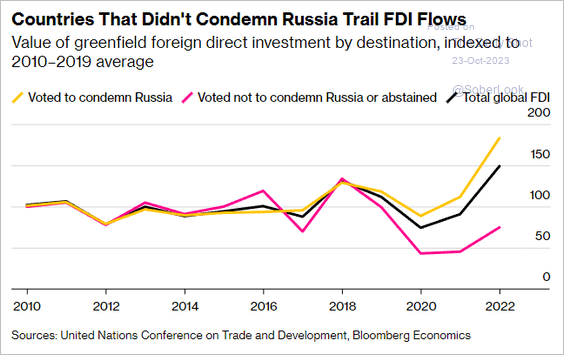 Source: @business Read full article
6. Branded and generic drug prices in the US vs. other countries:
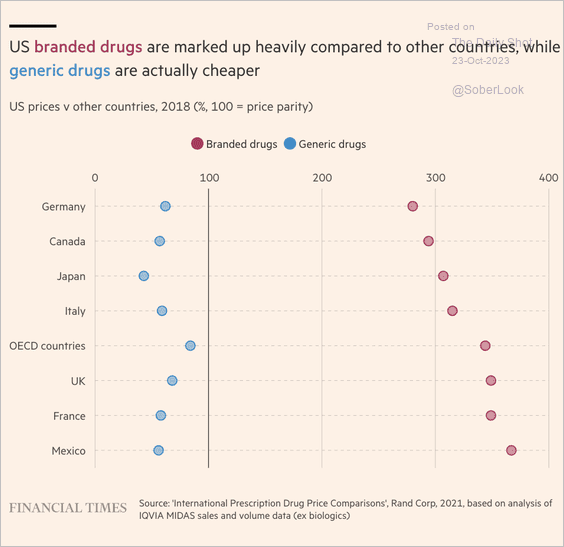 Source: @financialtimes Read full article
7. Activist groups conducting museum vandalism:
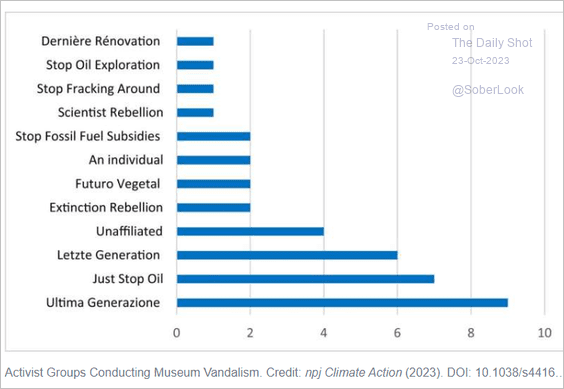 Source: Phys.org Read full article
8. How Americans view politics (2 charts):
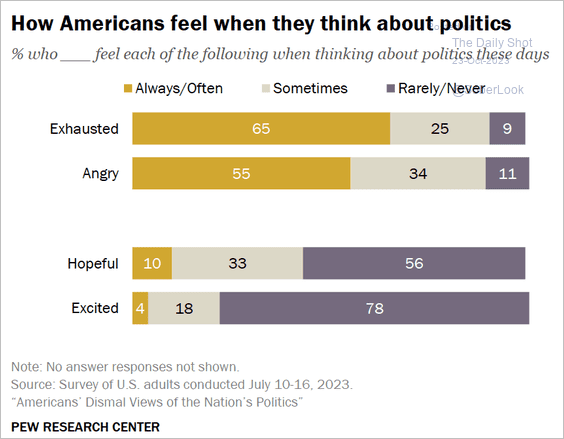 Source: Pew Research Center Read full article
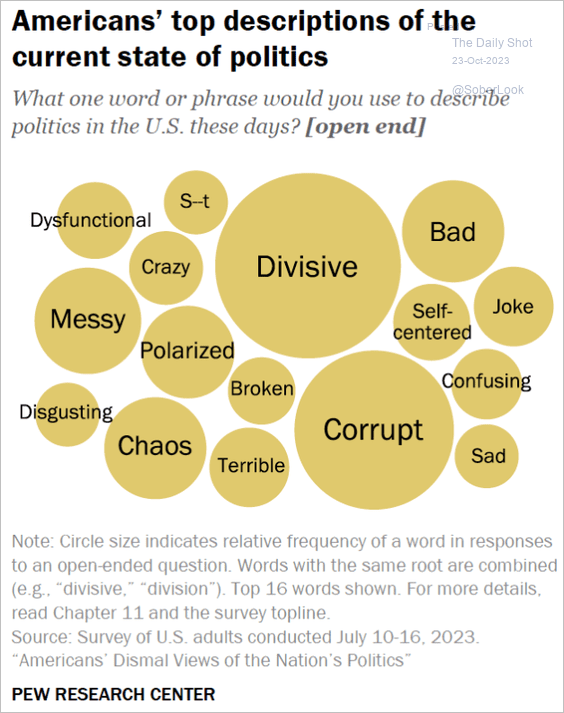 Source: Pew Research Center Read full article
——————–
9. Which languages take the longest to learn for English speakers?
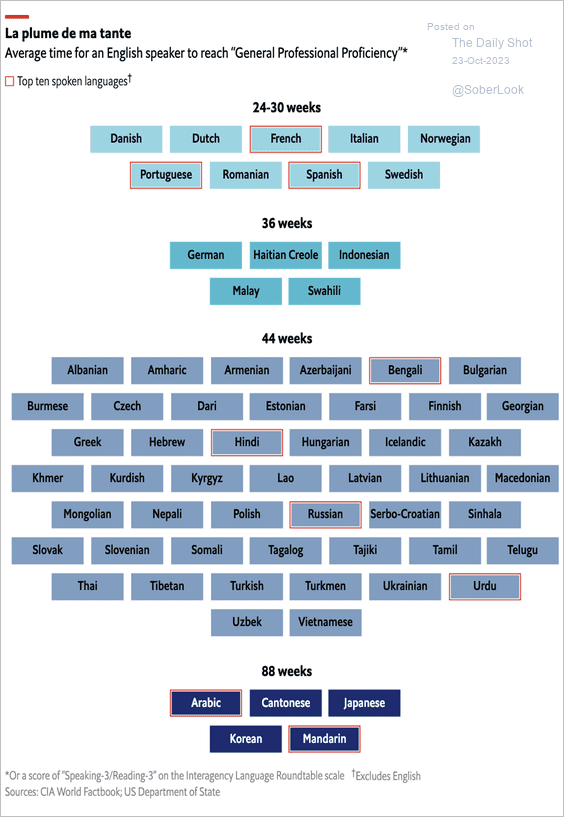 Source: The Economist Read full article
——————–
Back to Index