The Daily Shot: 27-Oct-23
• The United States
• Canada
• The United Kingdom
• The Eurozone
• Europe
• Japan
• China
• Emerging Markets
• Cryptocurrency
• Commodities
• Energy
• Equities
• Rates
• Food for Thought
The United States
1. US economic growth accelerated last quarter, …
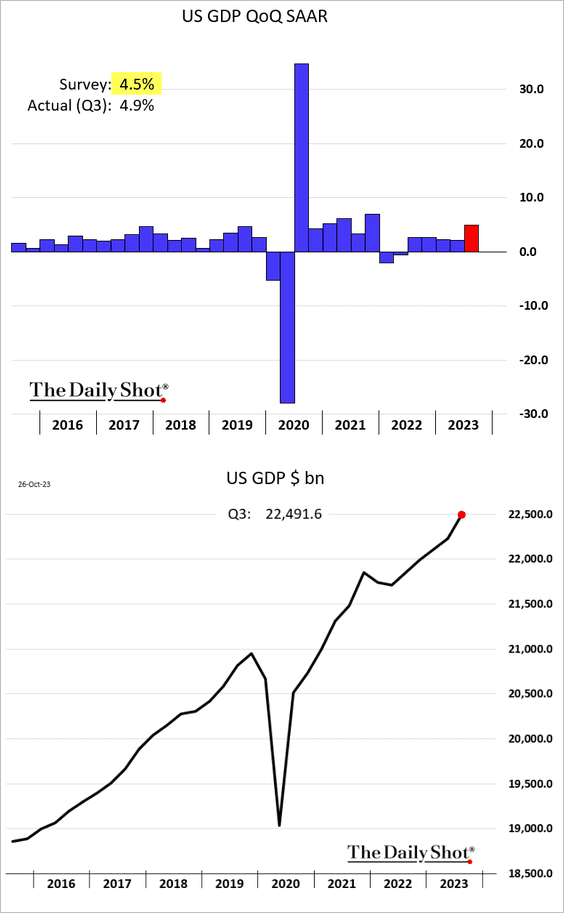
… driven by robust consumer spending. However, most economists expect a slowdown ahead.
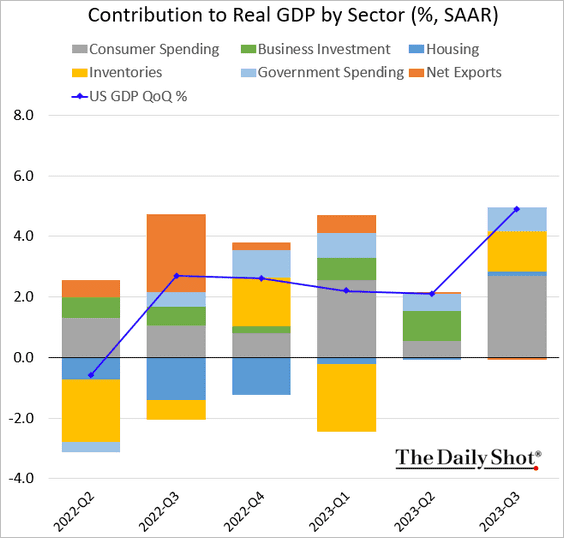
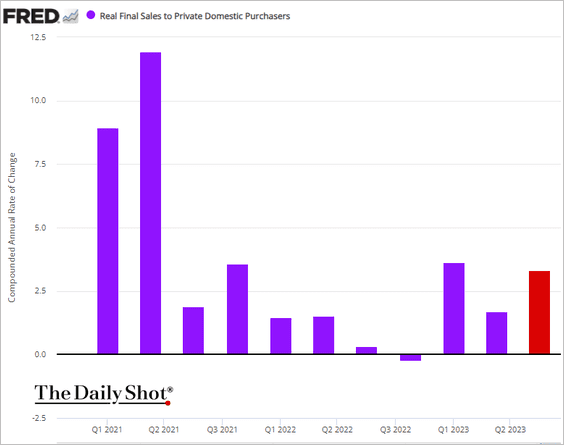
• The index of real final sales to private domestic purchasers (the “core” GDP) was also quite strong.
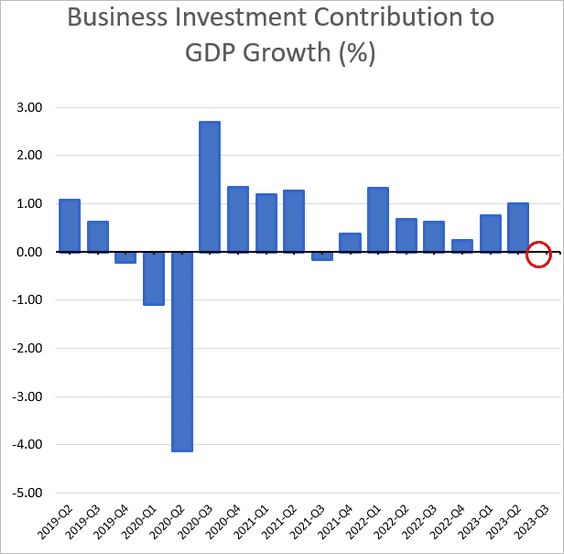
• After seven consecutive quarterly gains, business investment growth stalled.
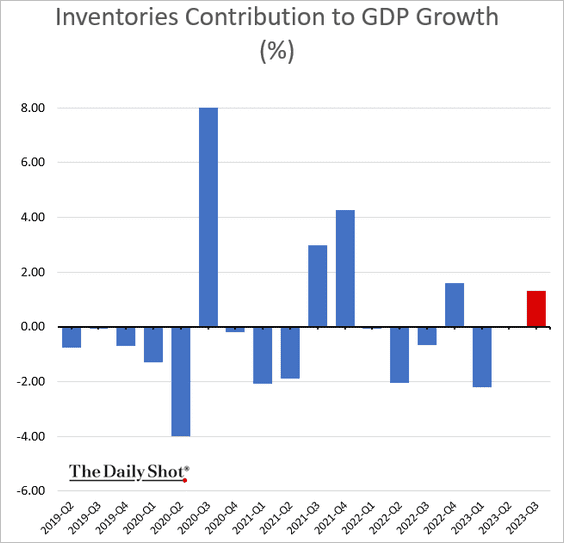
• Inventory accumulation boosted GDP growth.
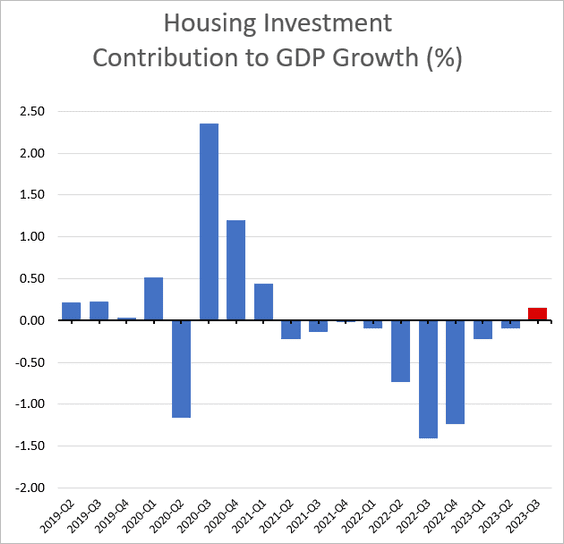
• Housing investment saw its first increase in ten quarters.
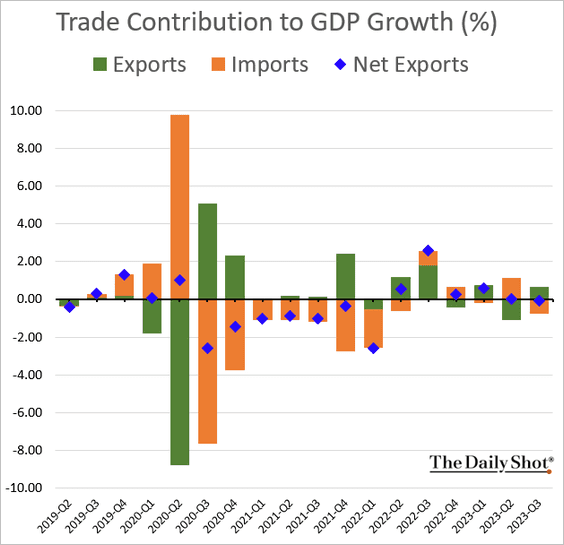
• Net exports were roughly flat.
——————–
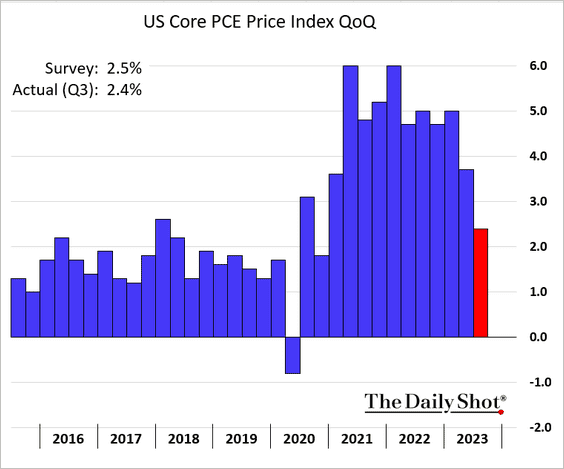
2. Core inflation cooled in Q3.
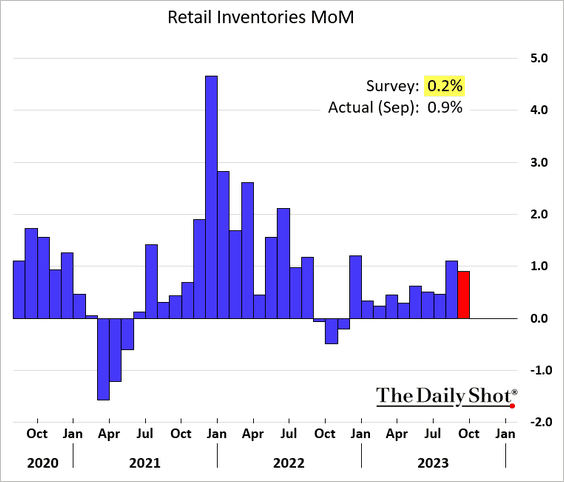
3. Last month’s increase in retail inventories surprised to the upside.
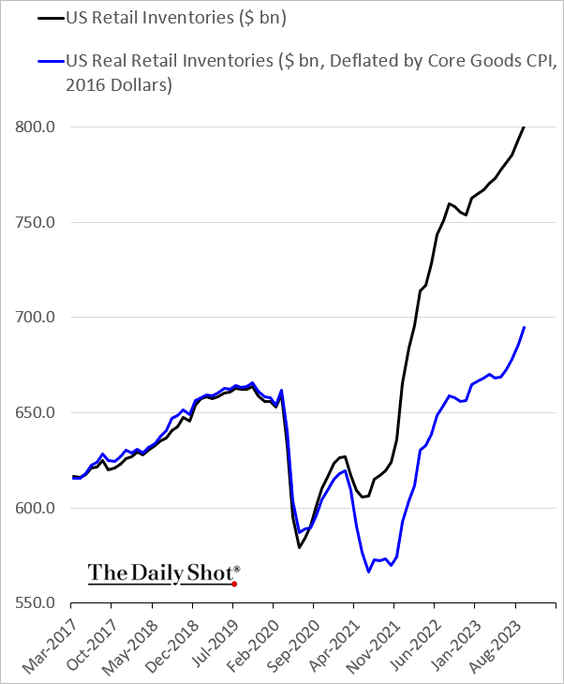
This chart shows the level of retail inventories adjusted for inflation.
——————–
4. Durable goods orders surged in September, …
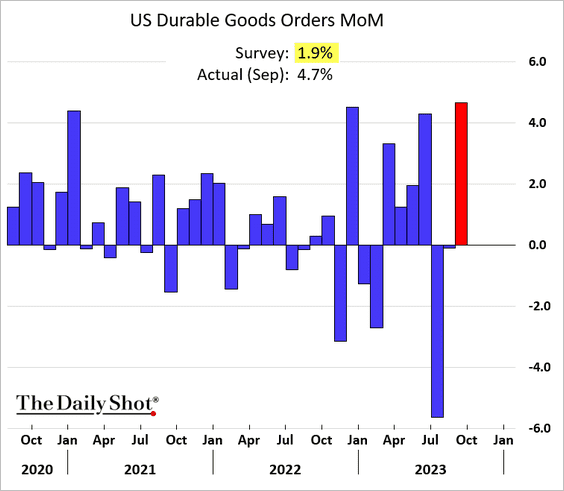
… boosted by aircraft orders.
 Source: MarketWatch Read full article
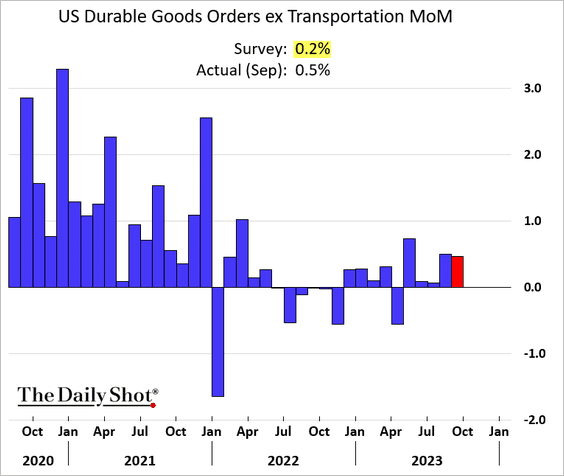
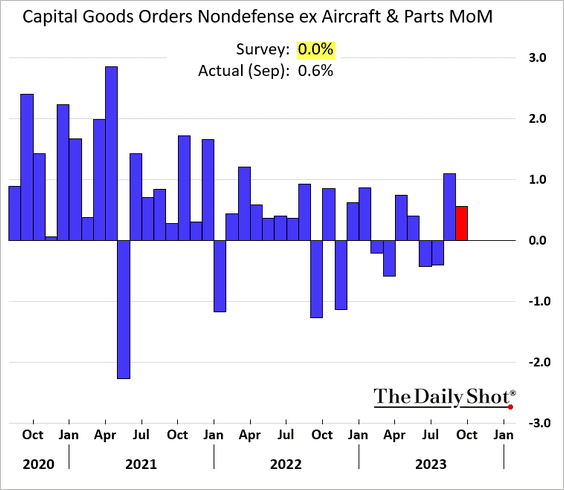
But even excluding transportation, new orders topped expectations.
Capital goods orders surprised to the upside.
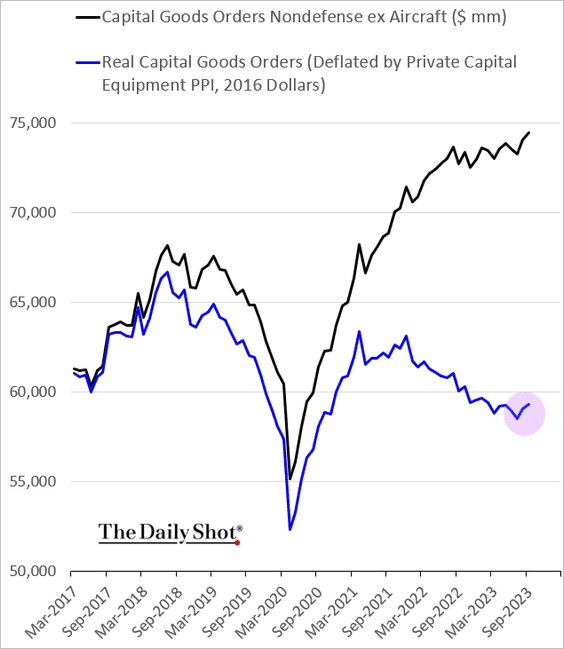
Here is a look at capital goods orders adjusted for inflation.
——————–
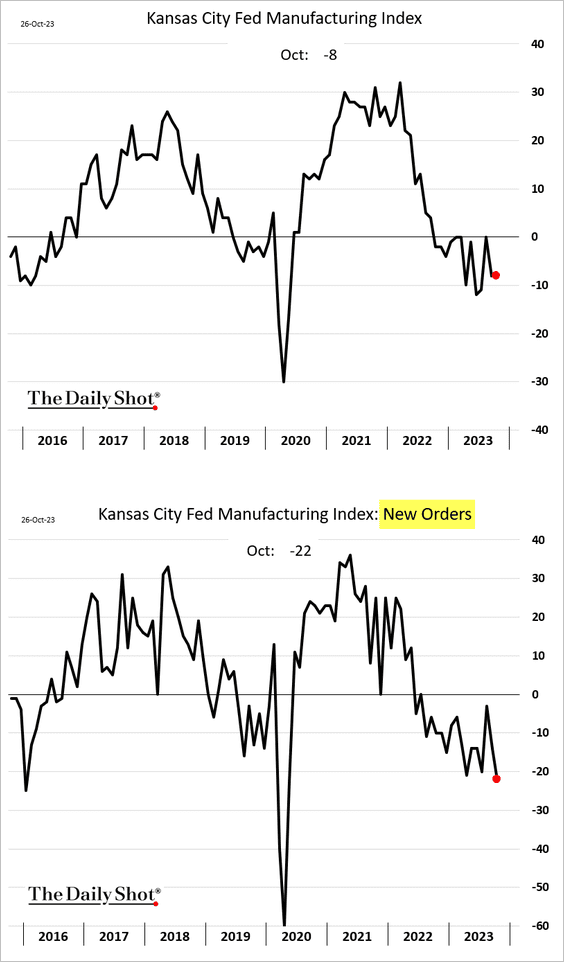
5. The Kansas City Fed’s manufacturing index showed sagging demand in the region this month.
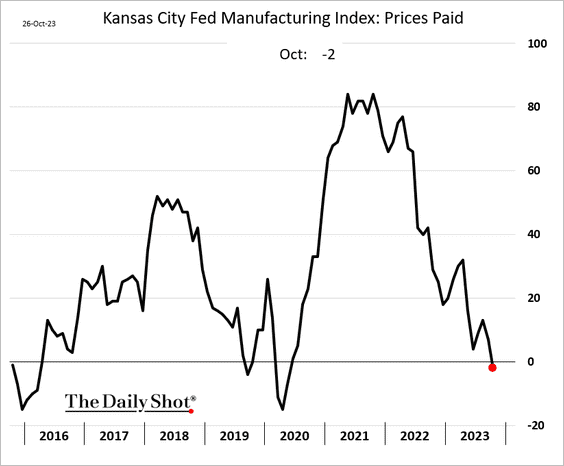
Input costs are now falling.
——————–
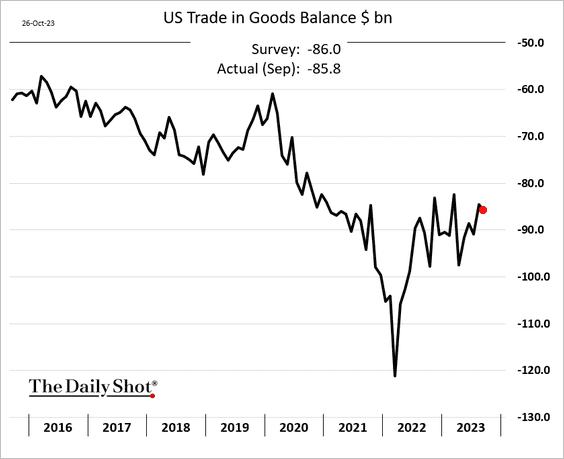
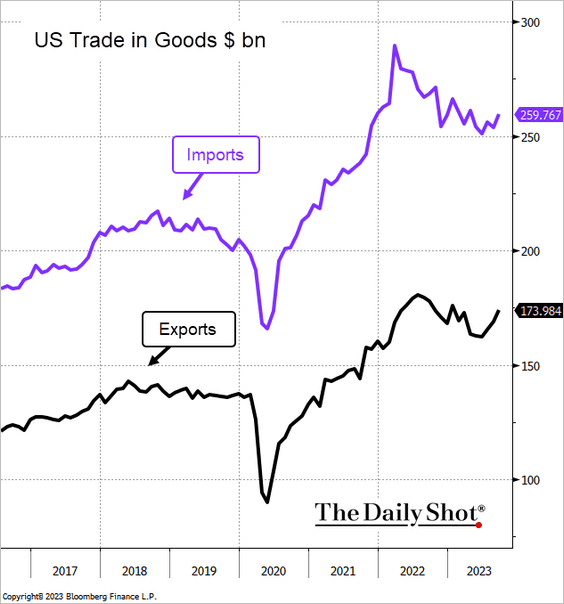
6. The goods trade deficit widened slightly in September.
Both imports and exports increased.
 Source: @TheTerminal, Bloomberg Finance L.P.
——————–
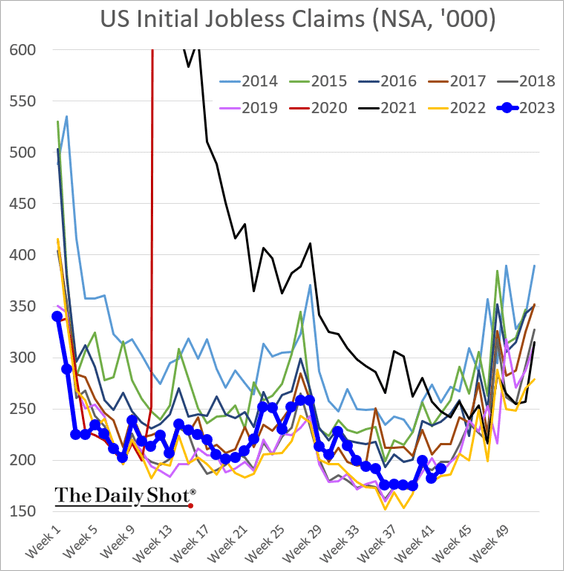
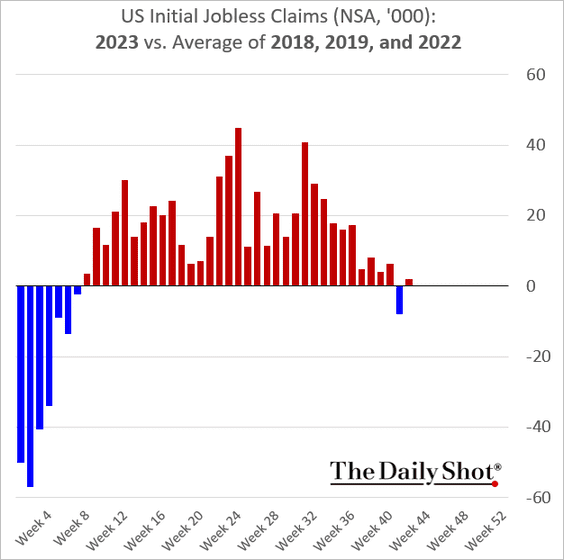
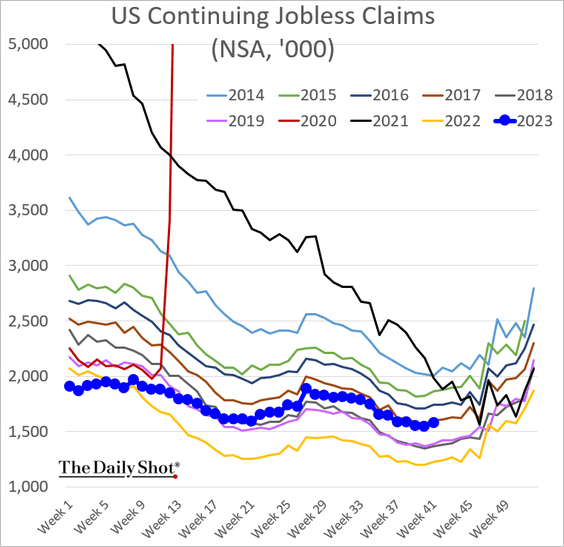
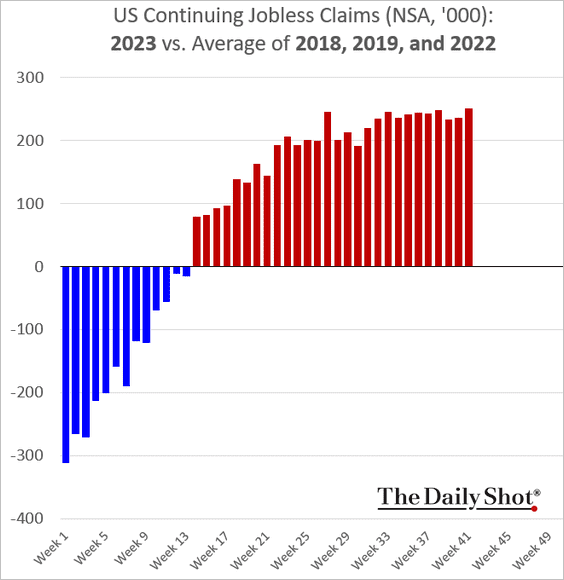
7. Initial jobless claims remain exceptionally low despite the massive increase in interest rates in this cycle.
But continuing claims are elevated relative to recent years.
——————–
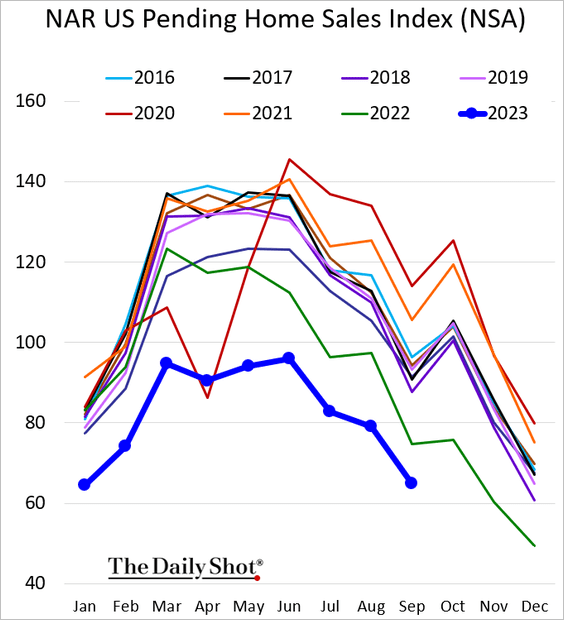
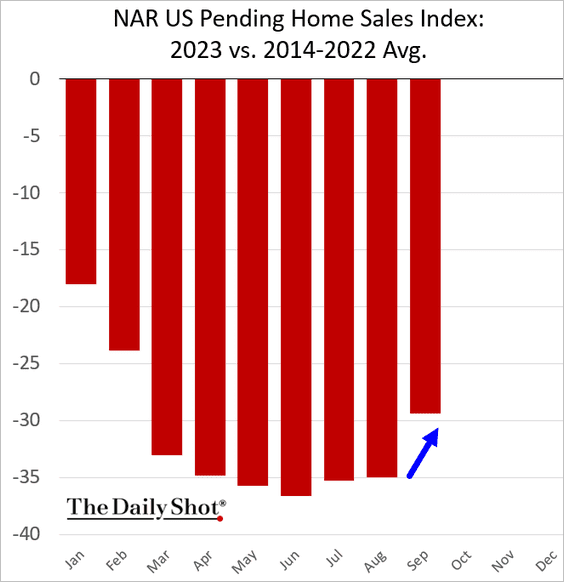
8. September pending home sales surprised to the upside but remained at multi-year lows.
 Source: MarketWatch Read full article
Back to Index
Canada
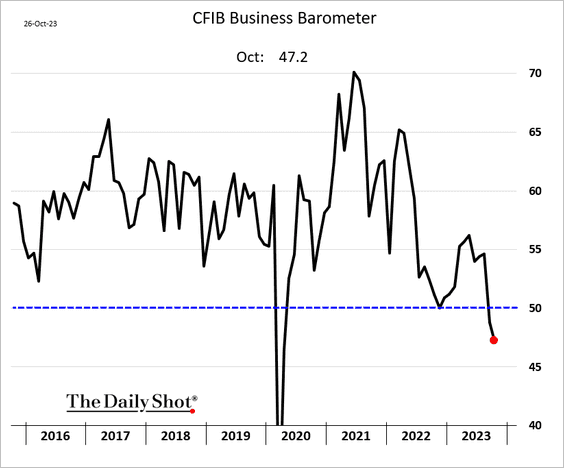
The CFIB business activity index of small and medium-sized firms deteriorated further this month, signaling a sharp slowdown in economic growth.
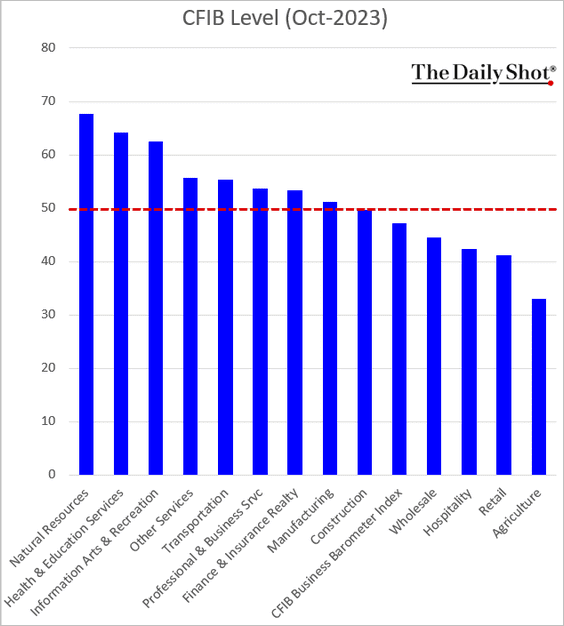
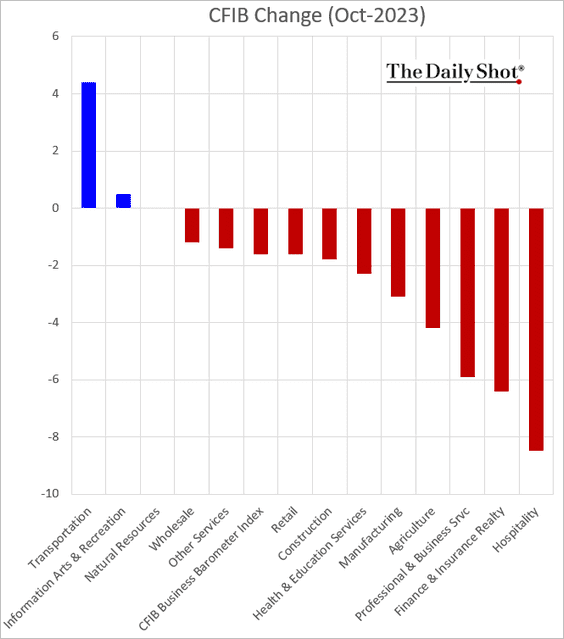
Here is the breakdown by sector.
• CFIB index level:
• Changes from September:
Back to Index
The United Kingdom
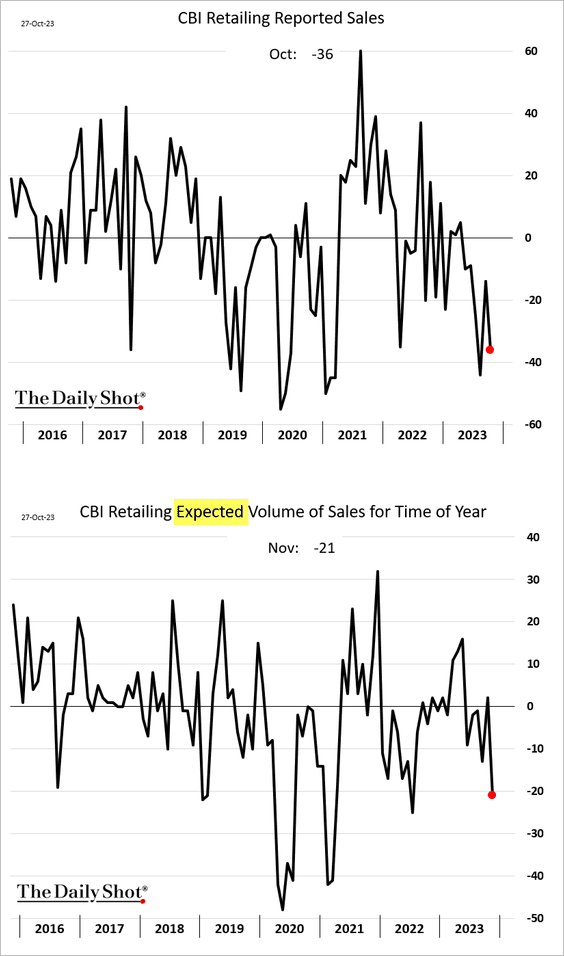
The CBI reported a deterioration in retail sales this month, with businesses expecting further weakness in demand next month.
 Source: Reuters Read full article
Back to Index
The Eurozone
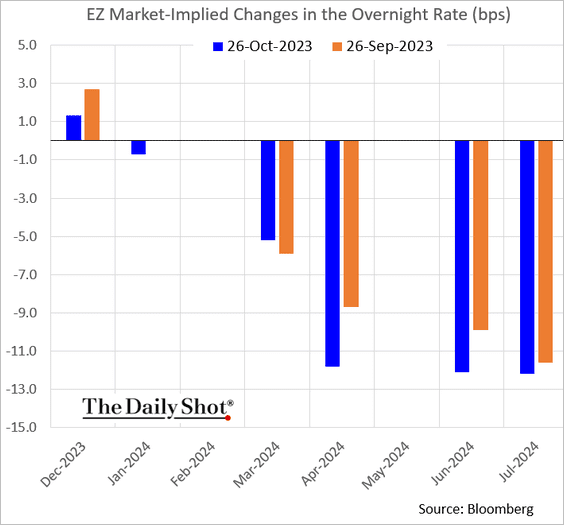
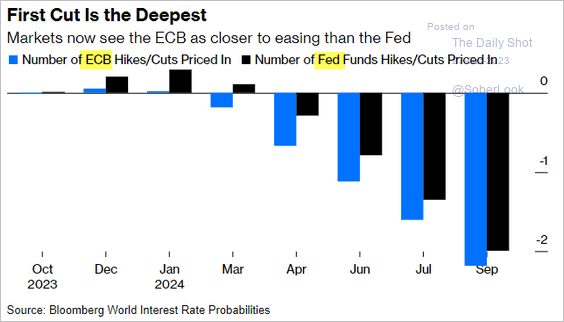
1. The ECB kept rates unchanged, as expected. The market does not see any more rate increases in this cycle, with cuts starting next spring.
 Source: @johnauthers, @opinion Read full article
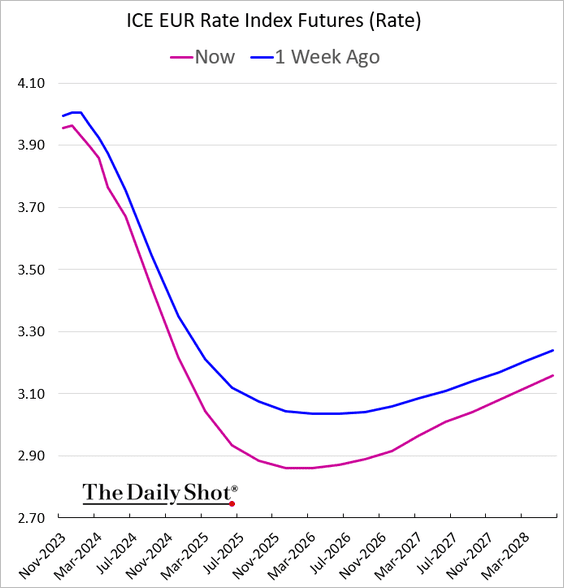
The market now expects deeper cuts in 2024 and 2025 as the economy struggles.
——————–
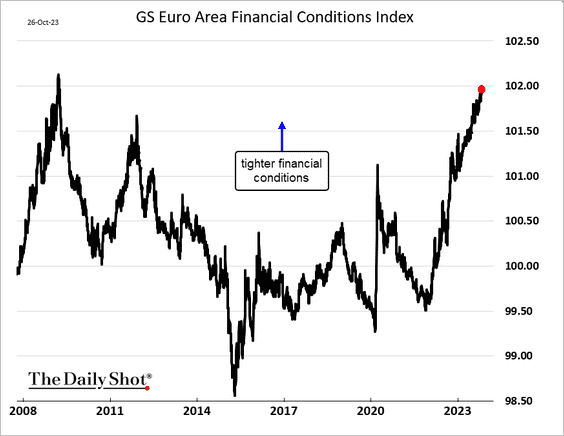
2. Euro-area financial conditions are very tight, according to Goldman’s indicator.
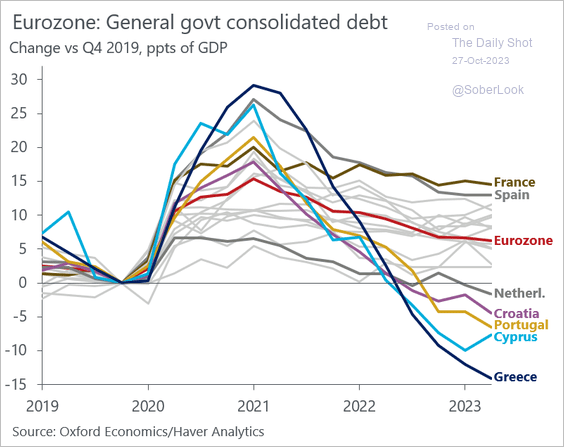
3. This chart shows the evolution of COVID-era debt-to-GDP ratios.
 Source: @DanielKral1
Back to Index
Europe
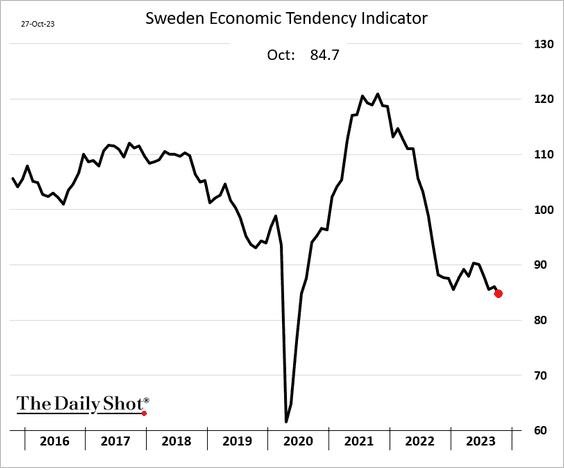
1. Sweden’s key sentiment measure deteriorated further this month.
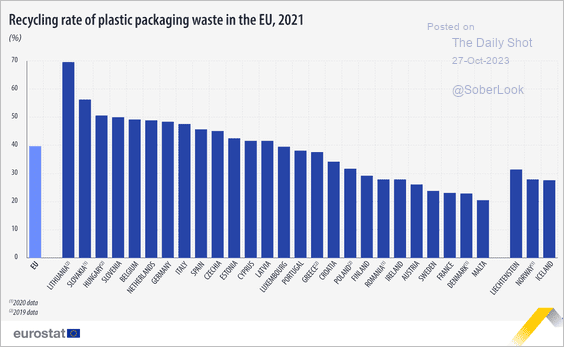
2. Here is a look at plastics recycling in the EU.
 Source: Eurostat
Back to Index
Japan
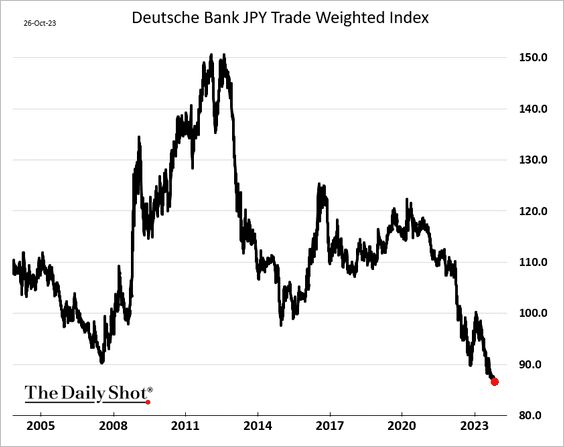
1. The yen trade-weighted index continues to decline.
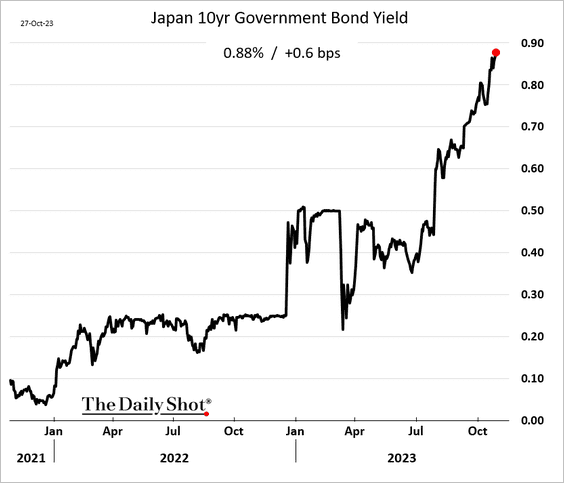
2. JGB yields are grinding higher.
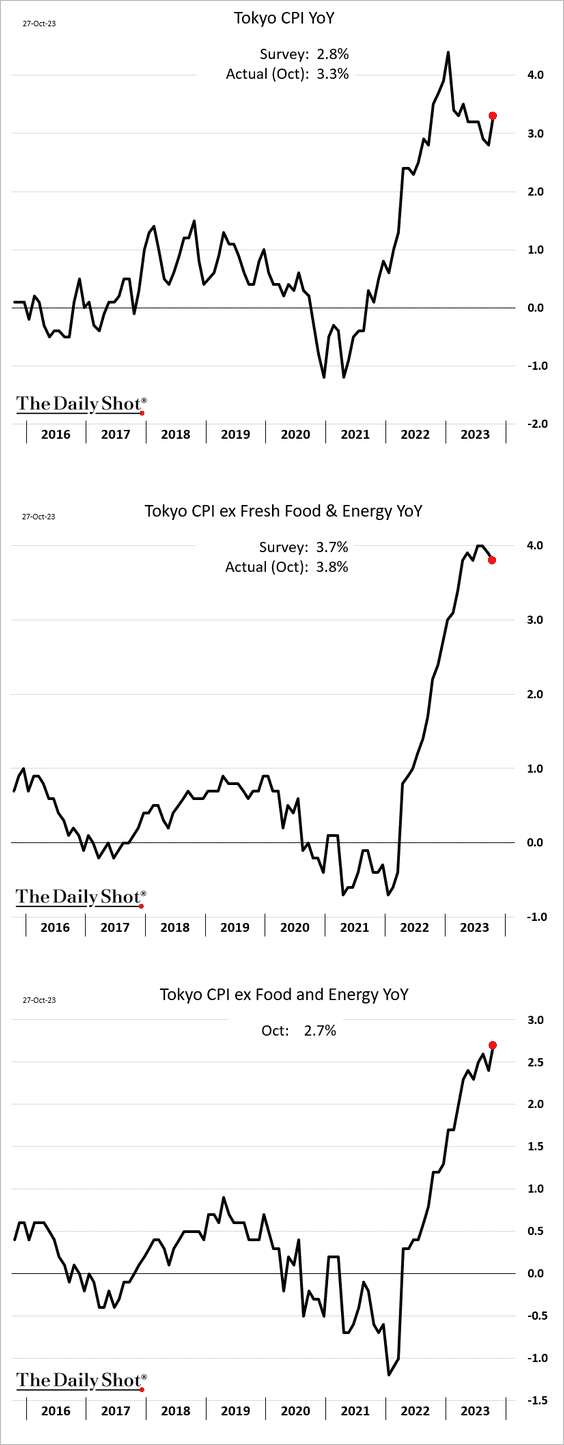
3. This month’s Tokyo inflation surprised to the upside, including the core CPI.
 Source: Reuters Read full article
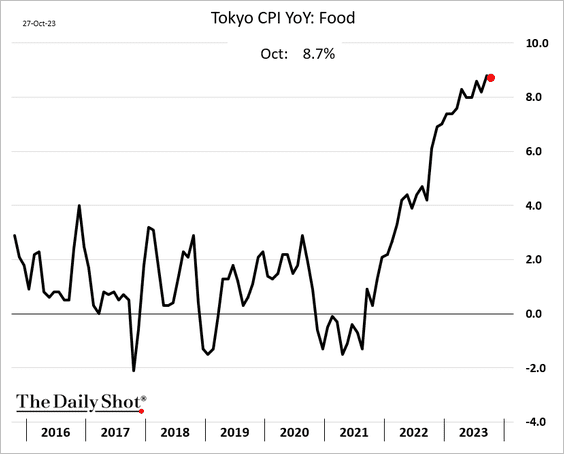
Food inflation remains elevated.
——————–
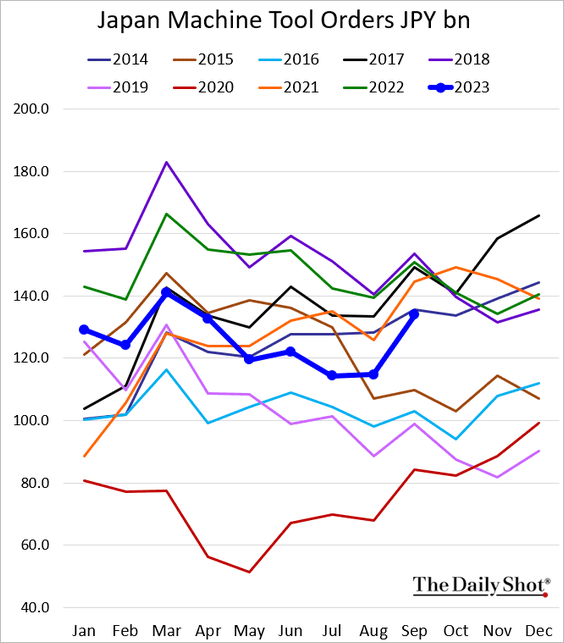
4. Last month’s machine tool orders were robust.
Back to Index
China
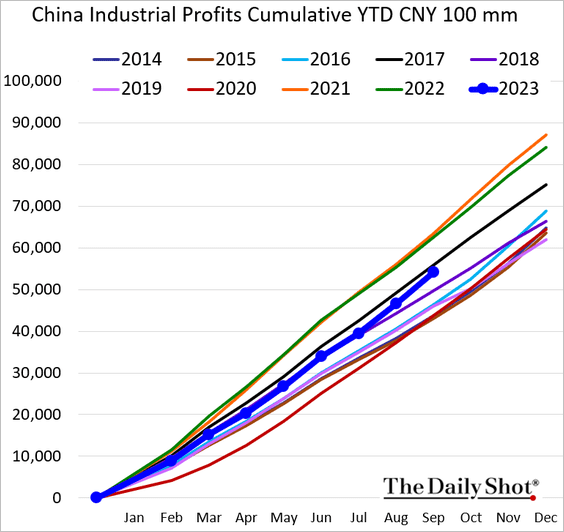
1. Industrial profits are running about 9% below last year’s levels (on a cumulative basis).
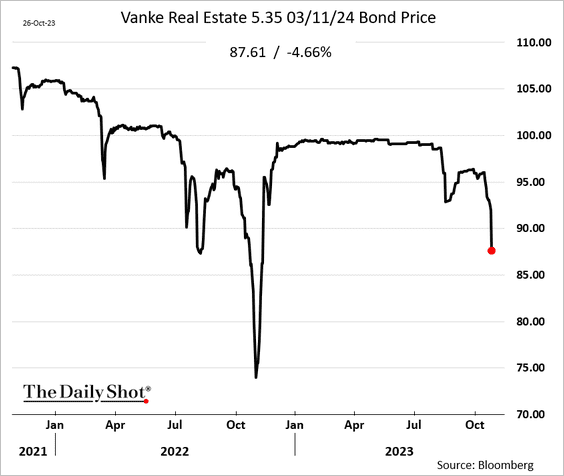
2. Even investment-grade developer debt is struggling.
 Source: @markets Read full article
——————–
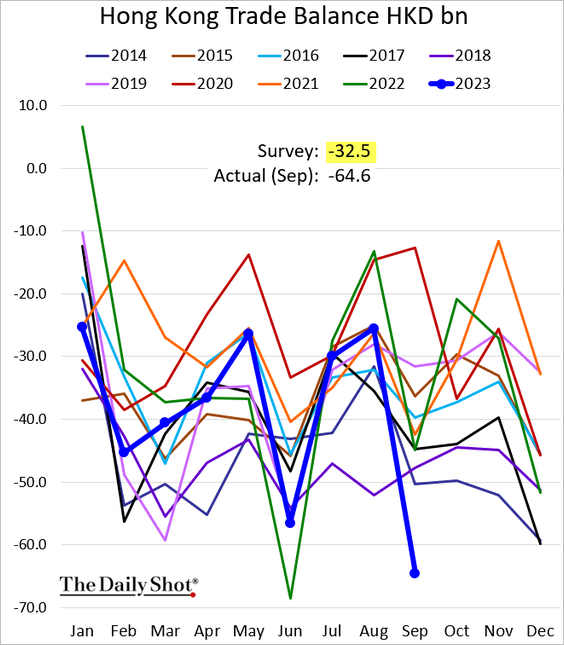
3. Hong Kong’s trade deficit blew out last month.
Back to Index
Emerging Markets
1. Let’s begin with central bank actions.
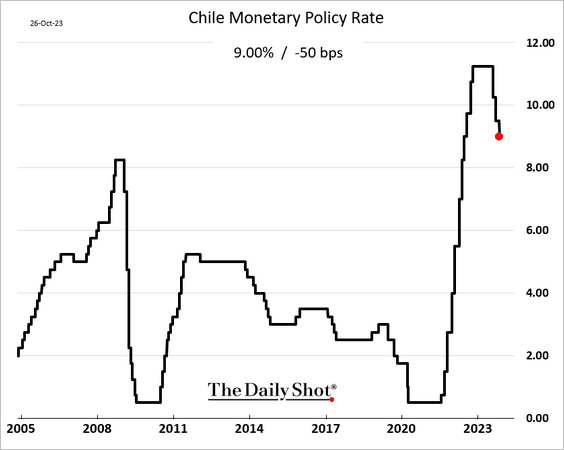
• Chile’s central bank delivered a smaller-than-expected rate cut.
 Source: Reuters Read full article
• The Philippine central bank unexpectedly boosted rates.
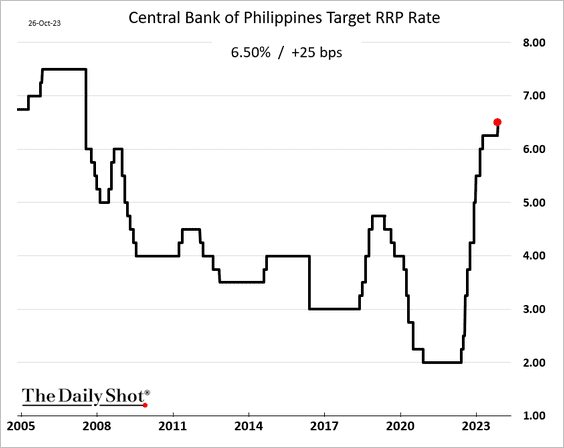
 Source: @WSJ Read full article
• Turkey’s central bank pushed rates up by another 500 bps to fight severe inflation.
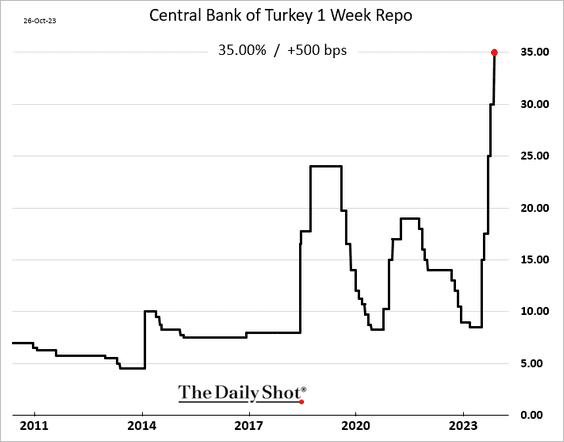
 Source: Reuters Read full article
• Ukraine’s central bank reduced rates by 400 bps.
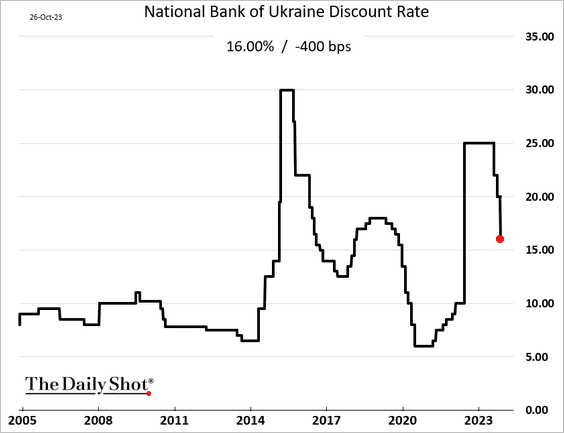
 Source: @economics Read full article
——————–
2. Mexico’s unemployment rate remains very low.
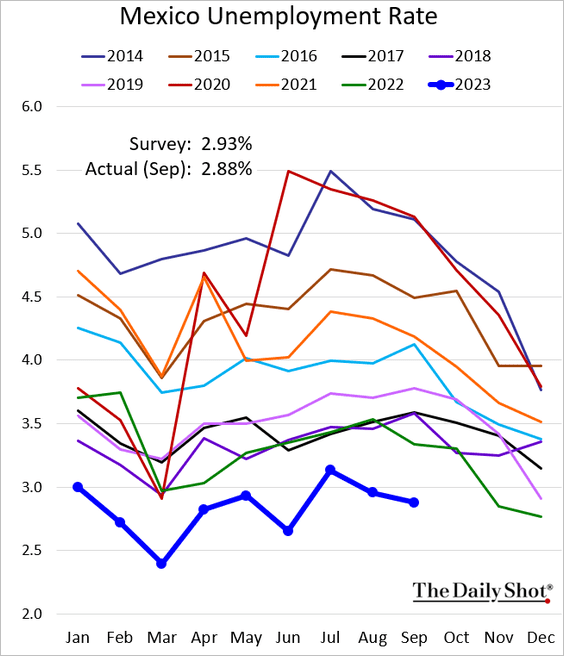
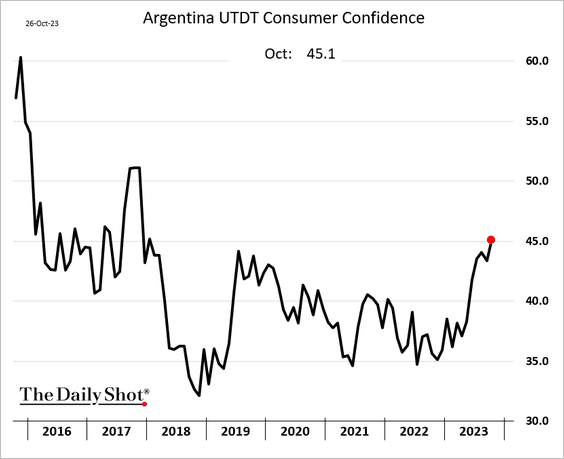
3. Argenitna’s consumer confidence has been rebounding despite inflation running close to 140%.
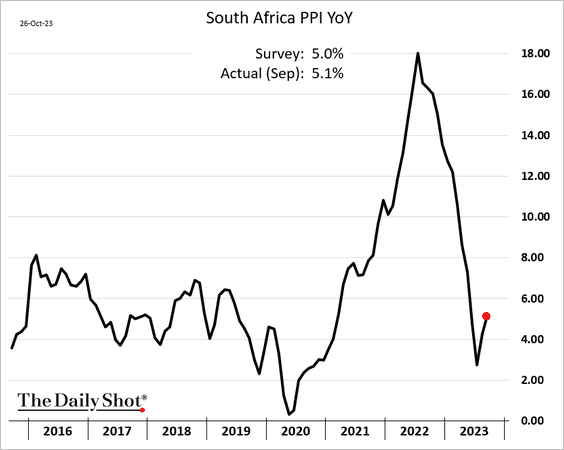
4. South Africa’s PPI strengthened last month.
Back to Index
Cryptocurrency
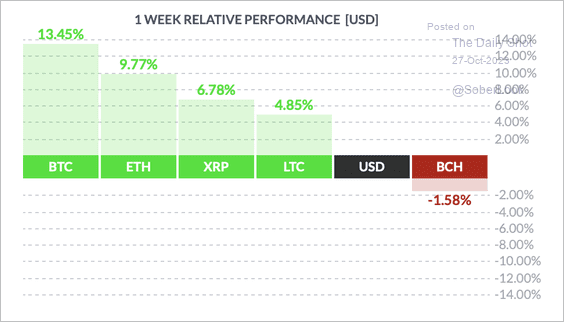
1. It has been a good week for cryptos, with bitcoin outperforming major peers.
 Source: FinViz
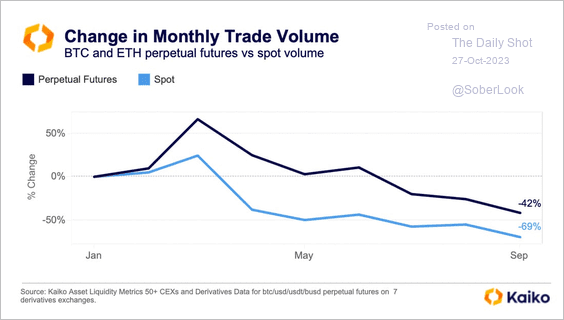
2. Crypto trading volumes have dropped globally across all exchanges this year.
 Source: @KaikoData
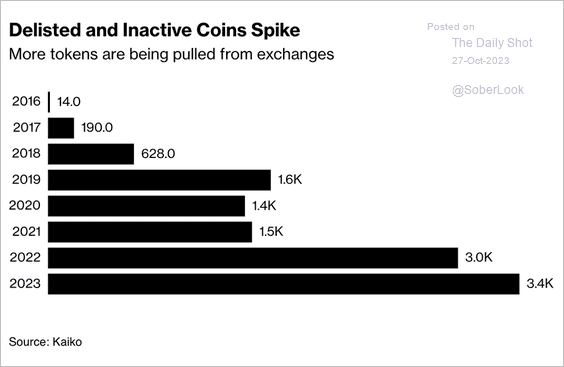
3. Exchange delistings are at their highest level ever.
 Source: @crypto Read full article
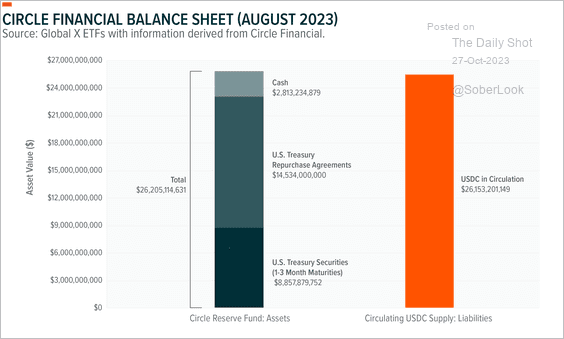
4. Here is a look at Circle’s balance sheet, the issuer of the USDC stablecoin.
 Source: Global X ETFs Read full article
Back to Index
Commodities
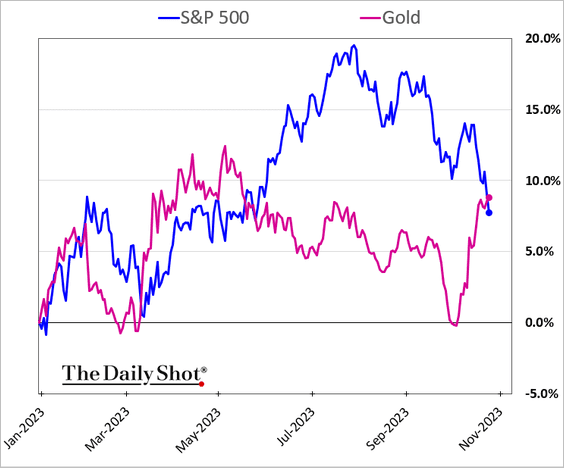
1. On a price basis, gold is now outperforming the S&P 500 this year. If dividends are included, the S&P 500 is still slightly ahead.
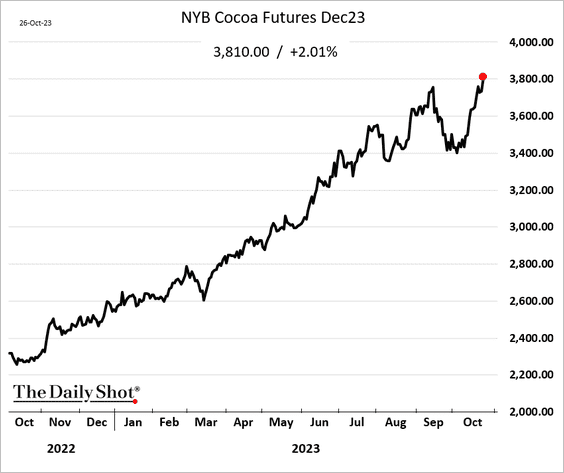
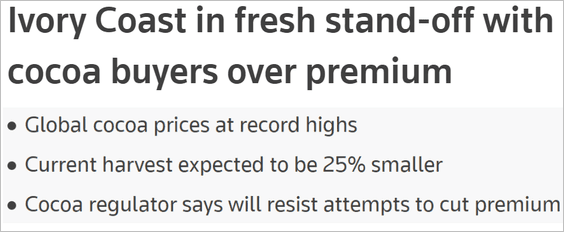
2. Cocoa prices continue to surge.
 Source: Reuters Read full article
Back to Index
Energy
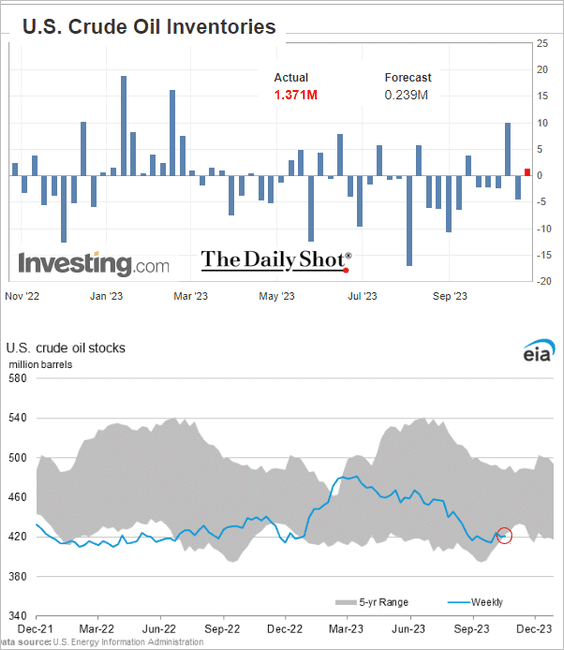
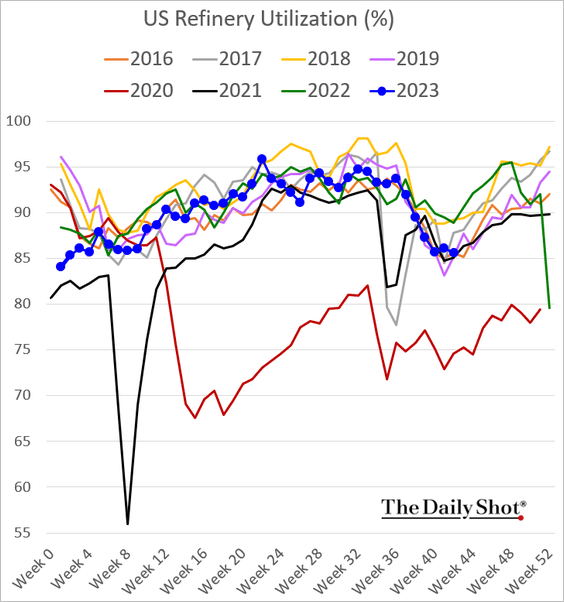
1. US commercial crude oil inventories increased last week but remained near 5-year lows.
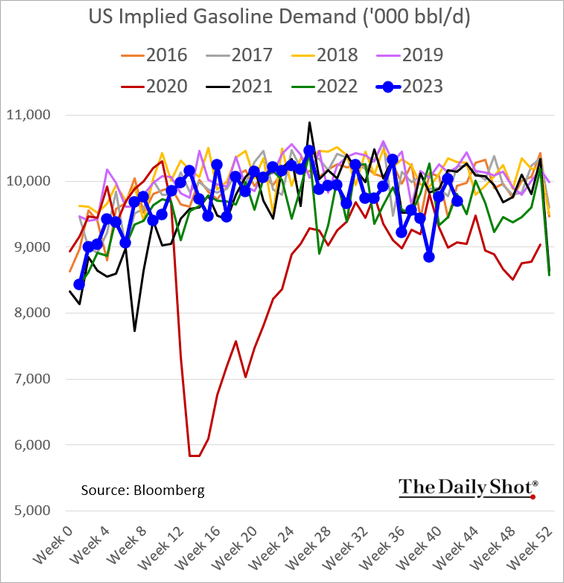
• Gasoline demand dipped below last year’s levels.
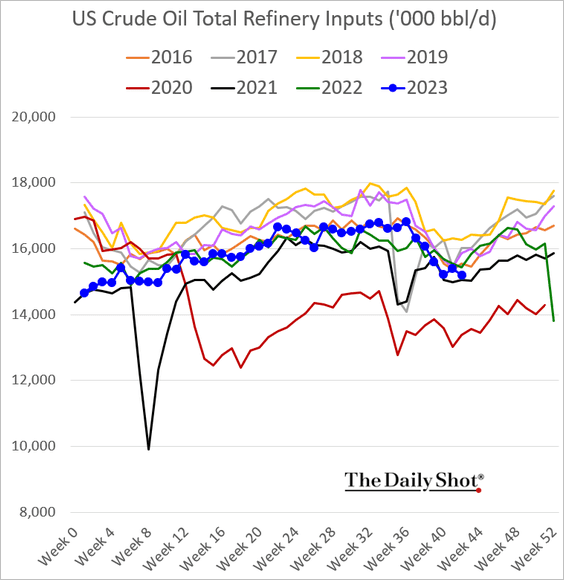
• Refinery runs and utilization are also below last year’s levels.
——————–
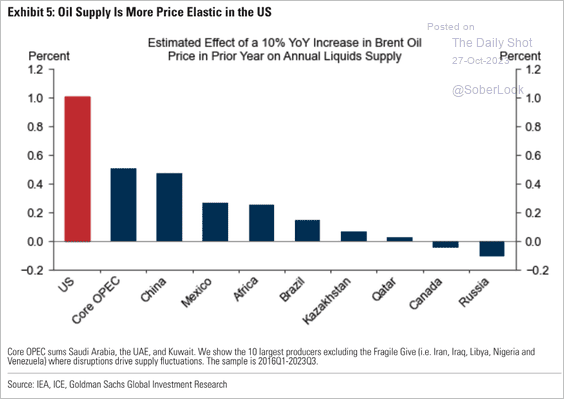
2. US oil production is very sensitive to prices.
 Source: Goldman Sachs; @dailychartbook
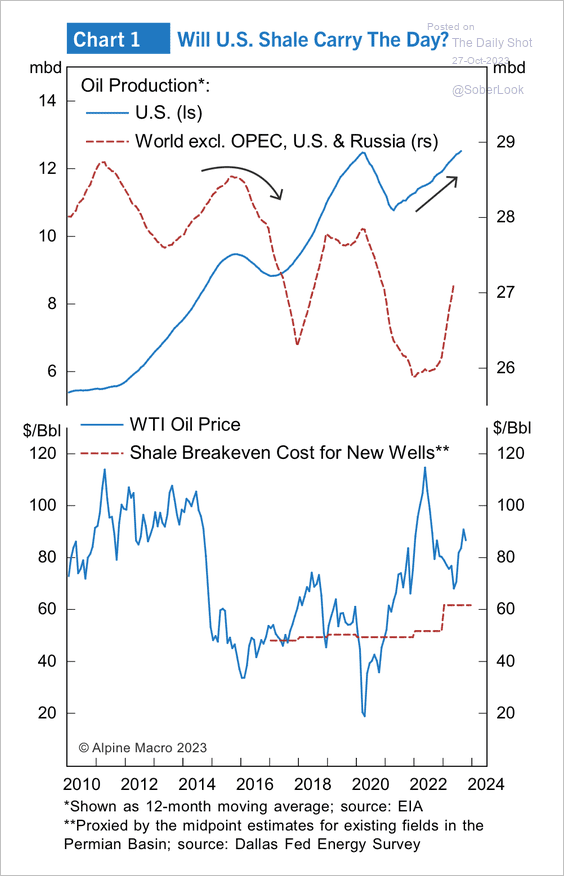
• US production has outpaced the rest of the world as prices remain above breakeven levels.
 Source: Alpine Macro
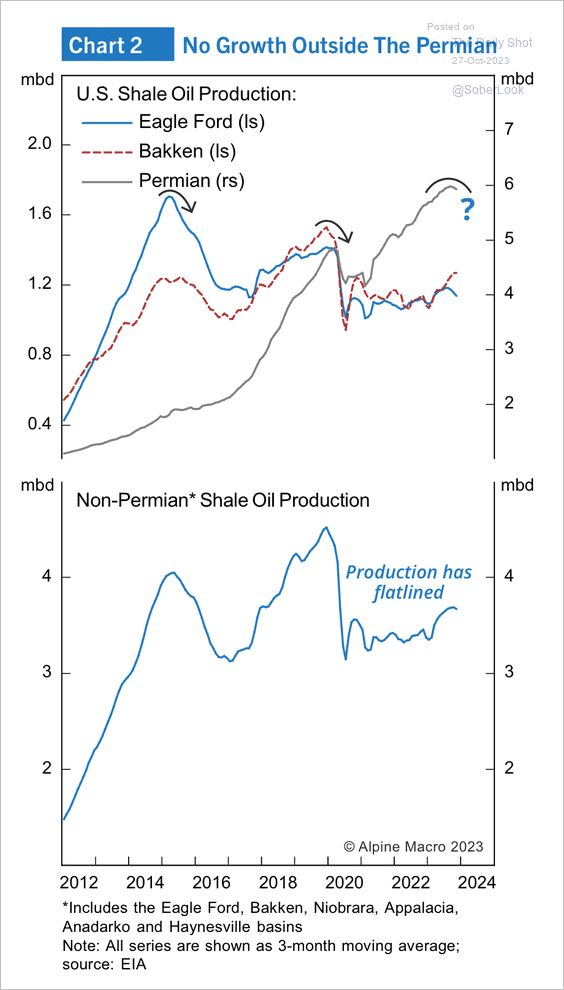
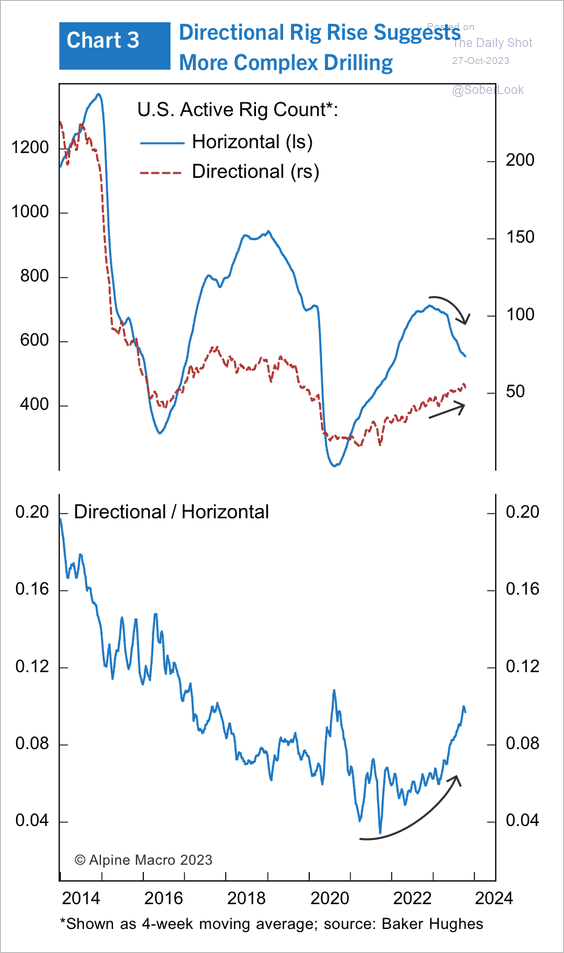
• However, production has mostly flatlined outside of the US Permian basin as drilling becomes more complex. (2 charts)
 Source: Alpine Macro
 Source: Alpine Macro
——————–
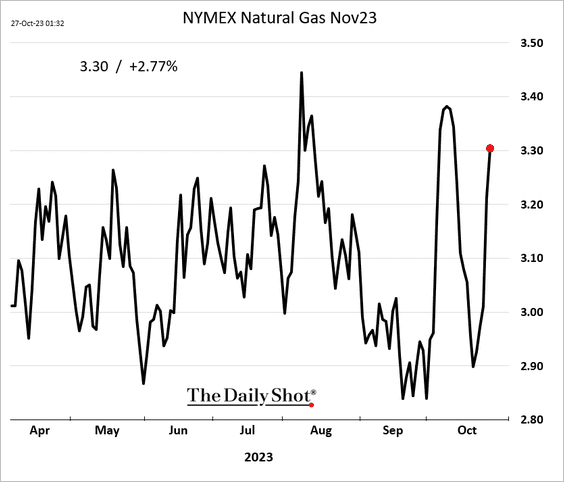
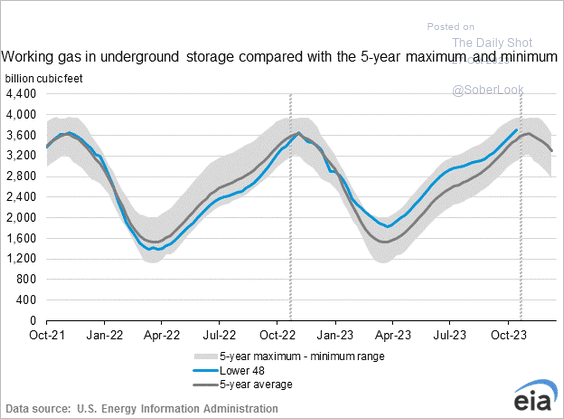
3. US natural gas futures are surging again.
• It will get colder in parts of the US over the next few days.
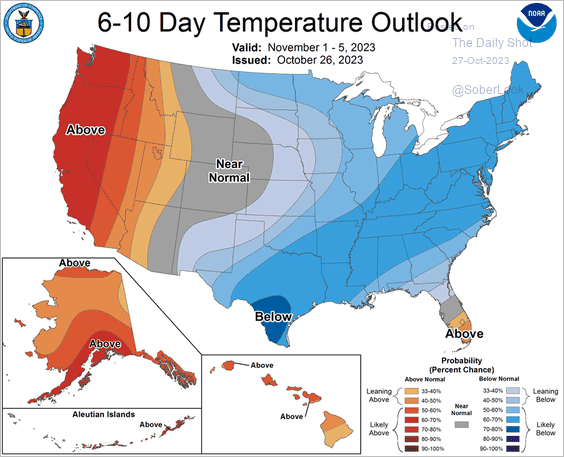 Source: NOAA
• Storage injections were lower than expected last week, …
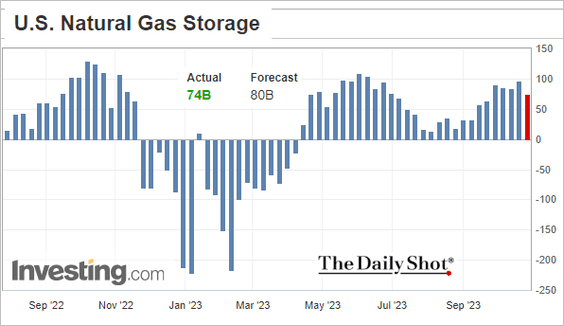
… but are still above the 5-year average.
Back to Index
Equities
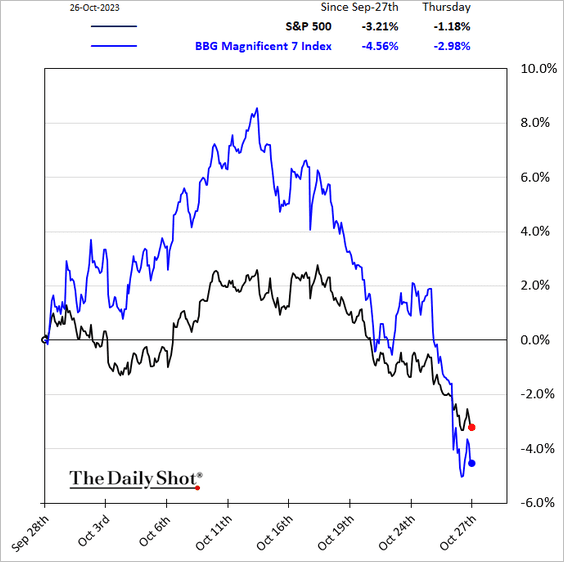
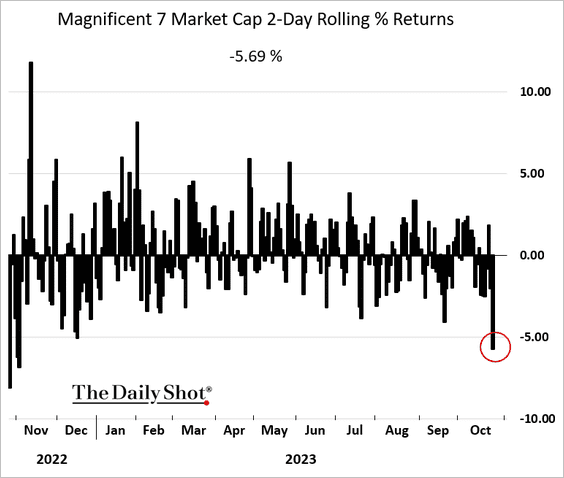
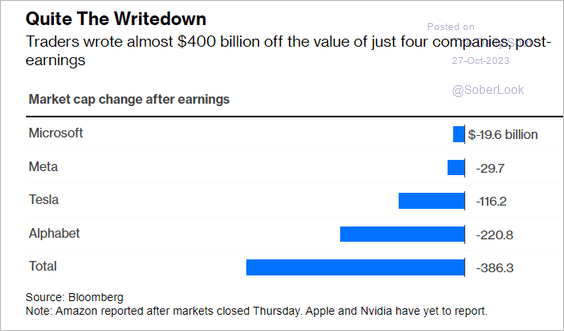
1. It’s been a rough couple of days for the tech megacaps (3 charts).
 Source: @johnauthers, @opinion Read full article
——————–
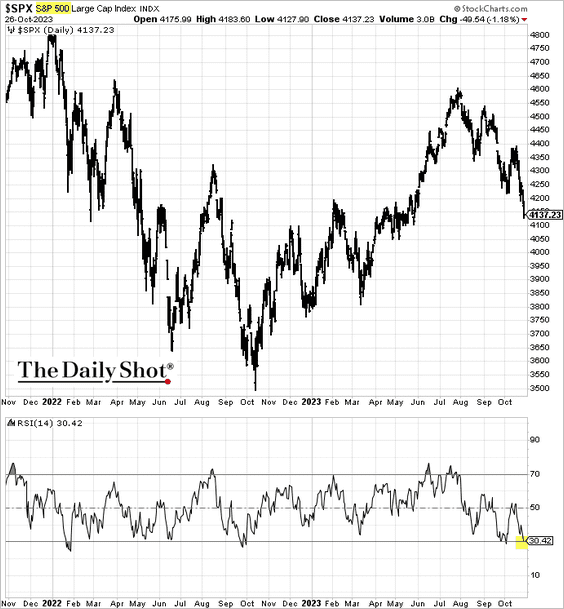
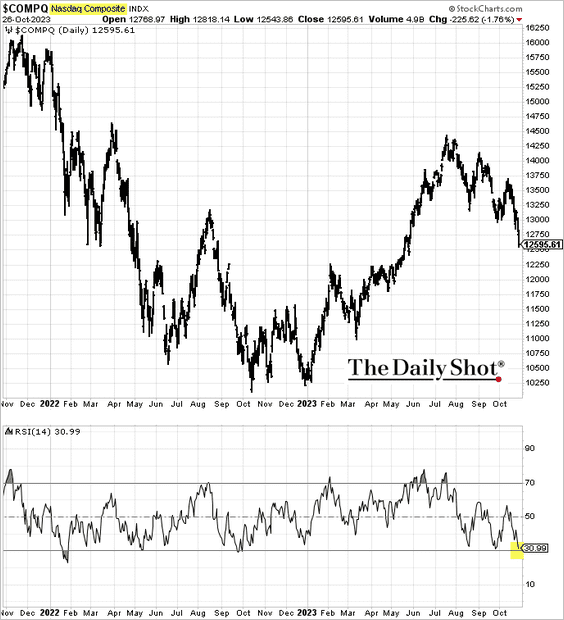
2. US indices are nearing oversold territory.
• S&P 500:
• The Nasdaq Composite:
——————–
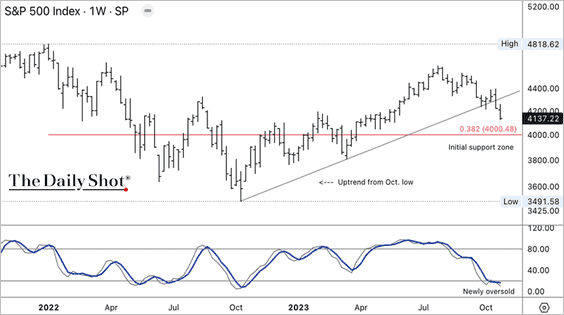
3. The S&P 500 is approaching initial support after dipping below its year-long uptrend.
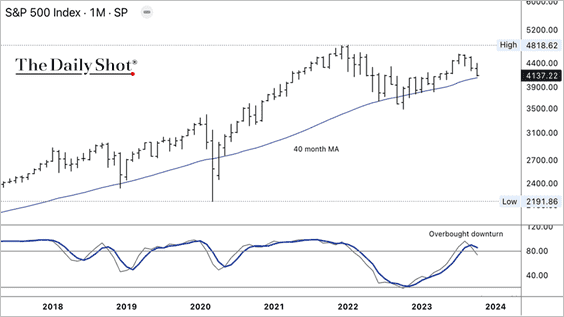
• Longer-term indicators suggest the S&P 500 is overbought, which could delay the path to new highs.
——————–
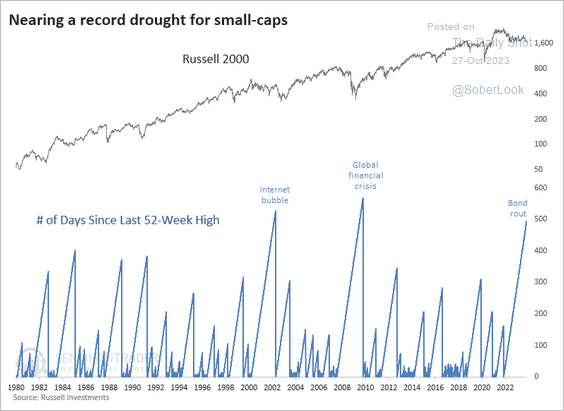
4. US small-caps have spent nearly 500 days below their one-year high – the longest drought since the financial crisis.
 Source: @jasongoepfert
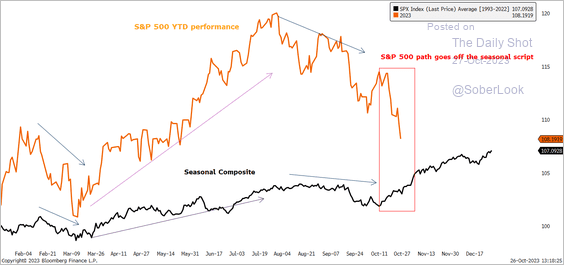
5. The S&P 500 has been diverging from its seasonal pattern.
 Source: Aazan Habib, Paradigm Capital
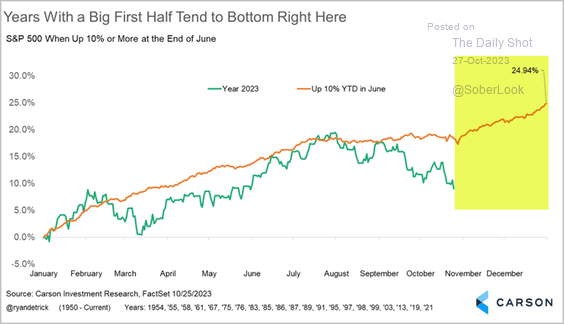
However, the S&P 500 typically stabilizes in November after a strong first-half of the year.
 Source: @RyanDetrick
——————–
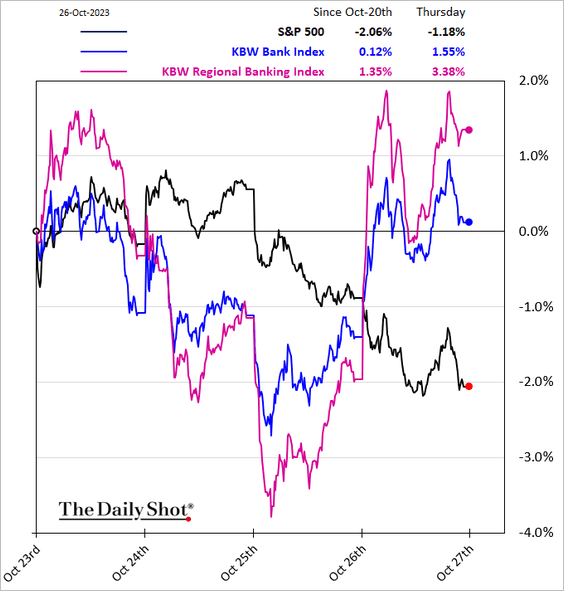
6. Bank shares outperformed on Thursday.
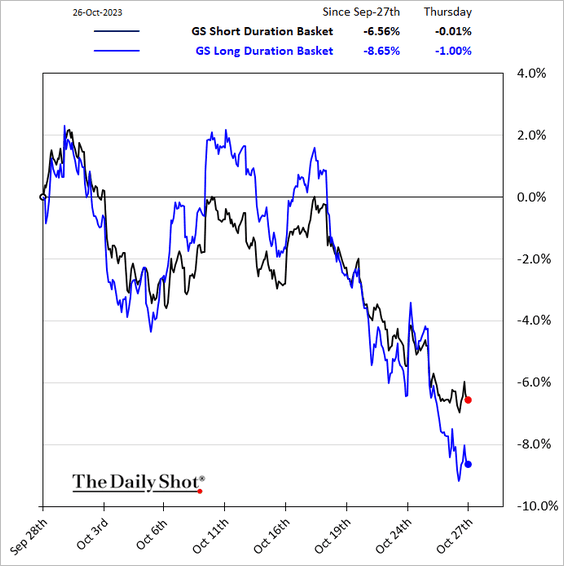
7. Long-duration stocks underperformed this week.
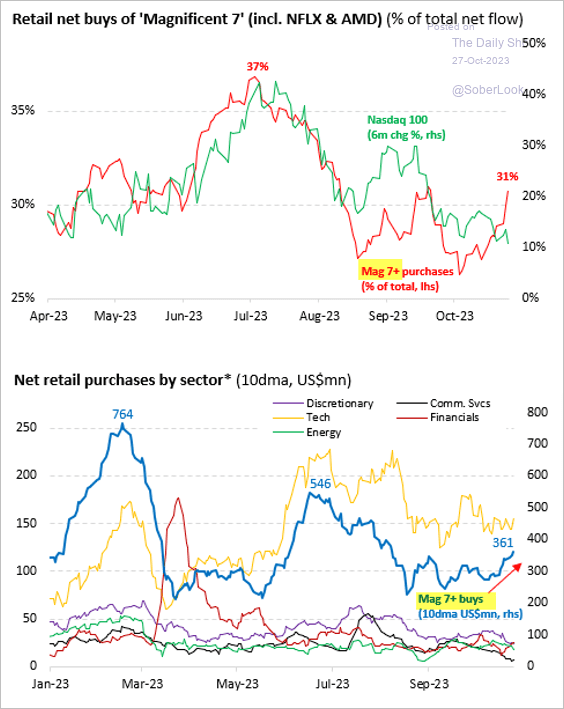
8. Retail investors have been buying tech megacaps as prices fall.
 Source: Vanda Research
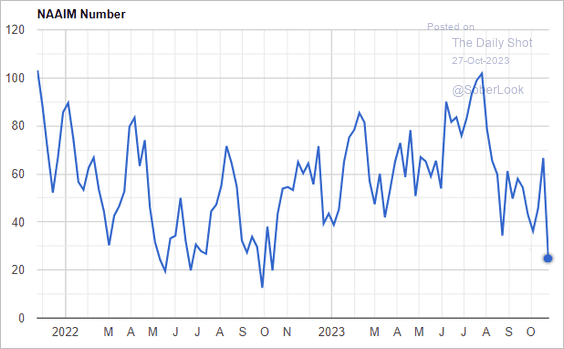
9. Investment managers are very bearish now.
 Source: NAAIM
Back to Index
Rates
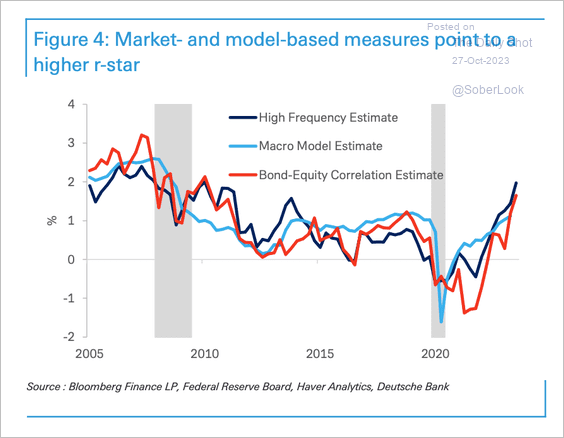
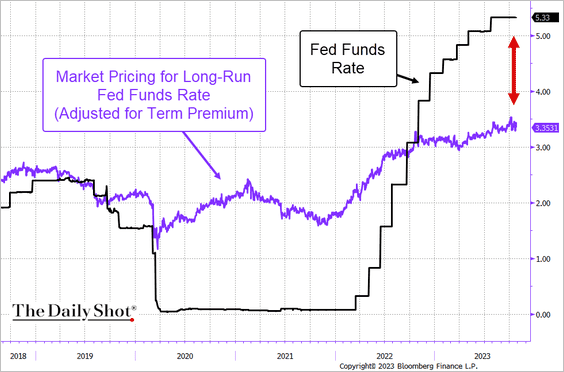
1. Deutsche Bank’s models show a higher neutral rate.
 Source: Deutsche Bank Research
However, the market is still pricing the longer-run (nominal) fed funds rate well below the current level, suggesting that the Fed’s policy is quite restrictive.
 Source: @TheTerminal, Bloomberg Finance L.P.
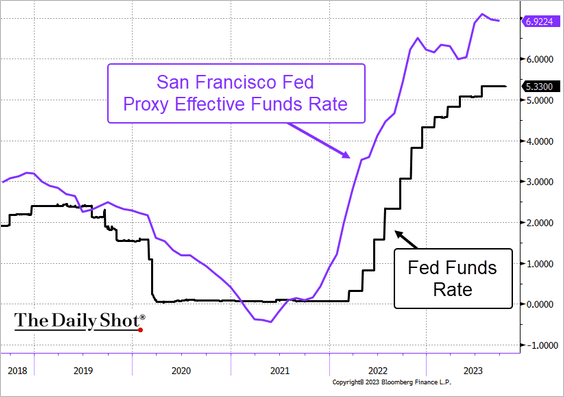
Moreover, given the tight financial conditions, the “effective” policy rate is substantially higher than the actual fed funds rate.
 Source: @TheTerminal, Bloomberg Finance L.P.
——————–
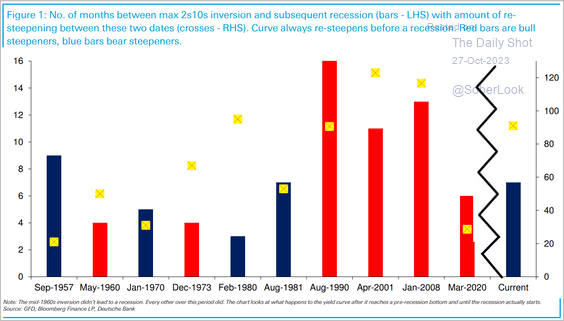
2. The lead time between the Treasury curve inversion and the start of a recession ranges from 3-16 months. However, there is typically a significant re-steepening after max inversion before a recession, particularly in a bear-steepening scenario.
 Source: Deutsche Bank Research
——————–
Food for Thought
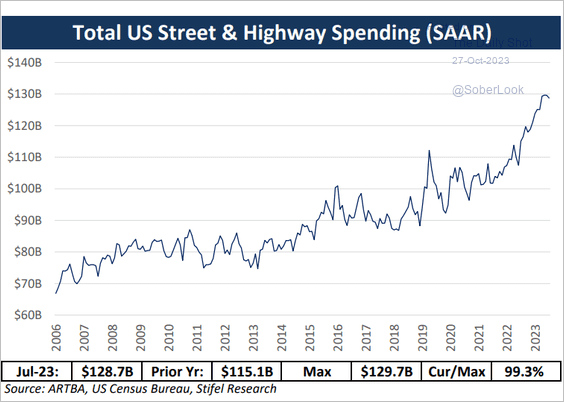
1. US street and highway spending:
 Source: Stifel
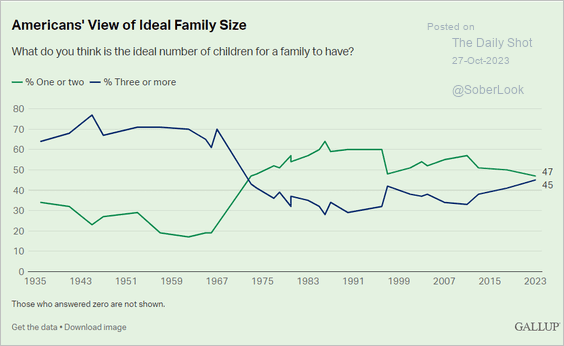
2. What is the ideal family size?
 Source: Gallup Read full article
3. What did successful startup founders study in school?
 Source: @genuine_impact
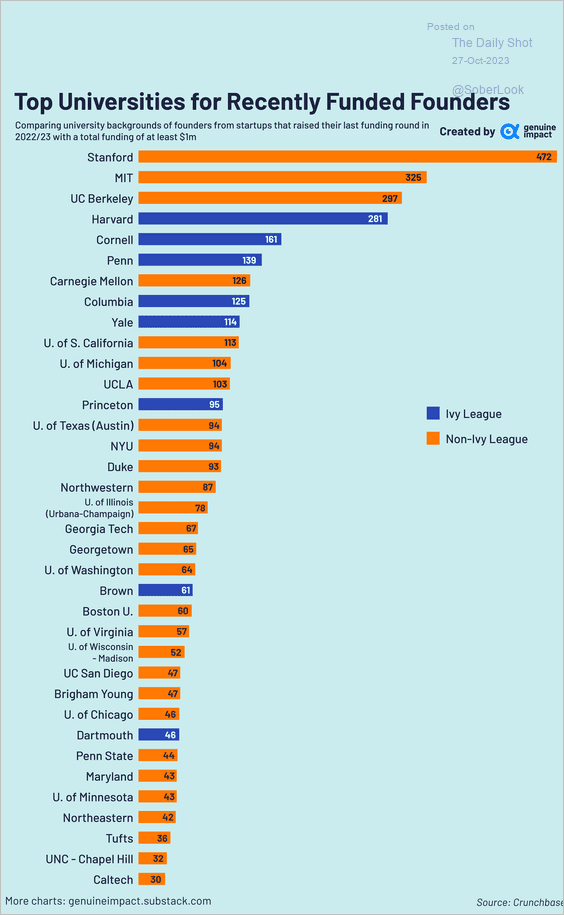
4. Which universities produce the most successful founders?
 Source: @genuine_impact
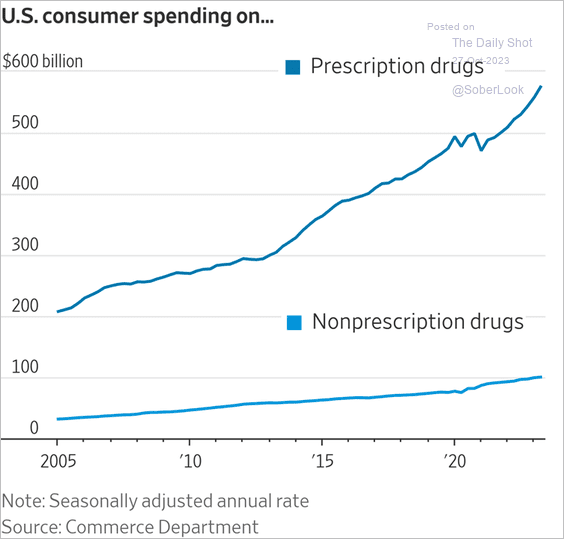
5. Spending on prescription vs. nonprescription drugs:
 Source: @WSJ Read full article
6. Space flight payload costs:
 Source: Visual Capitalist Read full article
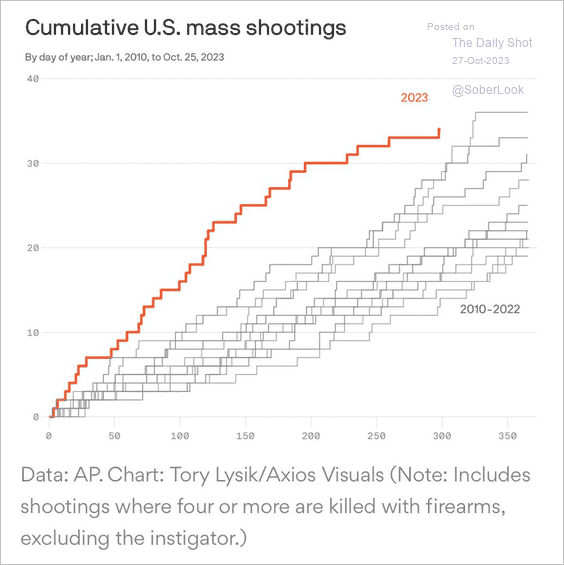
7. The pause in US mass shootings just ended.
 Source: @axios Read full article
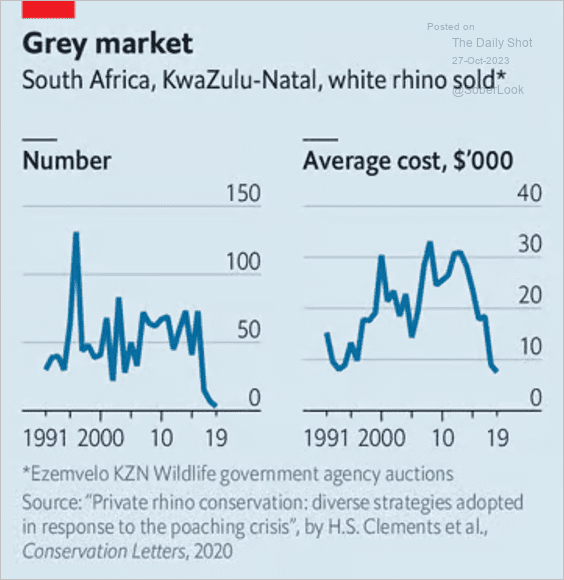
8. Sales/prices for white rhinos:
 Source: The Economist Read full article
——————–
Have a great weekend!
Back to Index
