
The Daily Shot: 21-Nov-23
• The United States
• The Eurozone
• Japan
• Asia-Pacific
• China
• Emerging Markets
• Cryptocurrency
• Commodities
• Energy
• Equities
• Rates
• Global Developments
• Food for Thought
The United States
1. The index of leading economic indicators (LEI) has recorded its 19th consecutive monthly decline.
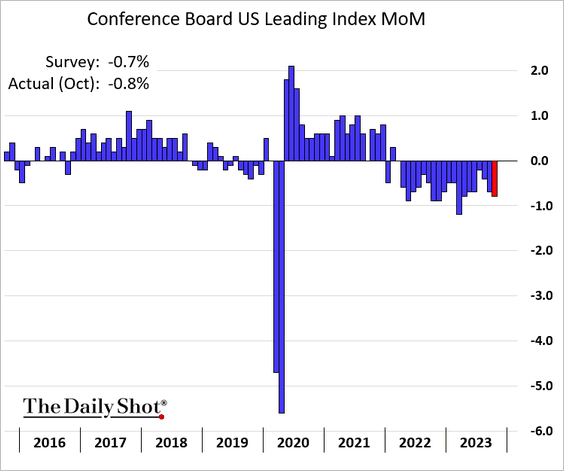

• Here are the contributions to last month’s changes.
 Source: Wells Fargo Securities
• The 6-month rolling changes continue to signal a recession.
 Source: @TheTerminal, Bloomberg Finance L.P.
– The LEI is down 11.7% from the peak. How does the latest decline compare to previous downturns?
 Source: Wells Fargo Securities
——————–
2. While some sentiment measures from surveys show pessimism, hard data indicators, such as consumer spending, have been resilient. (2 charts)
 Source: MBA Research
 Source: MBA Research
• We also see this divergence in the NFIB small business data.
 Source: Oxford Economics
——————–
3. US financial conditions continue to ease, driven by lower Treasury yields, tighter credit spreads, higher equity prices, …

… and a weaker US dollar.
 Source: barchart.com
——————–
4. In 2024, both fiscal and monetary policies are expected to be restrictive.
 Source: Oxford Economics
5. Americans with auto and/or student loans are more likely to be delinquent on their credit card debt.
 Source: Liberty Street Economics Read full article
Back to Index
The Eurozone
1. The euro continues to rally.

2. Sovereign bond spreads have been tightening.
• Italy:

• Greece:

——————–
3. Industrial employment is about to turn sharply lower.
 Source: ING
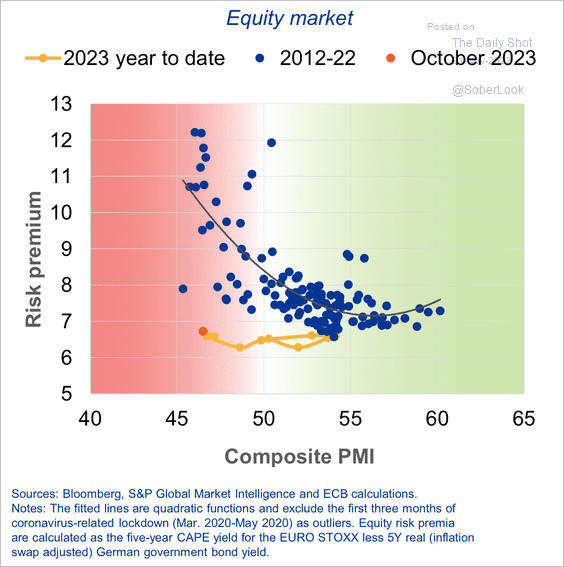
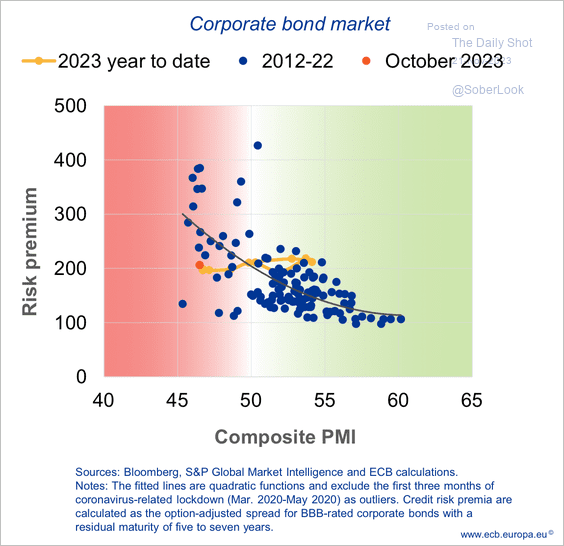
4. Risk premia in equities and corporate bonds remain resilient despite softer economic conditions. (2 charts)
 Source: ECB
 Source: ECB
Back to Index
Japan
1. JGB yields are falling.

2. The yen has been strengthening in recent days, …

… putting pressure on hedge funds to cover their short bets.

——————–
3. The number of Tokyo condominiums for sale hit a multi-year low.

Back to Index
Asia-Pacific
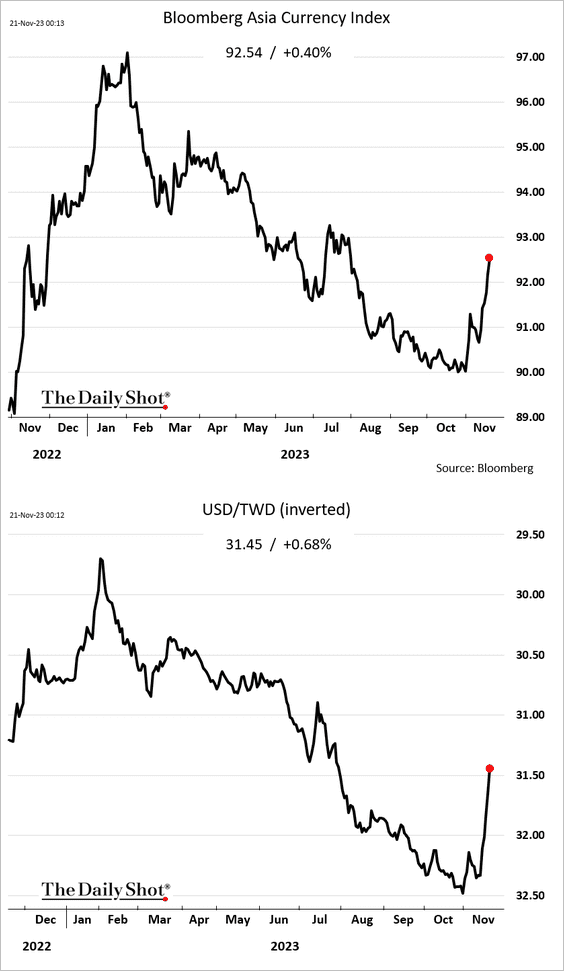
1. Asian currencies are surging (the second panel shows the Taiwan dollar).
2. Taiwan’s export orders are recovering.

 Source: @economics Read full article
——————–
2. South Korea’s exports are holding above last year’s levels.

Here is the breakdown by product and export destination.
 Source: @samkimasia Read full article
——————–
3. Exports are rebounding across Asia.
 Source: @ANZ_Research
4. New Zealand’s trade deficit has narrowed relative to last year.

Back to Index
China
1. The renminbi continues to strengthen.

2. Property developers’ bonds have stabilized as Beijing introduces more support for the sector.

 Source: @business Read full article
• Flows into China’s equity markets also appear to have stabilized.

——————–
3. China’s stocks continue to trade at a discount to global peers.
 Source: Capital Economics
Back to Index
Emerging Markets
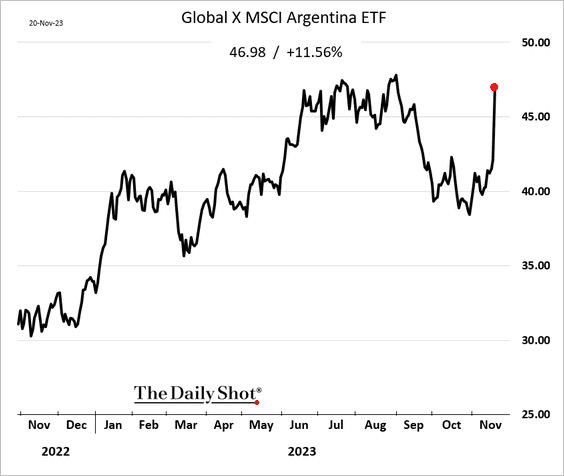
1. The markets cheered the defeat of the Peronist government in Argentina’s presidential election.
 Source: Reuters Read full article
• Equity ETF:
• Bond price:

• The peso surged in the “unofficial” market.
 Source: @TheTerminal, Bloomberg Finance L.P.
——————–
2. Chile’s Q3 GDP growth topped expectations.

 Source: @economics Read full article
——————–
3. This chart shows the key components of India’s imports.
 Source: Capital Economics
Back to Index
Cryptocurrency
1. Bitcoin’s market cap as a share of the total crypto market cap has trended upward since August, signifying BTC’s leadership. However, the uptrend is starting to slow.

• The recent rally pushed the total crypto market cap firmly above $1 trillion.

——————–
2. Crypto funds registered eight straight weeks of inflows as investors continued to exit short-bitcoin products. (2 charts)
 Source: CoinShares Read full article
 Source: CoinShares Read full article
Back to Index
Commodities
1. Copper is rebounding …

… on tighter inventories, …

… but demand concerns persist.
 Source: oilprice.com Read full article
——————–
2. Here is a breakdown of key minerals used in renewable energy systems.
 Source: Global X ETFs Read full article
Back to Index
Energy
1. Brent crude bounced from last week’s lows but is struggling to break above the 200-day moving average.
 Source: @TheTerminal, Bloomberg Finance L.P.
Will OPEC deepen its production cuts?
 Source: Reuters Read full article
——————–
2. Capital Economics expects European natural gas and Asian LNG prices to fall next year as new LNG export capacity enters commercial service.
 Source: Capital Economics
• North America’s LNG export capacity is expected to increase by over 100% through 2027.
 Source: @EIAgov
Back to Index
Equities
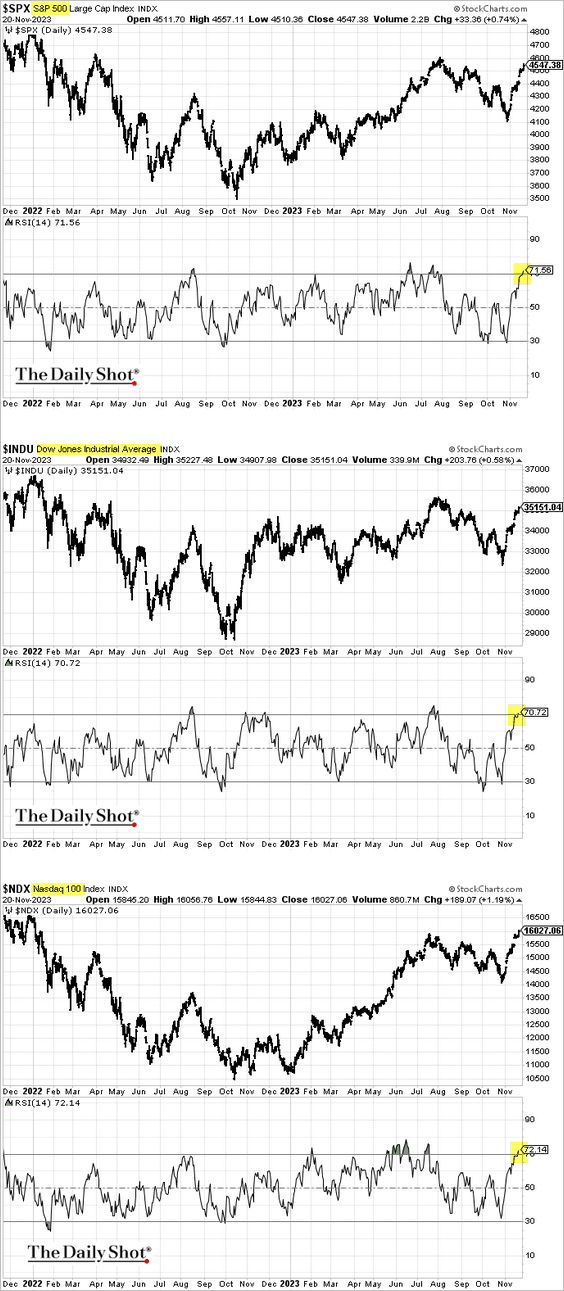
1. Main US stock market indices are now in overbought territory.
2. The S&P 500 equal-weight index continues to widen its underperformance, …

… as tech mega-caps power ahead, driving the S&P 500 to a 20% gain year-to-date (total return).

• Goldman expects the S&P 500 equal-weight index to continue trading at a deep discount to the capitalization-weighted index.
 Source: Goldman Sachs; @MikeZaccardi
——————–
3. This chart shows the attribution of the MSCI USA year-to-date performance.
 Source: Capital Economics
4. The earnings recession persists when the five largest stocks are excluded.
 Source: Simon White, Bloomberg Markets Live Blog
5. The S&P 500 concentration is near record levels.
 Source: Goldman Sachs; @MikeZaccardi
6. The Reddit crowd hasn’t been very active in chasing the most shorted names.

7. Small-cap funds have been seeing strong inflows this month.
 Source: EPFR
• The Russell 2000 realized volatility has been outpacing the implied vol.

——————–
8. Will a shift in Fed policy (or recession) trigger a decline in the stock/bond ratio?
 Source: MRB Partners
9. VIX and US high-yield credit spreads remain below their 200-day moving average, indicating a risk-on environment.
 Source: Aazan Habib, Paradigm Capital
Back to Index
Rates
1. When will the Treasury curve inversion end? Here is a forecast from BofA.
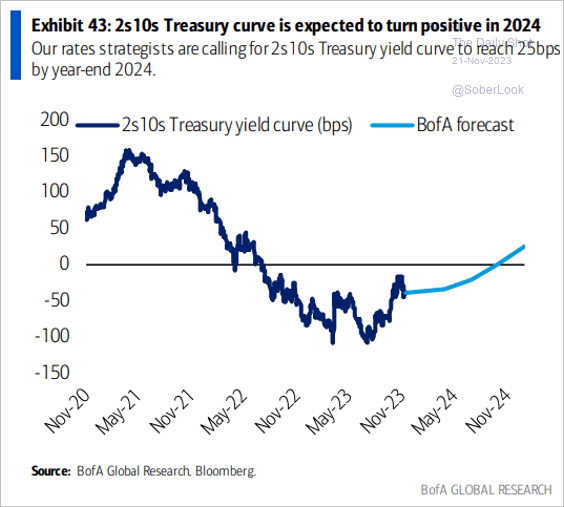 Source: BofA Global Research; @MikeZaccardi
2. Will the 10-year Treasury yield dip below the August peak in the weeks ahead?
 Source: @TheTerminal, Bloomberg Finance L.P.
3. The first full Fed rate cut is priced for June 2024, which would be an 11-month hold period – the longest gap between the last hike and the first cut, according to Deutsche Bank. Generally, the market has been too early to price in cuts.
 Source: Deutsche Bank Research
4. Speculators are extremely net-short Treasuries, which typically precede periods of falling yields …
 Source: Denise Chisholm; Fidelity Investments
… along with rising stock and bond returns.
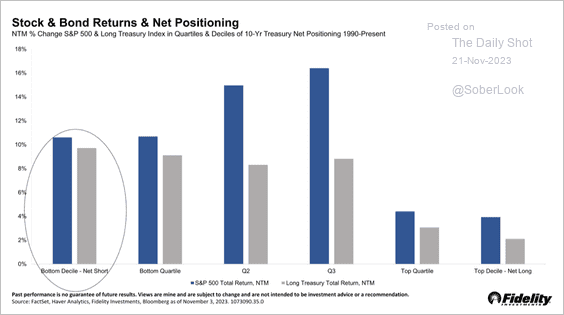 Source: Denise Chisholm; Fidelity Investments
Back to Index
Global Developments
1. According to Oxford Economics, market-implied projections for long-term bond yields are too high.
 Source: Oxford Economics
2. According to Goldman, anticipated declines in inflation will pave the way for rate cuts across advanced economies in late 2024.
 Source: Goldman Sachs
3. Data center investment in new capacity construction and absorption is surging in North America.
 Source: Global X ETFs Read full article
——————–
Food for Thought
1. Growth in non-alcoholic beer sales:
 Source: @WSJ Read full article
2. Thanksgiving dinner inflation:
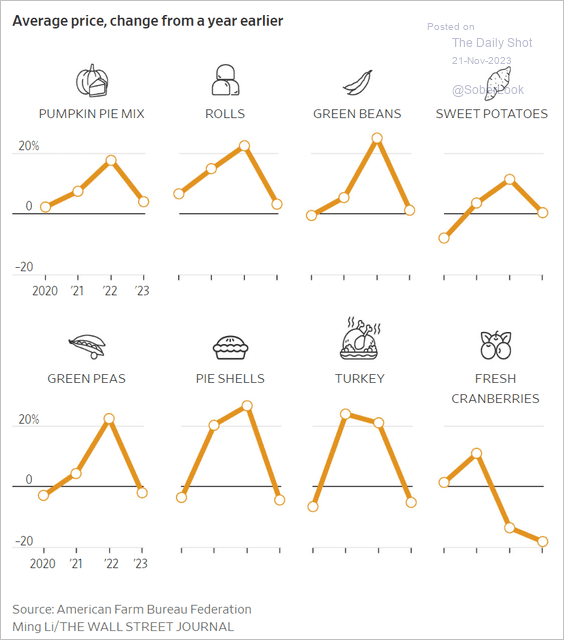 Source: @WSJ Read full article
3. The number of US tellers and bank branches over time:
 Source: Morgan Stanley Research
4. US wage growth by wage quartile:
 Source: @WSJ Read full article
5. Elon Musk’s $44 billion bully pulpit:
 Source: @WSJ Read full article
6. Comfort with AI-generated streaming content:
 Source: Global X ETFs Read full article
7. Home cooks:
 Source: Gallup
——————–
Back to Index