
The Daily Shot: 11-Dec-23
• The United States
• Canada
• The United Kingdom
• Europe
• Japan
• China
• Emerging Markets
• Commodities
• Energy
• Equities
• Credit
• Rates
• Global Developments
• Food for Thought
The United States
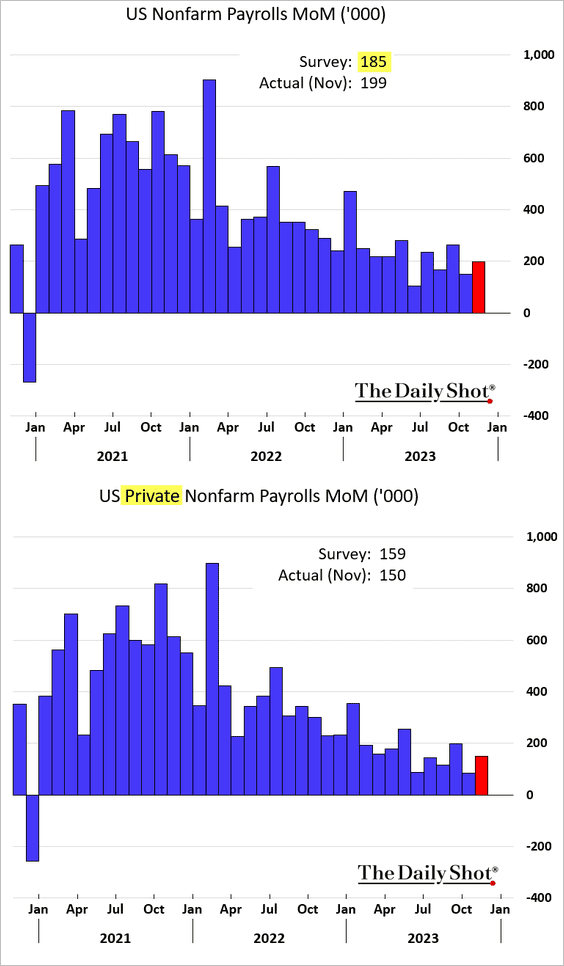
1. Last month’s job gains topped expectations. However, excluding government jobs, the figure was roughly in line with economists’ estimates.
– State and local government job gains remain robust.

– Ending strikes boosted the jobs figure.

– Payrolls in temp help services (which tend to be a leading indicator for the labor market) keep shrinking.

– Healthcare continues to be a key driver of job growth.

– Here are the best-performing sub-sectors in November.
 Source: @WSJ Read full article
– What would job growth look like without healthcare and leisure/hospitality?

And just for completeness, here is the above trend with government jobs removed. It points to a weaker breadth in the labor market.

– The retail sector is shedding jobs.

– Here are the key contributions to the headline payrolls figure.
 Source: @TheTerminal, Bloomberg Finance L.P.
• Wage growth accelerated last month.

• The unemployment rate declined.

• Prime-age labor force participation remains strong.
 Source: Chart and data provided by Macrobond
——————–
2. After the jobs report, the market quickly reduced its expectations for Fed rate cuts next year.

Here is the 2-year Treasury yield.

——————–
3. Consumer sentiment climbed this month, exceeding expectations.

 Source: @TheTerminal, Bloomberg Finance L.P.
• Buying conditions strengthened.

• Consumers increasingly see themselves in a worse financial situation than five years ago.

• Inflation expectations eased, …

… as gasoline prices fell further.

Back to Index
Canada
1. This chart shows hours lost due to strikes.
 Source: Scotiabank Economics
2. Households’ debt service ratio surged recently due to higher interest rates.
 Source: PGM Global
Back to Index
The United Kingdom
1. Inflation expectations are moderating.

The UK CPI is now less extreme relative to DM peers.
 Source: @financialtimes Read full article
——————–
2. Construction activity continues to shrink.

3. Here is a look at immigration trends in the UK (2 charts).
 Source: @financialtimes Read full article
 Source: @financialtimes Read full article
Back to Index
Europe
1. Dutch factory output was 11% below the 2022 level in October.

2. Sweden’s household consumption edged higher in October.

• But business output declined.

– Services output is now well below last year’s levels.

——————–
3. European blue-chip stocks are hitting record highs.

4. Here is a look at firearm fatality rates in the EU.
 Source: @financialtimes Read full article
Back to Index
Japan
1. The yen reversed last week’s gains after USD/JPY hit support at the 200-day moving average.

2. The Economy Watchers expectations index unexpectedly improved last month.

Back to Index
China
1. The CPI moved deeper into deflation territory (well below forecasts).

• Food remains a drag on inflation.

• The core CPI held steady last month.

• Services CPI declined.

——————–
2. The PPI also surprised to the downside.

3. Demand for China’s government debt has been robust.
 Source: @markets Read full article
4. The savings rate has been moderating.
 Source: MacroPolo Read full article
Back to Index
Emerging Markets
1. Speculative accounts have been boosting their bets on the Brazilian real.

2. This chart shows the contributions to Turkey’s GDP growth.
 Source: ING
3. Next, we have some performance data from last week.
• Currencies:

• Bond yields:

• Equity ETFs:

Back to Index
Commodities
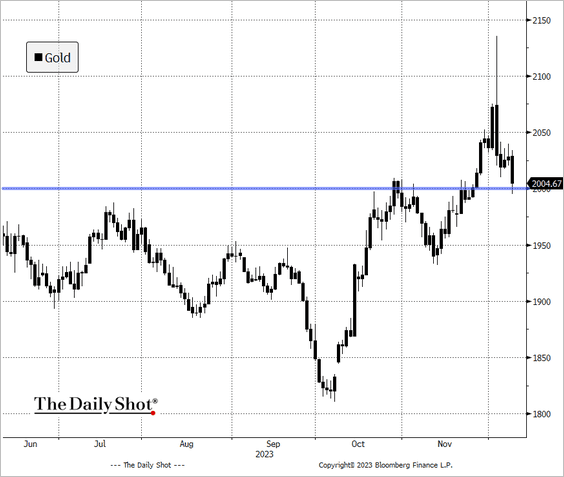
1. Gold is testing support near $2000/oz.
 Source: @TheTerminal, Bloomberg Finance L.P.
2. Here is a look at last week’s performance across key commodity markets.

Back to Index
Energy
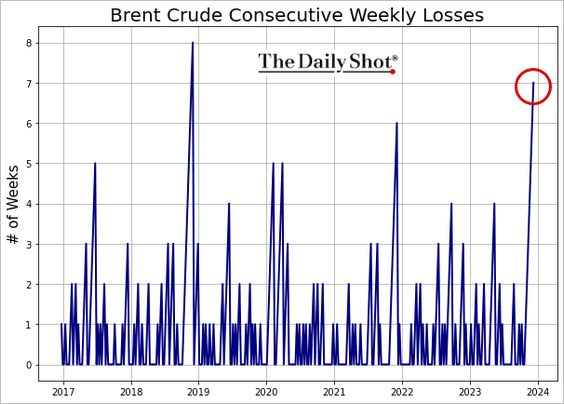
1. Crude oil has declined for seven consecutive weeks.
2. The US rig count appears to be stable, …

… and so is fracking activity.

——————–
3. It will take a while to rebuild the US Strategic Petroleum Reserve. Given record-high US production, does it need to be rebuilt fully?
 Source: Reuters Read full article

——————–
4. US natural gas is crashing, …

… amid warmer-than-usual weather.
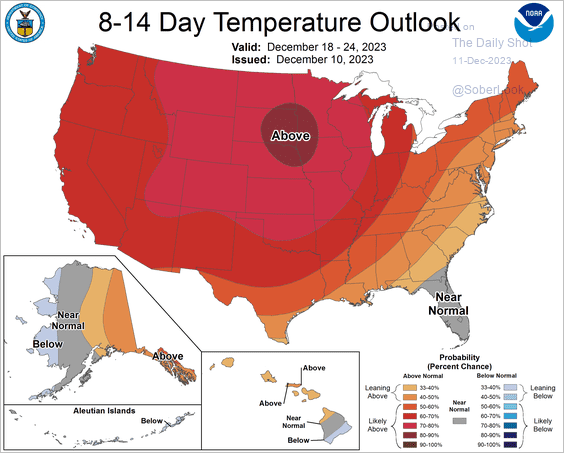 Source: NOAA
5. European natural gas is also tumbling, driven by ample supplies in storage.

Back to Index
Equities
1. The S&P 500 hit its highest level since March 2022.

• The index has been up for six consecutive weeks.

• More stocks are making short-term highs, which reflects an improvement in breadth.
 Source: SentimenTrader
• Trading on technicals hasn’t worked well this year.
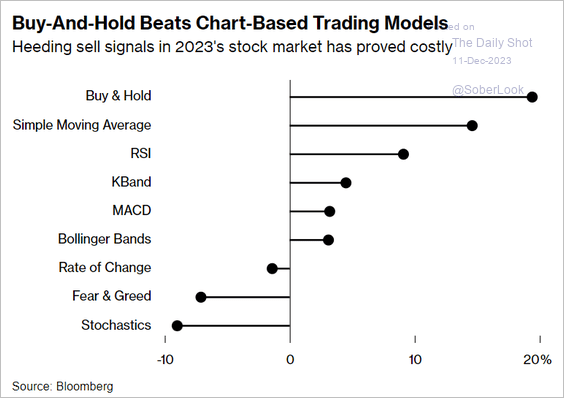 Source: @markets Read full article
——————–
2. Broader US market performance would require strength in cyclical stocks relative to tech.
 Source: Truist Advisory Services
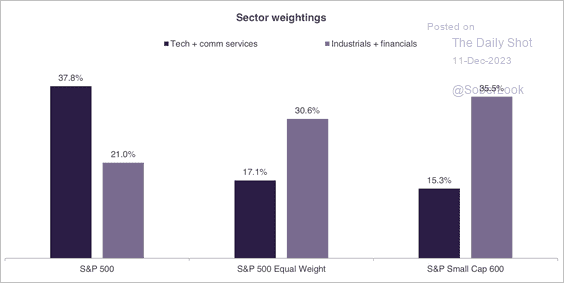
3. S&P 500 tech stocks appear stretched relative to financials.

4. Treasury curve bull steepening tends to boost growth stocks.
 Source: Goldman Sachs; @WallStJesus
5. CTAs are increasingly bullish.
 Source: Goldman Sachs
6. Discretionary investor equity positioning appears stretched relative to rates vol.
 Source: Deutsche Bank Research
7. Small caps have been outperforming.

8. VIX hit a COVID-era low, …

… diverging sharply from rates markets’ implied volatility (MOVE).

——————–
9. Hedge funds have been reducing exposure to single stocks.
 Source: Goldman Sachs; @dailychartbook
10. Next, we have some performance data from last week.
• Sectors:

• Equity factors:

• Macro basket pairs’ relative performance:

• Thematic ETFs:

• Largest US tech firms:

Back to Index
Credit
1. The US syndicated loan market saw strong returns in November, putting the segment on track for its best performance since the rebound from the financial crisis.
 Source: PitchBook
• The volume of US leveraged loan defaults remains elevated.
 Source: PitchBook
——————–
2. Here is a look at last week’s performance across credit asset classes.

Back to Index
Rates
1. Speculative bets against the 2-year Treasury futures continue to hit record levels.

2. The current 2s10s Treasury yield curve inversion has been the second longest stretch on record. According to Deutsche Bank, the 2s10s inversion has signaled a US recession within 19 months.
 Source: Deutsche Bank Research
3. A robust supply of T-bills boosted yields, prompting money market funds to shift from the Fed’s RRP facility to bills.
 Source: Goldman Sachs; @WallStJesus
 Source: @WSJ Read full article
Back to Index
Global Developments
1. G7 government bond yields are declining back toward fair value, although the move appears to be temporary, according to MRB Partners.
 Source: MRB Partners
2. Markets have been pricing in a greater chance of policy easing next year for major central banks.
 Source: Convera
3. Here is a look at FX reserves by currency.
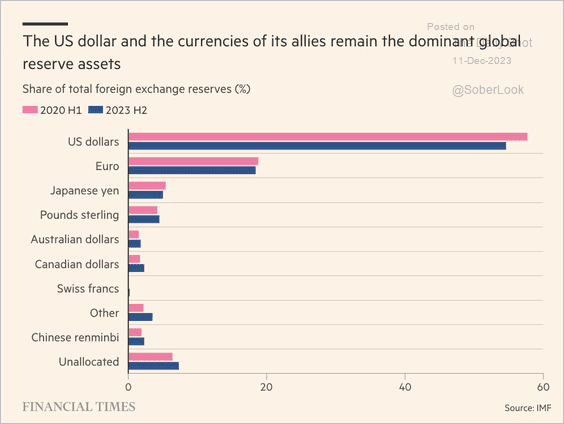 Source: @financialtimes Read full article
4. Finally, we have last week’s performance data across advanced economies.
• Currency indices:

• Bond yields:

• Equities:

——————–
Food for Thought
1. NYC subway ridership:
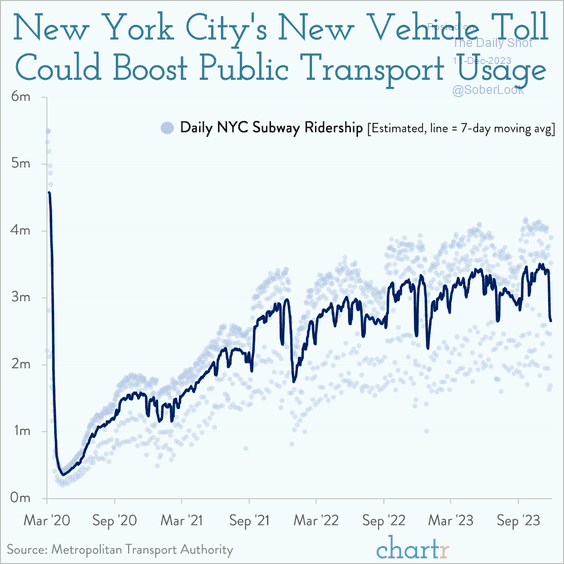 Source: @chartrdaily Read full article
2. Components of the US CPI index:
 Source: Statista
3. STEM teacher experience by US region:
 Source: National Science Board Read full article
4. US medical school applications and acceptances:
 Source: The Economist Read full article
5. Global land and sea surface temperature:
 Source: Climate Reanalyzer Read full article
6. Support for stricter gun laws:
 Source: Gallup Read full article
7. Laughing out loud:
 Source: YouGov
——————–
Back to Index