
The Daily Shot: 08-Jan-24
• The United States
• Canada
• The United Kingdom
• The Eurozone
• Japan
• China
• Emerging Markets
• Commodities
• Energy
• Equities
• Credit
• Global Developments
• Food for Thought
The United States
1. Last month’s job growth surprised to the upside. This report deviated from the Fed’s anticipated trend of a loosening labor market.
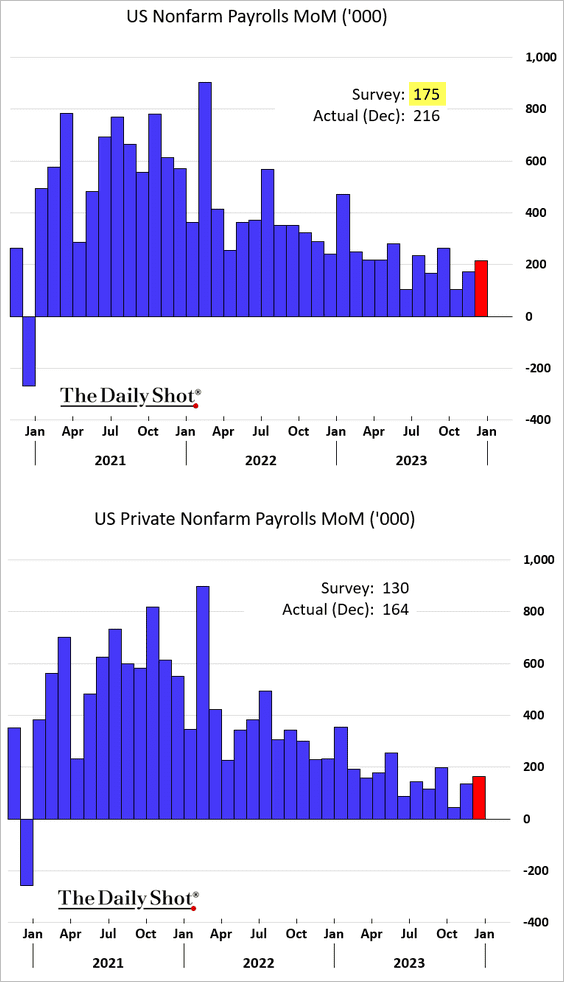
• Here is the overall US employment level.
 Source: @WSJ Read full article
• Once again, healthcare, local government, and leisure & hospitality were the key contributors to job gains (4 charts).

 Source: ING


Many of the government job gains were due to hiring/re-hiring public school teachers, whose numbers are now approaching pre-COVID levels.

• Employment services and temp help services, which tend to be leading indicators for the overall labor market, showed another decline.

– Temp help services have been down for 11 months in a row, …

… mostly due to the unwind of COVID-related temp hiring.
 Source: Simon White, Bloomberg Markets Live Blog
• The unemployment rate did not increase as expected, …

… while labor force participation declined. This points to persistent tightness in the labor market, suggesting that there is no urgency for the Fed to cut rates.

– The unemployment rate has been below 4% for 23 months in a row.

– Here is the employment-to-population ratio.

• The greatest concern for the Fed in the December report was accelerating wage growth.

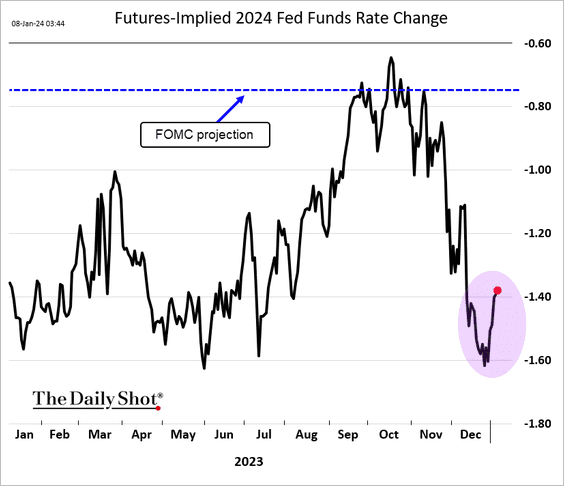
• Market expectations for the 2024 rate cuts eased further but remain much deeper than the FOMC’s forecast.
We will have more data on the December payrolls report shortly.
——————–
2. The ISM Services PMI showed a sharp deceleration in growth.


The biggest surprise was a significant downturn in services sector employment, a trend that was absent from the jobs report.

 Source: Pantheon Macroeconomics
——————–
3. Here is a look at consumer credit rates. The sharp increases will take time to work their way through the economy.
 Source: Truist Advisory Services
Back to Index
Canada
1. Canada’s job growth stalled last month.

• The unemployment rate did not tick higher as expected.

• Wage growth accelerated.

 Source: Reuters Read full article
• Labor force participation declined.

——————–
2. The Ivey PMI, which includes public sector organizations, continues to show strong growth, contradicting S&P Global’s PMI results.

 Source: Reuters Read full article
Back to Index
The United Kingdom
1. The market scaled back its BoE rate cut projections over the past week.
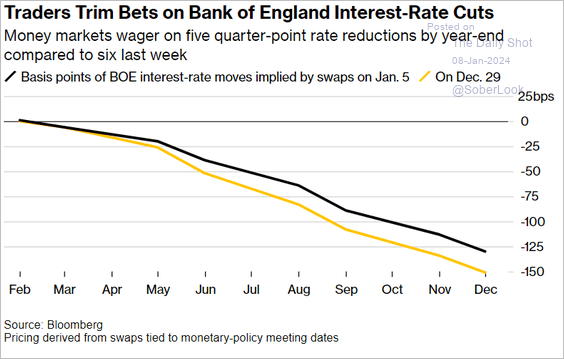 Source: @economics Read full article

——————–
2. New car registrations were 10% above 2022 levels last month.

3. The UK construction sector recession persisted last month.

 Source: Pantheon Macroeconomics
——————–
4. Home prices have been rising in recent months.
 Source: S&P Global PMI
Back to Index
The Eurozone
1. The headline inflation edged higher last month, but it shouldn’t impact monetary policy.

Here is a quote from Capital Economics.
December’s jump in headline inflation in the euro-zone was widely anticipated and entirely due to a base-effects-driven increase in energy inflation, so it won’t alter ECB policymakers’ views on the outlook for monetary policy.
 Source: Capital Economics
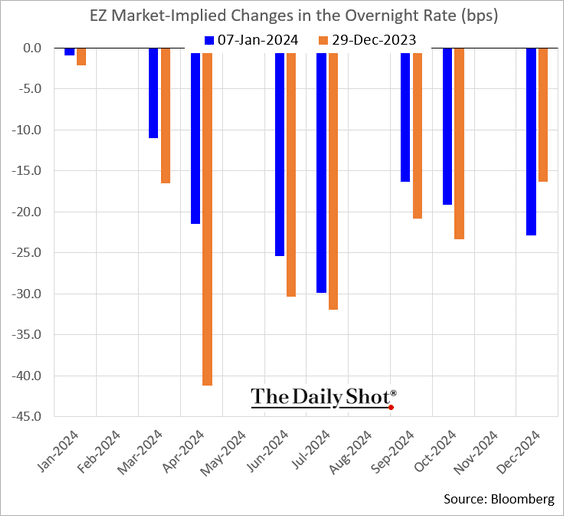
2. The market has been scaling back its rate-cut expectations.

——————–
3. Germany’s retail sales tumbled in November.

Back to Index
Japan
1. The yen took a hit last week.

2. The BoJ owns almost 60% of the JGB market.
 Source: Torsten Slok, Apollo
Back to Index
China
1. Despite Beijing’s efforts, …
 Source: Reuters Read full article
… stocks remain under pressure, with the CSI 300 Index at its lowest since 2019.
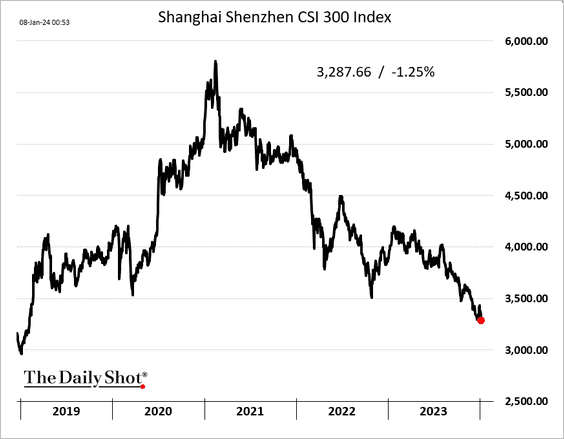
Shares are also down in Hong Kong.

——————–
2. Bond yields continue to sink.

3. FX reserves surprised to the upside.

Back to Index
Emerging Markets
1. Let’s begin with Brazil.
• Industrial production jumped in November, …

… boosted by mining.

– Factory output has been drifting lower.

• The trade surplus climbed in December, topping expectations.
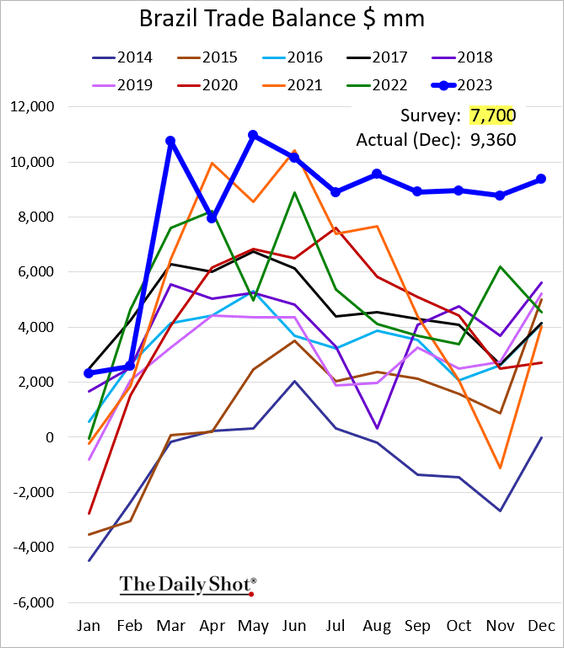

Below are the yearly figures.
 Source: The Brazilian Report Read full article
• The debt-to-GDP ratio is approaching 60% again.

——————–
2. Hard-currency debt issuances accelerated at the start of this year.
 Source: @markets Read full article
3. Most EM central banks are cutting rates.
 Source: Truist Advisory Services
4. Next, we have some performance data from last week.
• Currencies:

• Bond yields:

• Equity ETFs:

Back to Index
Commodities
1. Speculative accounts continue to boost their bets against soybeans.

2. Gold typically performs well in January.
 Source: Variant Perception
3. COMEX copper is back at its 200-day moving average.
 Source: @TheTerminal, Bloomberg Finance L.P.
4. Here is a look at last week’s performance data.

Back to Index
Energy
1. The US rig count has been stable at around 500.

Fracking activity continues to trend lower.

——————–
2. Energy sector valuations remain attractive relative to the S&P 500.
 Source: J.P. Morgan Asset Management
• The energy sector remains in a long-term downtrend versus the S&P 500.

——————–
3. Speculative accounts are betting on higher gasoline prices.

Back to Index
Equities
1. The Nasdaq 100 underperformed sharply last week.

But speculative accounts have been boosting their bets on Nasdaq futures.

——————–
2. Market sentiment is moderating. Here is Goldman’s index.
 Source: Goldman Sachs; @MikeZaccardi
Insiders are nervous.
 Source: Thomson Reuters; @WallStJesus
——————–
3. S&P 500 breadth has significantly improved, which typically signals lasting internal momentum during bull markets.
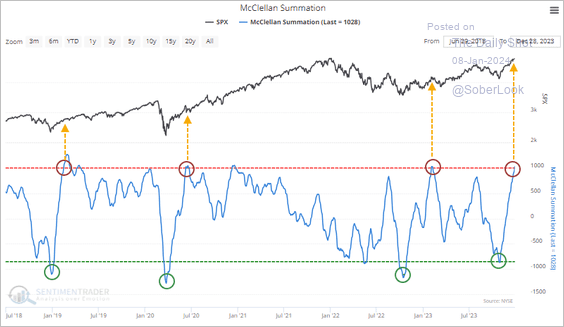 Source: SentimenTrader
However, there are signs of short-term breadth deterioration.
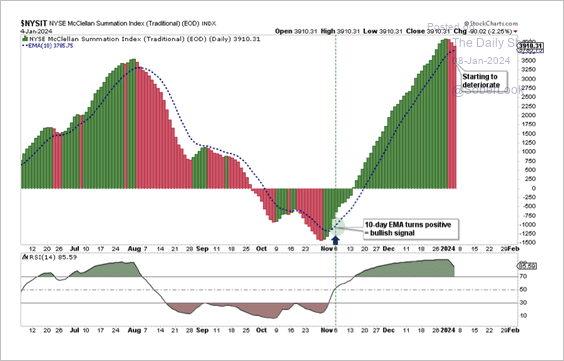 Source: Aazan Habib, Paradigm Capital
——————–
4. Value companies’ earnings expectations continue to trend lower relative to growth.
 Source: Truist Advisory Services
5. Share buyback activity has been strong.
 Source: BofA Global Research; @MikeZaccardi
6. What does reinvesting dividends do for long-term returns?
 Source: @TheTerminal, Bloomberg Finance L.P.
7. Equities tend to bottom first during recessions.
 Source: J.P. Morgan Asset Management
8. The S&P 500 has a strong full-year return bias to its performance in January.
 Source: Deutsche Bank Research
9. Next, we have some performance data from last week.
• Sectors:

• Equity factors:

• Macro basket pairs’ relative performance:

• Thematic ETFs:

• Largest US tech firms:

Back to Index
Credit
1. Maney market fund assets continue to hit record highs.

2. US leveraged loans had a solid year in 2023 thanks to a combination of higher base rates and renewed investor optimism.
 Source: PitchBook
As interest rates declined late last year, the share of outstanding loans priced at par and above climbed, leading to a rush of leveraged loan repricing.
 Source: PitchBook
——————–
3. Investment-grade bond fund flows remain robust.
 Source: BofA Global Research
4. Finally, we have last week’s performance data.

Back to Index
Global Developments
1. It was a rough first week of the year for stocks and bonds.
 Source: @markets Read full article
2. Investors have been exiting bullish-dollar assets.
 h/t Wes Goodman, Simon White, Bloomberg Markets Live Blog
3. Pantheon Macroeconomics expects a gradual recovery in the semiconductor cycle.
 Source: Pantheon Macroeconomics
4. Next, we have some performance data from last week.
• Currencies:

• Bond yields:

• Large-cap equities:

Back to Index
Food for Thought
1. S&P 500 returns by year:
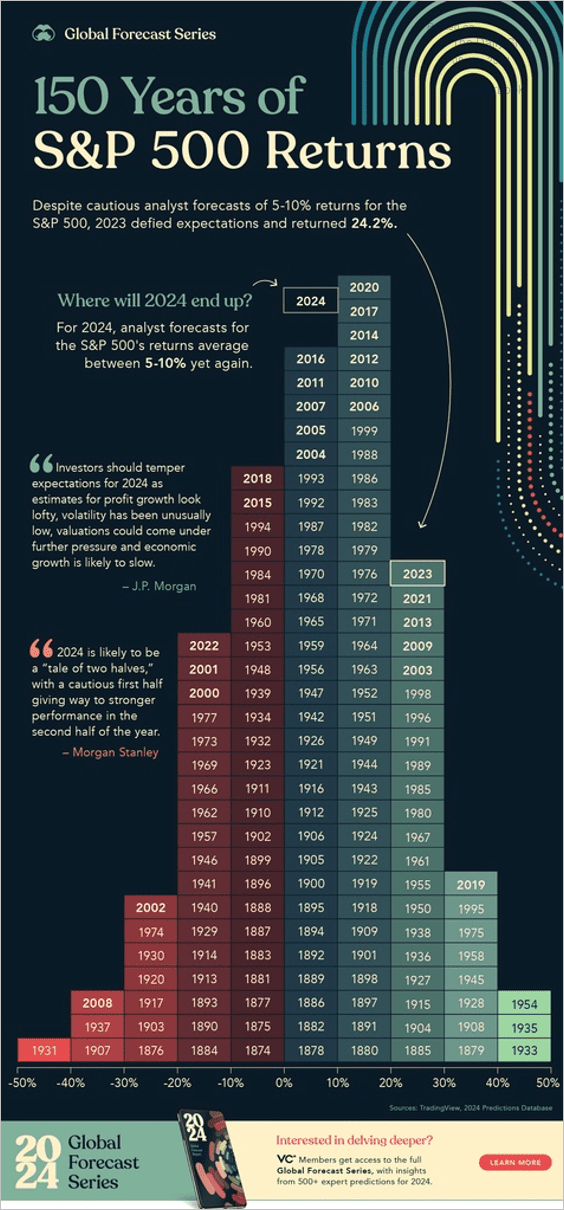 Source: Visual Capitalist Read full article
2. Twitter’s valuation:
 Source: @chartrdaily
3. Buy Now Pay Later online spending:
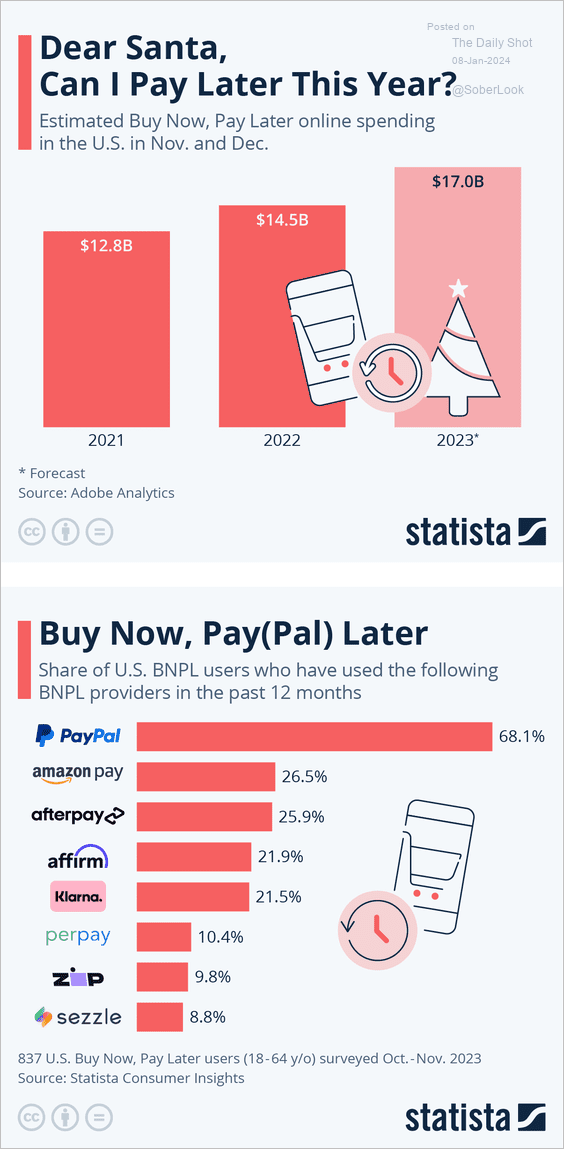 Source: Statista
4. Nvidia’s Q3 geographic revenue breakdown and income statement:
 Source: @genuine_impact
5. Share of US vehicle production by type:
 Source: @chartrdaily
6. Percentage of consumers planning to spend more in 2024:
 Source: @CivicScience Read full article
7. The biggest obstacle to peace between Russia and Ukraine:
 Source: ECFR Read full article
8. How Americans meet their partners:
 Source: YouGov
——————–
Back to Index