
The Daily Shot: 09-Jan-24
• The United States
• Canada
• The United Kingdom
• The Eurozone
• Europe
• Japan
• China
• Emerging Markets
• Cryptocurrency
• Commodities
• Energy
• Equities
• Alternatives
• Credit
• Global Developments
• Food for Thought
The United States
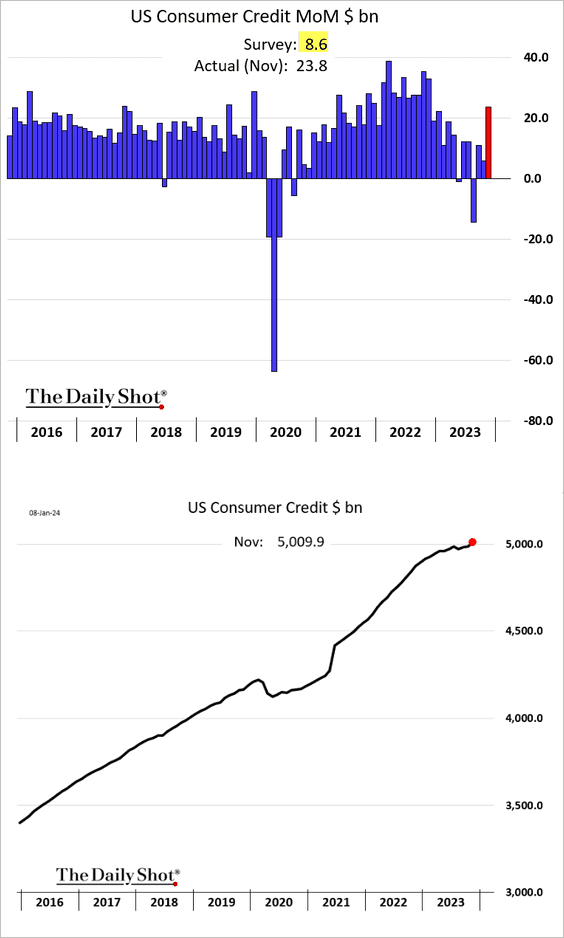
1. US consumer credit rose sharply in November, exceeding $5 trillion for the first time.
 Source: MarketWatch Read full article
• Consumers tapped their credit cards, with real balances now exceeding the pre-COVID peak.

– Credit card debt as a share of disposable income is still below pre-pandemic levels.

• Credit card rates hit a record high.

– Auto loan rates reached their highest level in over two decades.

• Government-owned student loan balances are down $36 billion relative to November of 2022, mostly due to debt forgiveness.

• Separately, household net worth as a share of disposable income remains above pre-COVID levels for most income groups.
 Source: Goldman Sachs; @MikeZaccardi
——————–
2. Next, we have some updates on inflation.
• Inflation expectations have been moderating, according to the NY Fed.

 Source: Reuters Read full article
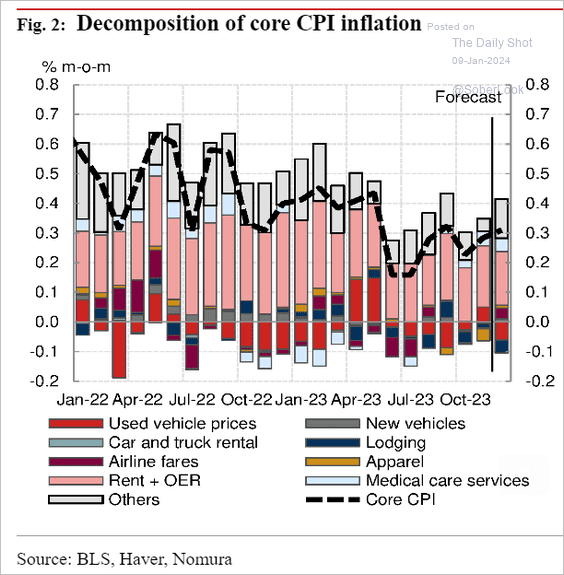
• What should we expect from the December CPI report? Nomura sees a slightly higher core inflation growth last month (vs. November) …
 Source: Numera Analytics (@NumeraAnalytics)
… as goods deflation eases …
 Source: Numera Analytics (@NumeraAnalytics)
… while housing inflation remains elevated.
 Source: Numera Analytics (@NumeraAnalytics)
– ANZ expects a decline in the core CPI growth last month.
 Source: @ANZ_Research
• Rental costs have been moderating, …
 Source: Apartment List
… as vacancies climb.
 Source: Apartment List
– Apartment supply is expected to surge this year as more units are completed.
 Source: @ResidentialClub, @RealPage Read full article
– The share of cities with positive rent growth has been rising.
 Source: Torsten Slok, Apollo
• Wholesale used vehicle prices continue to trend lower.

• Leading indicators for inflation are starting to rise. (2 charts)
 Source: Variant Perception
 Source: Variant Perception
——————–
3. Next, we have some additional data on the labor market.
• The Household Survey’s employment figure showed a marked divergence from the Establishment Survey, registering a sharp decline in December.

 Source: Piper Sandler
– The overall labor force declined.
 Source: Oxford Economics
Here is part of the explanation.
 Source: Oxford Economics
• There was a shift from full-time to part-time jobs last month.
 Source: ING
• The gap in unemployment rates between African American and White populations reached a record low.
 Source: @DanielHornung46
– Labor force participation among African Americans continues to surpass that of Whites.

• The unemployment rate remains well below NAIRU

• Construction employment has been remarkably resilient.
 Source: Jeff Sparshott; @WSJ
• Here is a look at employment forecasts by metro area (from Capital Economics).
 Source: Capital Economics
Back to Index
Canada
1. Market-based rate cut expectations eased further in response to higher-than-expected wage growth.

2. Here is a look at last month’s employment changes by sector.
 Source: Oxford Economics
3. Hiring intentions continue to signal slower employment gains ahead.
 Source: Capital Economics
Back to Index
The United Kingdom
1. Job placement agencies are reporting slower declines in business activity.
 Source: S&P Global PMI
• Recruiting challenges continue to moderate.
 Source: ING
• Foreign worker visas are not expected to change much under the new rules, according to Pantheon Macroeconomics.
 Source: Pantheon Macroeconomics
——————–
2. Here is a look at per-capita real household disposable income growth.
 Source: @resfoundation
3. This chart shows general election voting intentions.
 Source: The Economist Read full article
Back to Index
The Eurozone
1. Let’s begin with Germany.
• Manufacturing orders edged higher in November.

– But industrial production continues to tumble (six consecutive declines in a row).

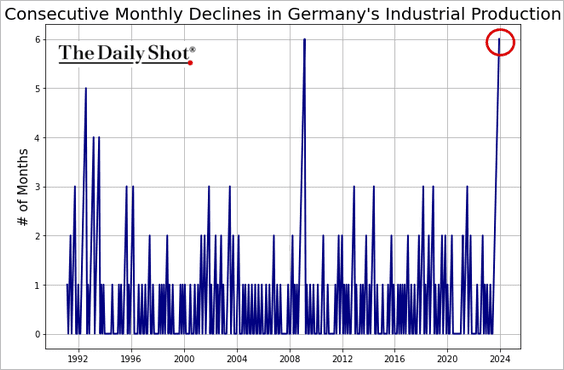
 Source: @economics Read full article
• Retail sales continue to trend lower.

– This chart shows online retail sales.

• Germany’s trade surplus surprised to the upside as exports jumped.

• Construction activity remains in recession.

——————–
2. French construction activity is also in recession.
 Source: S&P Global PMI
But Italy’s construction sector is growing.
 Source: S&P Global PMI
——————–
3. Euro-area sentiment indicators mostly improved last month.
• Consumer sentiment:

• Services:

• Industry (almost unchanged):

• Economic sentiment (includes the components above):

 Source: MarketWatch Read full article
Separately, the Sentix investor sentiment indicator edged higher this month.

Back to Index
Europe
1. Swiss inflation was higher than expected last month.

The Swiss franc is trading near the highs versus the euro.

——————–
2. European equities are trading at a historic valuation discount.
 Source: Pictet Asset Management Read full article
3. Poland’s inflation was lower than expected.

4. Here is a look at commercial flights in the EU (relative to pre-COVID levels).
 Source: Eurostat Read full article
Back to Index
Japan
1. Tokyo’s headline inflation continues to moderate. Core inflation has been more sticky.

2. Household spending was softer than expected in November.

3. BofA forecasts much higher JGB yields this year.
 Source: BofA Global Research
Back to Index
China
1. Loan growth has shifted from real estate to the industrial sector in recent years.
 Source: Pantheon Macroeconomics
2. Global mutual funds’ allocations to China are very low.
 Source: Goldman Sachs; @MikeZaccardi
3. Bond yields continue to sink on rate cut expectations.

Back to Index
Emerging Markets
1. Mexican consumer sentiment remains elevated.

• Vehicle sales are well above last year’s levels.

——————–
2. Chile’s CPI surprised to the downside, …

… sending the peso sharply lower.

• Chile’s trade surplus topped expectations (due to softer imports).

——————–
3. Next, we have some updates on Argentina.
• Manufacturing production (a downward trend):

• Construction activity (softening):

• Vehicle sales (multi-year lows):

——————–
4. India’s GDP estimate was stronger than expected.
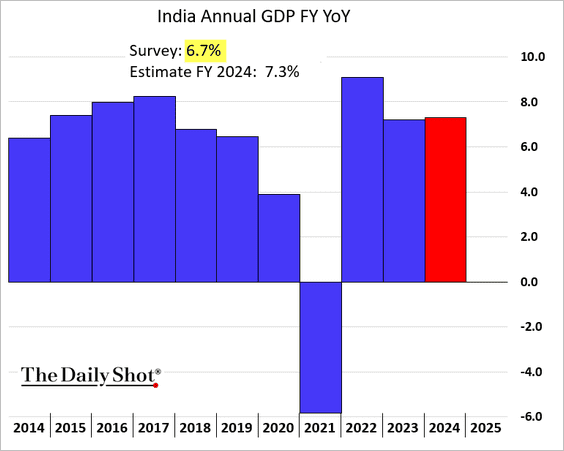
 Source: Reuters Read full article
• Services PMI showed an acceleration in last month’s business activity.
 Source: S&P Global PMI
• The USD/INR volatility is at multi-year lows.
 h/t Mary Nicola
——————–
5. Here is a look at this year’s elections across EM economies.
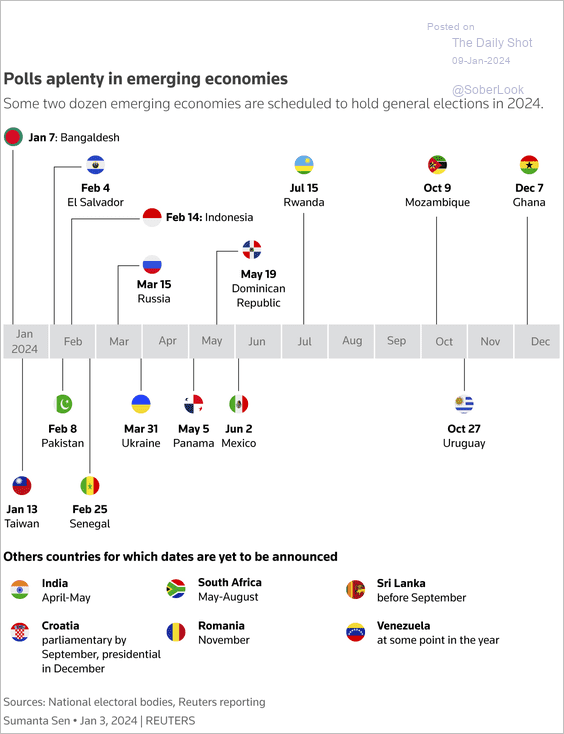 Source: Reuters Read full article
Back to Index
Cryptocurrency
1. Bitcoin has outperformed sharply year-to-date.

2. Crypto funds saw inflows during the first week of the year, led by long-bitcoin products. (2 charts)
 Source: CoinShares Read full article
 Source: CoinShares Read full article
——————–
3. Bitcoin formed a golden cross on a weekly chart.

4. Bitcoin’s correlation with the Nasdaq 100 index has deteriorated in recent months.
 Source: @StocktonKatie
5. The total crypto market cap is nearly $1.67 trillion.

• Bitcoin’s market cap relative to the total crypto market cap (dominance ratio) continues to recover. Unlike previous bull markets, investors have preferred BTC over altcoins.

Back to Index
Commodities
1. Gold and silver have diverged sharply in recent weeks.
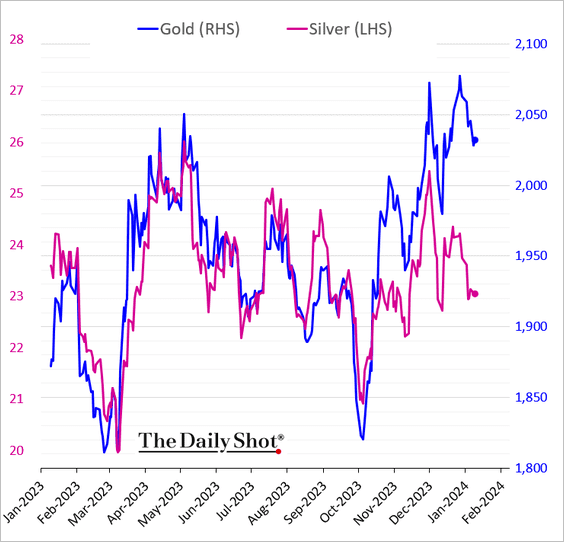
• CTAs have been bullish on gold.
 Source: Deutsche Bank Research
——————–
2. Declining US corn futures reflect subdued grain demand and improved weather conditions in Brazil.

3. Cocoa futures are rolling over.

 Source: Reuters Read full article
Back to Index
Energy
1. Crude oil futures softened on Monday, influenced by Saudi Arabia’s decision to reduce prices for their Asian customers.
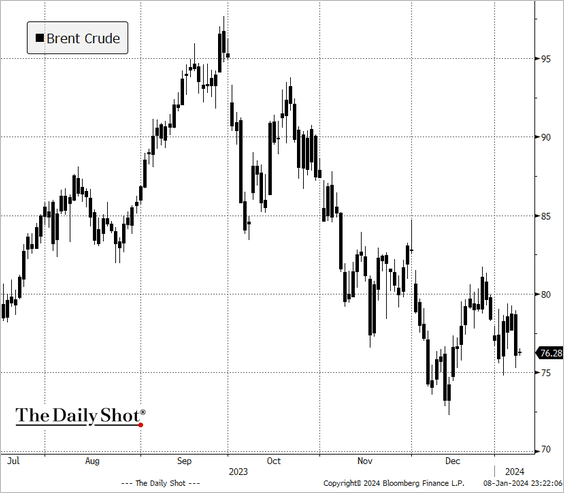
 Source: Reuters Read full article
——————–
2. Next, we have some updates on natural gas markets.
• US natural gas in storage is at multi-year highs for this time of the year.

– US gas production has declined this month.
 Source: Goldman Sachs; @MikeZaccardi
– Here is a look at the share of US natural gas production by state.
 Source: Wells Fargo Securities
• European natural gas inventories remain near the highs for this time of the year.

– Prices continue to trend lower.

——————–
3. In recent years, the US has produced more energy than it consumed.
 Source: Wells Fargo Securities
4. Goldman expects battery costs to return to a deflationary trend.
 Source: Goldman Sachs
• Lower material costs and simpler cell-to-vehicle integration could help ease battery prices.
 Source: Goldman Sachs
• Further declines in lithium costs could also help lower battery prices.
 Source: Goldman Sachs
Back to Index
Equities
1. Small caps have not broken through the downtrend resistance relative to the S&P 500.

Goldman is upbeat on small caps if the US GDP growth holds up (2 charts).
 Source: Goldman Sachs; @MikeZaccardi
 Source: Goldman Sachs; @MikeZaccardi
——————–
2. Next, we have some sector trends over the past few days.
• Tech and semiconductors:


• Energy:

• Industrials:

• Healthcare:

• Consumer staples:

——————–
3. Q4 earnings estimates have been revised sharply lower.
 Source: @FactSet Read full article
 Source: Deutsche Bank Research
– Is the market too gloomy on Q4 earnings? Here is a forecast from Deutsche Bank.
 Source: Deutsche Bank Research
– But earnings beats won’t necessarily translate into a strong rally.
 Source: Deutsche Bank Research
• The scale of downward earnings revisions for 2024 has been notably less severe compared to the usual trend.
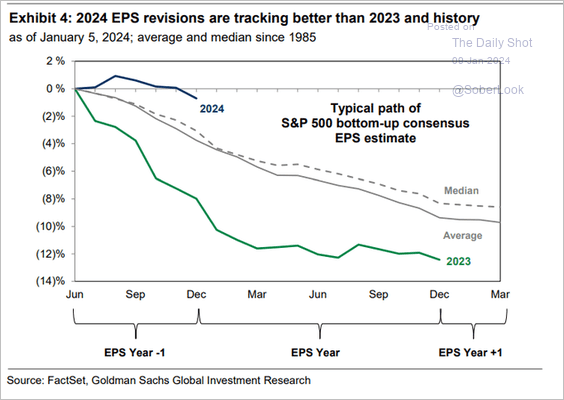 Source: Goldman Sachs; @MikeZaccardi
– Here are the 2024 revisions by sector.
 Source: Goldman Sachs; @MikeZaccardi
——————–
4. What is the average first-quarter sector performance?
 Source: BofA Global Research; @MikeZaccardi
5. This chart shows sector performance under Democrats vs. Republicans.
 Source: J.P. Morgan Asset Management
6. Passive accounts increasingly dominate US allocations.
 Source: BofA Global Research
7. Has the US quality factor priced in an economic slowdown?
 Source: State Street Global Advisors
8. The outperformance of large-cap growth stocks over value stocks has been significantly more pronounced than the relative performance of small-cap growth stocks.
 Source: BofA Global Research
9. Prior to the QE era, US households were net sellers of equities.
 Source: TS Lombard
Back to Index
Alternatives
1. The average private equity manager has outperformed the S&P 500 for most of the last 30 years (partially due to higher leverage).
 Source: J.P. Morgan Asset Management
Buyout performance has improved relative to the S&P 500 in recent years.
 Source: J.P. Morgan Asset Management
——————–
2. The recent IPO boom allowed private equity firms to sell companies at inflated valuations, which led to a wave of exit activity and a rise in distributions.
 Source: J.P. Morgan Asset Management
Back to Index
Credit
1. BofA’s private clients have been buying high-yield bonds.
 Source: BofA Global Research
2. Here is a look at trading volumes in securitized products.
 Source: Deutsche Bank Research
3. Multifamily debt markets face some challenges this year.
 Source: @markets Read full article
• Capital Economics expects continued weakness in major western apartment markets, while some southern markets could see a recovery.
 Source: Capital Economics
——————–
4. Banks can borrow from the Fed’s term funding program (BTFP) for less than what the Fed pays on their reserves.
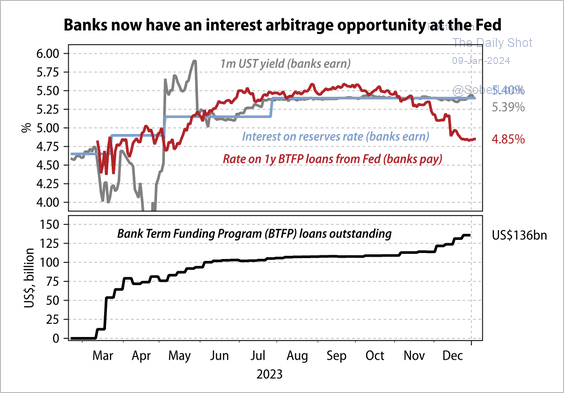 Source: Gavekal Research
Back to Index
Global Developments
1. Here is a look at central banks’ policy easing expectations for 2024.
 Source: Scotiabank Economics
2. At current yields, most developed market sovereign bonds could generate positive real returns.
 Source: Pictet Asset Management Read full article
3. The global stock/bond ratio remains in an uptrend alongside improvements in the traditional 60% equity/40% bond portfolio.
 Source: MRB Partners
——————–
Food for Thought
1. Corporate insider incidents:
 Source: Ponemon Institute and DTEX
2. Projected energy supplies by fuel type:
 Source: @WSJ Read full article
3. Theft rates:
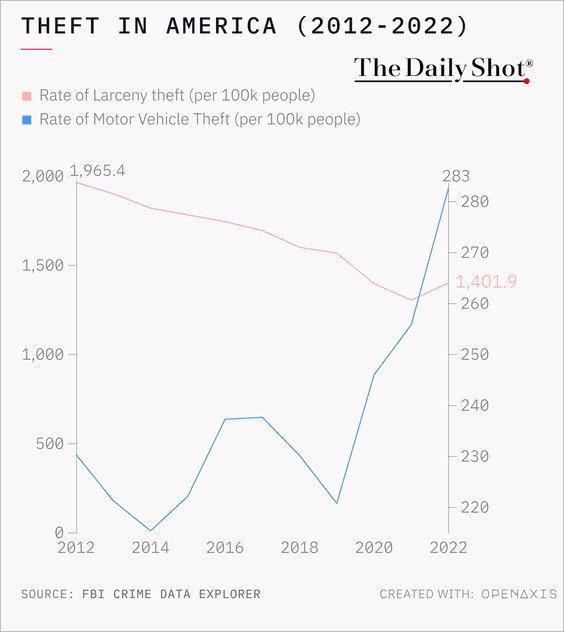 Source: @TheDailyShot
4. Changes in hate crimes:
 Source: @axios Read full article
5. US suicide statistics:
 Source: @WSJ Read full article
6. US life expectancy:
 Source: @economics Read full article
7. Test scores among 15-year-olds in OECD countries:
 Source: Reuters Read full article
8. How do Americans heat their homes?
 Source: maps.com
——————–
Back to Index