The Daily Shot: 12-Jan-24
• The United States
• The Eurozone
• Europe
• Japan
• China
• Emerging Markets
• Cryptocurrency
• Commodities
• Energy
• Equities
• Credit
• Rates
• Global Developments
• Food for Thought
The United States
1. The December headline CPI print was higher than expected. Progress toward the Fed’s 2% target will likely get more challenging from here.

Core inflation was in line with forecasts.

• Below are the year-over-year trends.
 Source: @axios Read full article
• The core goods deflation is over, …
 Source: Nomura Securities
… as vehicle prices climb.

• Shelter was over half of the US consumer price increase in December.
 Source: @TheTerminal, Bloomberg Finance L.P.
– Housing inflation remains elevated, …

… but leading indicators point to some relief ahead.
 Source: Oxford Economics
• Inflation in core services ex. housing (referred to as supercore CPI) remains sticky (2 charts). The Fed is watching this component of the CPI very closely, in part because of its sensitivity to wage growth.

 Source: Nomura Securities
• Below are some additional CPI components.
– Car insurance (up over 20% year-over-year):

– Medical care services:

– Gym memberships:

• Finally, here is a look at inflation by region.
 Source: @economics Read full article
——————–
2. The market reaction to the CPI report was muted. Treasury yields declined.
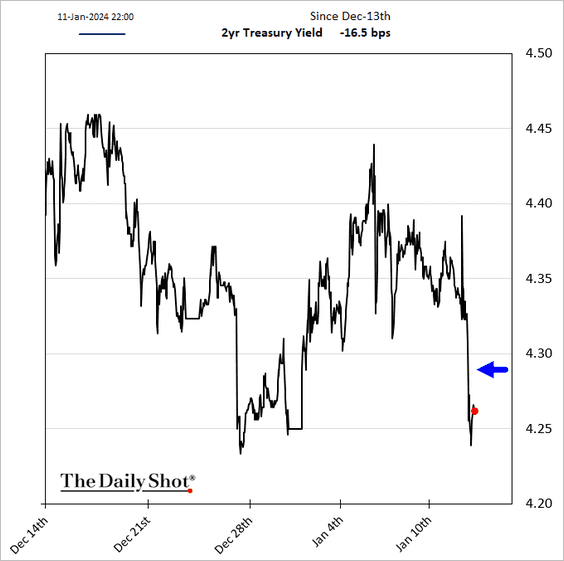
• Futures signal 150 bps of Fed rate cuts this year.

• A March rate cut is still in play, according to the market, …

… even as Fed officials push back.
 Source: Reuters Read full article
• Short-term market-based inflation expectations remain near 2%.

——————–
3. Initial jobless claims started 2024 at multi-year lows. The labor market remains robust for now.

Here is a look at continuing claims going into the year-end.

——————–
4. Last month’s budget deficit was wider than expected.

 Source: CNBC Read full article
Back to Index
The Eurozone
1. Spain’s industrial production climbed in November, …

… but Italy’s factory output is tanking. Industrial production trends across euro-area economies have been uneven in recent months.

Here is a look at industrial production changes relative to pre-COVID levels.
 Source: @skhanniche
——————–
2. Euro-area rent inflation has been elevated.
 Source: ECB
3. The euro is (roughly) fairly valued based on its real effective exchange rate.
 Source: Deutsche Bank Research
Back to Index
Europe
1. Asia-to-Europe container shipping costs continue to climb.

2. Czech inflation surprised to the downside.

3. Here is a look at digital skills across the EU.
 Source: Eurostat Read full article
Back to Index
Japan
1. Economists see sub-1% GDP growth this year.

2. The trade deficit was wider than expected in November.

3. Corporate profitability has been strengthening as compensation costs remain subdued.
 Source: BofA Global Research
4. Stocks continue to surge.

Chinese investors have been loading up on a China-listed Japan ETF as Chinese stocks slump.
 Source: @markets Read full article
——————–
5. A shift in the BoJ’s policy stance could cause the US-Japan interest rate gap to narrow, which may benefit the yen.
 Source: Numera Analytics (@NumeraAnalytics)
Back to Index
China
1. The headline CPI remains in negative territory on a year-over-year basis.

 Source: @markets Read full article
Here are some additional CPI trends.
• Core CPI (stable):

• Services CPI:

• Clothing:

——————–
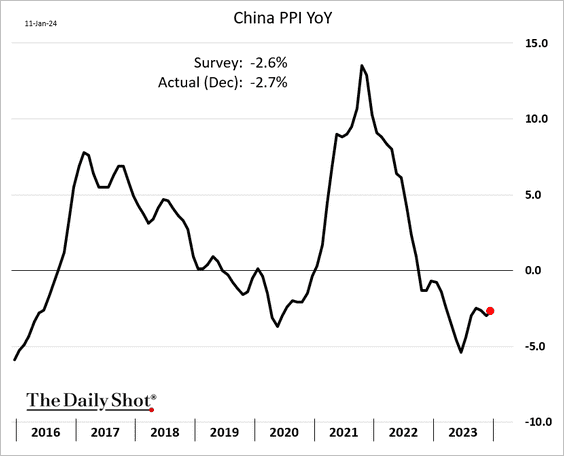
2. The PPI remains well below last year’s levels.
3. Exports exceeded 2022 levels in December, …

 Source: South China Morning Post Read full article
… but were down for the full year (2 charts).

 Source: @economics Read full article
• Imports have been running in line with 2022 levels.

• Here is the trade deficit.

——————–
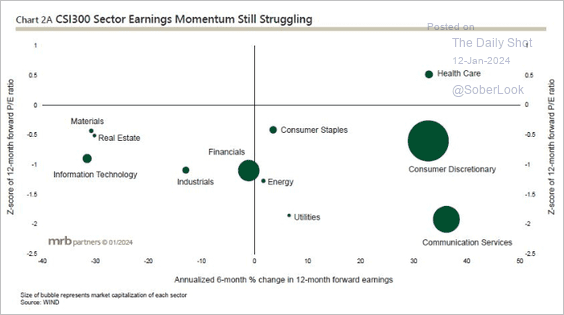
4. This chart compares earnings momentum and valuation by sector.
 Source: MRB Partners
5. Chinese government bonds have outperformed Treasuries over the past three years.
 Source: Gavekal Research
Back to Index
Emerging Markets
1. The Turkish lira continues to sink, breaching 30 to the dollar.

 Source: CNBC Read full article
——————–
2. South Africa’s manufacturing output edged higher in November.

3. Mexican manufacturing production is coming off the highs.

Mining output has been trending lower.

——————–
4. Brazil’s inflation is back inside the central bank’s target range.
 Source: @economics Read full article
 Source: Barron’s Read full article
——————–
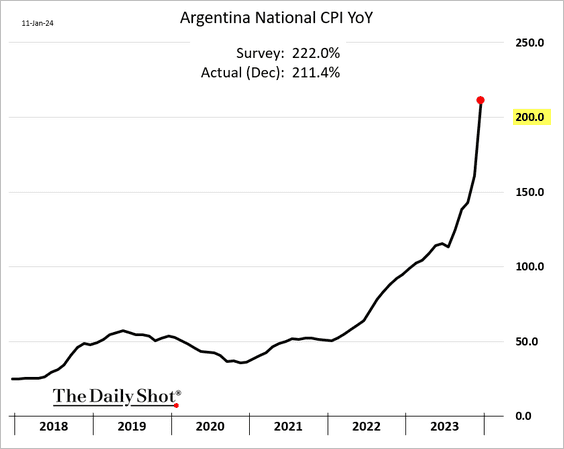
5. Argentina’s CPI breached 200% in December.
 Source: Reuters Read full article
——————–
6. In dollar terms, EM government bonds have outperformed developed market bonds over the past few years.
 Source: Gavekal Research
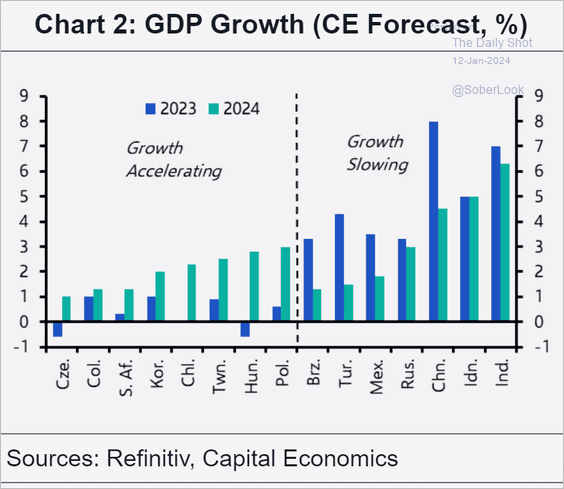
7. Here is a look at GDP growth forecasts from Capital Economics.
 Source: Capital Economics
Back to Index
Cryptocurrency
1. Most major cryptos are up so far this year, with ether (ETH) outperforming and XRP underperforming top peers.
 Source: FinViz
2. The ETH/BTC price ratio bounced from the lower bound of its two-year long range.
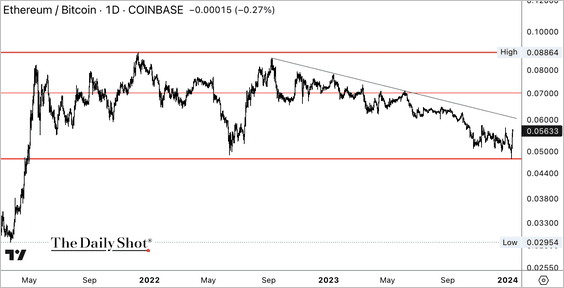
Could we see a US spot-ether ETF soon?
 Source: CoinTelegraph Read full article
——————–
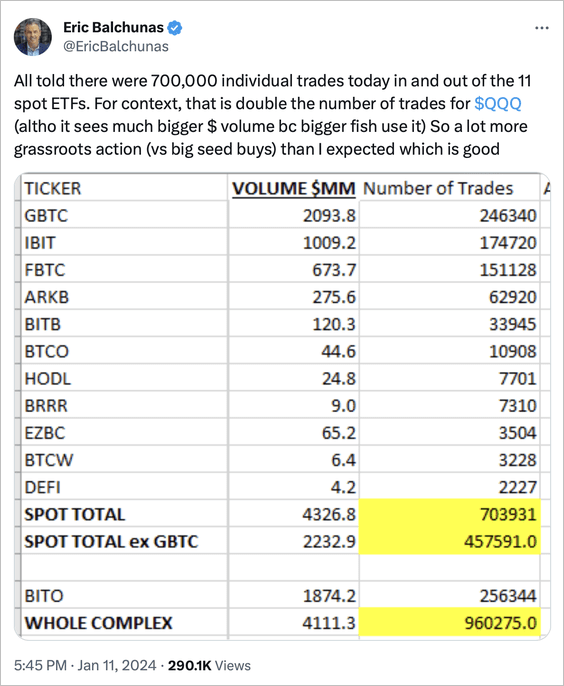
3. Trading volumes surged for US spot-bitcoin ETFs on Thursday.
 Source: @EricBalchunas
But the new cash bitcoin ETFs sold off on their debut day of trading.

——————–
4. Here is a look at crypto liquidity rankings by Kaiko over the past quarter.
 Source: @KaikoData
Back to Index
Commodities
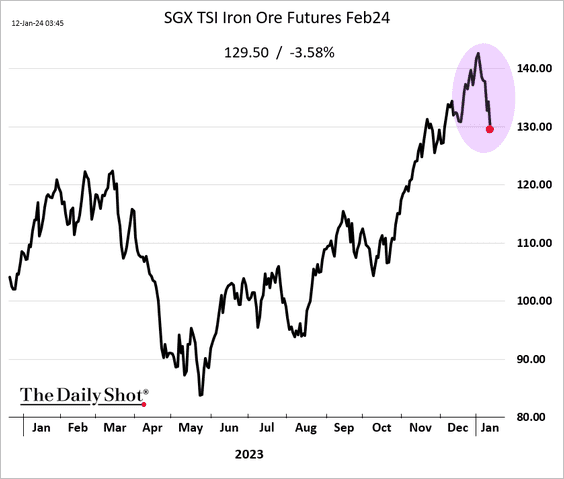
The selloff in iron ore has accelerated.
Back to Index
Energy
1. Crude oil jumped, with Brent reaching its 50-day moving average, …

… amid tensions in the Middle East.
 Source: Reuters Read full article
——————–
2. US inventories of natural gas in storage remain at elevated levels.

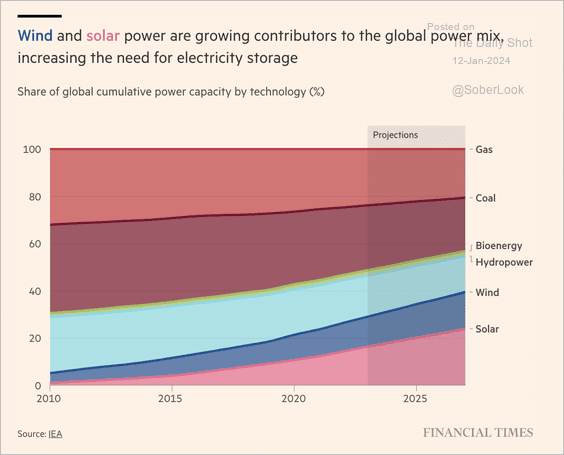
3. Here is a look at wind and solar contributions to the global power mix.
 Source: @financialtimes Read full article
Back to Index
Equities
1. It has been a rough start of the year for mid-cap and small-cap stocks.

2. Investor sentiment/positioning remains bullish.
• Retail investors:

• CTAs:
 Source: Goldman Sachs; @dailychartbook
• BNP Paribas’ equity positioning indicator:
 Source: BNP Paribas; @WallStJesus
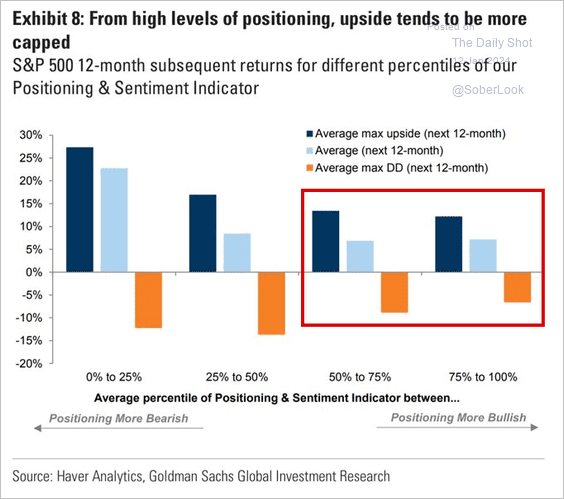
3. Bullish positioning tends to cap the upside for stocks.
 Source: Goldman Sachs; @WallStJesus
——————–
4. Valuation spreads in the Russell 3000 Index (broad market index) are back at recessionary extremes, driven by small and mid-caps.
 Source: Denise Chisholm; Fidelity Investments
The S&P 500 typically outperforms bonds when stock valuation spreads are wide and falling.
 Source: Denise Chisholm; Fidelity Investments
——————–
5. The S&P 500 return dispersion has been climbing.

6. Fed liquidity (reserves) has been a tailwind for stocks.

7. Consensus earnings estimates for Q4 are modest.
 Source: Goldman Sachs; @carlquintanilla
• The dollar weakness tends to signal a higher frequency of sales beats.
 Source: Goldman Sachs; @dailychartbook
——————–
8. Real estate fund flows have turned positive.
 Source: BofA Global Research
Back to Index
Credit
1. Investment-grade bond funds are seeing massive inflows.
 Source: BofA Global Research

——————–
2. Corporate credit pricing is not attractive, according to BCA Research.
 Source: BCA Research
3. Leveraged loan borrowers’ interest coverage ratios are stretched.
 Source: Deutsche Bank Research
Back to Index
Rates
1. Open interest in fed funds futures has been surging amid rising bets on Fed rate cuts.
 Source: @markets Read full article
2. Treasury yield forecasts have diverged sharply.
 Source: Torsten Slok, Apollo
Back to Index
Global Developments
1. Most major bond markets shifted lower this year except China.
 Source: Macrobond
2. Bab el-Mandeb Strait transit volumes have collapsed.
 Source: BofA Global Research
• Panama Canal transit volumes have been deteriorating as well.
 Source: The Economist Read full article
• As a result, global freight rates are up sharply.
 Source: BofA Global Research
——————–
3. There is no consistent dollar pattern around Fed easing cycles.
 Source: Macrobond
• Even with the market pricing in large Fed rate cuts, the dollar is still a “high-yielder” relative to other major currencies.
 Source: Deutsche Bank Research
——————–
Food for Thought
1. Air travel complaints:
 Source: @WSJ Read full article
2. EVs are becoming harder to sell.
 Source: @WSJ Read full article
3. Nvidia’s revenue components:
 Source: @WSJ Read full article
4. Top TV advertisers:
 Source: Visual Capitalist Read full article
5. Population changes since 1990 (Europe, North Africa, and the Middle East):
 Source: @MichaelAArouet, @mmjukic
• US population changes by state:
 Source: Census Bureau Read full article
——————–
6. Obesity rates (2 charts):
 Source: @financialtimes Read full article
 Source: Gallup Read full article
——————–
7. Climate-related events with damages totaling more than $1 billion:
 Source: BlackRock Investment Institute
• Natural catastrophes:
 Source: @WSJ Read full article
——————–
8. New England’s winning percentage under Bill Belichick:
 Source: @TheAthletic Read full article
——————–
Have a great weekend!
Back to Index
