
The Daily Shot: 02-Feb-24
• The United States
• Canada
• The United Kingdom
• The Eurozone
• Europe
• Asia-Pacific
• China
• Emerging Markets
• Commodities
• Energy
• Equities
• Credit
• Rates
• Global Developments
• Food for Thought
The United States
1. Labor productivity climbed again last quarter, surprising to the upside.

 Source: MarketWatch Read full article
• As a result, growth in unit labor costs was smaller than expected.

 Source: Reuters Read full article
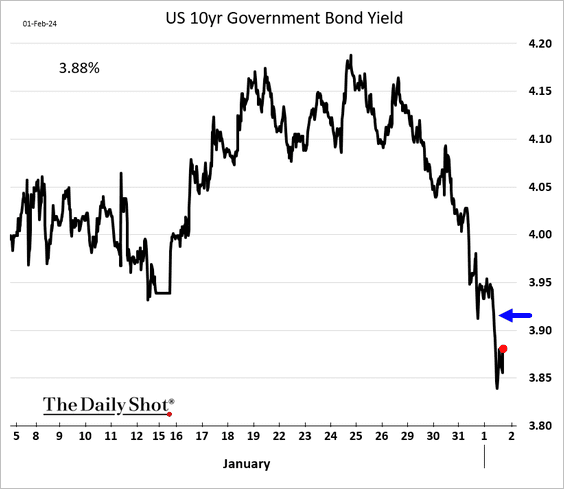
• Treasury yields declined further in response to the productivity report.
——————–
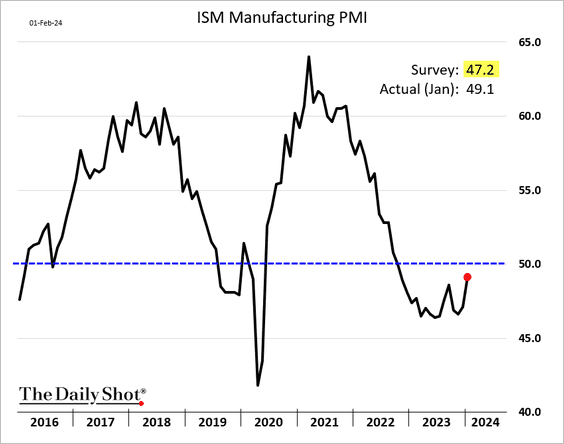
2. The ISM Manufacturing PMI showed improvement in January, signaling a possible conclusion to the nation’s manufacturing slump.
 Source: @TheTerminal, Bloomberg Finance L.P.
• New orders returned to growth mode for the first time in almost two years.

• Input prices are rising again.

• According to the ISM report, factories continue to shed jobs.

• Leading indicators point to further improvements ahead.
– Corporate revenue surprises:

– Orders/inventories ratio:
 Source: BofA Global Research
——————–
3. Construction spending increased more than expected in December, …

… boosted by residential construction.
 Source: @TheTerminal, Bloomberg Finance L.P.
• Public construction spending has been accelerating.

——————–
4. Next, we have some updates on the labor market.
• Initial jobless claims increased last week.

This chart shows continuing claims.

• The Challenger Job Cut Announcements index rose in January.

• What should we expect from today’s employment report? Alternative employment indicators are all over the place.
 Source: Goldman Sachs; @MikeZaccardi
——————–
5. Vehicle sales decreased last month.

According to Oxford Economics, “The sharp drop in vehicle sales in January likely reflects a combination of some payback after a strong month for sales in December and the unseasonably cold weather last month.”
——————–
6. Despite Chair Powell’s pushback on a March rate cut, the market has priced rapid-fire Fed easing later this year.

Back to Index
Canada
1. The manufacturing slump eased last month.

2. Canada’s rental market continues to tighten.
 Source: @economics Read full article
3. The decline in corporate profits could dampen wage growth.
 Source: Economics and Strategy Group, National Bank of Canada
Back to Index
The United Kingdom
1. The BoE boosted its medium-term GDP growth forecast.
 Source: @financialtimes Read full article
Here is the BoE’s inflation forecast.
 Source: @financialtimes Read full article
——————–
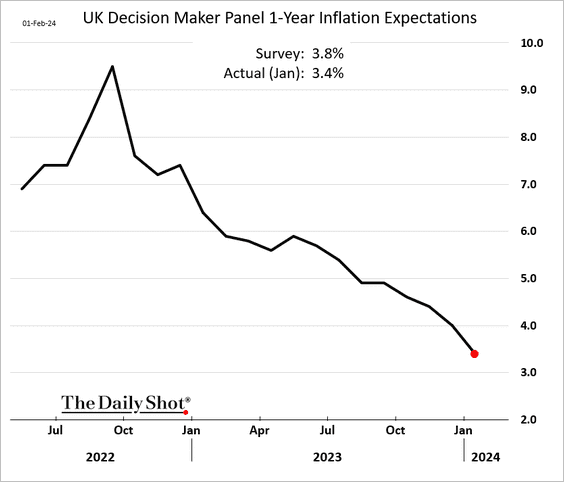
2. Inflation expectations continue to ease.
Back to Index
The Eurozone
1. The CPI report was a touch firmer than expected.

 Source: @economics Read full article
Both Dutch and Italian CPI figures were above consensus.


——————–
2. Euro-area unemployment rate remains at multi-year lows.

Back to Index
Europe
1. A revival in global trade could bode well for Sweden’s economy.
 Source: MRB Partners
2. Here is a look at motorization rates across the EU.
 Source: Eurostat Read full article
3. Voters across the EU are increasingly concerned about immigration, which could bolster support for right-wing parties. (2 charts)
 Source: Alpine Macro
 Source: Alpine Macro
Back to Index
Asia-Pacific
1. BofA’s private clients love Japanese stocks.
 Source: BofA Global Research
2. South Korea’s core CPI surprised to the downside.

3. Australia’s benchmark equity index hit a record high, led by real estate.

Back to Index
China
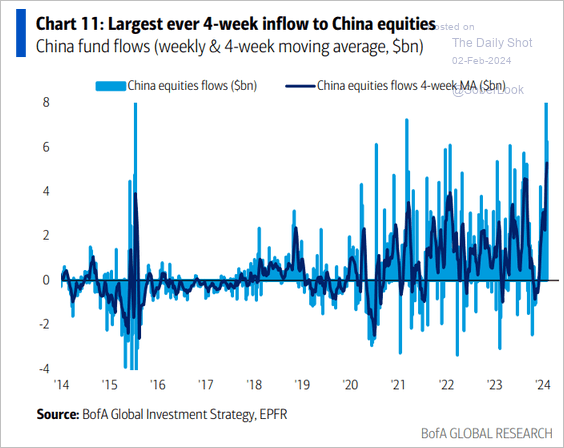
1. Flows into China-focused equity funds have surged in recent weeks.
 Source: BofA Global Research
But that hasn’t been enough to stem the rout in mainland shares.

——————–
2. Commodity imports grew strongly last year. The drop-off in unwrought copper imports was probably because of strong domestic production rather than a decline in copper use, according to Capital Economics.
 Source: Capital Economics
• Steel exports are expected to continue higher, partly due to lower global steel production ex-China.
 Source: Capital Economics
Back to Index
Emerging Markets
1. Mexico’s manufacturing growth stalled again last month, according to the S&P Global PMI report.
 Source: S&P Global PMI
2. Nigeria, Africa’s largest economy, conducted a massive devaluation of the naira, bringing the exchange rate closer to “street” value.
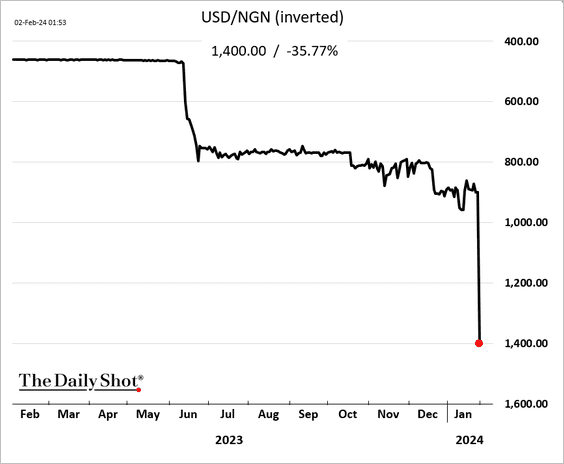
 Source: @financialtimes Read full article
——————–
3. How correlated are EM currencies to the S&P 500 and the dollar?

• Here is a look at carry levels and implied volatility.

Back to Index
Commodities
1. CTA’s have reduced their exposure to commodities.
 Source: Deutsche Bank Research
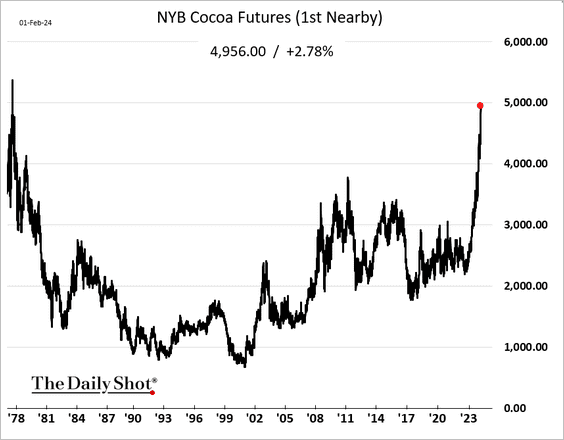
2. Cocoa prices continue to hit muli-decade highs.
3. US milk futures are rebounding (class III milk is mostly used to make cheese).

4. Finally, let’s take a look at commodity correlations to the S&P 500 and the US dollar.

Back to Index
Energy
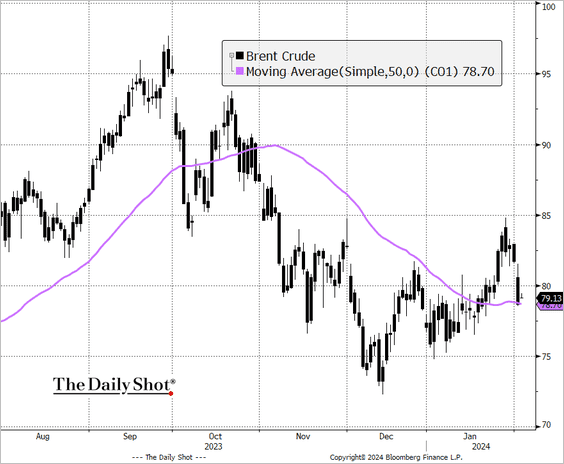
1. Brent crude is back below $80/bbl.
 Source: @TheTerminal, Bloomberg Finance L.P.
 Source: Reuters Read full article
——————–
2. Uranium prices and uranium miners’ shares continue to surge.


Back to Index
Equities
1. The market liked the latest batch of tech earnings reports. Nasdaq futures are up this morning.
 Source: barchart.com
2. The Russell 2000 held support at the 50-day moving average.
 Source: @TheTerminal, Bloomberg Finance L.P.
3. After selling off sharply on Wednesday, regional banks sold off again Thursday on challenges reported by New York Community Bancorp (NYCB). Demand for downside protection surged (the second panel shows implied volatility).

4. The divergence between the Nasdaq 100 and Russell 2000 earnings expectations has blown out.
 Source: SG Cross Asset Research
5. Generally, the S&P 500 has a negative correlation with the Goldman US Financial Conditions Index.
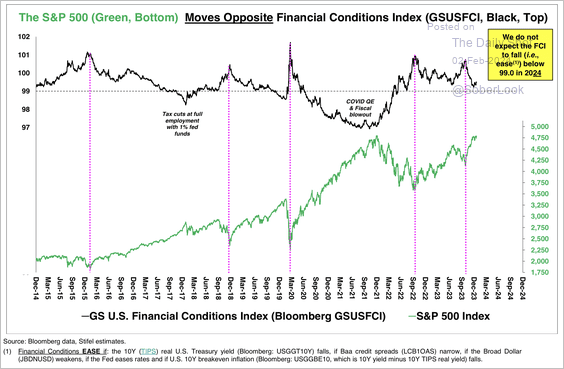 Source: Stifel
6. The S&P 500 risk premium remains unusually low.
 Source: BofA Global Research
7. Deutsche Bank’s US mid-cycle basket has widened its outperformance versus the early-cycle basket.
 Source: Deutsche Bank Research
8. Future retirees use stocks as an inflation hedge.
 Source: Torsten Slok, Apollo
9. Next, let’s take a look at earnings yields (expected performance) vs. implied volatility (perceived risk). It’s a way to evaluate the forward-looking risk/return profiles of different segments of the market.
• Sector:

• Factor/style:

• International:

Back to Index
Credit
1. NYCB sent shockwaves through the banking sector with a massive increase in office CRE reserves, though this largely brought it in line with peers.

NYCB is also an outlier in terms of capital base as it acquired a chunk of Signature Bank assets in 2023, making it more susceptible to volatility.

——————–
2. High yield maturity walls are approaching their most concentrated levels in the past two decades.
 Source: Goldman Sachs; @MikeZaccardi
• The current debt burden for corporates is extremely low since there was so much refinancing at rock bottom rates in the wake of COVID.

• This chart shows how much higher prevailing rates are relative to the contractual rates currently being paid. With a wave of maturities, this interest burden could escalate quickly.

——————–
3. Flows into corporate bond funds accelerated in in recent weeks.
 Source: BofA Global Research
4. Finally, we have credit market yields (expected performance) vs. implied volatility (perceived risk).

Back to Index
Rates
1. Trading in SOFR futures surged after the NYCB news.
 Source: @markets Read full article
2. BofA’s private clients are selling Treasury bills (many are extending their bond maturities).
 Source: BofA Global Research
3. T-bill rates are less attractive relative to the Fed’s RRP facility. As a result, the RRP facility usage could grow, ejecting liquidity from the private sector. This trend could incentivize the Fed to start tapering its QT sooner.
 Source: Simon White, Bloomberg Markets Live Blog
4. Households have been supporting the Treasury market.
 Source: Simon White, Bloomberg Markets Live Blog
5. Based on market projections for the long-run fed funds rate, the current Fed policy is increasingly restrictive.
 Source: @TheTerminal, Bloomberg Finance L.P.
Back to Index
Global Developments
1. The decline in real yield differentials could weigh on the dollar.
 Source: Absolute Strategy Research
2. This chart shows exposure to supply chain risk across industries.
 Source: Absolute Strategy Research
——————–
Food for Thought
1. EV sales:
 Source: @WSJ Read full article
2. The middle class vs. the top 1%.
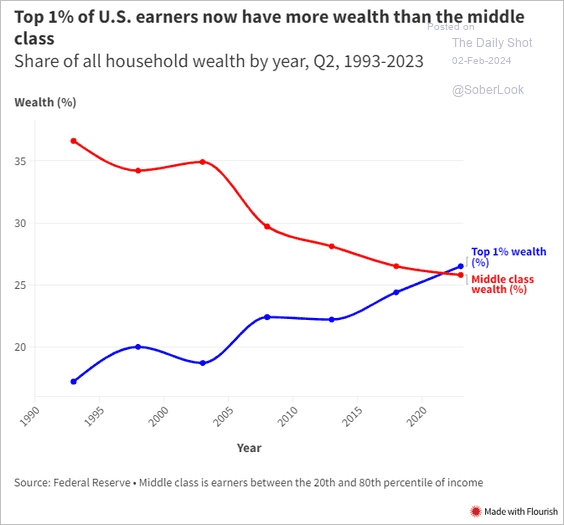 Source: USA Today Read full article
3. Number of births in China:
 Source: @WSJ Read full article
4. The demographic shift in Texas:
 Source: NBC News Read full article
5. US political campaigns’ cash levels:
 Source: @financialtimes Read full article
6. US southwest border apprehensions of people from Asia and Africa:
 Source: @WSJ Read full article
7. The Mississippi River System:
 Source: ResearchGate
——————–
Have a great weekend!
Back to Index