
The Daily Shot: 12-Feb-24
• The United States
• Canada
• Europe
• Japan
• China
• Emerging Markets
• Cryptocurrency
• Commodities
• Energy
• Equities
• Credit
• Global Developments
• Food for Thought
The United States
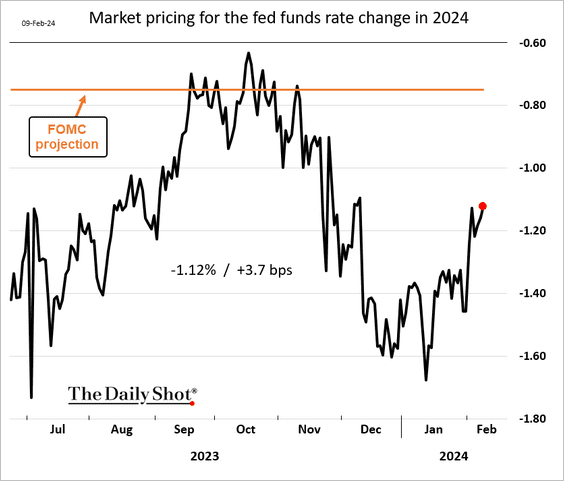
1. The market continues to scale back Fed rate cut expectations for 2024.
2. What should we expect from the January CPI report?
– Morgan Stanley sees a pullback in the headline CPI growth (month-over-month), …
 Source: Morgan Stanley Research
… and a slightly smaller gain in the core CPI (relative to December).
 Source: Morgan Stanley Research
– ANZ also estimates a smaller increase in the core CPI.
 Source: @ANZ_Research
– However, Nomura sees a slight acceleration.
 Source: Nomura Securities
Here is Nomura’s supercore CPI estimate.
 Source: Nomura Securities
Below are some additional inflation trends.
• Upside risk to the non-auto core goods CPI?
 Source: Nomura Securities
• Morgan Stanley now expects a faster moderation in rent inflation.
 Source: Morgan Stanley Research
• Here is a forecast for shelter inflation from JP Morgan Asset Management.
 Source: J.P. Morgan Asset Management
• The surge in transportation services inflation has been driven by car insurance.
![]() Source: Morgan Stanley Research
Source: Morgan Stanley Research
• This chart shows the trajectory of used wholesale vehicle prices.

——————–
3. The rebound in productivity growth is aiding the Fed’s battle against inflation.
 Source: Morgan Stanley Research
• The level of productivity remains above trend, even with the COVID-era slump.
 Source: Morgan Stanley Research
——————–
4. Business investment has been resilient despite tight lending conditions.
 Source: Oxford Economics
5. Here is a look at household wealth growth by age group.
 Source: @axios Read full article
Back to Index
Canada
The employment report topped expectations, …

… but the number of full-time jobs declined.

• Jobs in goods-producing sectors were down again last month.

• The unemployment rate unexpectedly dropped.

• The labor force participation rate was lower in January.

• Wage growth eased slightly.

 Source: Reuters Read full article
Back to Index
Europe
1. Dutch factory output jumped in December, …

… but was still down on a year-over-year basis.
 Source: CBS
2. Sweden’s business output improved in December.

• Household consumption was virtually unchanged.

——————–
3. Norway’s underlying inflation continues to moderate but is still above 5%.

4. Sweden and Norway have allowed their currencies to weaken over the years, …
 Source: @robin_j_brooks
… but it was a good week for both currencies.

——————–
5. Container shipping costs from Asia to Europe are starting to moderate.
 Source: @TheTerminal, Bloomberg Finance L.P.
Back to Index
Japan
1. Japanese investors are still buying foreign assets.
 Source: Deutsche Bank Research
• Denominated in yen, the S&P 500 has surged relative to the Nikkei in recent years. There is little repatriation incentive for local investors.
 Source: Deutsche Bank Research
——————–
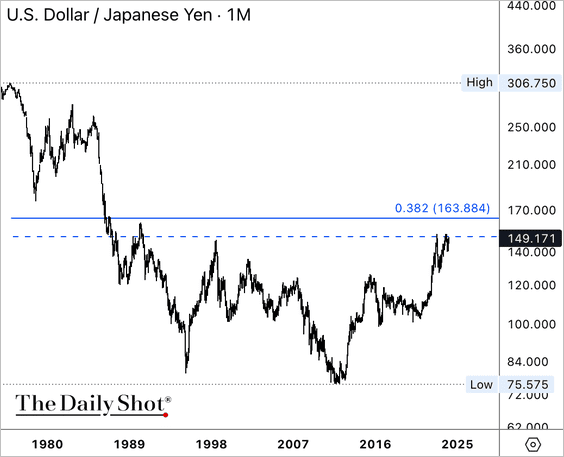
2. USD/JPY is approaching long-term resistance, initially at 152.
Back to Index
China
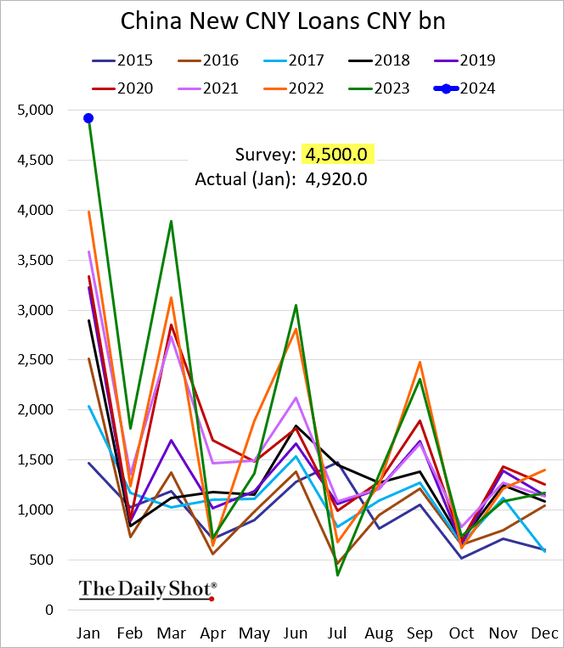
1. Loan growth hit a record high in January.
• Bank loans:
• Aggregate financing:

 Source: Reuters Read full article
2. Stronger loan growth has yet to translate into a faster expansion in the broad money supply.

3. So far, domestic investors, most likely state-owned entities, have driven the increase in demand for stocks.
 Source: Goldman Sachs; @MikeZaccardi
• The bounce in Hong Kong-listed stocks was short-lived, capped by the 50-day moving average.

Back to Index
Emerging Markets
1. Brazil’s services output growth is slowing.

2. Mexico’s manufacturing production ended the year on a soft note.

3. Turkey’s industrial production increased in December.

4. Here is a look at food inflation in select economies.
 Source: TS Lombard
5. Finally, we have some performance data from last week.
• Currencies:

• Bond yields:

• Equity ETFs:

Back to Index
Cryptocurrency
1. Bitcoin is testing resistance near $49k.

2. Here is a look at crypto performance over the past seven days.

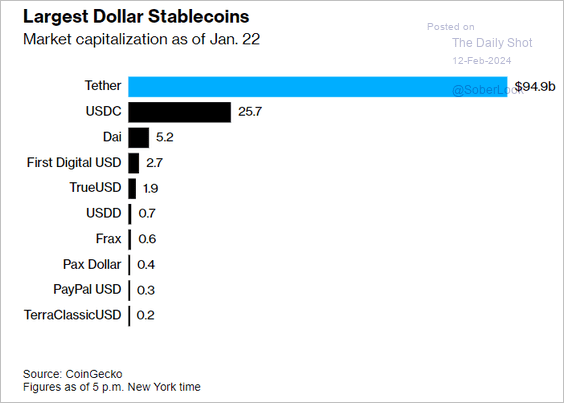
3. This chart shows the largest US dollar stablecoins.
 Source: @markets Read full article
Back to Index
Commodities
1. Rising US corn and soybean stockpiles keep pressuring prices.
 Source: Hoosier Ag Today Read full article
– Soybeans:

– Corn:

• Speculative accounts continue to raise their bets against soybeans and corn.

• Here is a look at US and Brazilian soybean exports.
 Source: @SusanNOBULL, @Barchart
• Brazilian soybean production has been slowing.
 Source: @SusanNOBULL, @Barchart
• The US continues to lose market share in corn exports.
 Source: @SusanNOBULL, @Barchart
——————–
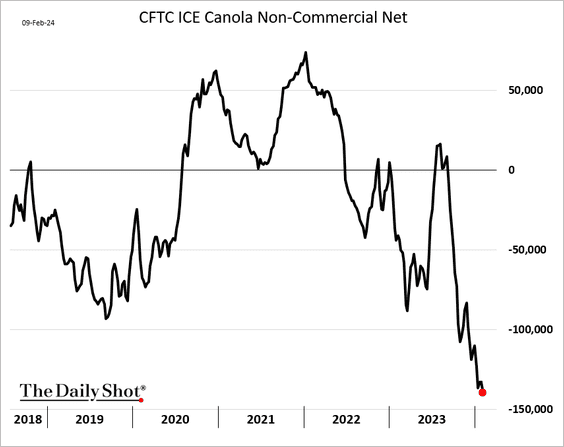
2. Sentiment in the canola market has deteriorated in recent months.
3. So far, commodity prices have generally moved in a narrow range this year, but energy prices have been volatile.
 Source: Capital Economics
4. The negative impact of El Niño on agriculture supply could fade as weather conditions appear close to peak levels.
 Source: Capital Economics
5. This chart shows last week’s performance across key commodity markets.

Back to Index
Energy
1. Saudi Arabia has around three million barrels per day of spare capacity available.
 Source: Capital Economics
2. Here is a look at US energy supply by fuel type.
 Source: Macrobond
3. US natural gas futures keep moving lower.

4. There is a growing number of proposed and planned nuclear reactor buildouts.
 Source: Alpine Macro
• Uranium prices are still well below their 2007 high.
 Source: Alpine Macro
Back to Index
Equities
1. The S&P 500 closed above 5,000 for the first time, moving deeper into overbought territory.
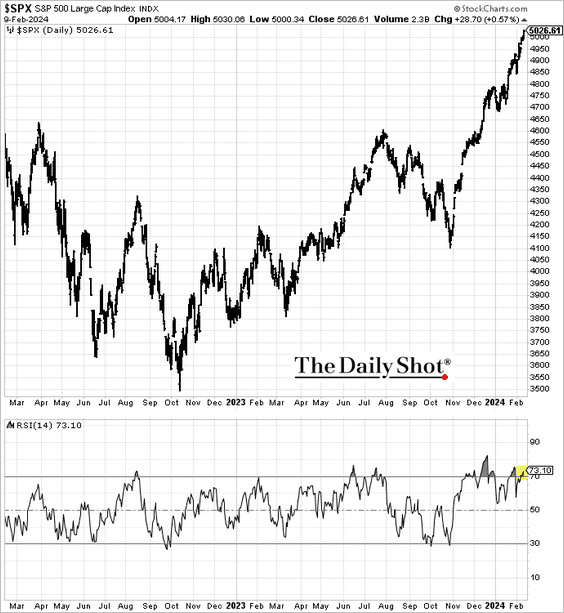
• It’s been a while since we had a 2% decline in the S&P 500.

• The last time the S&P 500 was up 14 out of 15 weeks was in 1972.

For the Nasdaq Composite, it was in 1997.

——————–
2. Next, let’s look at some trends in dividend strategies.
• US dividend strategies with low volatility and quality tilts have produced better risk-adjusted returns relative to other factors over the past 25 years. (2 charts)
 Source: @WSJ Read full article
 Source: @WSJ Read full article
• What variables predict a company’s initiation of dividends?
 Source: Goldman Sachs; @MikeZaccardi
• Companies are boosting dividends this quarter.
 Source: @seeitmarket, @ChristineLShort Read full article
• Dividend strategies’ underperformance has accelerated this year.
– High-dividend stocks:

• Dividend growers:

——————–
3. Companies are easing on CapEx/R&D and boosting share buybacks instead.
 Source: Goldman Sachs; @MikeZaccardi
4. The environment for IPOs has improved.
 Source: Goldman Sachs; @MikeZaccardi
This chart shows the number of US IPOs by year.
 Source: Goldman Sachs; @MikeZaccardi
——————–
5. The “Magnificent 7” outperformance accelerated this year.

• The “Magnificent 7” earnings growth will begin lagging the rest of the S&P 500 in Q4.
 Source: BofA Global Research
——————–
6. International stocks are trading at an increasingly deeper discount to US shares.

7. Companies with strong balance sheets have outperformed sharply this year.

8. Semiconductor shares continue to surge.

9. Finally, we have some performance data from last week.
• Sectors:

• Equity factors:

• Macro basket pairs’ relative performance:

• Thematic ETFs:

• Largest US tech firms:

Back to Index
Credit
1. US leveraged loan “weakest links” (a forward indicator of default activity) grew for a second consecutive year in 2023.
 Source: PitchBook
Software and healthcare account for the largest share of distressed loans in the US leveraged loan index.
 Source: PitchBook
——————–
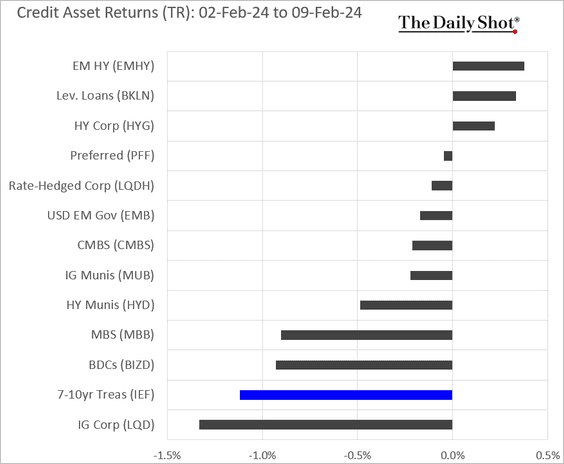
2. Here is a look at last week’s performance data.
Back to Index
Global Developments
1. Chinese developers are offloading overseas property assets as they tackle their debt issues.
 Source: @markets Read full article
2. Here is a look at real policy rates it select economies.
 Source: Macrobond
3. More easing ahead for global financial conditions?
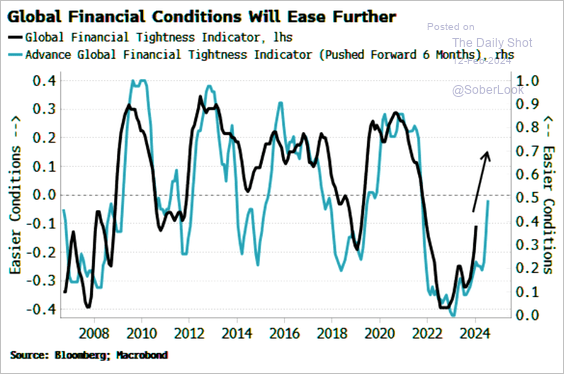 Source: Simon White, Bloomberg Markets Live Blog
4. Suez Canal traffic remains depressed.
 Source: @SusanNOBULL, @Barchart
5. Finally, we have some DM performance data from last week.
• Currencies:

• Bond yields:

• Large-cap equity indices:

——————–
Food for Thought
1. Older workers’ wage gap:
 Source: Pew Research Center Read full article
2. Data center chip spending:
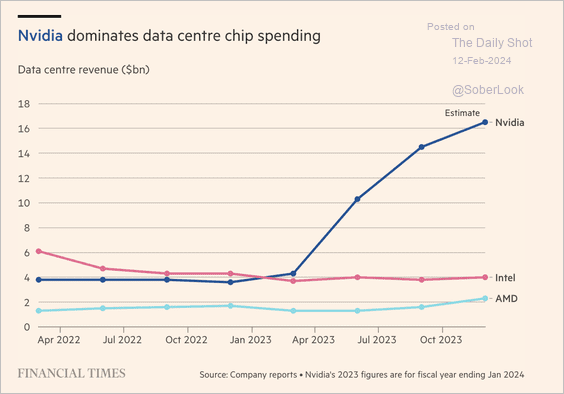 Source: @financialtimes Read full article
3. Spending on sports rights:
 Source: @WSJ Read full article
4. Confidence in US institutions:
 Source: Eurasia Group Read full article
5. US obesity rates:
 Source: J.P. Morgan Asset Management
6. Press freedom index:
 Source: @financialtimes Read full article
7. Lunar New Year celebrations:
 Source: Statista
 Source: USA Today Read full article
• The Chinese Zodiac:
 Source: USA Today Read full article
——————–
Back to Index