
The Daily Shot: 09-Feb-24
• The United States
• Canada
• The Eurozone
• Europe
• Japan
• China
• Emerging Markets
• Cryptocurrency
• Commodities
• Energy
• Equities
• Alternatives
• Credit
• Rates
• Global Developments
• Food for Thought
The United States
1. Initial jobless claims eased last week, dropping back below the average of recent years (ex. 2020 and 2021).


Here is a look at continuing jobless claims


——————–
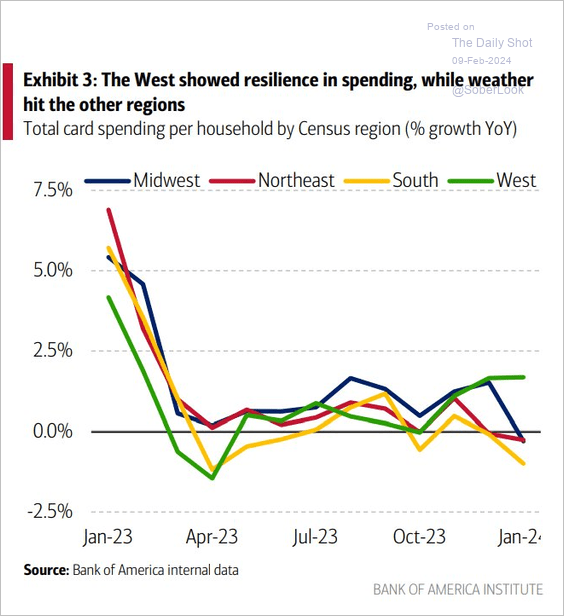
2. Freezing weather conditions hampered card spending in January.
 Source: BofA Global Research; @MikeZaccardi
• Discretionary spending was resilient.
 Source: BofA Global Research; @MikeZaccardi
• The chart below shows credit card utilization across income groups.
 Source: BofA Global Research; @MikeZaccardi
Correction:
• This is the correct first chart of yesterday’s Daily Shot.

——————–
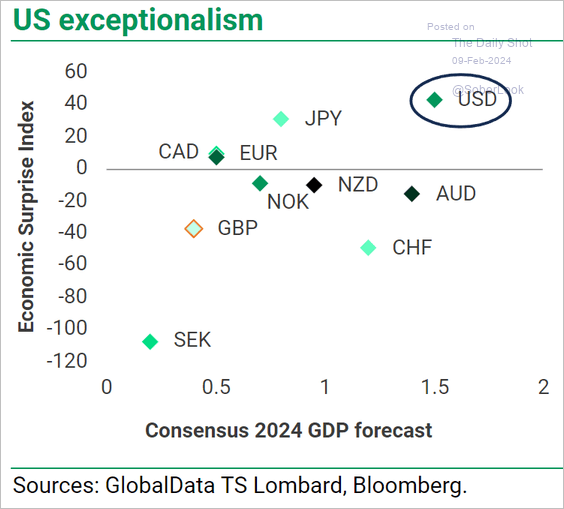
3. The US economic surprise index keeps climbing, …
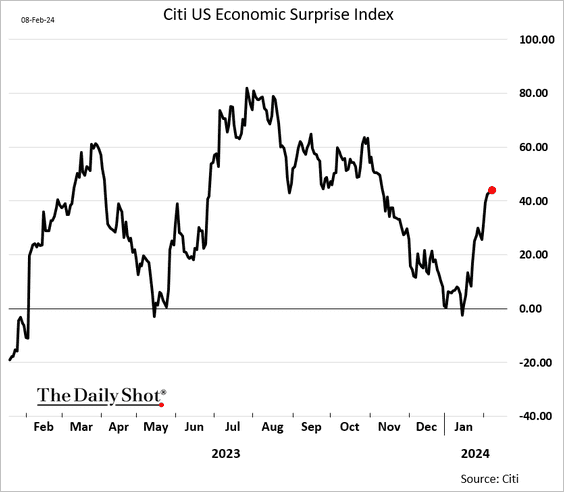
… outpacing other advanced economies.
 Source: TS Lombard
——————–
4. US financial conditions continue to ease.
 Source: Oxford Economics
• Policy uncertainty rises substantially in the months leading up to a US presidential election.
 Source: Convera
——————–
5. Could we see upward revisions to the CPI data?
 Source: @economics Read full article
6. Who is right about US imports from China?
 Source: @financialtimes Read full article
7. Finally, we have some updates on the US fiscal situation.
• Primary deficit projections have been revised lower.
 Source: @BBKogan
• However, the government’s key challenge will be soaring interest expenses, …
 Source: @axios Read full article
… blowing out the total budget deficit.
 Source: Economics and Strategy Group, National Bank of Canada
 Source: @axios Read full article
• Debt servicing will overtake defense spending this year.
 Source: Economics and Strategy Group, National Bank of Canada
• This chart shows the CBO’s debt/GDP forecasts over the last decade. The COVID era saw a surge in the long-range forecasts, but these have now returned (red line) toward 2017 projections.
 Source: Deutsche Bank Research
Back to Index
Canada
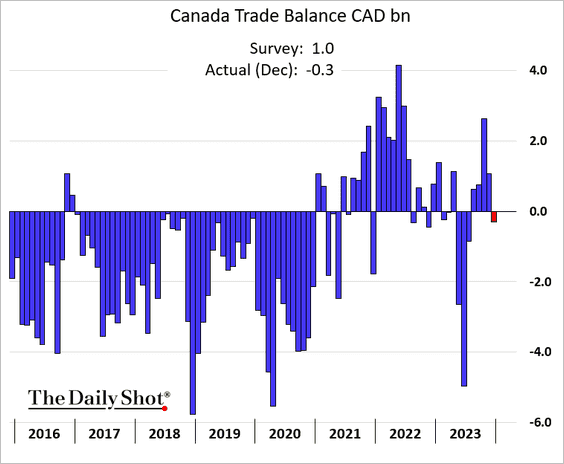
1. The trade balance unexpectedly swung into deficit in December.
2. Bond yields have shifted higher in recent days.

3. Breadth is starting to weaken in the TSX Composite Index.
 Source: Aazan Habib, Paradigm Capital
Back to Index
The Eurozone
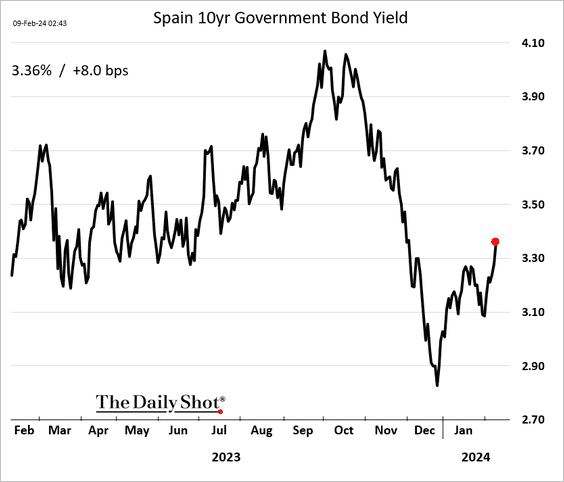
1. Yields are rebounding.
2. Germany’s property market is in trouble.
 Source: Reuters Read full article
3. Inflation expectations remain well-anchored.
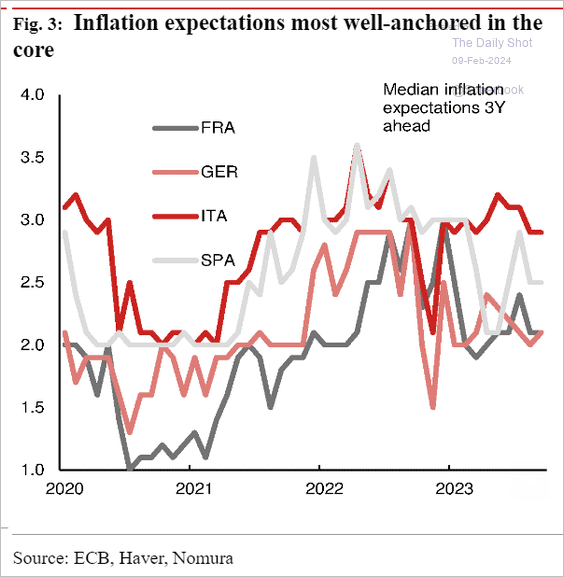 Source: Nomura Securities
4. PMI data from Sweden signal a rebound in euro-area manufacturing activity.
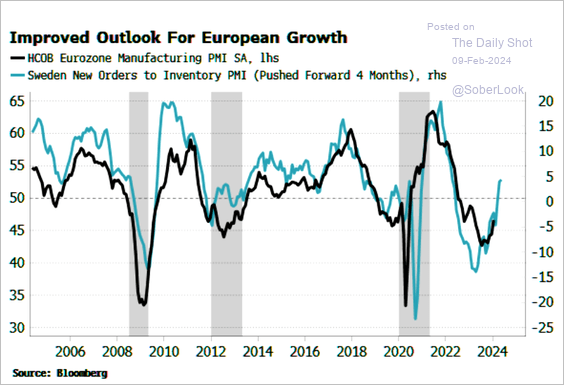 Source: Simon White, Bloomberg Markets Live Blog
Back to Index
Europe
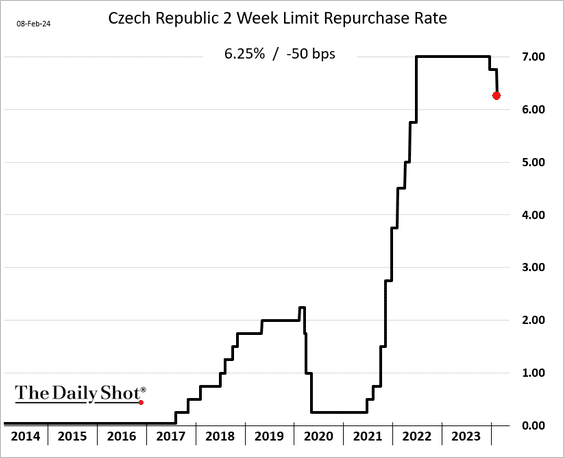
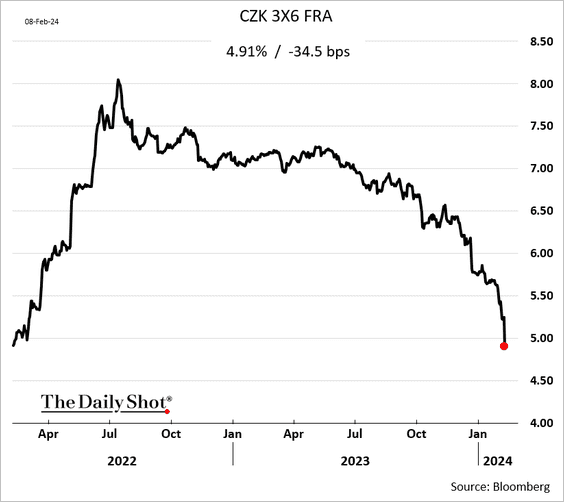
1. The Czech Republic’s central bank unexpectedly cut rates by 50 basis points, surpassing market expectations of a 25-basis-point reduction.
 Source: Reuters Read full article
• Czech unemployment moved higher last month.

• Short-term rate expectations tumbled further after the rate cut surprise (2 charts).

• The Czech koruna plunged.

——————–
2. Next, we have some data on municipal waste in the EU.
 Source: Eurostat Read full article
Back to Index
Japan
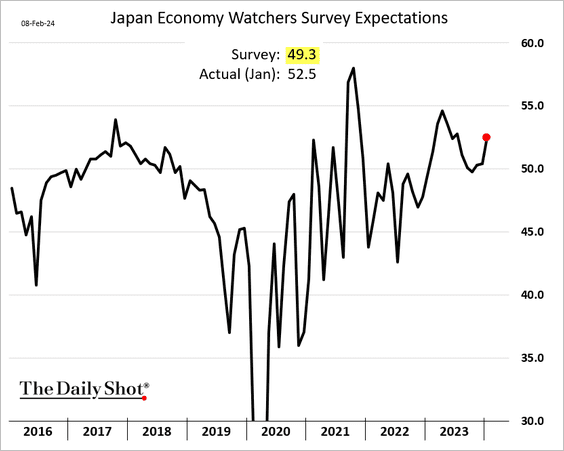
1. Japan’s Economy Watchers Survey showed a rebound in sentiment last month.
2. Growth in the broad money supply appears to have bottomed.

3. Here is a look at Japan’s Nifty 15 in the 1990s.
 Source: BofA Global Research
Back to Index
China
1. The CSI 300 index climbed past its 50-day moving average.
 Source: @TheTerminal, Bloomberg Finance L.P.
2. Some economic growth indicators, such as electricity consumption and commodity import volumes, have stabilized.
 Source: MRB Partners
3. The PBoC’s claims on commercial banks have spiked sharply in recent months.
 Source: Alpine Macro
• Typically, stock prices rise as the PBoC’s balance sheet expands.
 Source: Alpine Macro
Back to Index
Emerging Markets
1. The Chilean peso remains under pressure.

The nation’s vehicle sales were below last year’s levels in January.

——————–
2. Banxico kept rates steady …

… as inflation (slightly) surpassed anticipated levels.

——————–
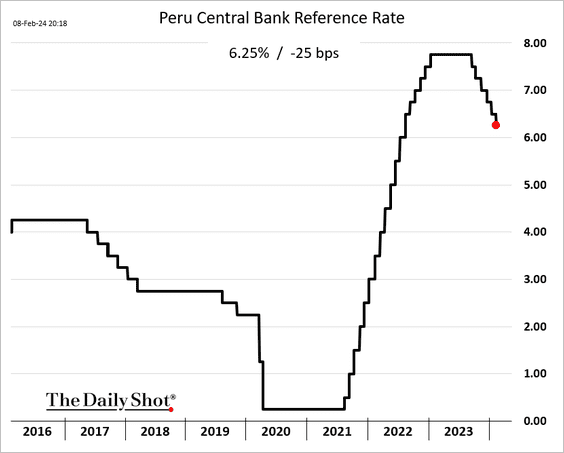
3. Peru cut rates again.
4. South Africa’s manufacturing output remains well below pre-COVID levels.

• The real value of loans from the South African banking sector has been flat over the last eight years or so, with credit extension to the public sector declining even in nominal terms. However, banks have dramatically increased their investments in government assets such as sovereign debt. This has partly reflected regulatory requirements for banks to hold higher levels of such assets but also attractive relative returns (as we suggested in this earlier post). This raises concerns about the possibility that such regulations might be reinforcing the crowding-out effects of the relative steepness of the South African sovereign yield curve on private credit.
 Source: Codera Analytics
——————–
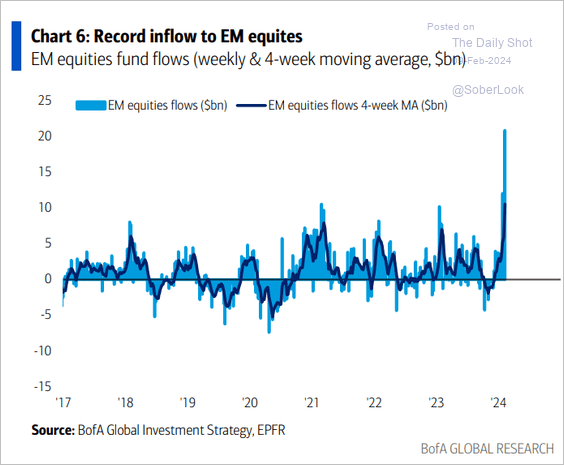
5. Flows into EM equity funds have been surging.
 Source: BofA Global Research
Back to Index
Cryptocurrency
1. It was a good week for cryptos, with bitcoin and ether outperforming top tokens.
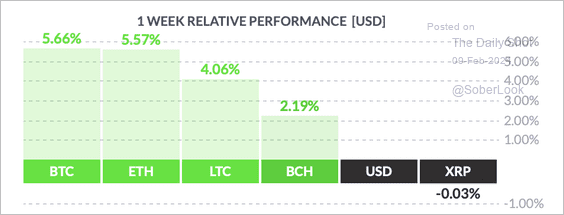 Source: FinViz
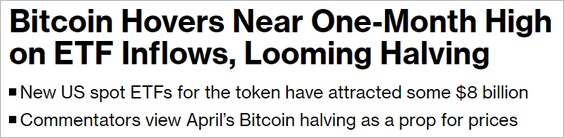
• Bitcoin is back near $46k.

 Source: @crypto Read full article
——————–
2. The iShares Bitcoin ETF (IBIT) and Fidelity Advantage Bitcoin ETF (FBTC) are the top two ETFs by assets after one month on the market.
 Source: @EricBalchunas
3. Bitcoin and Ethereum have a much higher risk/return profile than traditional assets.
 Source: Grayscale Read full article
• Hypothetically, the risk-adjusted return of a 60% stock/40% bond portfolio could rise with a maximum 5% allocation to bitcoin, …
 Source: Grayscale Read full article
… assuming investors effectively rebalance (funding bitcoin proportionately from stocks and bonds).
 Source: Grayscale Read full article
Back to Index
Commodities
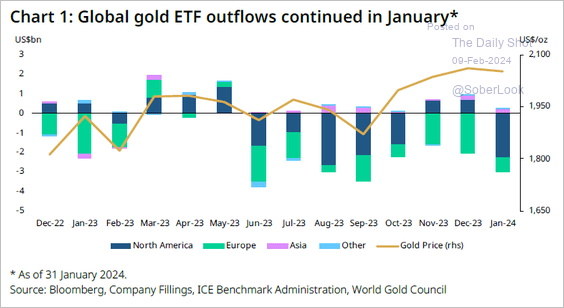
1. Global gold ETFs continued to see outflows.
 Source: @KrishanGopaul
• Here is a look at the largest gold purchasers by country last year.
 Source: @KrishanGopaul
——————–
2. Cocoa continues to soar ahead of Valentine’s Day.

 Source: CNBC Read full article
——————–
3. La Niña is coming …
 Source: @axios Read full article
Back to Index
Energy
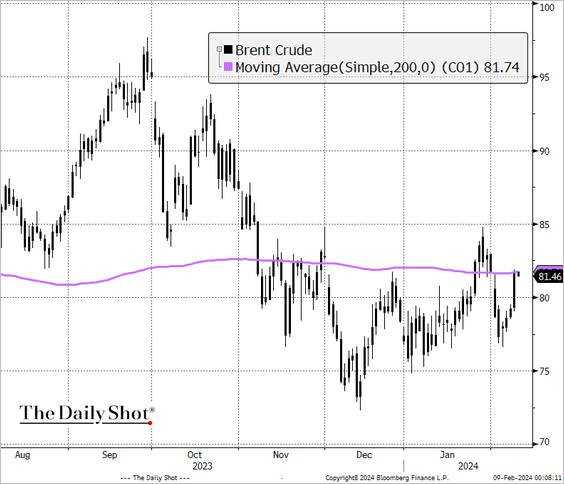
1. Brent is holding resistance at the 200-day moving average.
 Source: @TheTerminal, Bloomberg Finance L.P.
• The NYMEX WTI crude futures are holding support above their 50-day moving average, although long-term momentum remains negative.

——————–
2. Elevated geopolitical risk supported the recent rise in the Brent oil price.
 Source: Numera Analytics (@NumeraAnalytics)
• Softer production growth also supported oil prices.
 Source: Numera Analytics (@NumeraAnalytics)
——————–
3. US natural gas futures hit the lowest level since 2020.
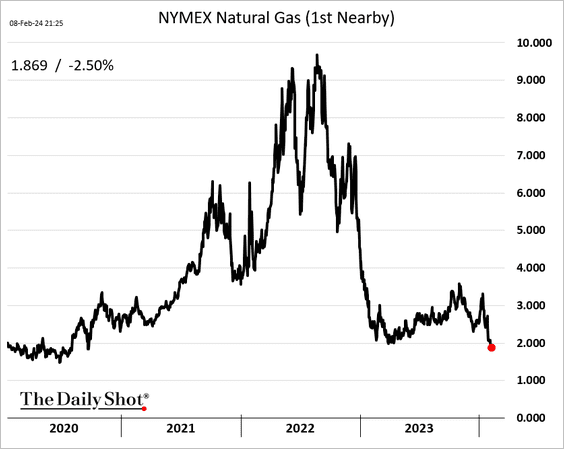
 Source: Barron’s Read full article
Gas in storage is back outside its five-year range.

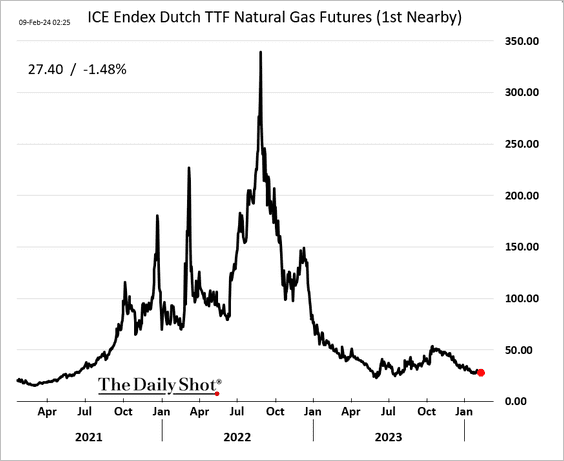
4. European gas futures are also trending lower.
Back to Index
Equities
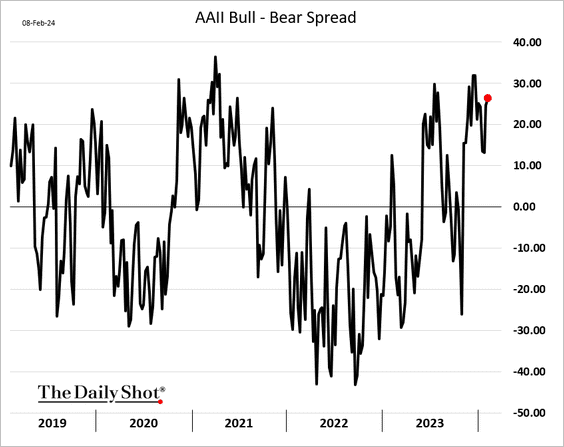
1. Retail investors remain bullish.
• Investment managers have also boosted allocations.
 Source: NAAIM
——————–
2. This chart shows the multi-decade outperformance of the Nasdaq 100 over the Nasdaq Composite (ratio of the two indices).
 h/t @ResearchQf
3. The S&P 500 hit another all-time high while the Russell 2000 remains in bear-market territory.

This scenario last occurred in 1998, after which the S&P 500 maintained its superior performance over the Russell 2000.
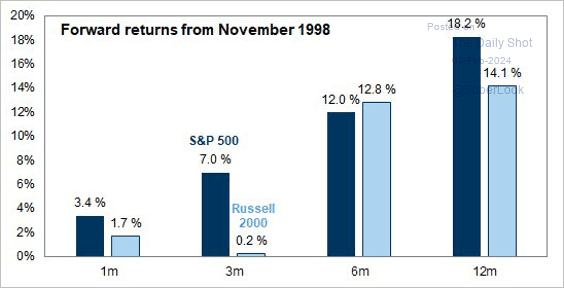 Source: Goldman Sachs; @carlquintanilla
• Separately, the Russell 2000 is in a wedge pattern.
 h/t @MikeZaccardi
——————–
4. The S&P 500 intraday range has been moving lower this week.

5. The stock-bond correlation has weakened lately.

6. 2024 kicked off with strong share buyback activity.
 Source: @markets Read full article
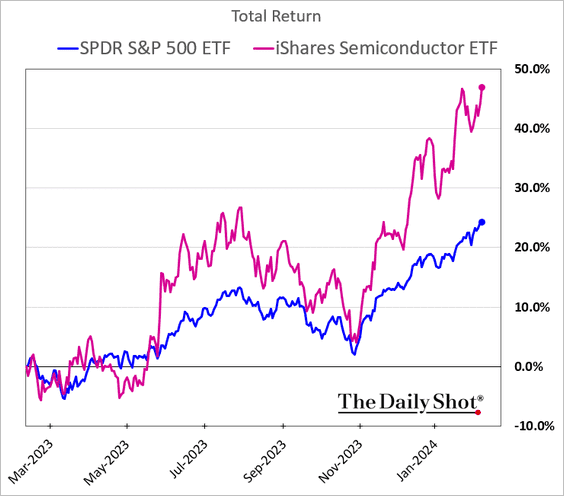
7. It appears that semiconductor stocks have priced in a strong rebound in chip sales.
 Source: Numera Analytics (@NumeraAnalytics)
——————–
8. Real estate funds are seeing outflows.
 Source: BofA Global Research
9. Vanguard passed BlackRock in equity ETF asset market share.
 Source: @EricBalchunas
Back to Index
Alternatives
1. US startup acquisitions were slightly down last year, although there has been a preference for companies with smaller employee headcounts.
 Source: Carta
2. VC activity edged higher in January.
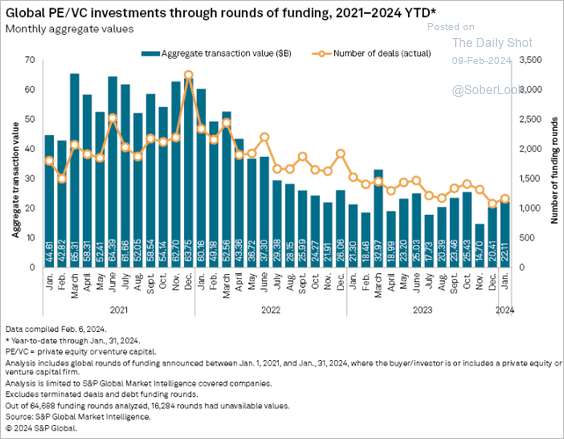 Source: S&P Global Market Intelligence
3. Here is a look at VC dry powder.
 Source: @financialtimes Read full article
4. How much of the recent M&A activity was sponsor-backed?
 Source: @theleadleft
5. Institutions are committing more capital to secondaries.
 Source: @theleadleft
Back to Index
Credit
1. Money market funds’ AUM hit a new record.

2. Investment-grade bond fund flows remain robust.
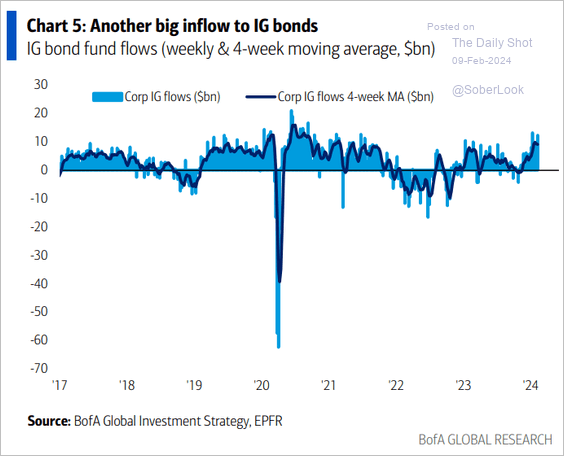 Source: BofA Global Research
3. Historical global investment-grade bond maturities remain below recent issuance volumes.
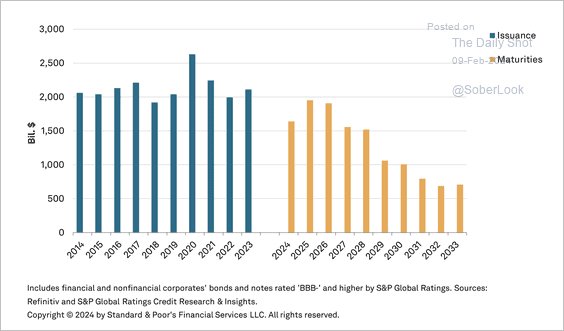 Source: S&P Global Ratings
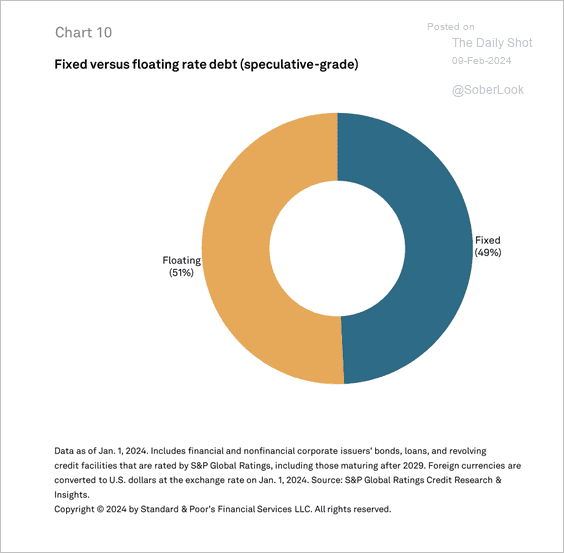
4. Speculative-grade debt comprises a significantly larger proportion of floating-rate instruments, such as loans and revolving credit facilities, compared to investment-grade debt. (2 charts)
 Source: S&P Global Ratings
 Source: S&P Global Ratings
——————–
5. Here is a look at asset-backed lending (ABL) market segments.

• Below is the ABL maturity wall.
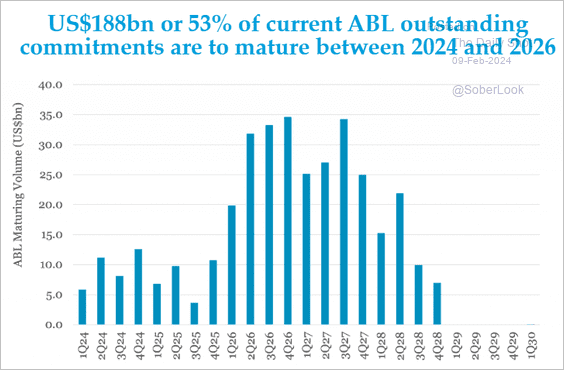 Source: @theleadleft
——————–
6. Strong inflows into fixed annuities boost demand for credit from insurance firms.
 Source: Deutsche Bank Research
Back to Index
Rates
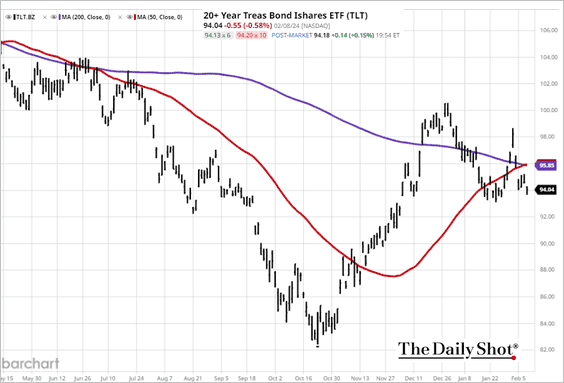
1. TLT formed a golden cross.
2. Spikes in real rates tend to “break things.”
 Source: BofA Global Research
3. Very few investors expect to see Treasury yields above 5%. A contrarian signal?
 Source: Goldman Sachs; Simon White, Bloomberg Markets Live Blog
Back to Index
Global Developments
1. The dollar is holding long-term support above its 40-month moving average.

• Over the long run, the dollar has been correlated to US equities’ outperformance vs. the rest of the world.
 Source: TS Lombard
——————–
2. The global yield curve has “uninverted.”
 Source: Simon White, Bloomberg Markets Live Blog
3. This chart shows the drivers of inflation in G7 economies.
 Source: OECD Read full article
——————–
Food for Thought
1. Real estate agents per 1000 jobs:
 Source: @axios Read full article
2. Cheaper to rent or buy?
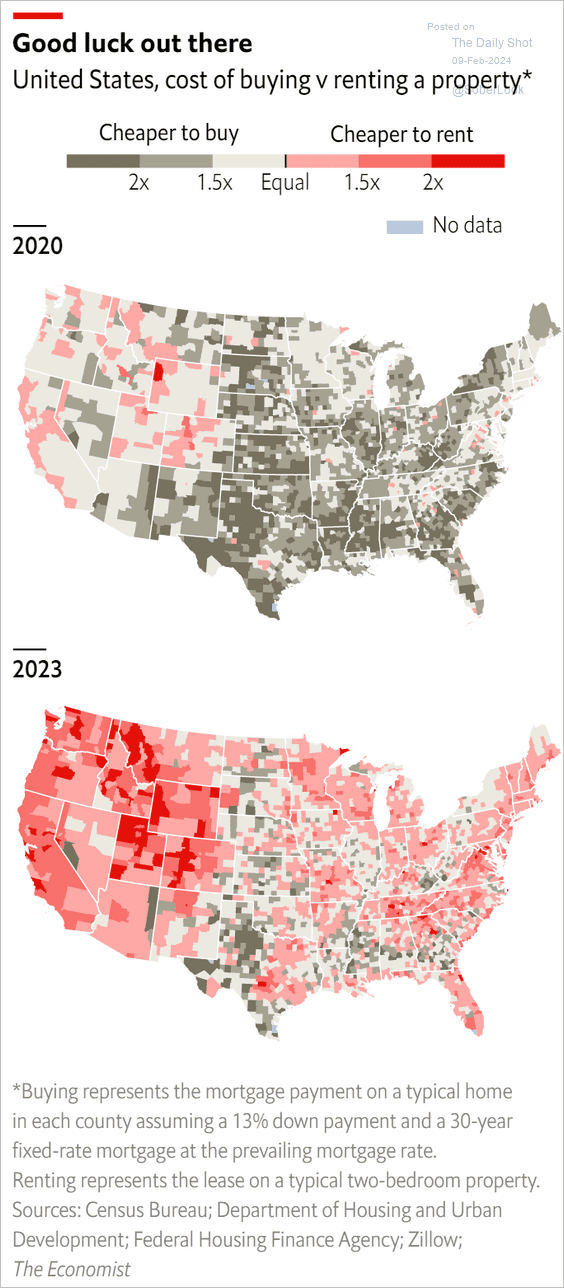 Source: The Economist Read full article
3. Tesla’s and BYD’s income statements:
 Source: @genuine_impact
4. Roku’s revenue:
 Source: @chartrdaily
5. Spending on pharmaceuticals:
 Source: @chartrdaily
6. A very warm January:
 Source: Climate Reanalyzer
7. Dissatisfaction with democracy:
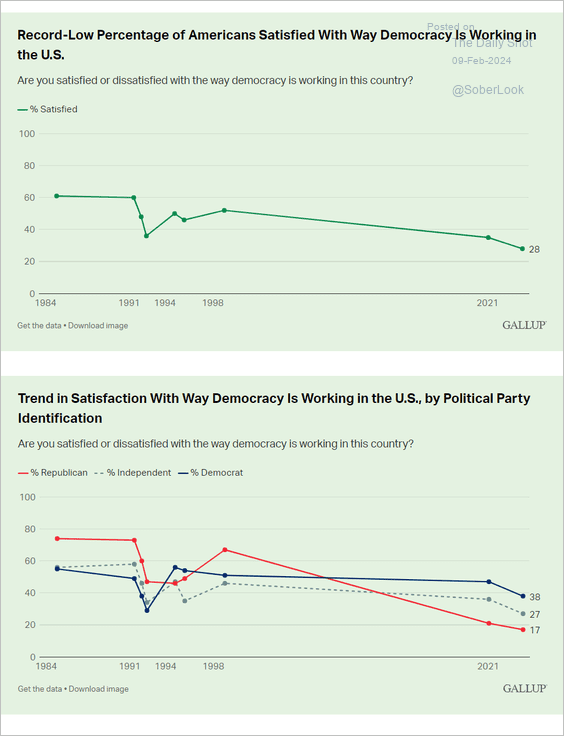 Source: Gallup Read full article
8. Super Bowl ads with celebrities:
 Source: @WSJ Read full article
• The cost of a 30-second Super Bowl commercial:
 Source: @WSJ Read full article
• Super Bowl viewership:
 Source: @WSJ Read full article
– US top 50 primetime-TV broadcasts:
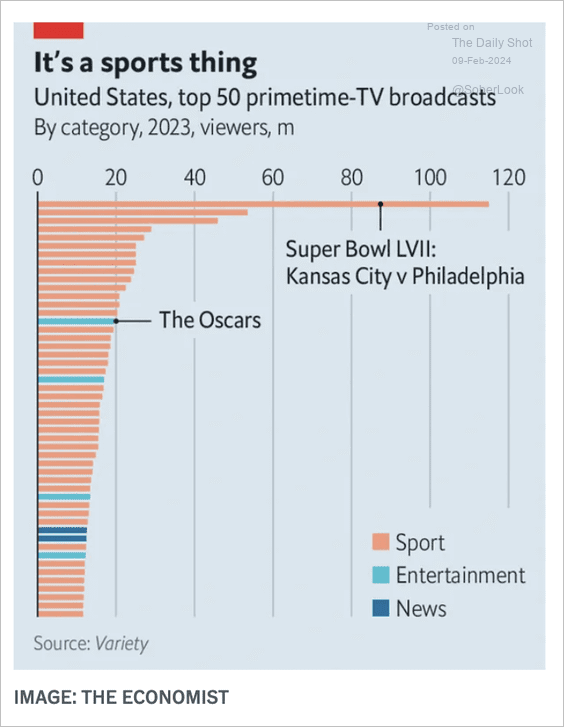 Source: The Economist Read full article
——————–
Have a great weekend!
Back to Index