
The Daily Shot: 14-Dec-21
• The United States
• The United Kingdom
• The Eurozone
• Asia – Pacific
• China
• Emerging Markets
• Cryptocurrency
• Commodities
• Energy
• Equities
• Alternatives
• Rates
• Global Developments
• Food for Thought
The United States
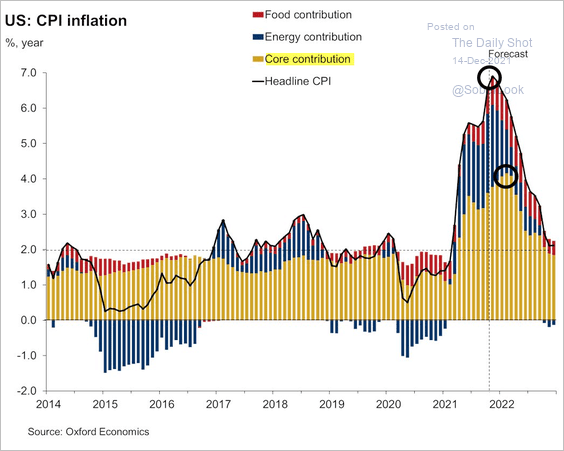
1. Let’s begin with some updates on inflation.
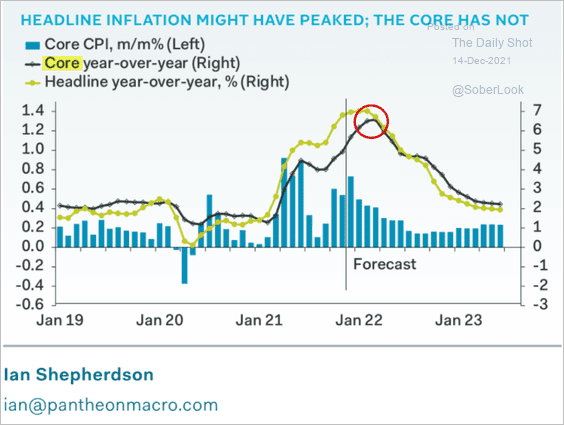
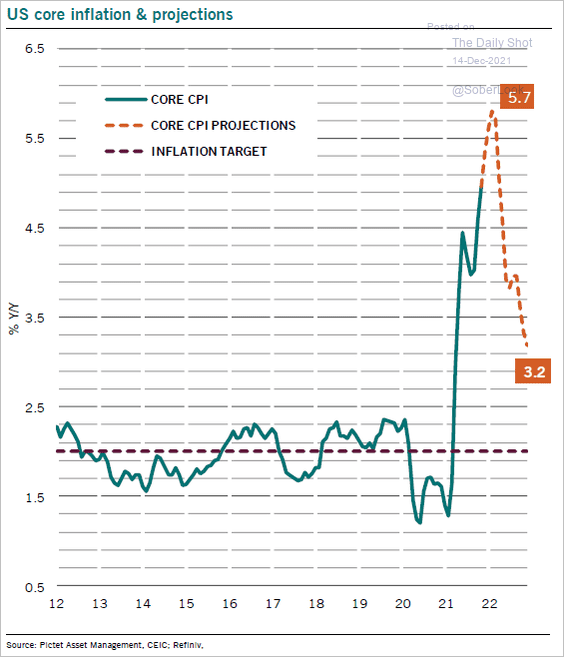
• Forecasts suggest that the headline CPI is peaking, but the core CPI will keep climbing over the next few months.
– Oxford Economics:
 Source: Oxford Economics
– Pantheon Macroeconomics:
 Source: Pantheon Macroeconomics
– Pictet Wealth Management:
 Source: @RollinFrederic, @PkZweifel
Rent is expected to keep upward pressure on the core CPI (2 charts).
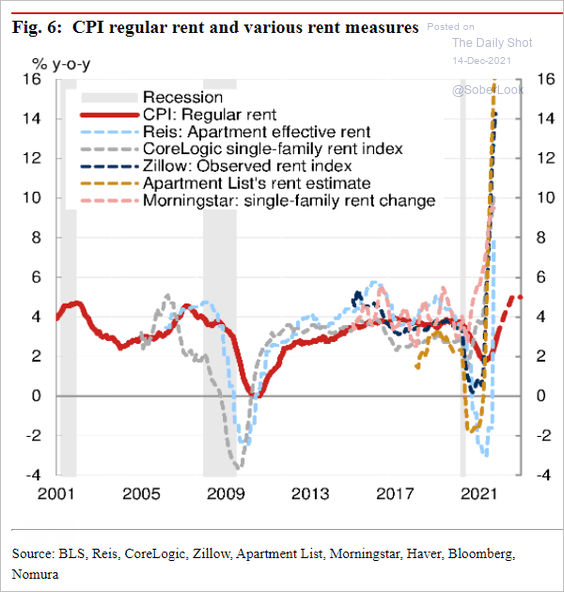 Source: Nomura Securities
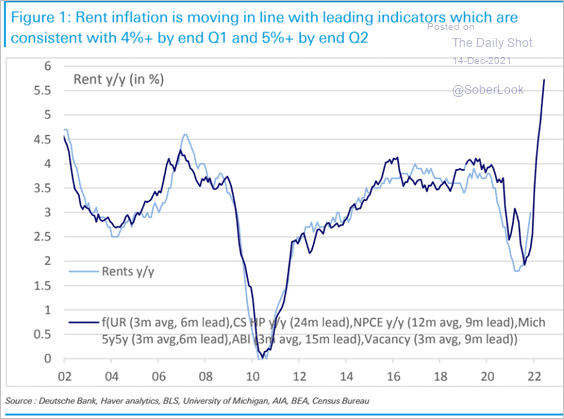 Source: Deutsche Bank Research
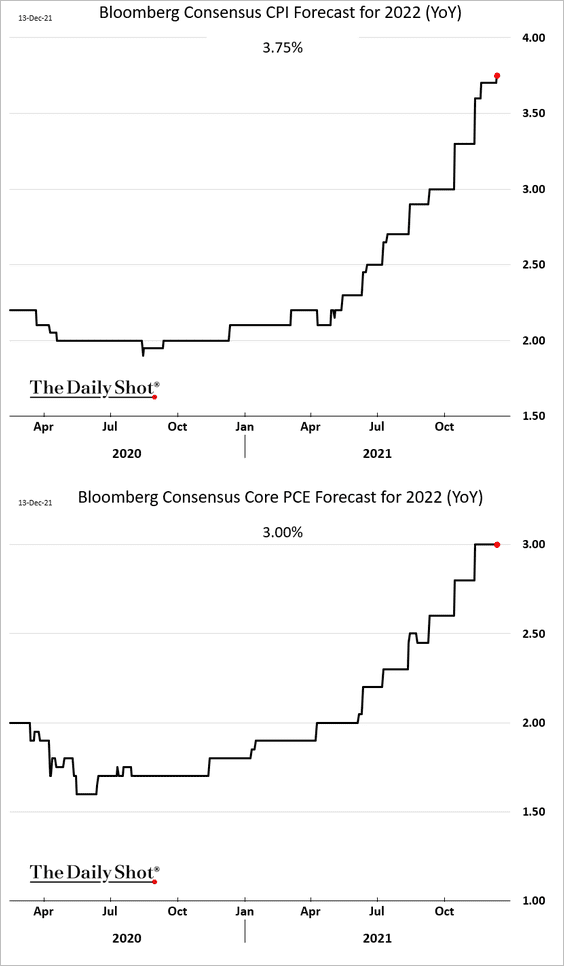
• Inflation peaking doesn’t mean that it will return to pre-COVID levels. Economists continue to boost their inflation forecasts for next year, with projections now well above the Fed’s target.
– Here is a survey from Deutsche Bank showing upside inflation risk.
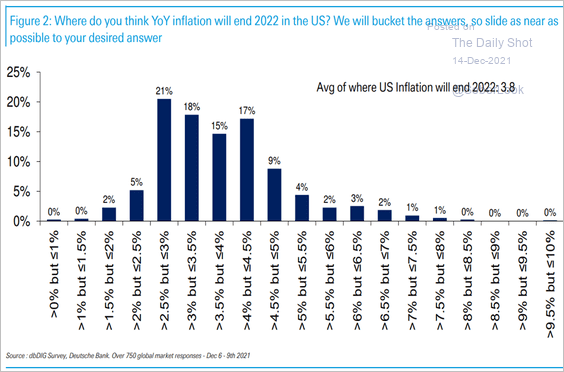 Source: Deutsche Bank Research
– And this chart shows the PCE inflation distribution of outcomes from Numera Analytics (see comment below).
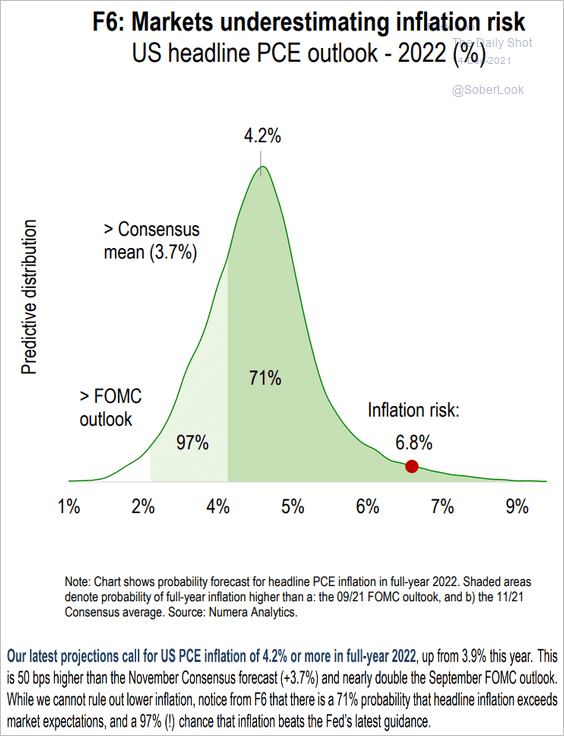 Source: Numera Analytics
• Used vehicles could become a drag on the core CPI later in the year.
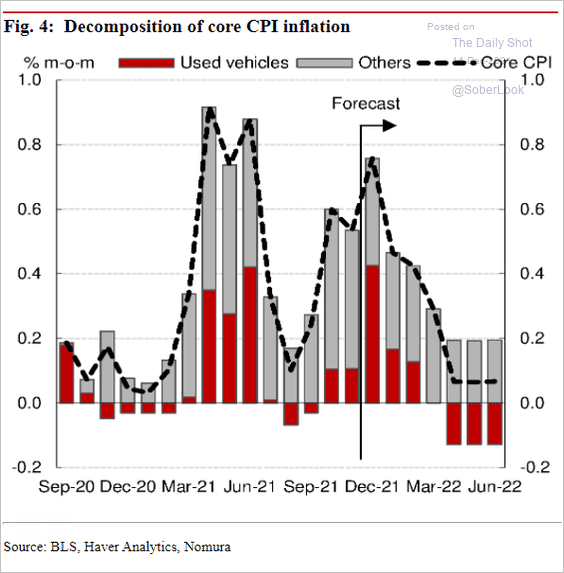 Source: Nomura Securities
• Flows into inflation mutual funds have slowed.
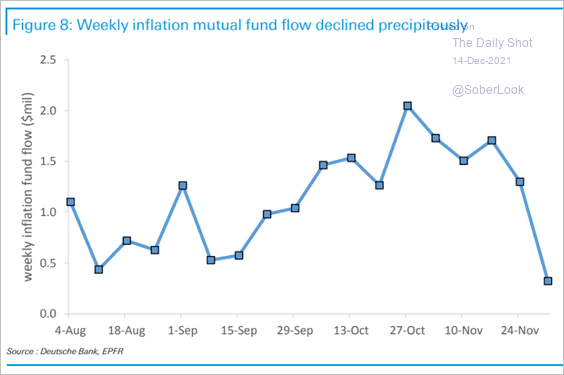 Source: Deutsche Bank Research
• One-year consumer inflation expectations continue to surge, but the three-year indicator seems to have peaked.
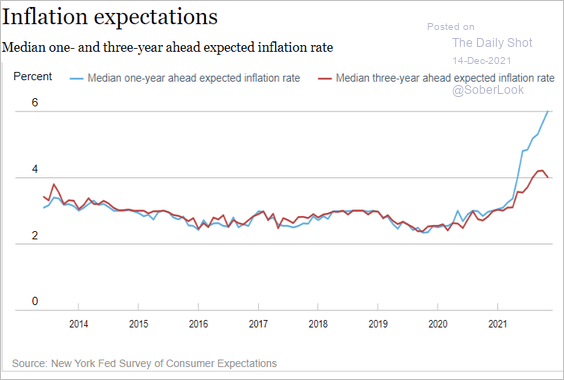 Source: NY Fed
Households expect to boost their spending substantially next year.
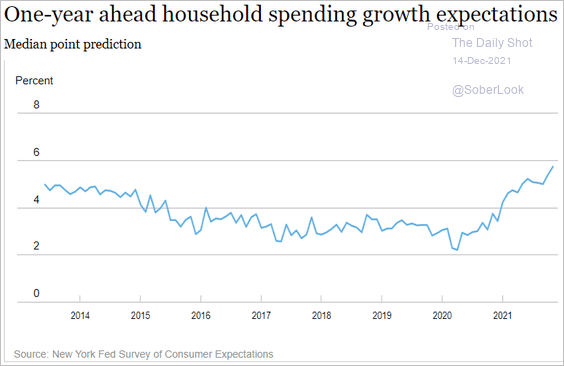 Source: NY Fed
——————–
2. Next, let’s take a look at monetary policy.
• When will the Fed end quantitative easing (fund manager survey)?
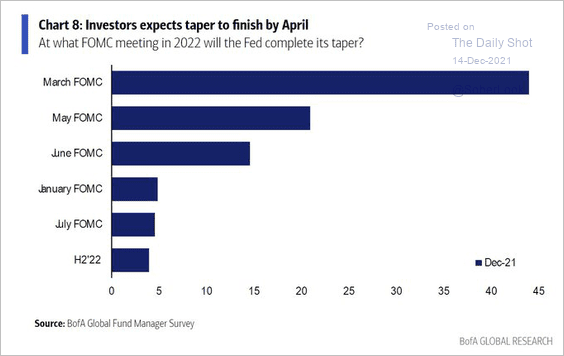 Source: BofA Global Research; @Callum_Thomas
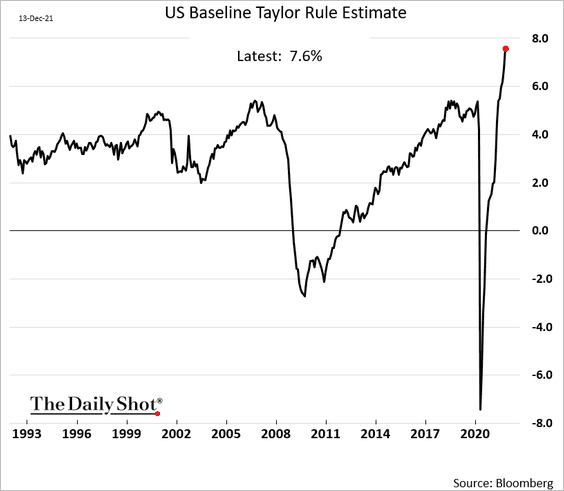
• The Taylor rule implies that the fed funds rate should be 7.6%.
• Jefferies expects the FOMC’s dot plot to shift substantially higher.
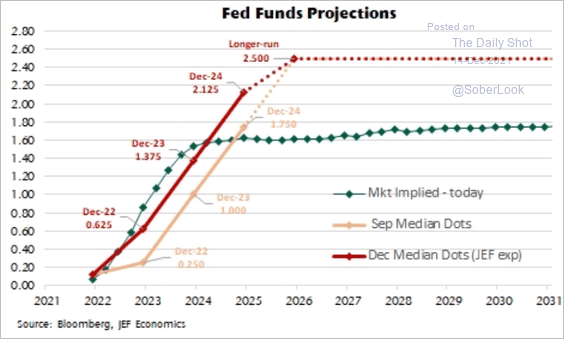 Source: Jefferies
——————–
3. What are surveys telling us about supply strains?
• Morgan Stanley:
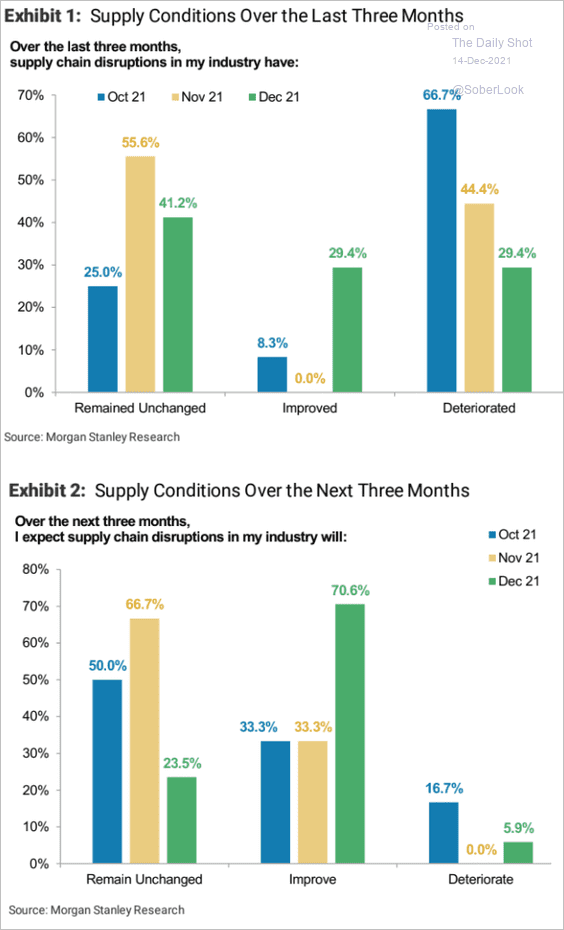 Source: Morgan Stanley Research
• Oxford Economics:
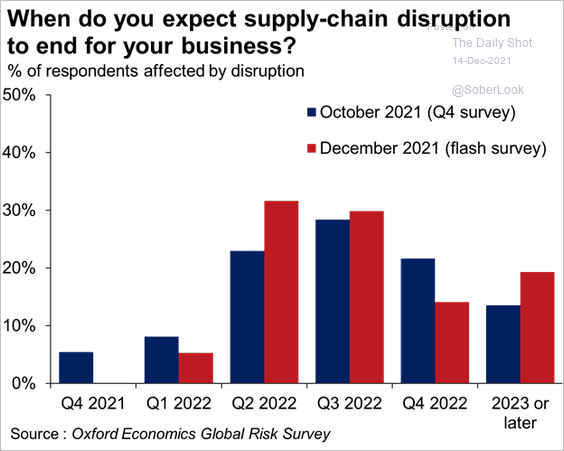 Source: @GregDaco
——————–
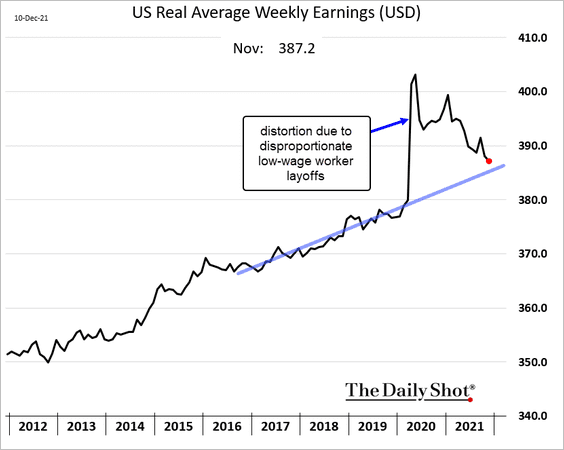
4. US real wages are rapidly returning to their pre-COVID trend as inflation spikes.
5. State tax receipts have improved markedly this year.
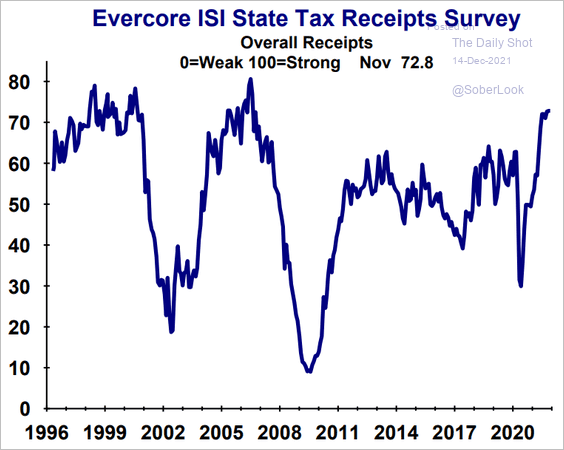 Source: Evercore ISI Research
6. This chart shows the Yardeni Boom-Bust Barometer. It’s the ratio of the CRB industrial commodities index to initial unemployment claims.
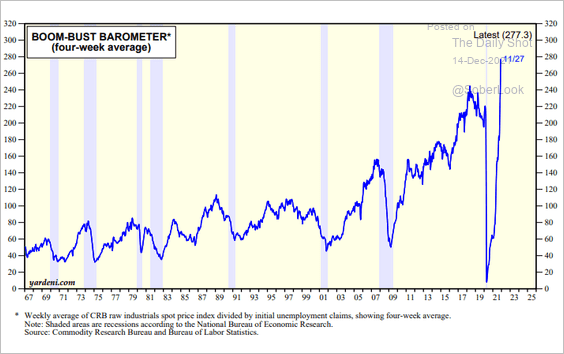 Source: Yardeni Research
Back to Index
The United Kingdom
1. The odds of a BoE rate hike this year have collapsed below 20% amid omicron jitters.
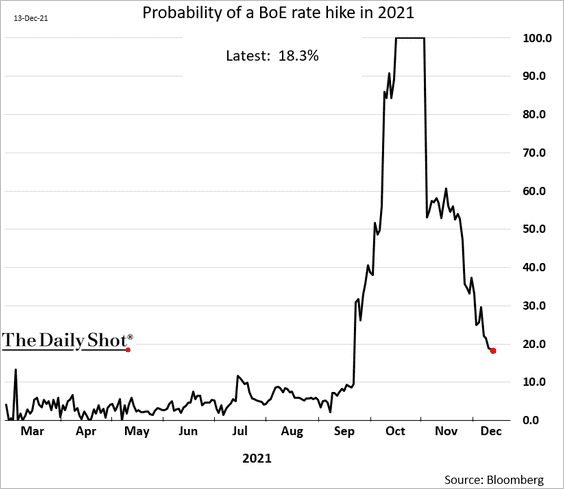
In contrast, the Fed is becoming more hawkish, putting downward pressure on the pound.
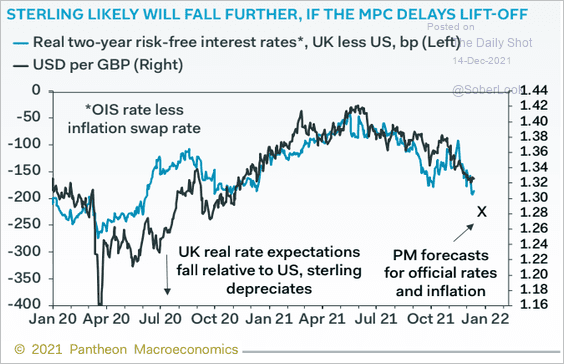 Source: Pantheon Macroeconomics
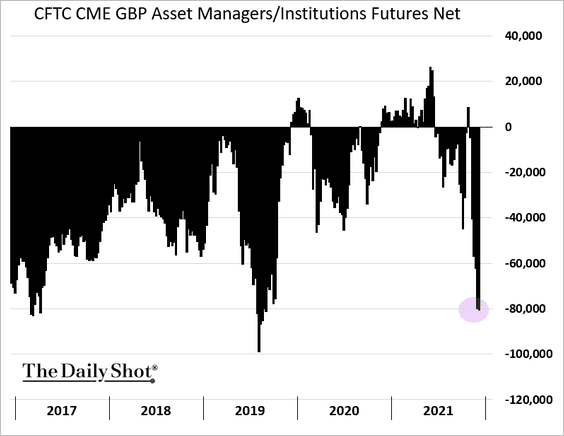
Asset managers have increased their bets against the pound.
——————–
2. UK stocks remain attractive based on the relative PE ratio.
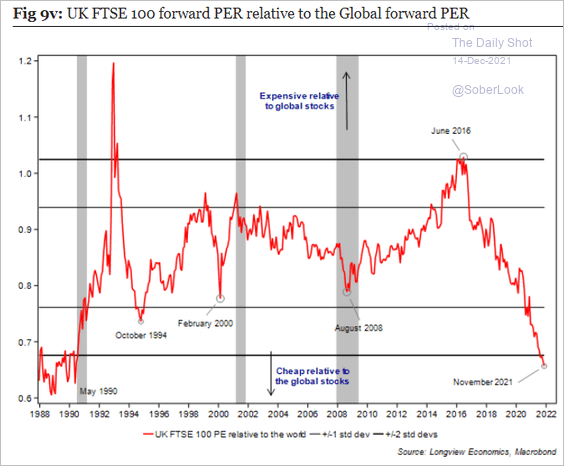 Source: Longview Economics
3. Public-sector employment has outpaced private sectors.
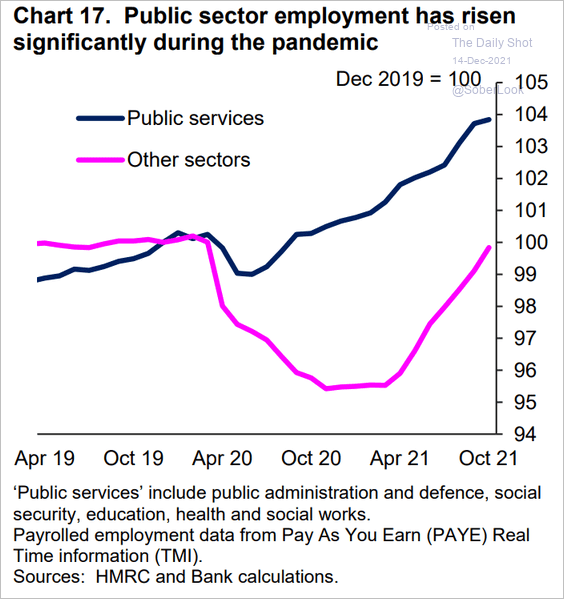 Source: BoE Read full article
Back to Index
The Eurozone
1. Natural gas prices hit a record high, …
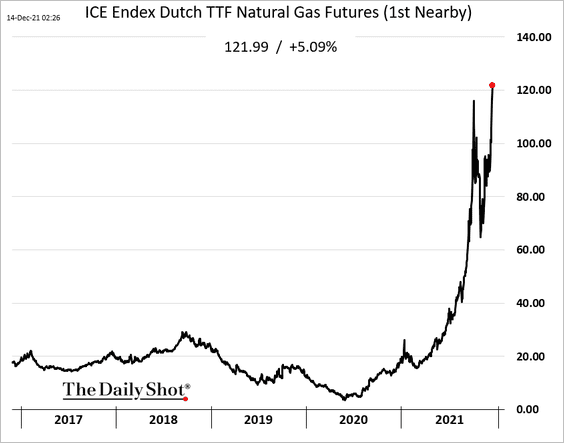
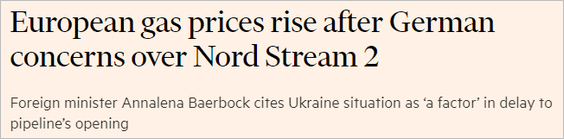 Source: @financialtimes Read full article
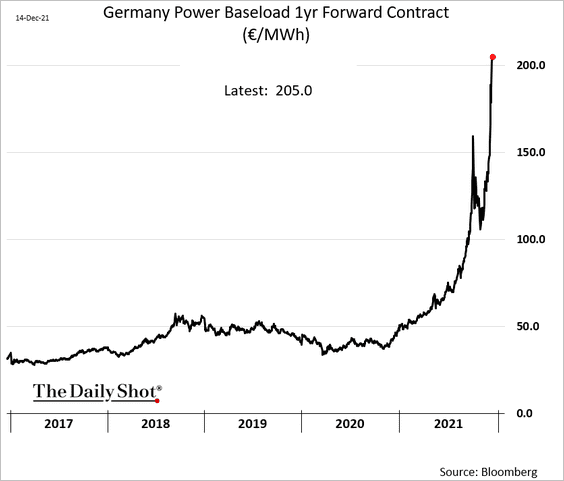
… and so are German power prices (one year out). These trends will feed into producer and consumer prices in the months ahead.
——————–
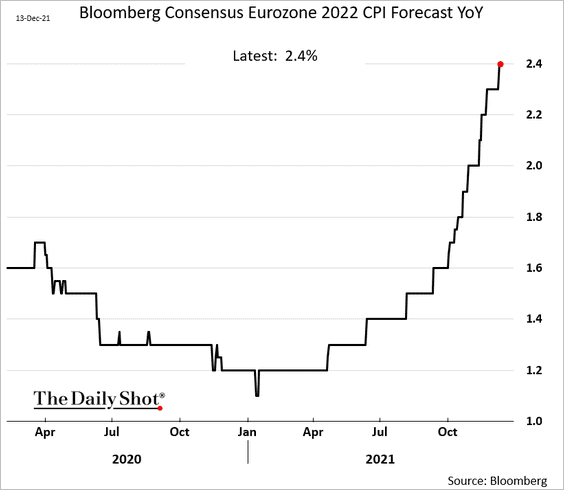
2. Economists continue to boost their forecasts for euro-area inflation next year.
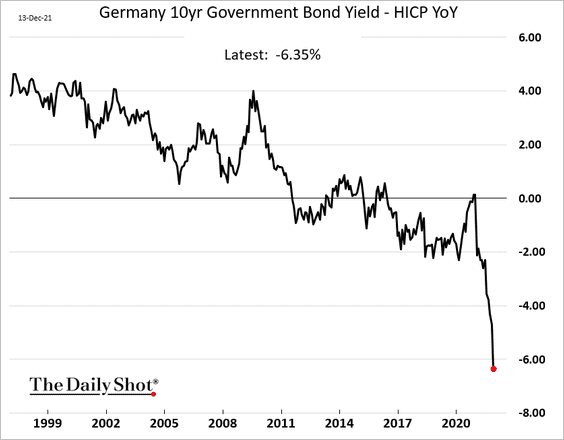
3. Here is the 10yr Bund yield adjusted for inflation.
4. Real wage growth in the Eurozone is deeply negative.
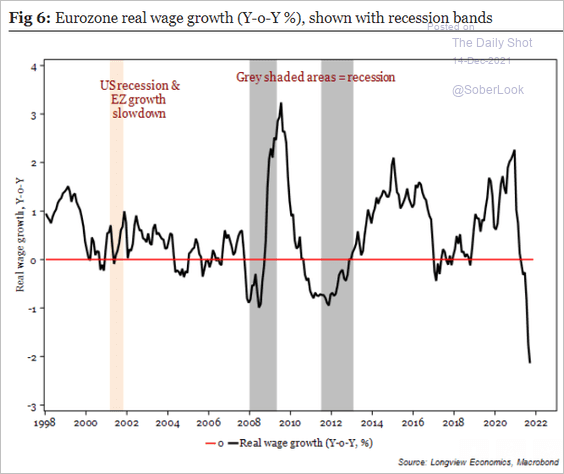 Source: Longview Economics
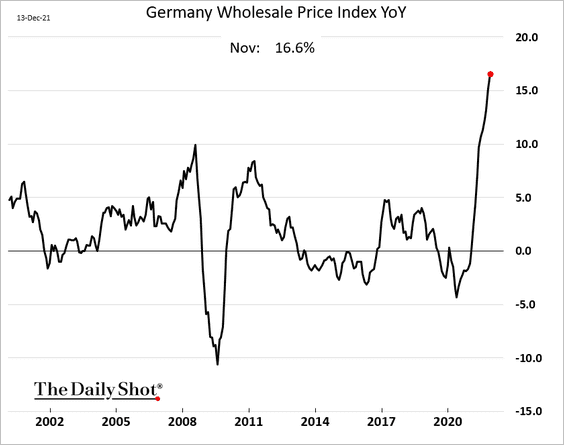
5. Next, we have some updates on Germany.
• Wholesale prices:
• Exports to China and the US:
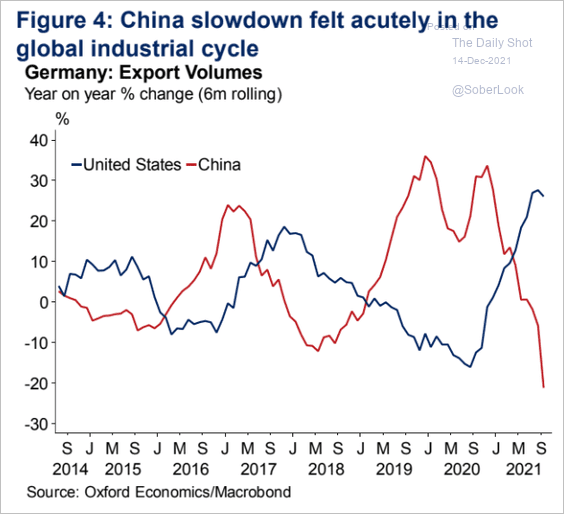 Source: Oxford Economics
• Older germans falling ill with COVID despite being fully vaccinated:
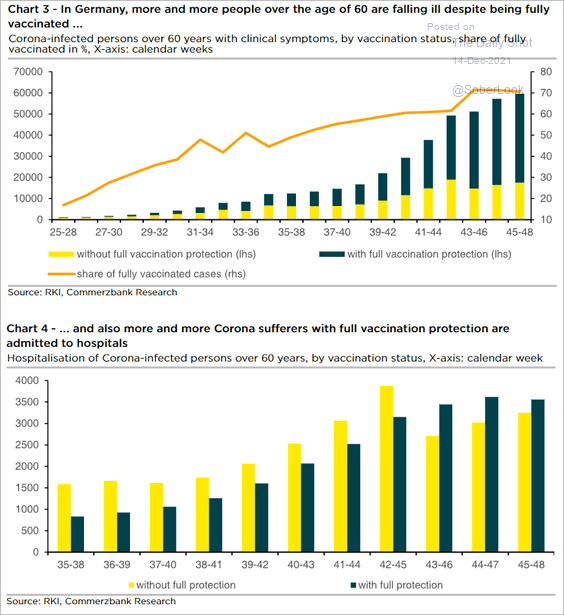 Source: Commerzbank Research
• Visits to restaurants and shops:
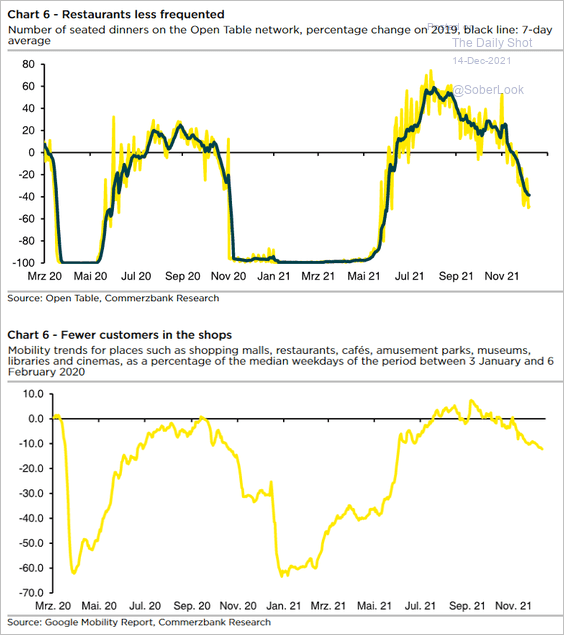 Source: Commerzbank Research
Back to Index
Asia – Pacific
1. Japan’s Beveridge Curve has diverged from the US.
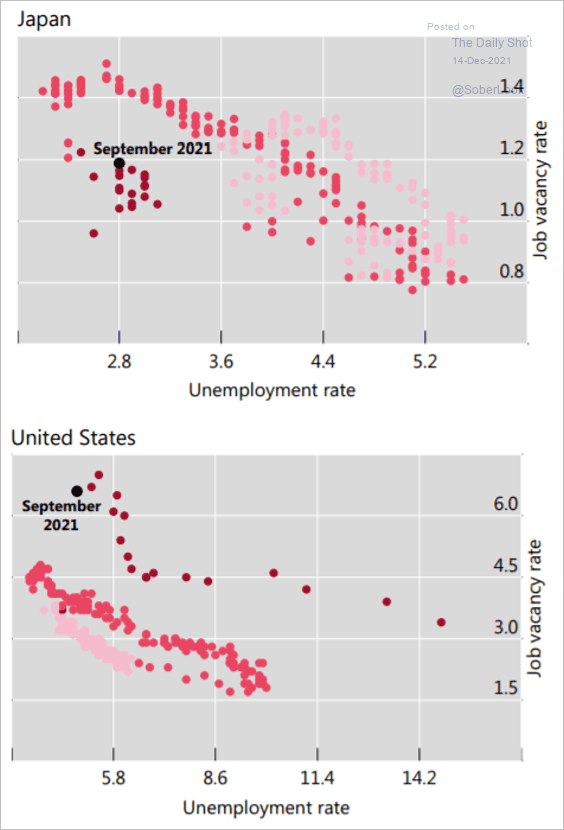 Source: BIS Read full article
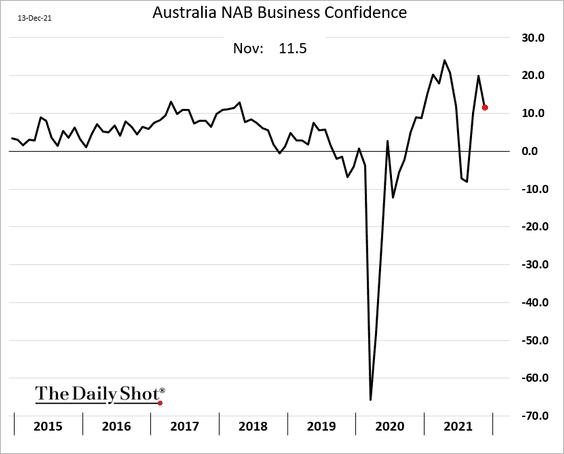
2. Australia’s business confidence eased in November.
Back to Index
China
1. The developer credit crisis continues to spook investors.
Shimao’s bonds tumbled as JPMorgan flagged liquidity concerns.
![]() Source: South China Morning Post Read full article
Source: South China Morning Post Read full article
![]()
• Property shares are rapidly giving up their gains for the month.
![]()
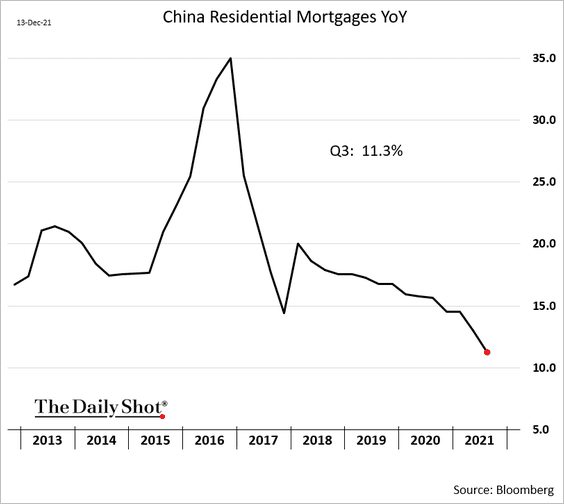
• To ease the crisis, the PBoC wants to boost mortgage lending activity which has slowed in recent years.
——————–
2. The Hang Seng is trading below book value.
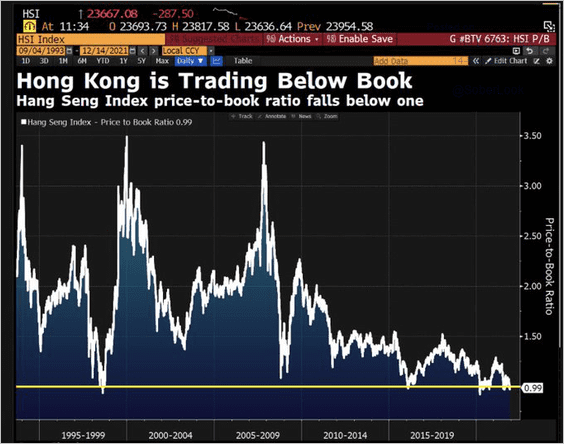 Source: @DavidInglesTV
• The Hang Seng TECH Index is testing support.
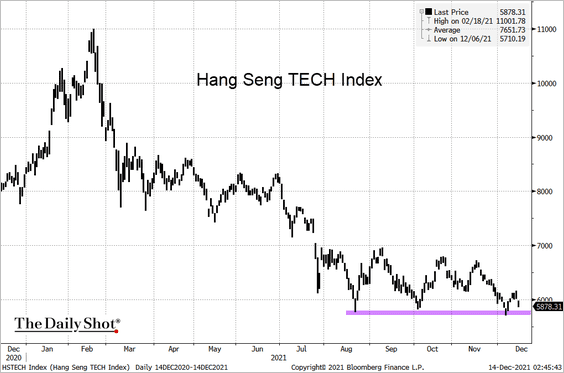 Source: @TheTerminal, Bloomberg Finance L.P.
• Hong Kong’s IPOs have underperformed.
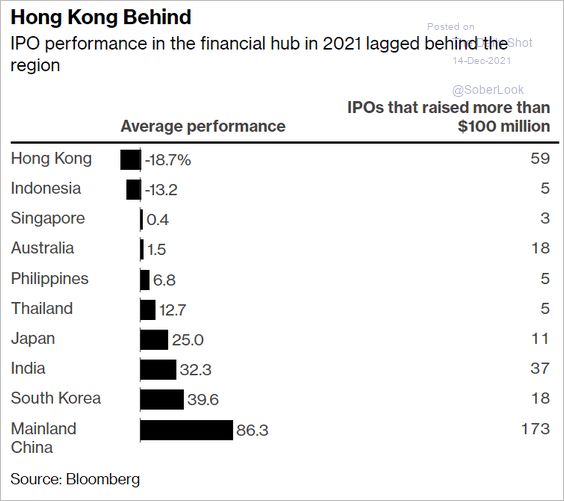 Source: Bloomberg Read full article
——————–
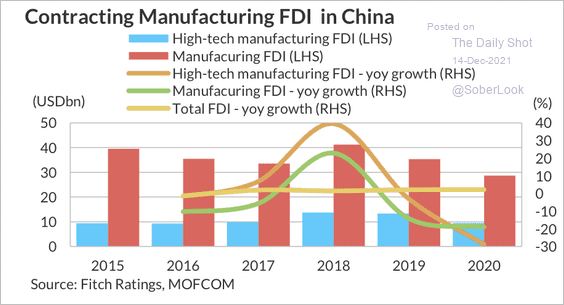
3. The flow of foreign capital into China accelerated this year (2 charts). Fitch Ratings expects this trend to continue next year, given strong M&A activity and robust deal pipelines.
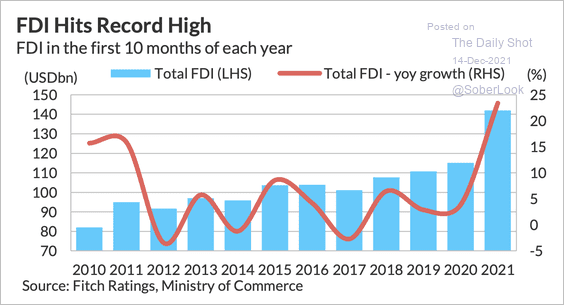 Source: Fitch Ratings
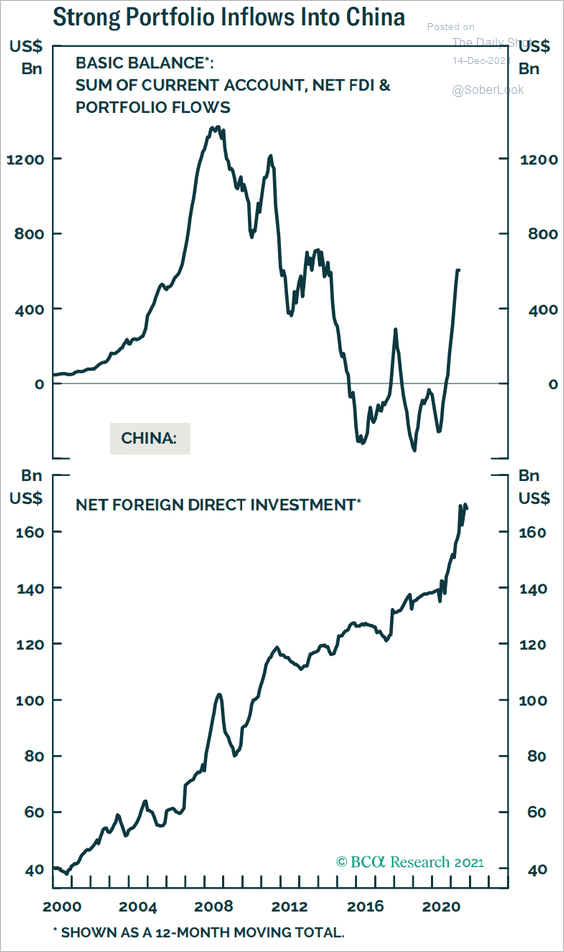 Source: BCA Research
The high-tech industry attracted a growing amount of foreign investment in recent years.
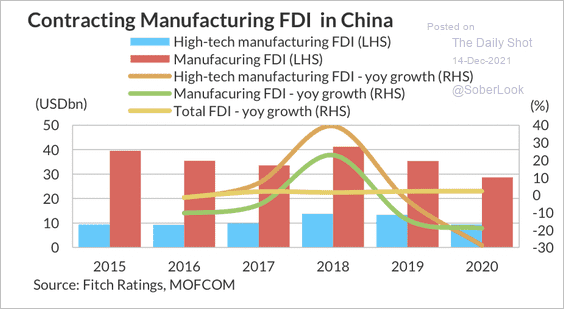 Source: Fitch Ratings
Manufacturing, however, has been a drag on foreign investment.
 Source: Fitch Ratings
——————–
4. Analysts expect infrastructure spending to increase.
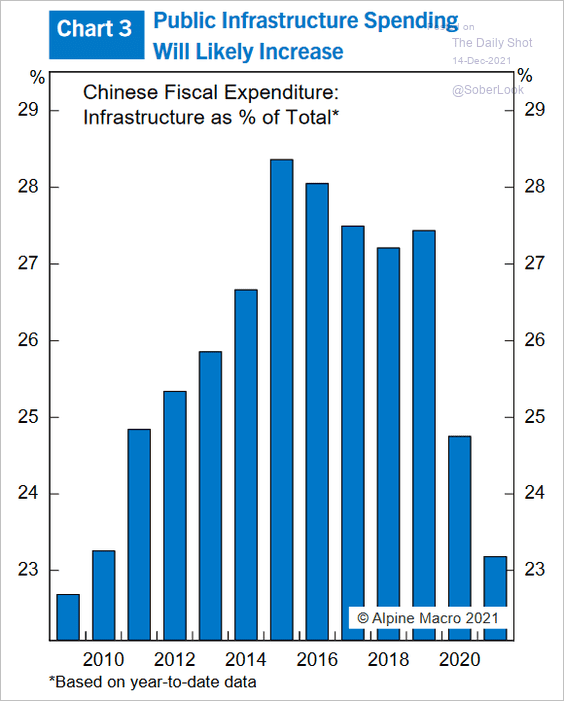 Source: Alpine Macro
But the revival in infrastructure spending has been slow so far.
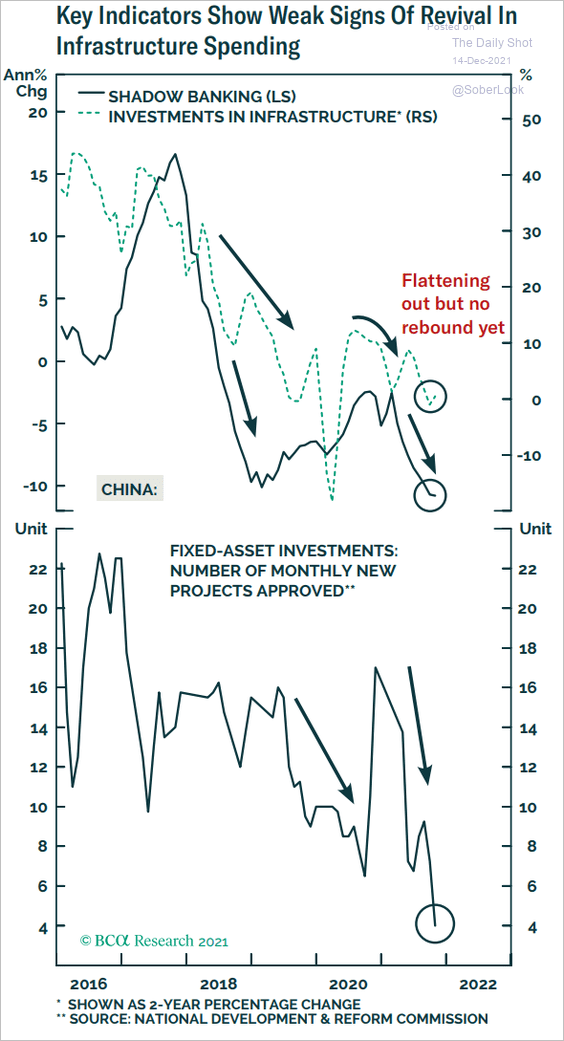 Source: BCA Research
Back to Index
Emerging Markets
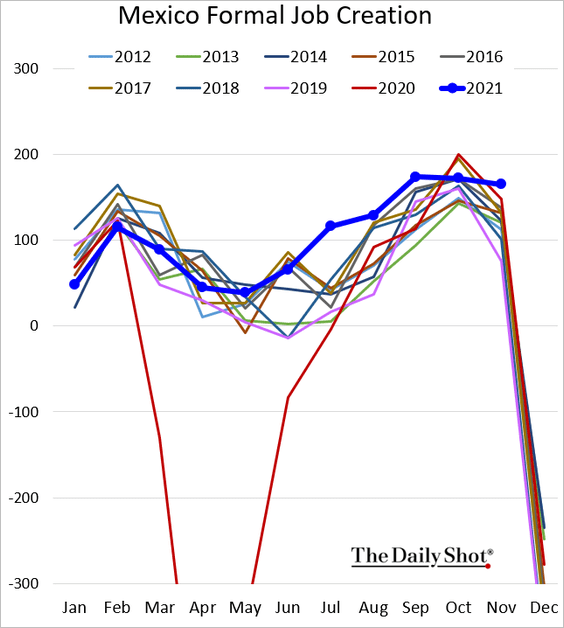
1. Mexico’s industrial production is in a holding pattern – well below pre-COVID levels.

• Formal job creation remains robust.
• Banxico’s inflation forecast has risen since September.
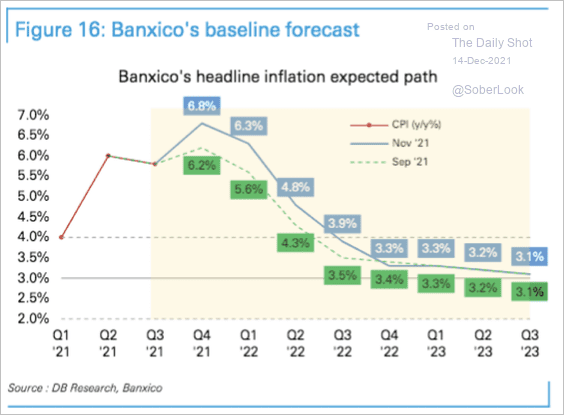 Source: Deutsche Bank Research
——————–
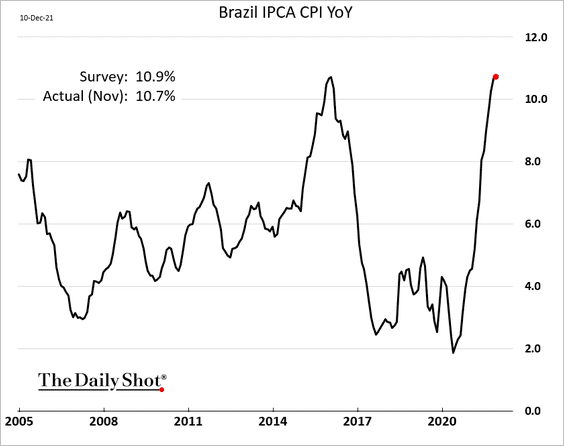
2. Brazil’s CPI came in below forecasts. Is it peaking?
3. The Chilean peso has diverged from copper due to political uncertainty.
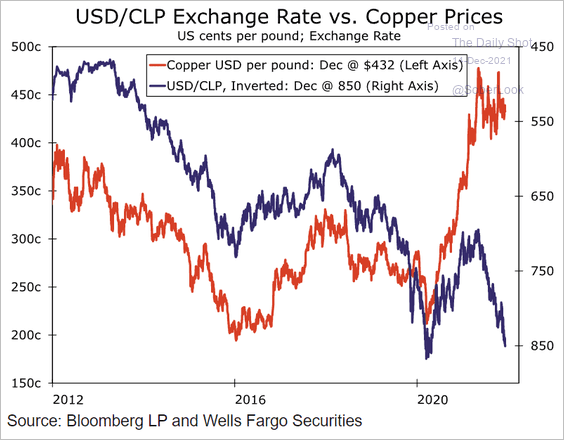 Source: Wells Fargo Securities
4. LatAm growth expectations have deteriorated since May.
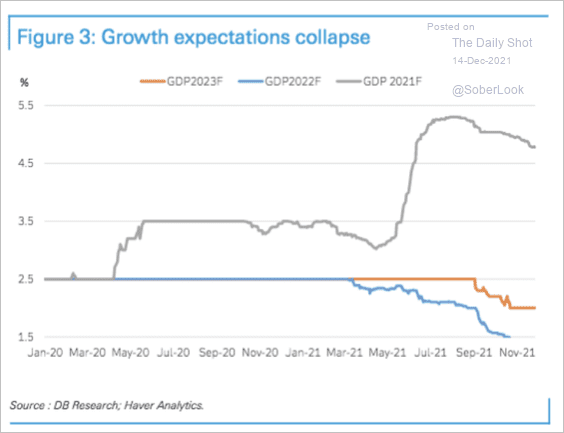 Source: Deutsche Bank Research
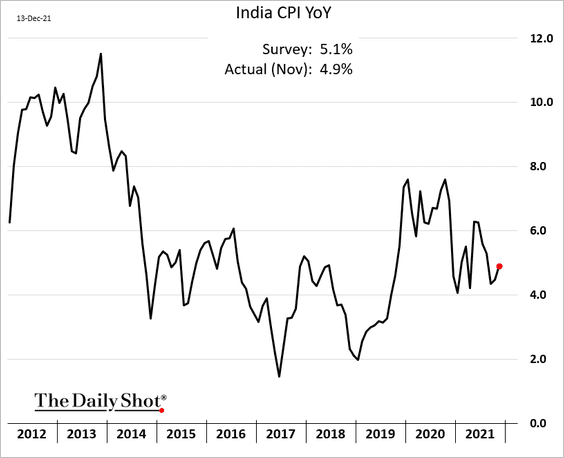
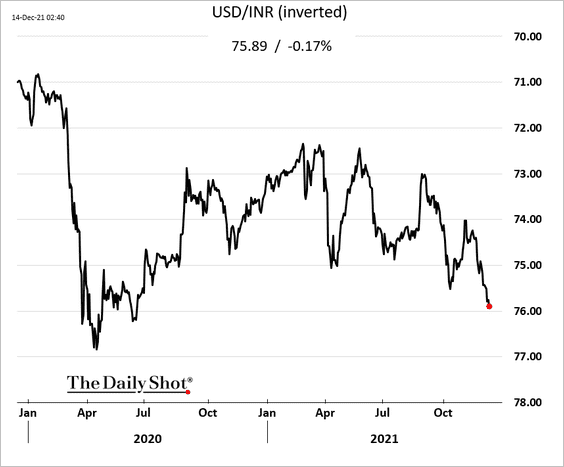
5. India’s CPI was below economists’ forecasts.
The rupee continues to slide.
——————–
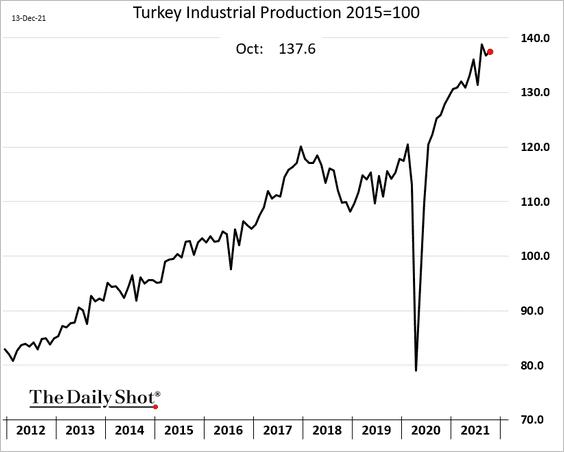
6. Turkey’s industrial production is holding up well.
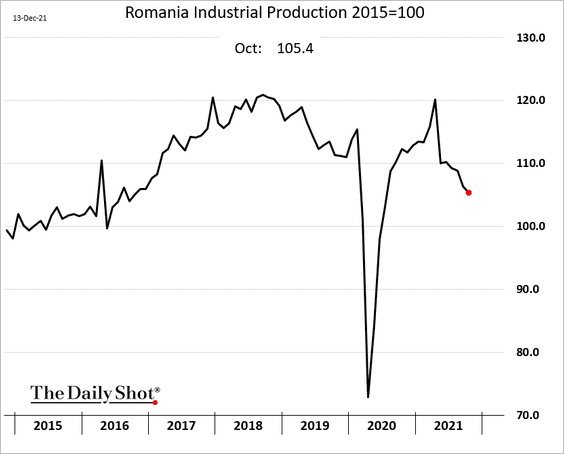
7. Romania’s industrial production slumped in recent months.
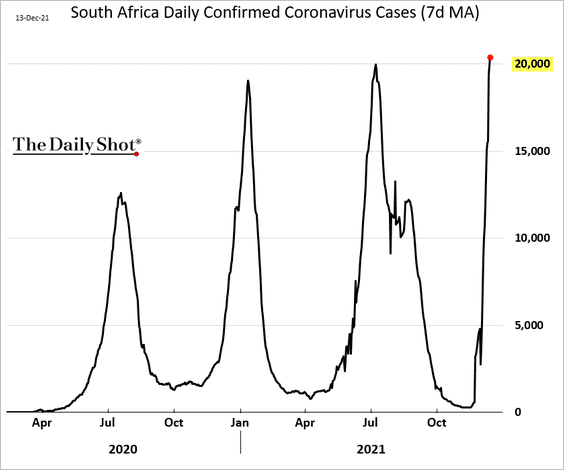
8. South Africa’s seven-day moving average of new COVID cases exceeded 20k for the first time as omicron spreads.
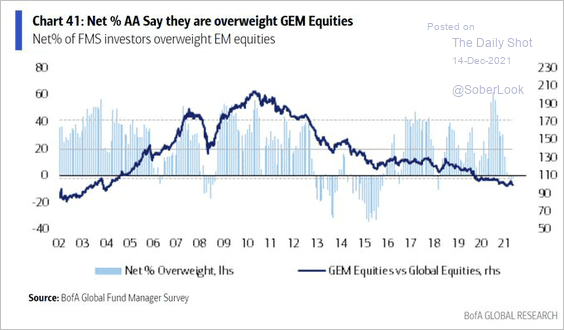
9. Fund managers have shifted to being underweight EM equities.
 Source: BofA Global Research; @Callum_Thomas
10. This chart shows the composition of the MSCI EM equity index.
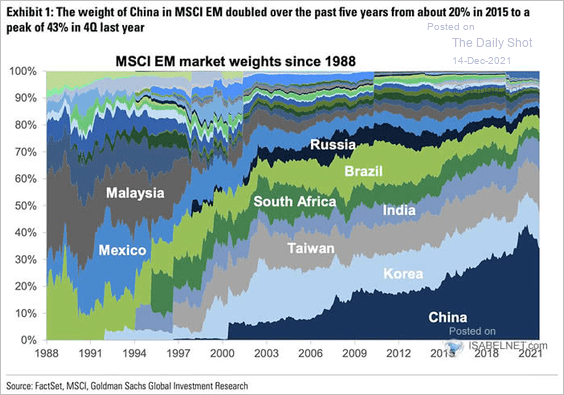 Source: @ISABELNET_SA, @GoldmanSachs
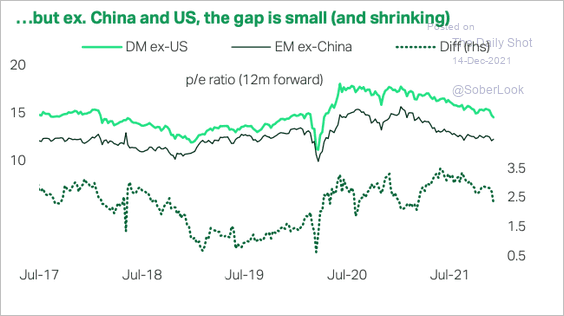
11. If one excludes China from emerging markets indices and the US from developed markets, the EM-DM valuation gap is nowhere near as large and has been shrinking.
 Source: TS Lombard
12. Asian countries have lagged behind others in terms of tourism and recovery in flights relative to 2019 levels.
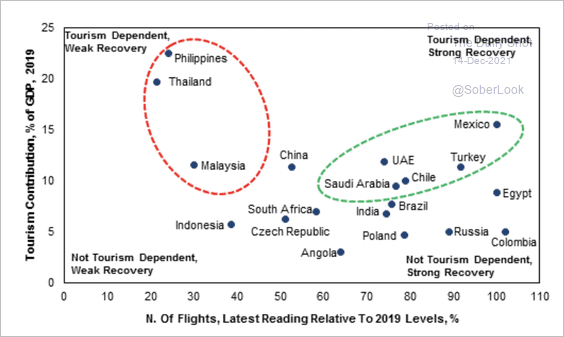 Source: Fitch Solutions Macro Research
Back to Index
Cryptocurrency
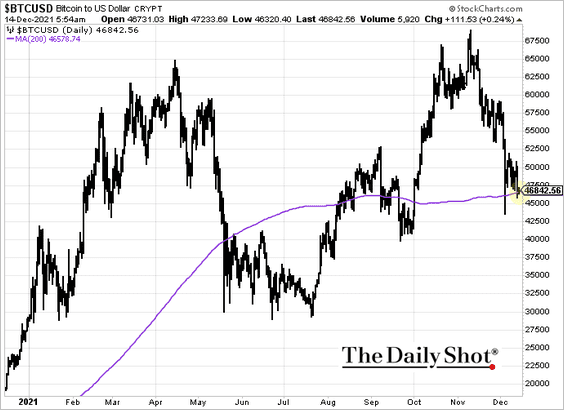
1. Bitcoin is holding support at the 200-day moving average.
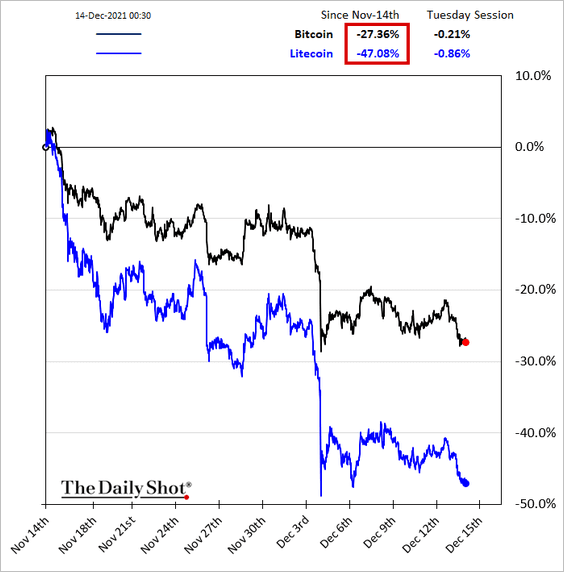
It’s been a tough month for cryptos, …
… with a substantial loss in total market value.
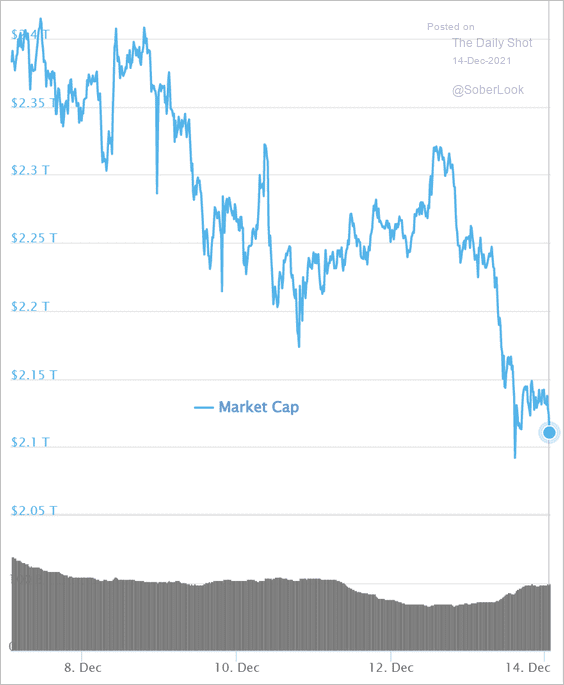 Source: CoinMarketCap
——————–
2. Next, we have the distribution of Bitcoin miners’ costs by region.
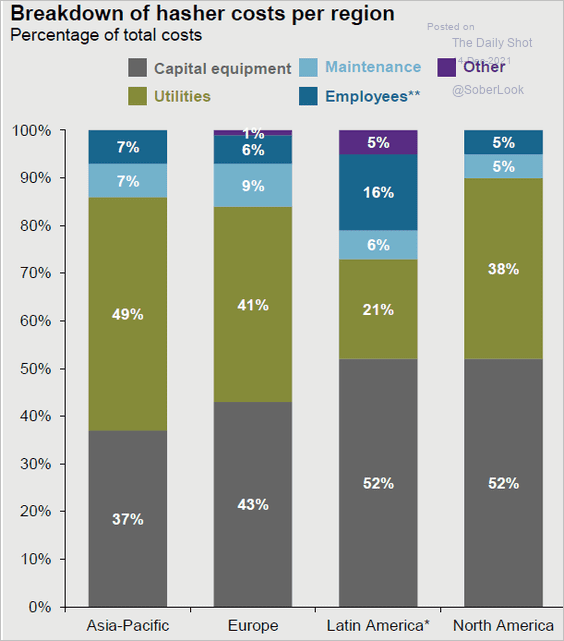 Source: J.P. Morgan Asset Management
3. Should crypto regulations be strengthened?
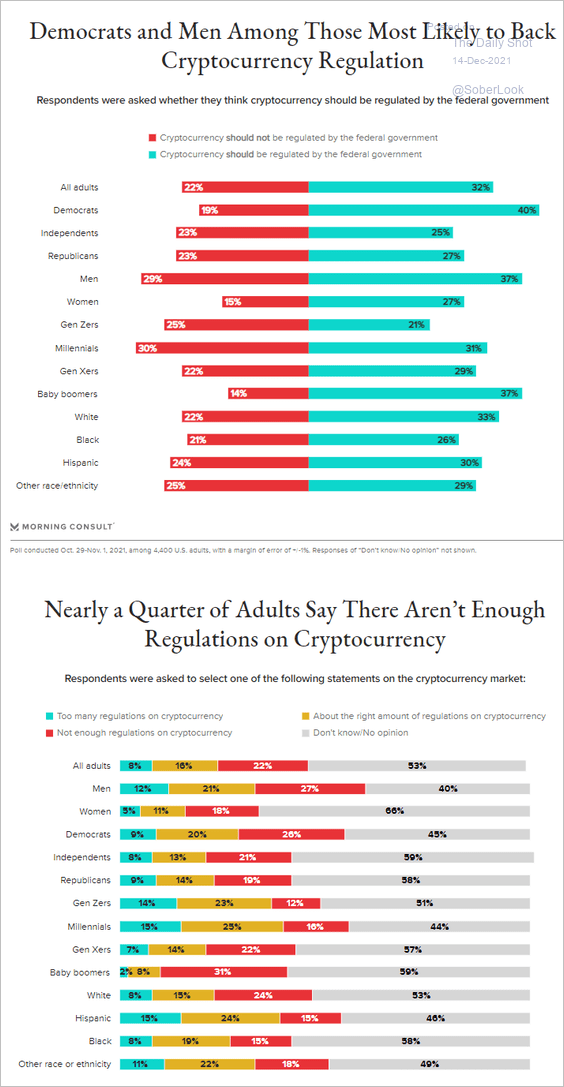 Source: Morning Consult Read full article
4. What would you like Santa Claus to gift you this Christmas?
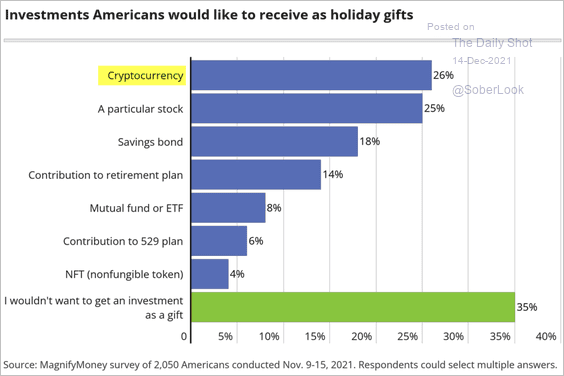 Source: MagnifyMoney Read full article
Back to Index
Commodities
1. Lithium prices have been rebounding.
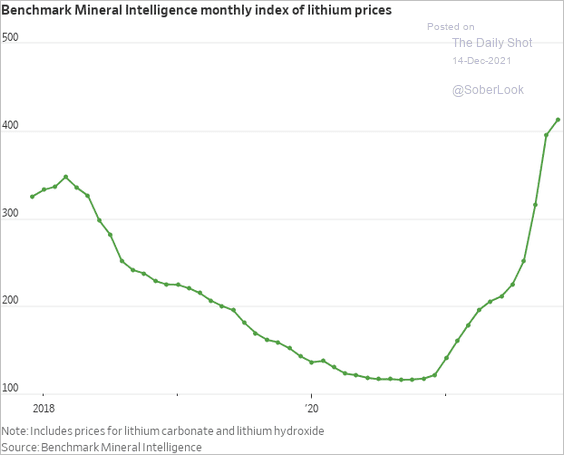 Source: @WSJ Read full article
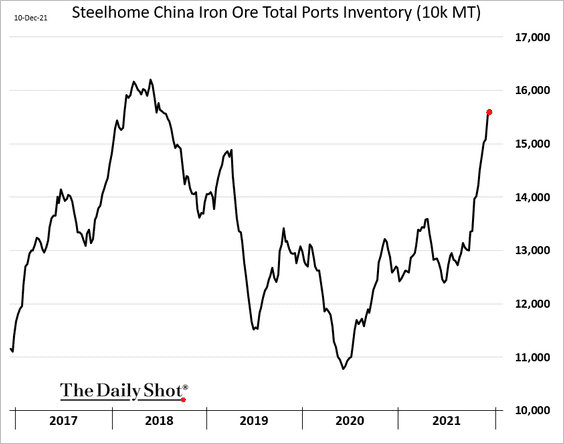
2. Iron ore inventories in China continue to rise.
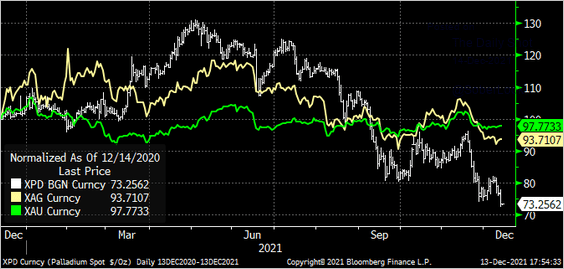
3. Palladium (XPD) has been underperforming (XAG = silver, XAU = gold).
 Source: @Marcomadness2
4. Production of key minerals is concentrated in a handful of countries.
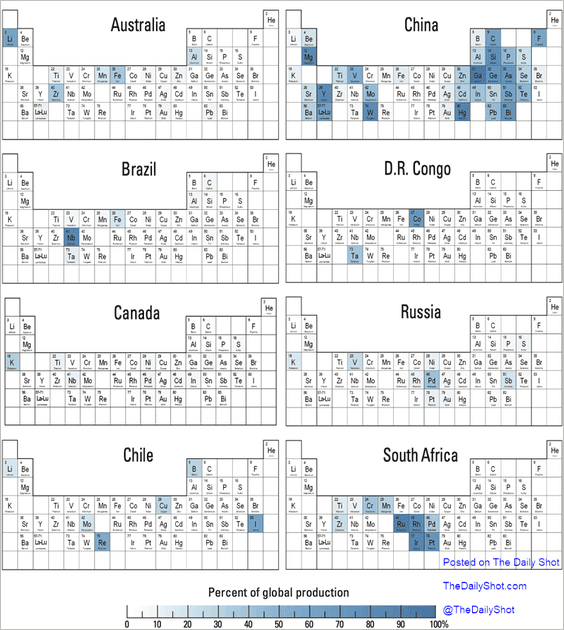 Source: US Geological Survey
This chart shows China’s and the US’s net reliance on various key minerals, color-coded by country-level concentration (measured by the Herfindahl index).
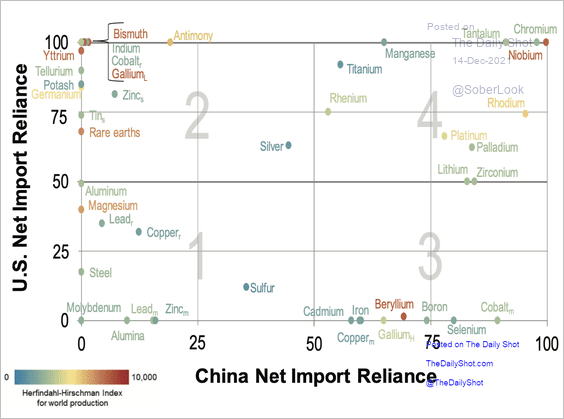 Source: US Geological Survey
Back to Index
Energy
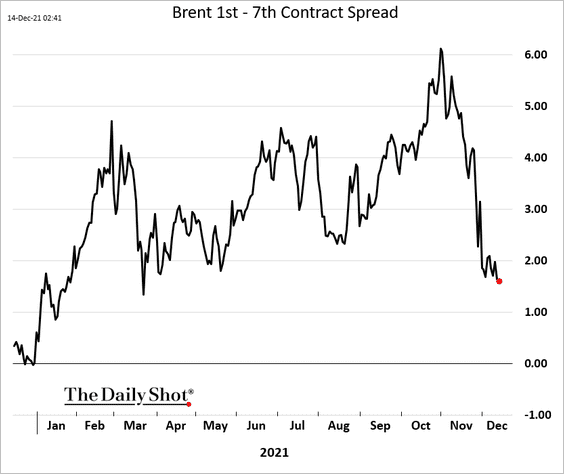
1. Brent’s backwardation continues to ease (the curve is flattening).
2. According to the IEA, global crude markets are set to be oversupplied starting Q1 2022.
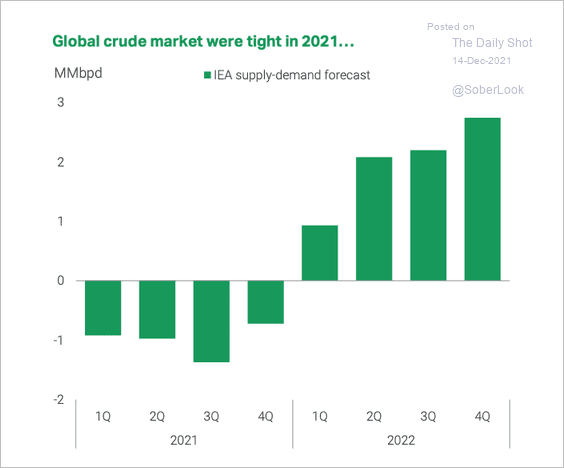 Source: TS Lombard
3. All the recent US oil production growth has been coming from the Permian Basin.
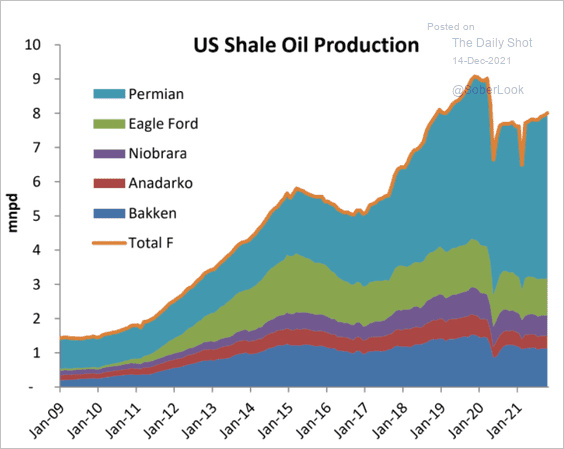 Source: Princeton Energy Advisors
4. This chart shows a forecast for US coal production.
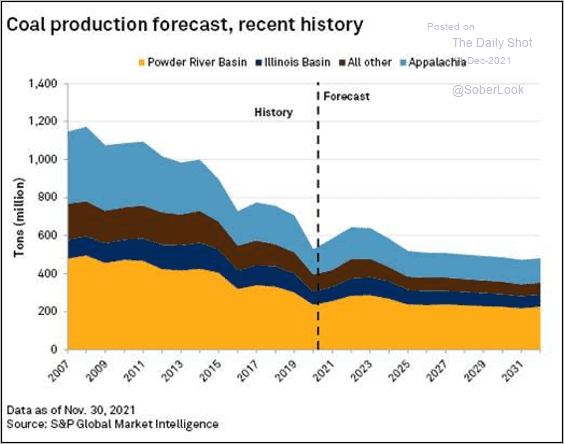 Source: S&P Global Market Intelligence
Back to Index
Equities
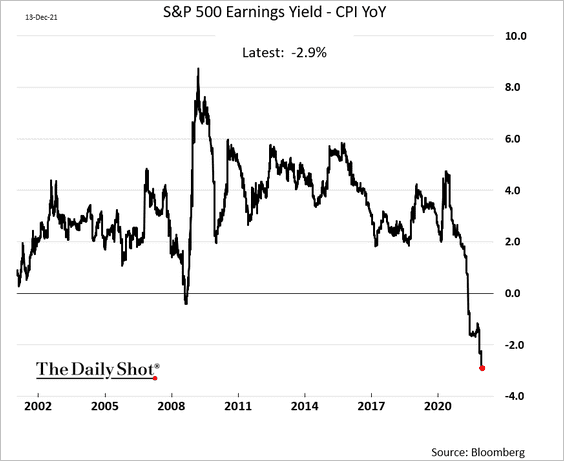
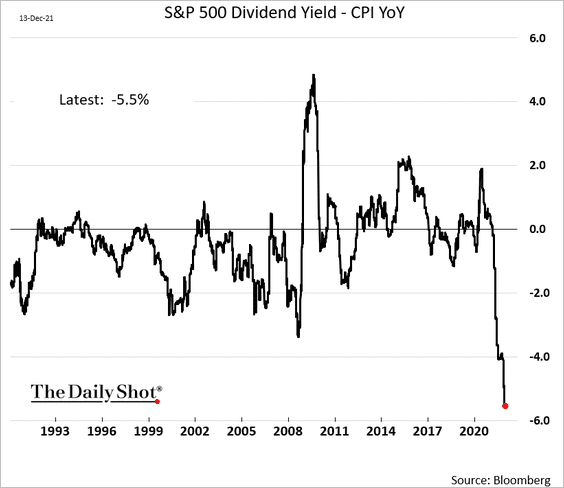
1. The S&P 500 real dividend yield and real earnings yield hit new lows.
——————–
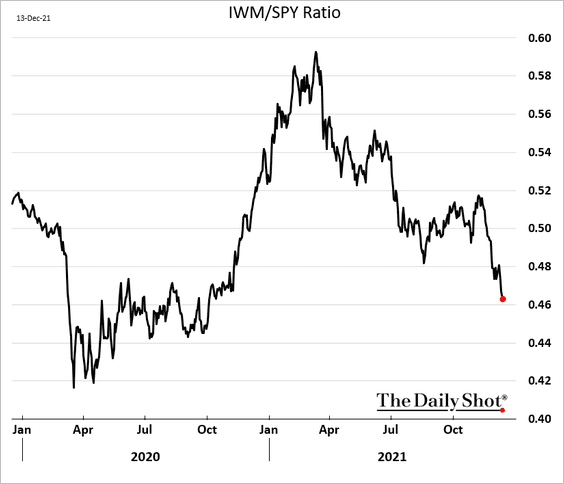
2. Small caps continue to struggle.
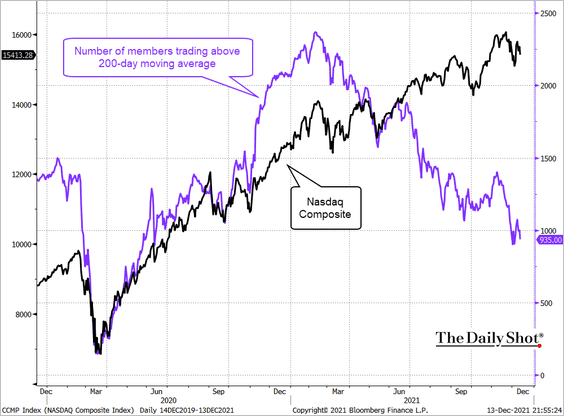
3. The Nasdaq Composite breadth shows no signs of recovery.
 Source: @TheTerminal, Bloomberg Finance L.P.
The average stock in the index is 39% below its 52-week high.
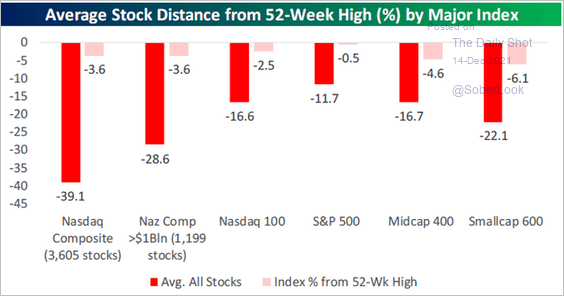 Source: @bespokeinvest
——————–
4. 35% of the S&P 500 year-to-date return came from five stocks.
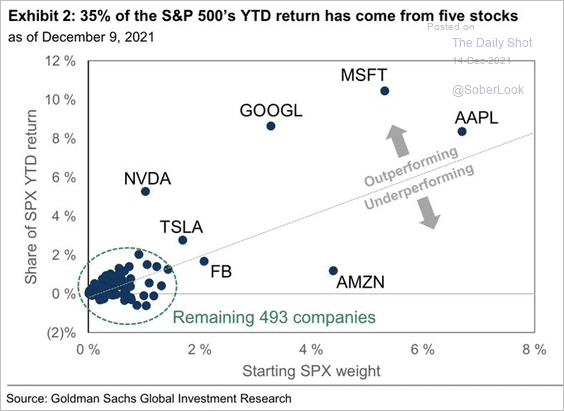 Source: Goldman Sachs; @WallStJesus
5. The S&P 500 long-term P/E ratio is nearing the dot-com peak.
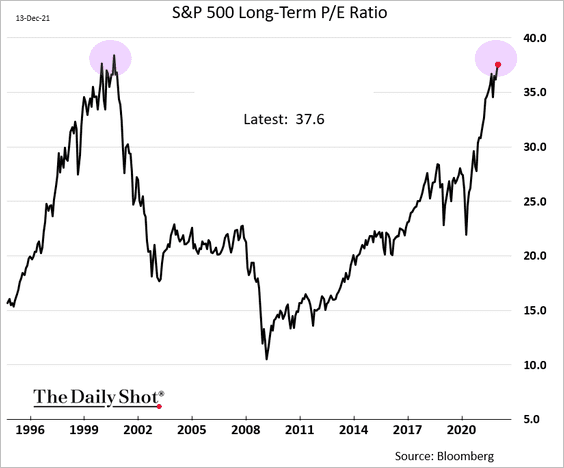 h/t Michael Msika
6. Here is a look at the performance of secular growth themes since September.
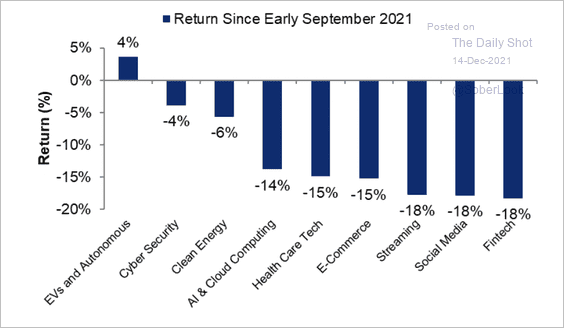 Source: Citi Private Bank
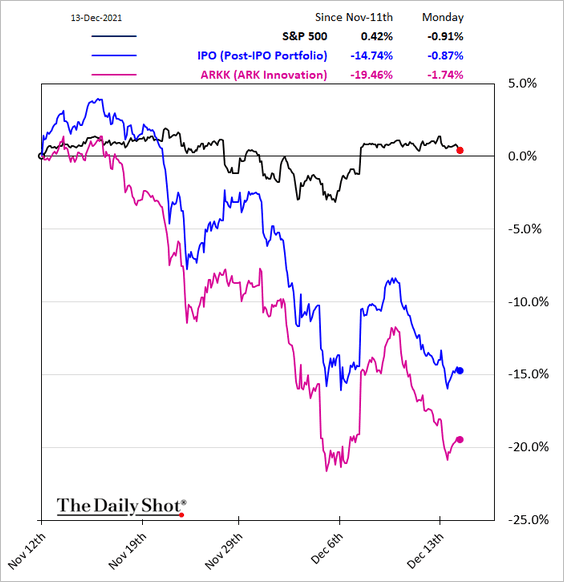
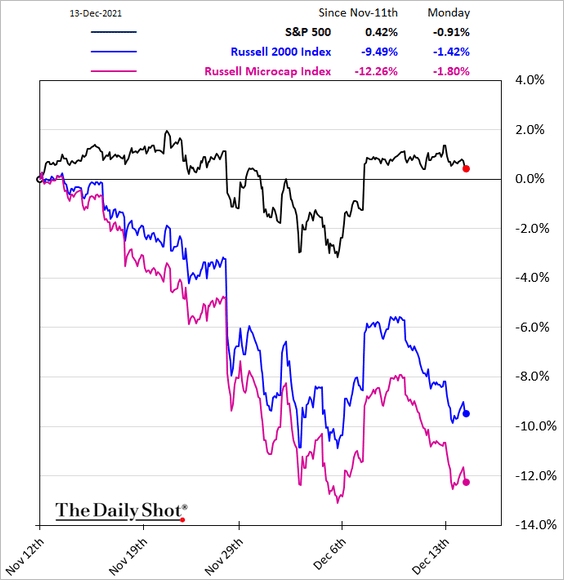
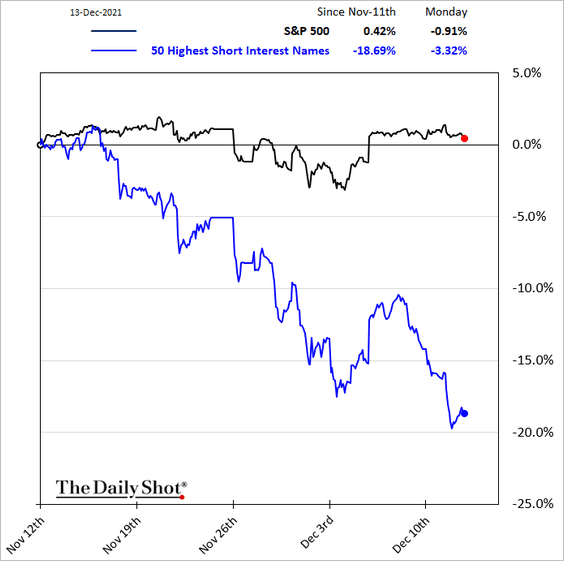
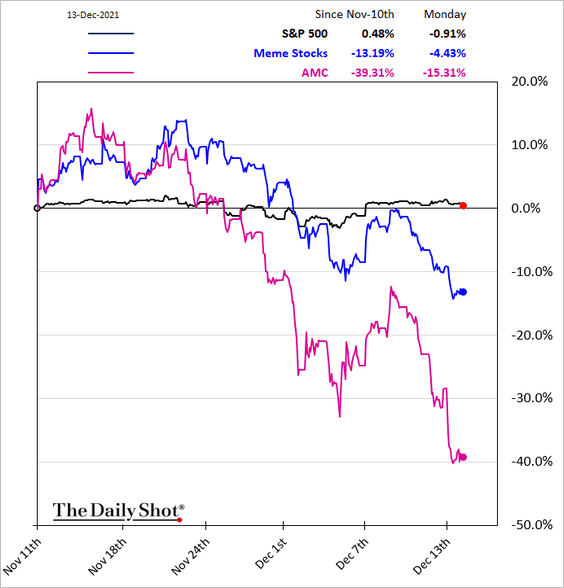
7. Speculative stocks had a rough 30 days.
• Post-IPO stocks and ARK Innovation:
• Microcaps:
• Most-shorted names:
• Meme stocks:
• Names favored by retail investing communities:
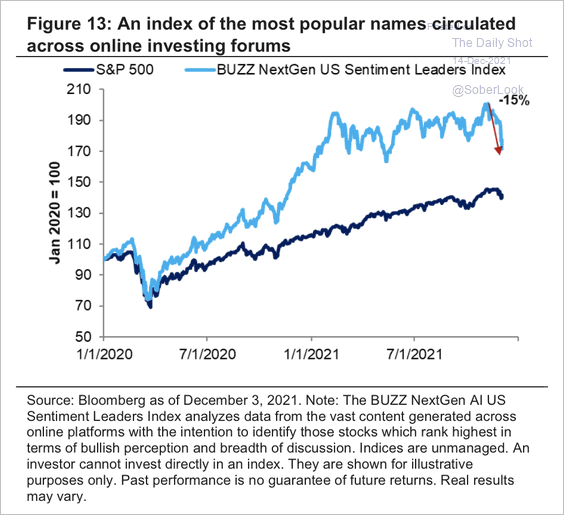 Source: Citi Private Bank
——————–
8. Below, we have the S&P 500 dividend growth consensus estimates.
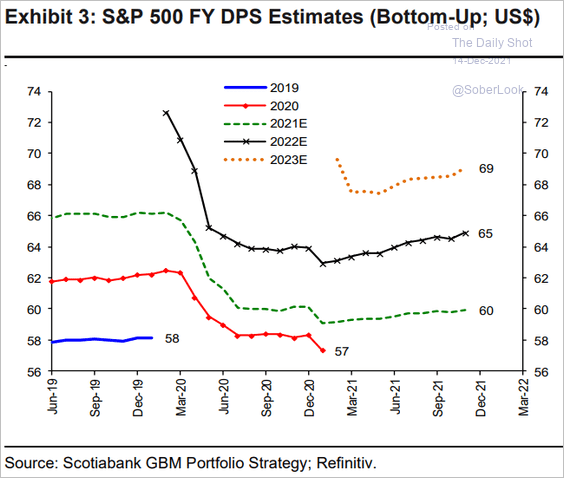 Source: Hugo Ste-Marie, Portfolio & Quantitative Strategy Global Equity Research, Scotia Capital
And this chart shows the number of positive dividend actions by year.
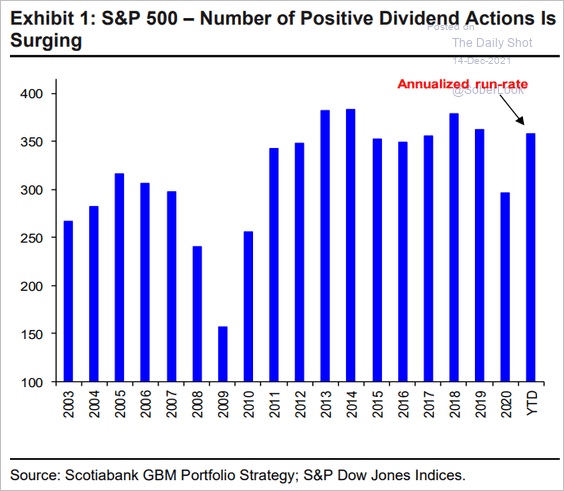 Source: Hugo Ste-Marie, Portfolio & Quantitative Strategy Global Equity Research, Scotia Capital
Back to Index
Alternatives
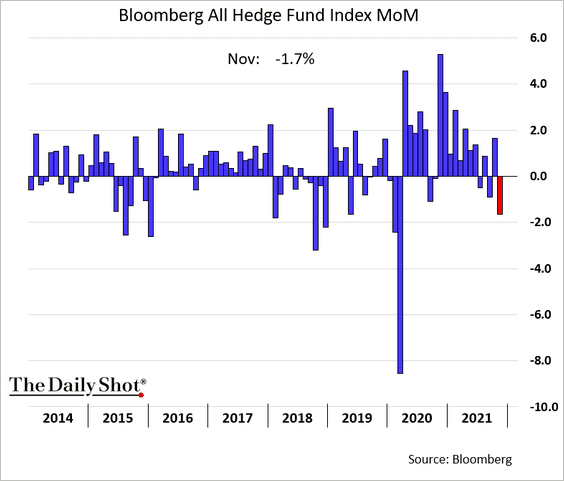
1. November was a difficult month for hedge funds.
2. Next, we have the hedge fund manager dispersion by strategy.
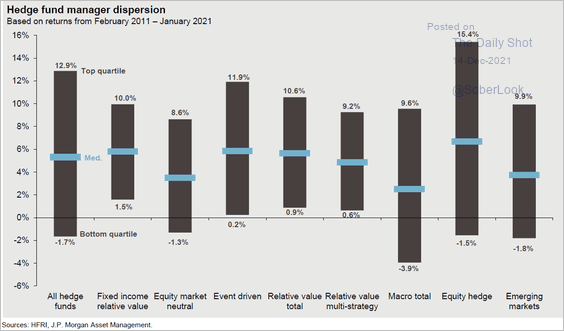 Source: J.P. Morgan Asset Management
3. How do hedge funds perform in different volatility regimes?
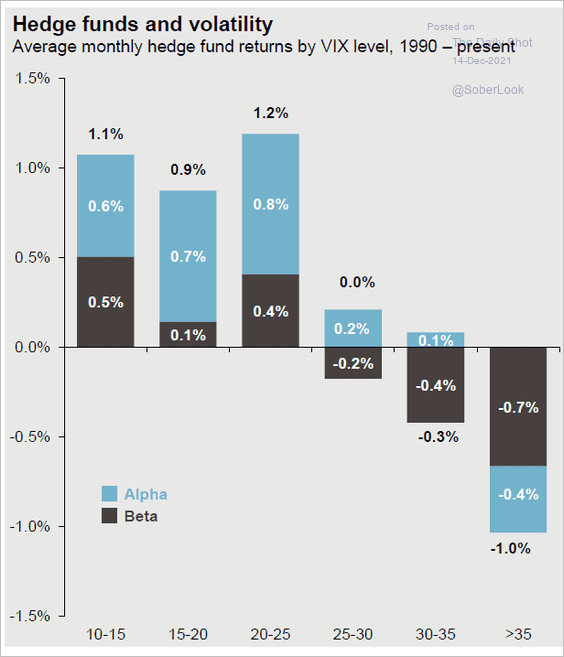 Source: J.P. Morgan Asset Management
4. Private equity deal volume soared this year.
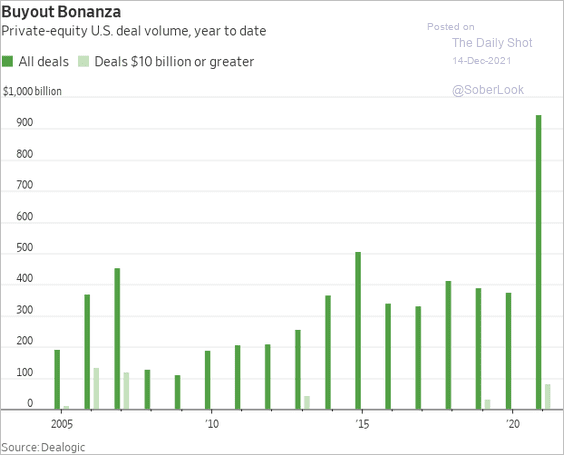 Source: @WSJ Read full article
VC activity hit a new record as well.
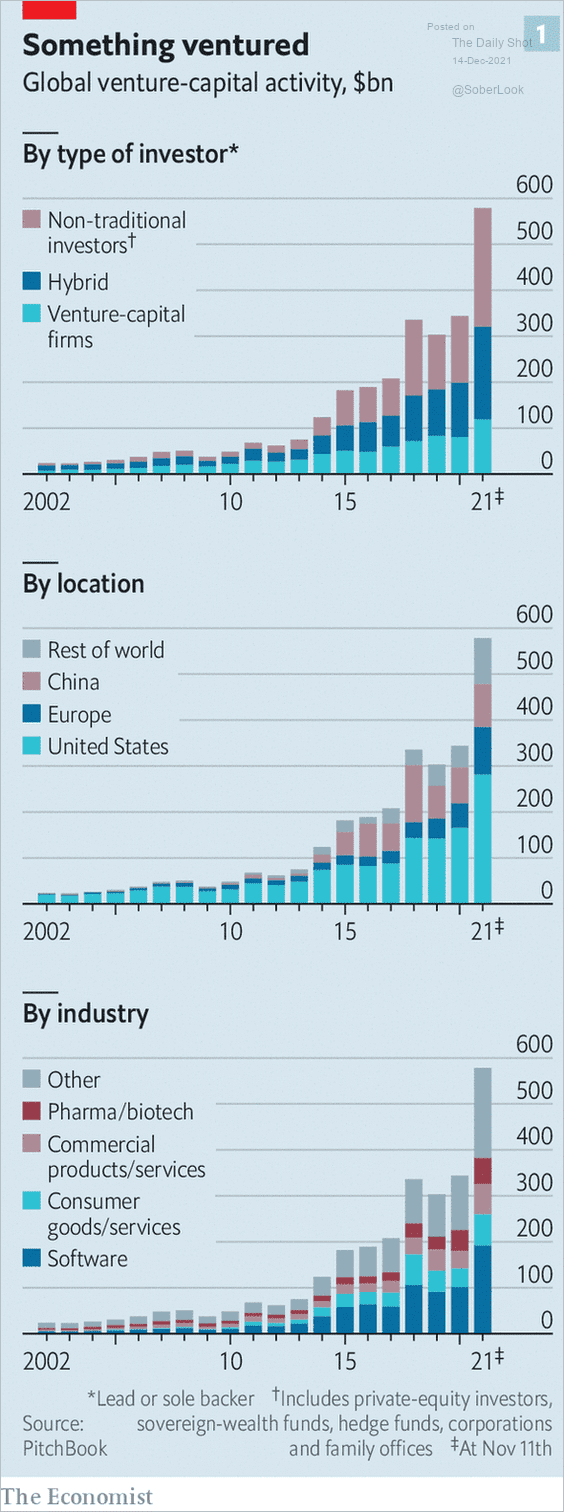 Source: The Economist Read full article
——————–
5. Private equity portfolios are massively overweight tech.
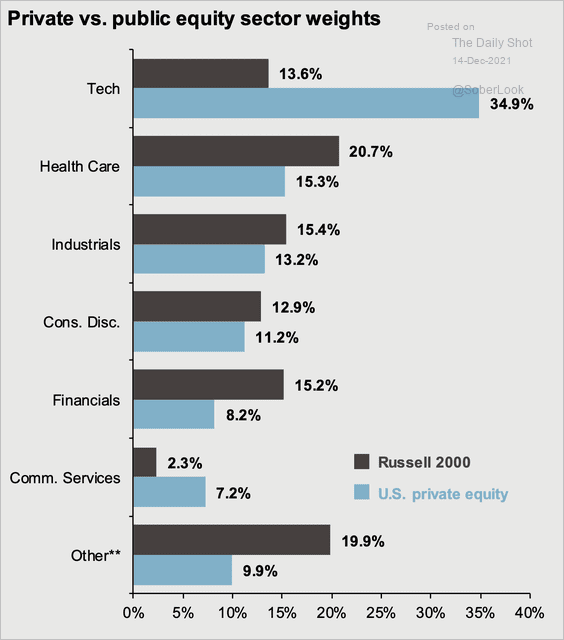 Source: J.P. Morgan Asset Management
6. PitchBook’s VC-backed IPO index has underperformed the S&P 500 this year.
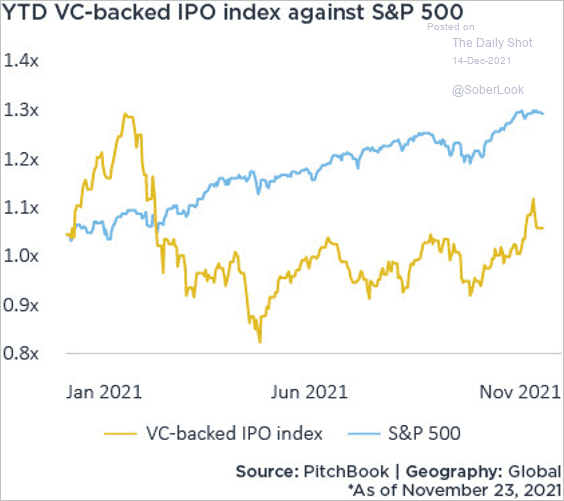 Source: PitchBook
Public listings dominated VC exits this year.
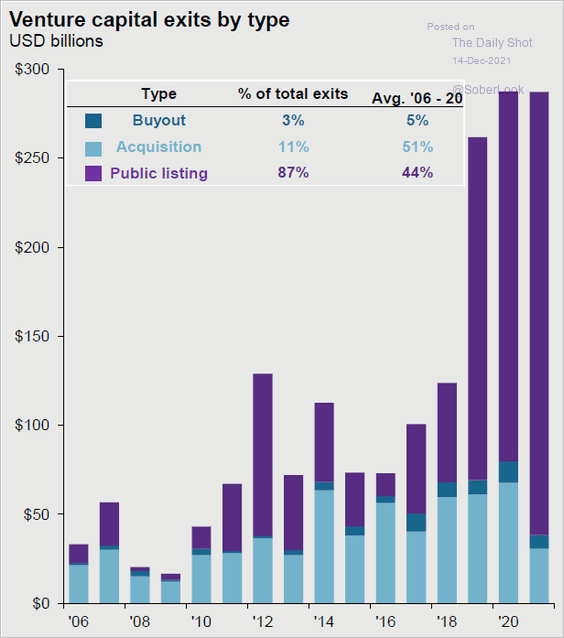 Source: J.P. Morgan Asset Management
——————–
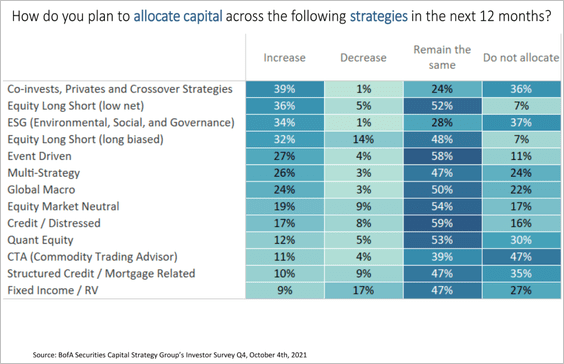
7. 39% of asset allocators are looking to put more money into co-invests, privates, and crossover strategies.
 Source: Zoetrope of Finance; BofA Securities
Back to Index
Rates
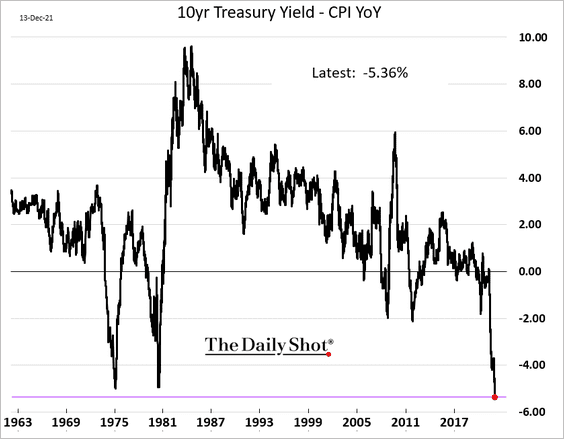
1. The spread between the 10yr Treasury yield and the CPI hit a record low.
Here is the Treasury yield/CPI scatter plot.
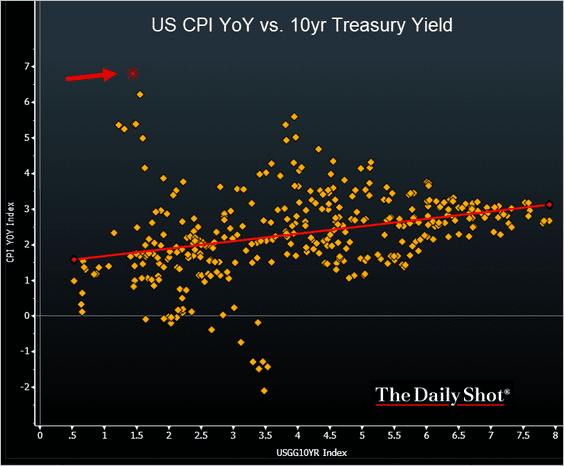 Source: @TheTerminal, Bloomberg Finance L.P.
——————–
2. The root mean square error measure (RMSE) shows large deviations in yields for off-the-run Treasuries from the yield curve. It’s an indication of poor market depth/liquidity in the Treasury market.
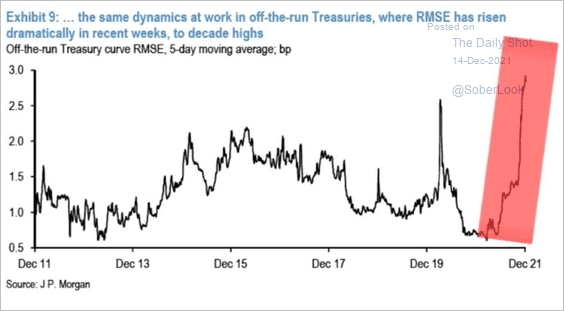 Source: JP Morgan Research; Matt Kessel
Back to Index
Global Developments
1. The US dollar index is in a wedge pattern. Will we see a breakout after the FOMC meeting?
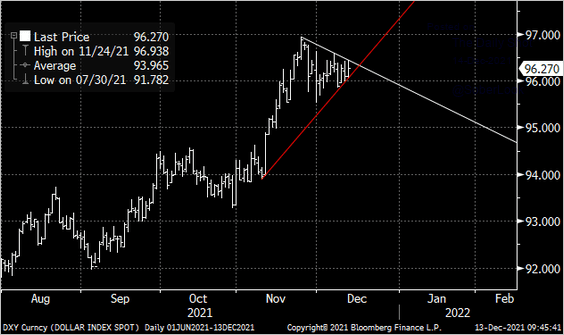 Source: @Marcomadness2
2. Hawkish central banks are now the biggest tail risk.
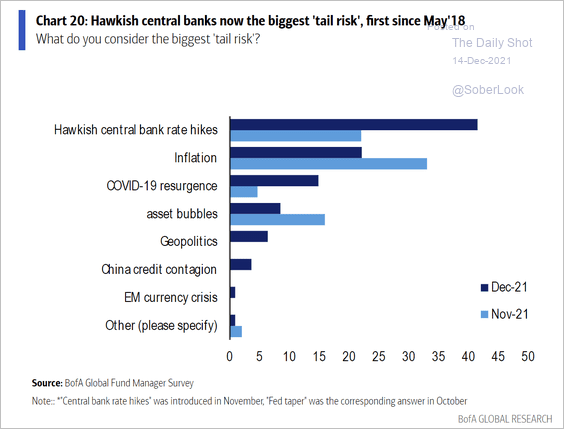 Source: BofA Global Research; @Callum_Thomas
3. Government transfers are correlated with inflation.
![]() Source: Oxford Economics
Source: Oxford Economics
4. New manufacturing orders have been growing faster than output.
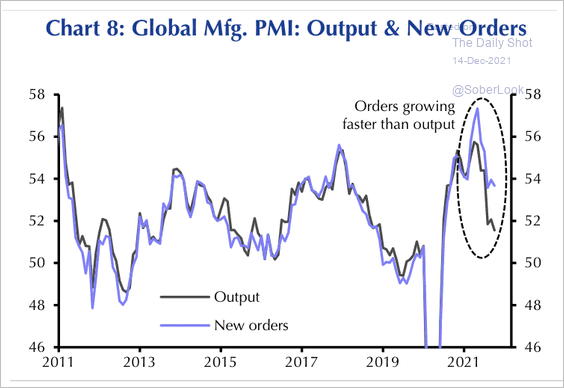 Source: Capital Economics
More firms are reporting material shortages – the most in about 30 years.
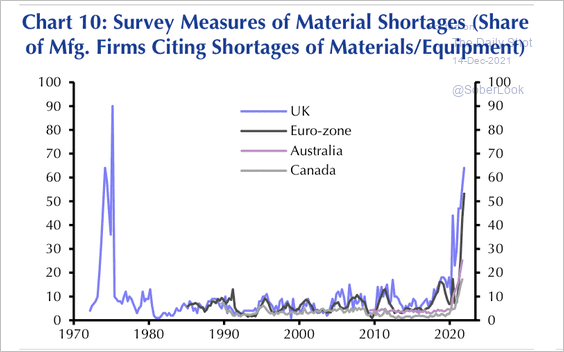 Source: Capital Economics
And labor shortages are above the 2018-2019 average.
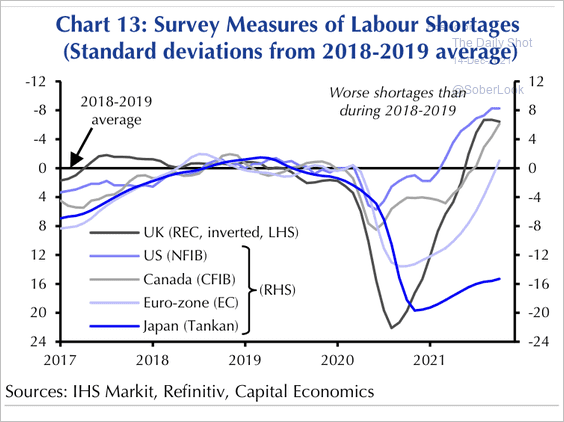 Source: Capital Economics
——————–
Food for Thought
1. Protein prices:
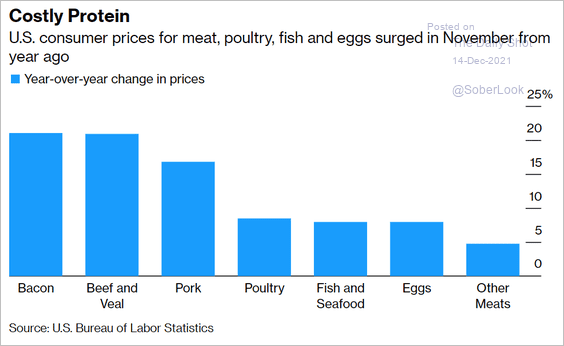 Source: @bpolitics Read full article
2. Opioid prescriptions:
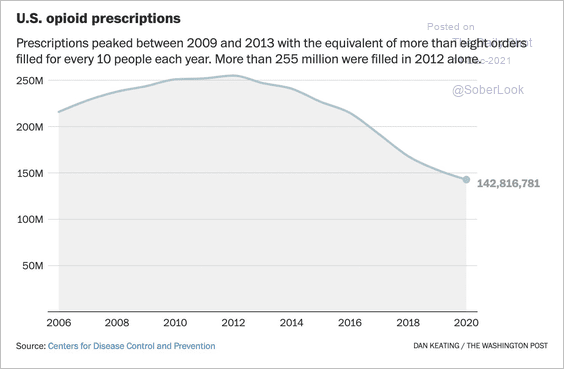 Source: The Washington Post Read full article
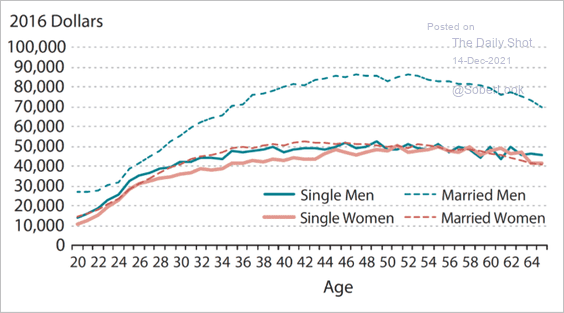
3. The marital wage premium:
 Source: AEA Read full article
4. Changes in state voting rights:
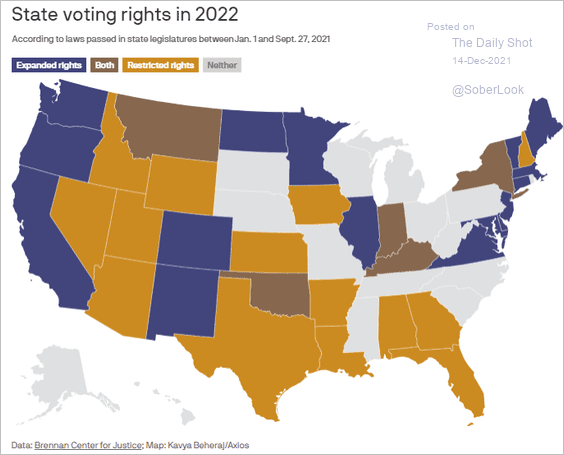 Source: @axios Read full article
5. The number of private-equity-backed hospitals around the US:
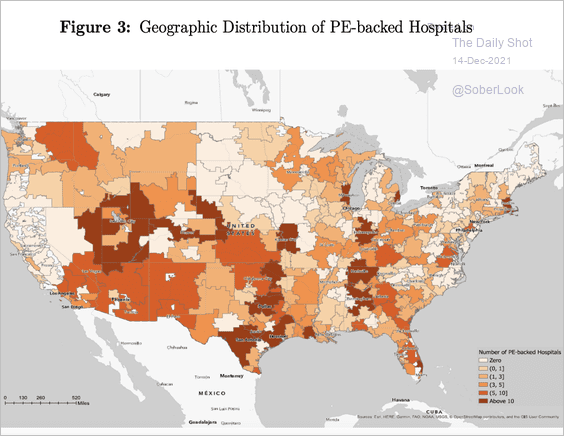 Source: Wharton Read full article
6. Smartphone and telecom network equipment sales:
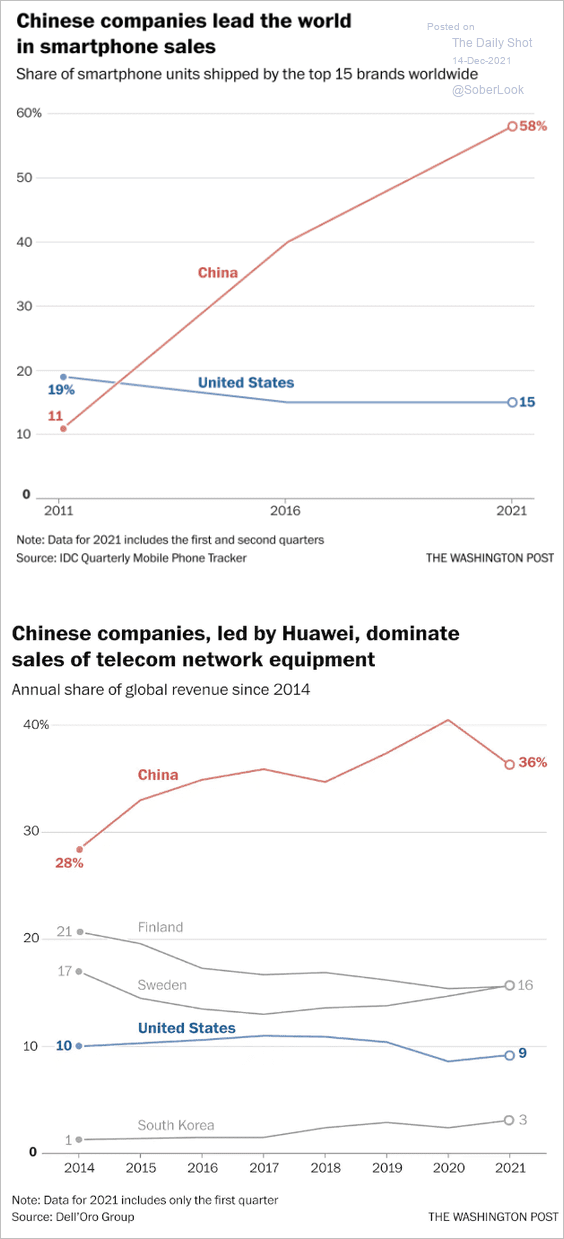 Source: The Washington Post Read full article
7. Biggest social media accounts:
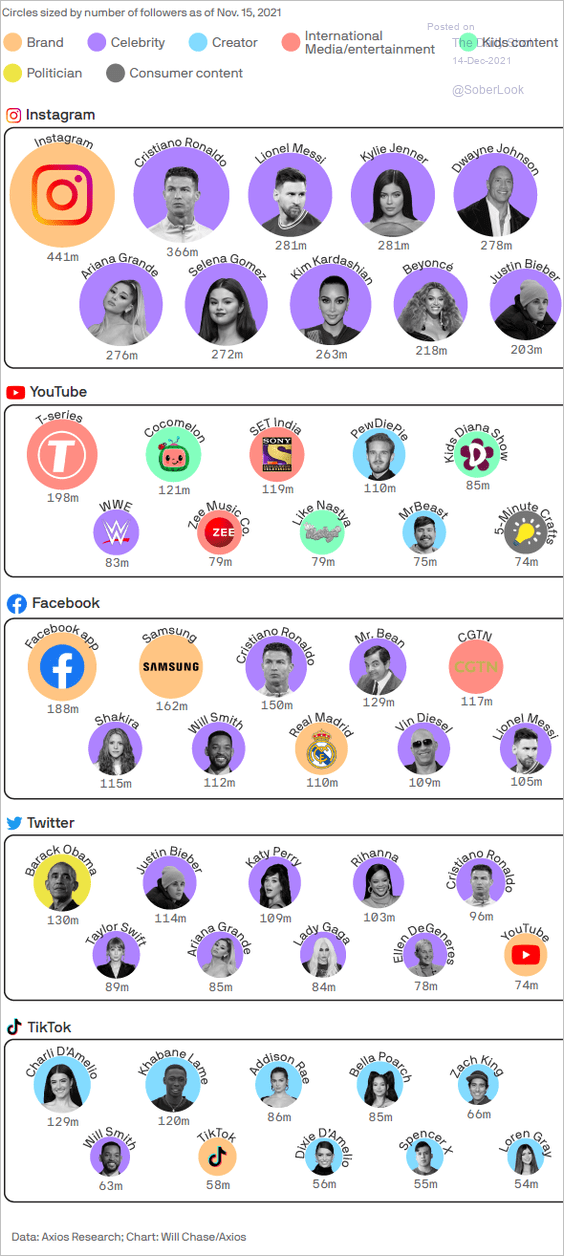 Source: @axios Read full article
——————–
Back to Index