
The Daily Shot: 06-May-22
• The United States
• Canada
• The United Kingdom
• The Eurozone
• Europe
• Asia – Pacific
• China
• Emerging Markets
• Cryptocurrency
• Commodities
• Energy
• Equities
• Credit
• Rates
• Global Developments
• Food for Thought
The United States
1. Unit labor costs climbed more than expected last quarter, spooking the markets (2 charts).

 Source: Scotiabank Economics
Labor productivity plummeted. However, this result was distorted by the Q1 GDP weakness, driven by the trade deficit surge (that should reverse).

——————–
2. Next, we have some updates on the labor market.
• Unemployment applications remain very low.


• Morgan Stanley expects to see 475k new jobs created in April …
 Source: Morgan Stanley Research
… and the unemployment rate hitting 3.5%.
 Source: Morgan Stanley Research
——————–
3. Companies are boosting prices even in sectors with relatively low demand.
 Source: JP Morgan Research; @carlquintanilla
4. According to Bloomberg, retail traffic deteriorated sharply last week and is now well below last year’s levels for most categories.
 Source: Colleen McElroy
5. Sentiment among higher-earning Americans tumbled in recent weeks but is holding steady among those making under $50k. This trend does not bode well for consumer spending.
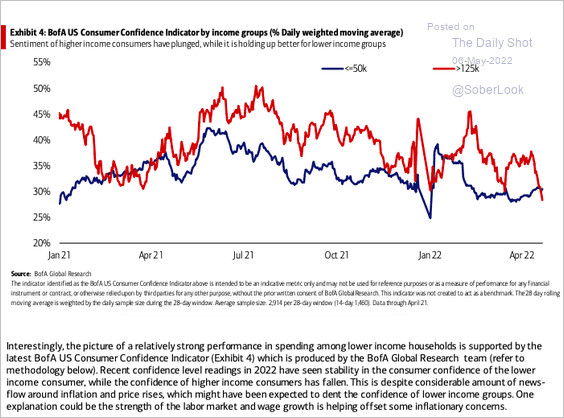 Source: BofA Global Research; @SamRo
6. What is the Fed’s “terminal rate” (the maximum fed funds rate in the current tightening cycle)? Here is the market pricing.

The 10yr Treasury yield is now firmly above 3%.

Back to Index
Canada
1. The Toronto-area housing market is feeling the pinch of higher interest rates.
 Source: BMO; @SBarlow_ROB
2. This chart shows Canada’s net exports by sector.
 Source: @RichardDias_CFA
3. The budget deficit is expected to shrink over the next year.
 Source: Oxford Economics
And federal debt as a percent of GDP is expected to decline.
 Source: Oxford Economics
4. Oxford Economics expects stronger growth this year, but slower gains in 2023 and 2024.
 Source: Oxford Economics
Back to Index
The United Kingdom
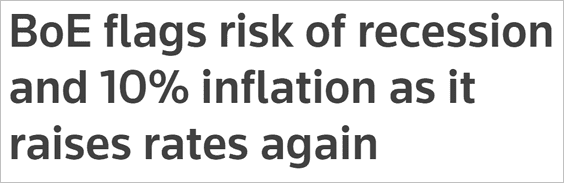
1. The BoE hiked rates again but struck a cautious tone. The central bank sees stagflation setting in.
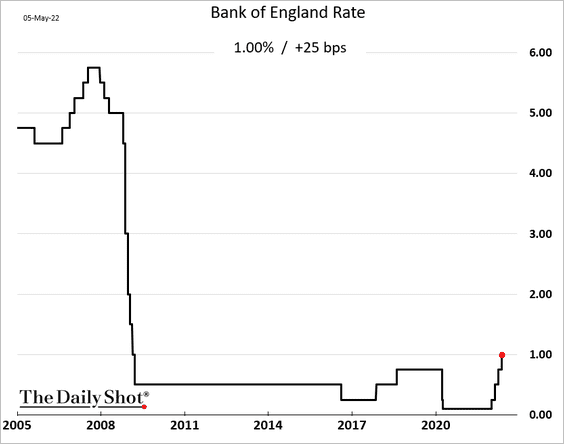
 Source: Reuters Read full article
• The CPI is projected to hit 10% this year.
 Source: Scotiabank Economics
• The BoE sees no growth in 2023 and 2024.
 Source: Scotiabank Economics
• Three years out, inflation is expected to fall well below the target as rate hikes choke off economic growth.
 Source: Pantheon Macroeconomics
• The market expects the BoE to keep pushing rates higher.
 Source: Scotiabank Economics
——————–
2. The pound tumbled in response to BoE’s comments.

3. The Markit PMI report shows companies rapidly boosting prices.

4. Car registrations remain depressed.

Back to Index
The Eurozone
1. The 10yr Bund yield is at long-term resistance.
 h/t @AkshayChinchal4
2. The German breakeven rate (inflation expectations) tumbled this week.

3. Germany’s manufacturing output slumped in March (well below forecasts).

Vehicle orders were depressed.

——————–
4. Germany’s construction activity is back in contraction territory.

5. French manufacturing production edged lower in March.

Back to Index
Europe
1. Poland and the Czech Republic hiked rates again.


The Czech 2yr yield is nearing 6%.

The yield curve is heavily inverted.

——————–
2. The Swiss CPI is grinding higher but remains well below the levels we see in the Eurozone.

3. International companies see softer sales in Europe.
 Source: Evercore ISI Research
Back to Index
Asia – Pacific
1. The Tokyo core CPI surged as the drop in communication equipment prices came out of the year-over-year figures.

2. The Taiwan dollar remains under pressure.

3. New Zealand’s housing market is feeling the effect of higher rates.
 Source: @topdowncharts Read full article
Back to Index
China
1. The renminbi continues to sink vs. USD.

Despite the recent selloff, the renminbi held up well in recent years relative to other EM currencies.
 Source: PGM Global
The currency also has remained relatively firm despite light credit impulse and a significant sell-off in Chinese equities.
 Source: PGM Global
——————–
2. Financial conditions continue to tighten.

3. State-owned developers’ onshore bond issuance rebounded last quarter.
 Source: Fitch Ratings
4. Hong Kong’s retail sales slumped in March.

Back to Index
Emerging Markets
1. Chile’s central bank announced another aggressive rate hike.

 Source: Bloomberg Read full article
Chile’s vehicle sales remain healthy.

——————–
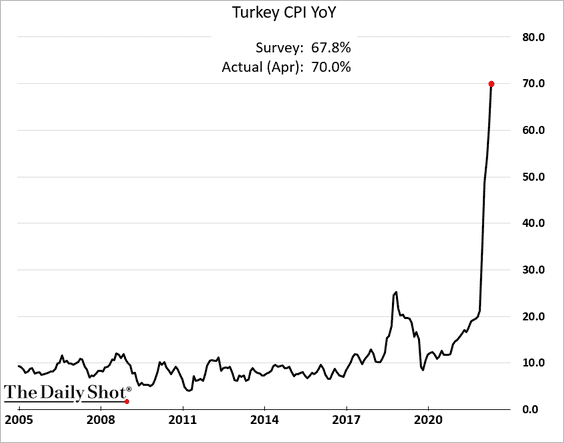
2. Turkey’s CPI hit 70%.
3. EM total leverage continues to climb.
 Source: PGM Global
Back to Index
Cryptocurrency
1. Bitcoin dipped below the uptrend support line.

2. The correlation between bitcoin and US growth equities is hitting record highs. Both are responding to the Fed’s policy tightening.

Here is the Nasdaq Composite and Bitcoin on Thursday,
 Source: @M_McDonough
——————–
3. Thursday’s sell-off triggered a spike in long BTC liquidations.
 Source: Coinglass Read full article
4. A large amount of BTC open interest was closed out during the sell-off.
 Source: @glassnode
5. The Luna Foundation Guard accumulated more BTC in its stablecoin reserve.
 Source: CoinDesk Read full article
6. A million-dollar typo caused a stir in crypto markets.
 Source: CoinDesk Read full article
Back to Index
Commodities
1. Gold is trading around fair value, according to Numera Analytics.
 Source: Numera Analytics
2. The silver-to-gold ratio hit the lowest level since mid-2020.

3. Similar to energy, capital spending in the metals and mining sector has not kept pace with rising prices.
 Source: PGM Global
Back to Index
Energy
1. Across US regions, the average breakeven prices to profitably drill a new well range from $48/barrel to $69/barrel.
 Source: Longview Economics
2. The number of newly approved drilling permits has increased to record high levels, which typically leads production by six-to-twelve months, according to Longview.
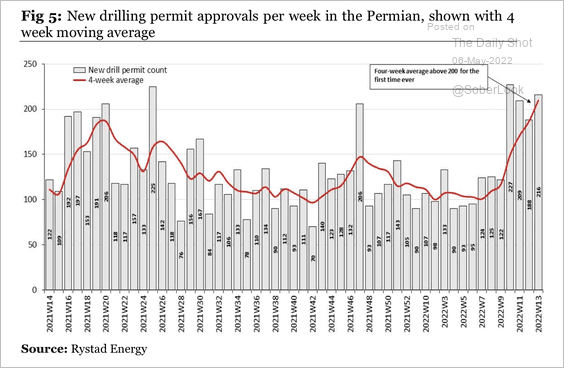 Source: Longview Economics
3. OPEC continues to produce below available quotas. This underproduction is expected to persist through the remainder of 2022.
 Source: Capital Economics
4. OECD commercial crude oil stocks are rapidly drawing down.
 Source: Capital Economics
5. US natural gas is nearing $9/mmbtu.

Back to Index
Equities
1. The market swings this week have been spectacular.
 Source: @R_Perli
• The Nasdaq 100 and the Nasdaq Composite took a 5% hit on Thursday, …

… as real rates surge.

• The Nasdaq 100 underperformance is widening.

——————–
2. The put-call ratio continues to signal anxiety in the market.

3. The S&P 500 forward P/E ratio is nearing support at 17x.

Consumer discretionary and technology P/E multiples are rapidly converging with utilities.
 Source: @Marcomadness2
——————–
4. Thematic ETFs are getting some capital inflows.

 Source: @jessefelder, @markets Read full article
——————–
5. Next, we have some sector updates.
• Banks:

• Consumer Discretionary:

• Tech:

• Industrials:

• Metals & Mining:

• Energy:

Finally, this chart from Evercore ISI shows how institutional investors are allocated across sectors vs. long-term averages.
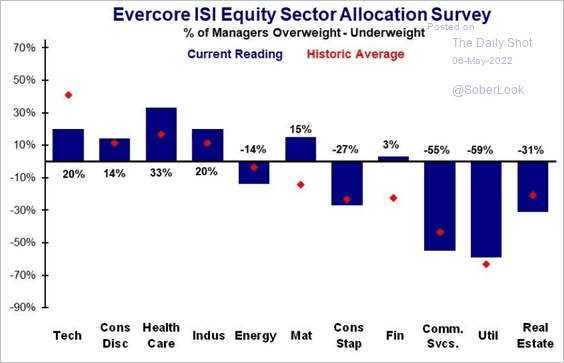 Source: Evercore ISI Research
Back to Index
Credit
1. The drawdown in high-yield bonds continues to worsen.

2. Green bond issuance has slowed.
 Source: S&P Global Market Intelligence
Back to Index
Rates
1. T-bill demand continues to surge as investors exit risk assets. The bill spread to OIS hit the widest level since the financial crisis.

2. Here is the attribution of bond yield gains in the US, UK, and Germany in April.
 Source: Barclays Research
Back to Index
Global Developments
1. The US dollar continues to climb.

• The US currency is now testing resistance.
 Source: SentimenTrader
• Below is the year-to-date performance across DM currencies.
 Source: Capital Economics
• This chart shows the Capital Economics forecast for currency moves relative to USD for the rest of the year.
 Source: Capital Economics
——————–
2. Finally, we have the year-to-date returns by asset class.
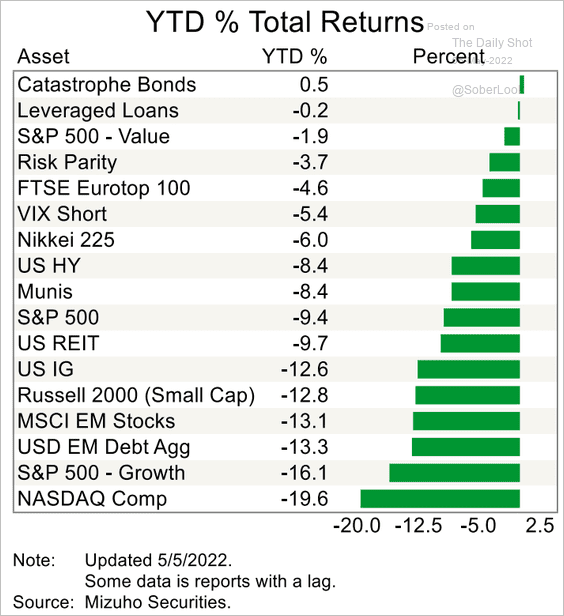 Source: Mizuho Securities USA
——————–
Food for Thought
1. US households’ savings and checking account balances:
 Source: BofA Global Research; @SamRo
2. The change in income status since 1971:
 Source: Pew Research Center Read full article
3. The decline in middle-class income share:
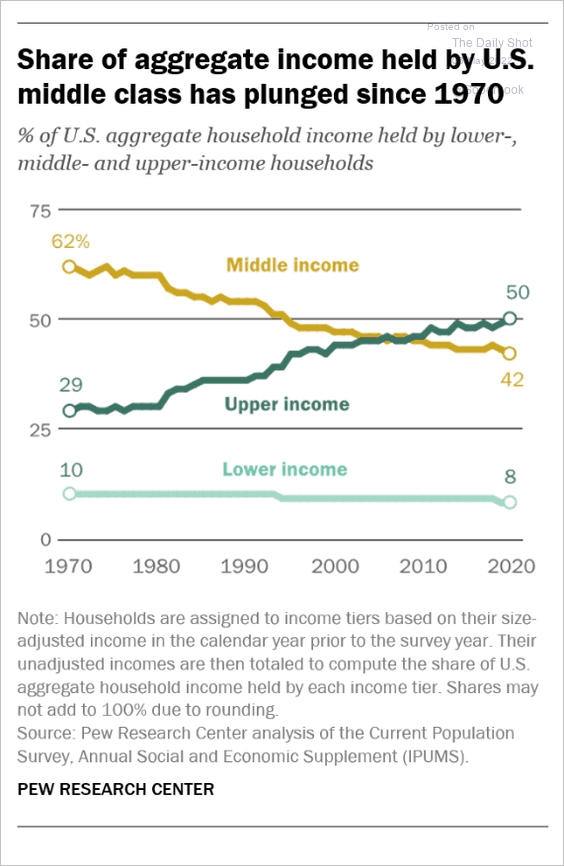 Source: Pew Research Center Read full article
4. Support for airport mask mandates:
 Source: @axios Read full article
5. Support for cannabis legalization:
 Source: FiveThirtyEight Read full article
6. The most searched news site in each state:
 Source: @statspanda1 Read full article
7. Support for Ukraine as a share of GDP:
 Source: The Economist Read full article
8. The longest living animals:

——————–
Have a great weekend!
Back to Index