
The Daily Shot: 14-Jul-22
• The United States
• Canada
• The United Kingdom
• The Eurozone
• Asia – Pacific
• China
• Emerging Markets
• Cryptocurrency
• Commodities
• Energy
• Equities
• Credit
• Global Developments
• Food for Thought
The United States
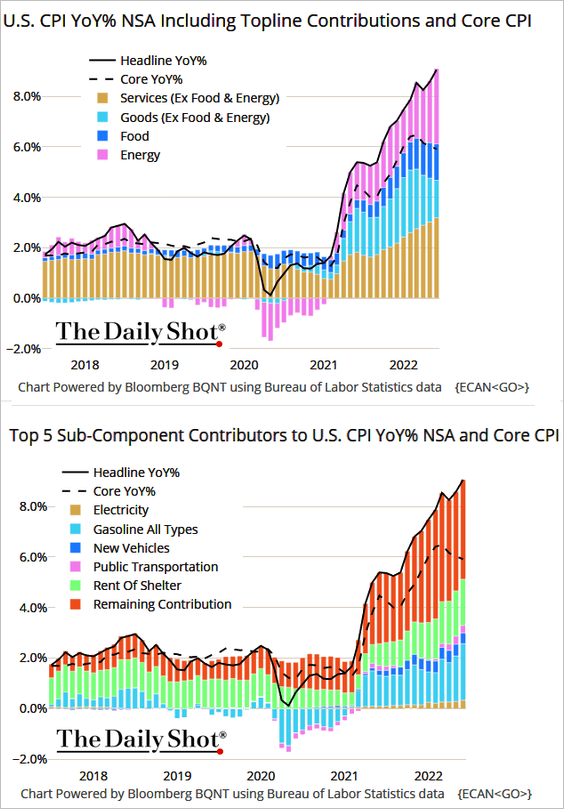
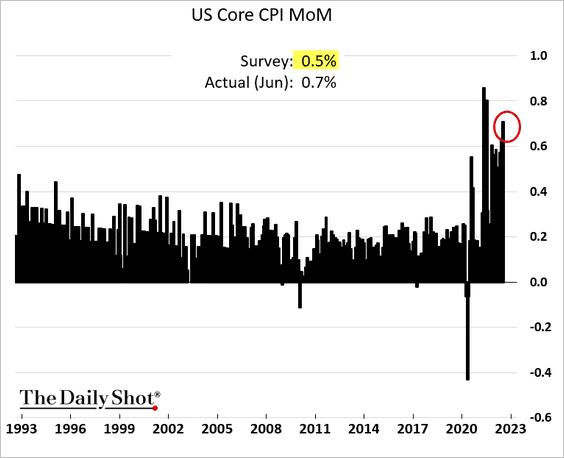
1. The June CPI report delivered another shocker, with price gains exceeding most forecasts.

Here is the attribution chart.
 Source: @TheTerminal, Bloomberg Finance L.P.
• On a month-over-month basis, inflation accelerated broadly.
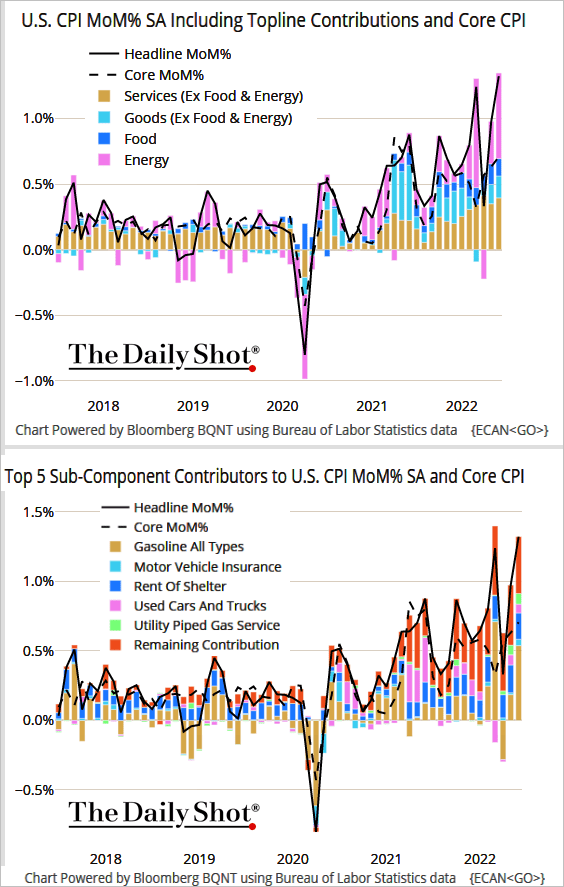 Source: @TheTerminal, Bloomberg Finance L.P.
• Here are Bloomberg’s diffusion indices for monthly CPI changes.
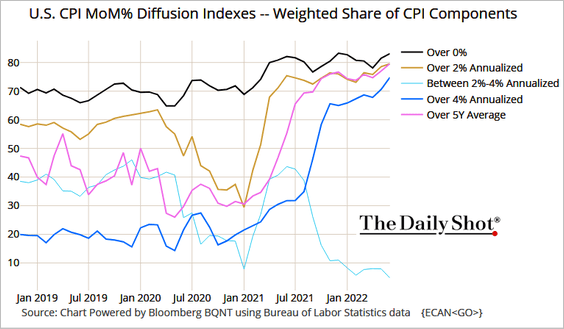 Source: @TheTerminal, Bloomberg Finance L.P.
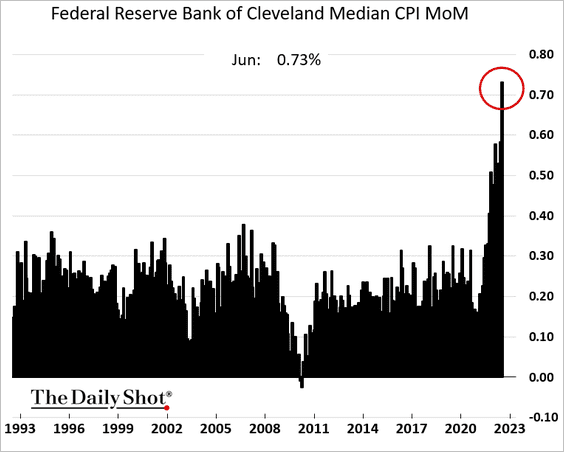
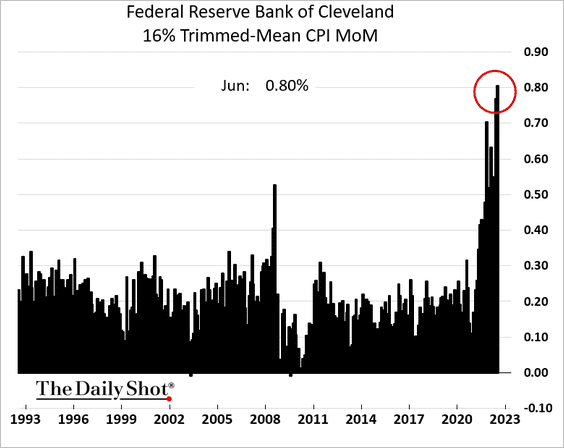
• Alternative core inflation measures hit multi-decade highs.
– Median CPI (points to broad inflation gains):
– Trimmed-mean CPI:
• Core goods inflation rebounded.
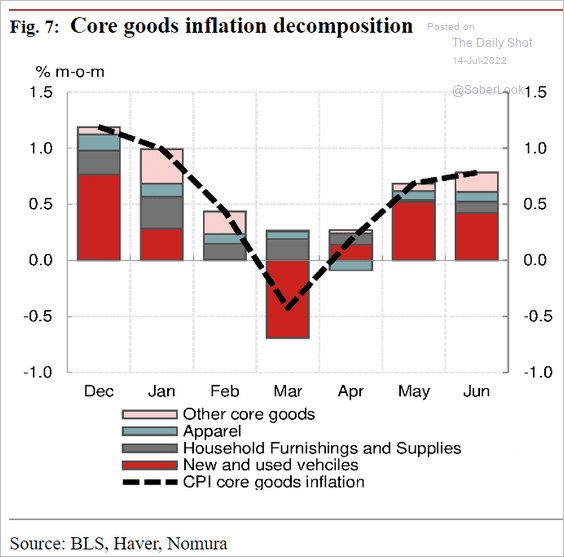 Source: Nomura Securities
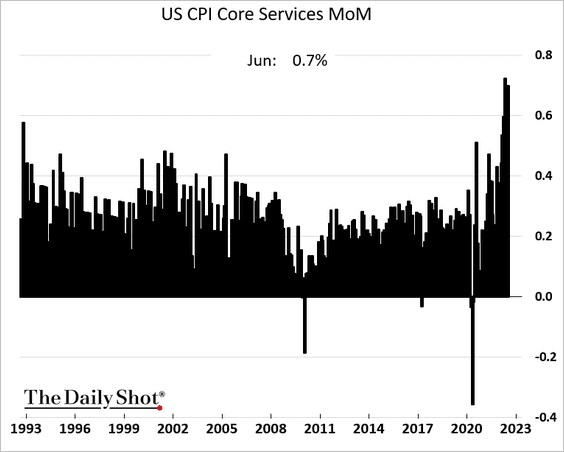
• Core services CPI continued to surge.
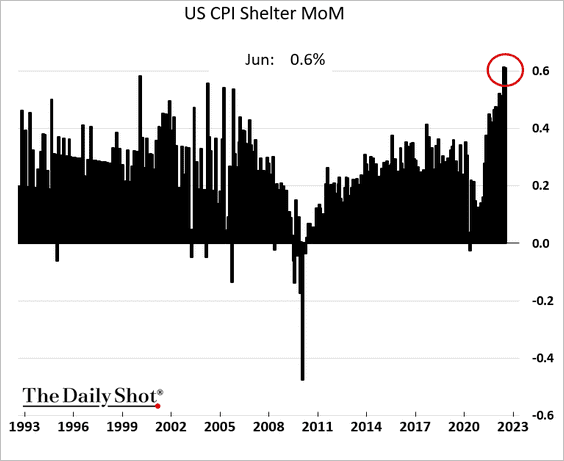
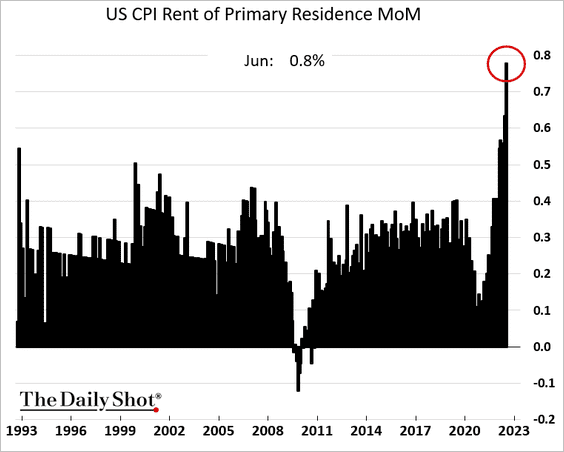
• Shelter inflation keeps surprising to the upside.
– Rent:
– Owners’ equivalent rent (2 charts):
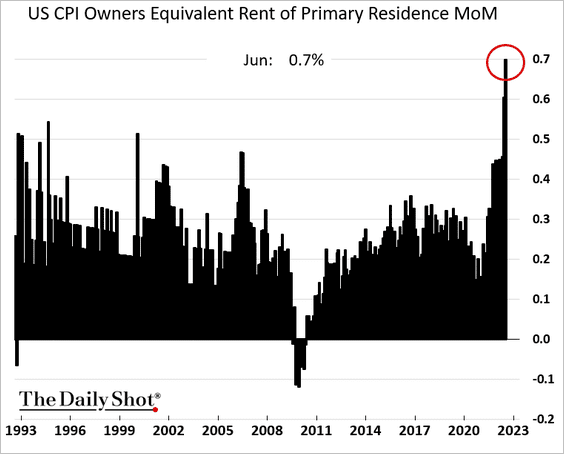
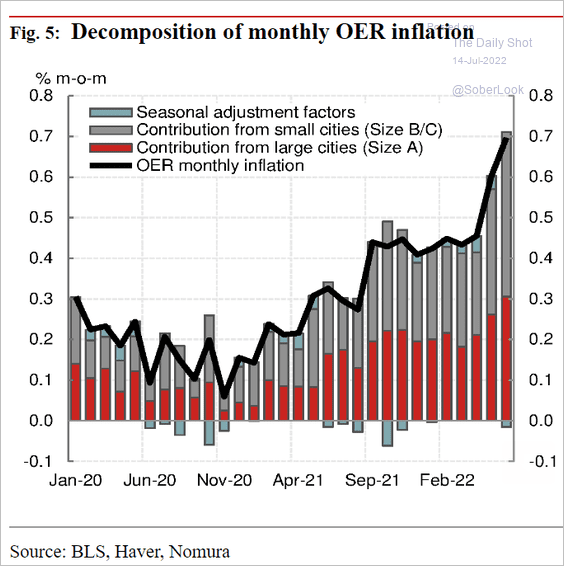 Source: Nomura Securities
We will have more data from the CPI report tomorrow.
——————–
2. The market immediately priced in a significant probability of a 100 bps Fed rate hike this month (boosted by the Bank of Canada’s shocker and forecasts from several economists).
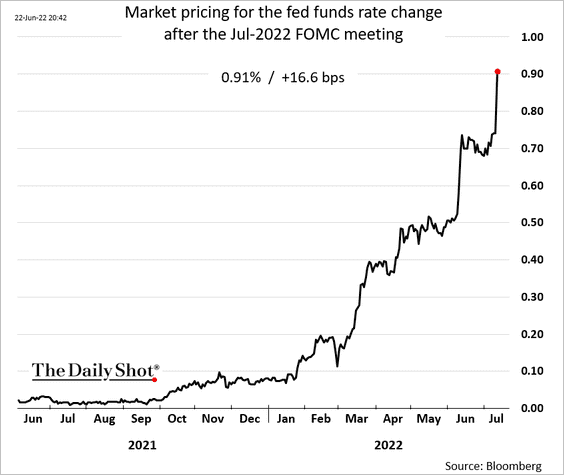
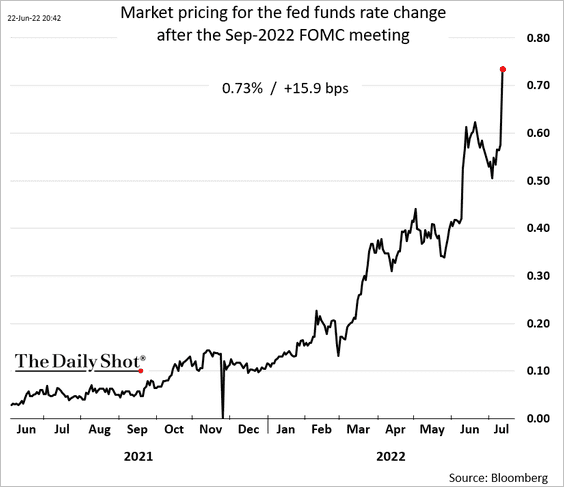
And September now looks like a 75 bps increase.
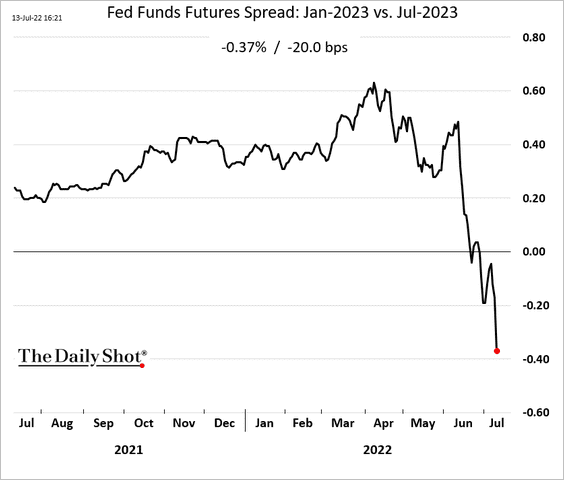
• The market also expects bigger rate cuts in the first half of next year as recession sets in.
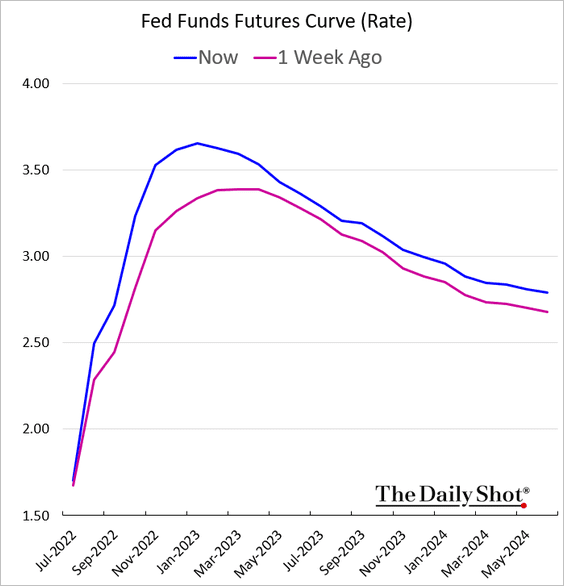
• The terminal rate climbed back above 3.5%.
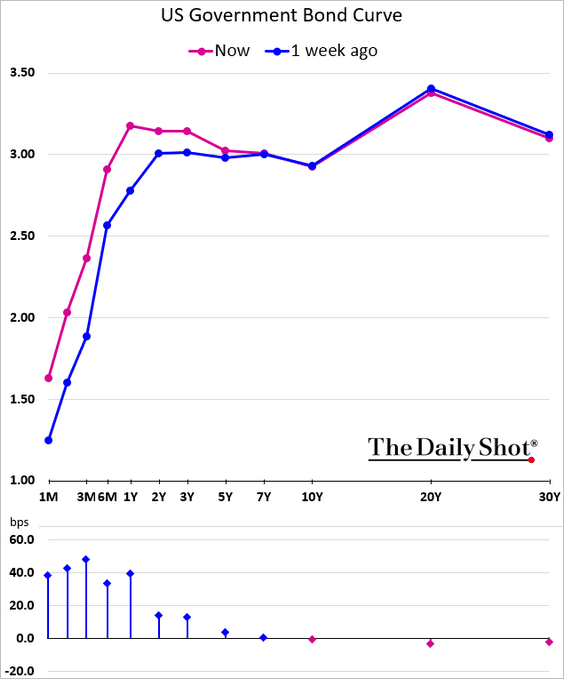
• Short-term Treasury yields jumped.
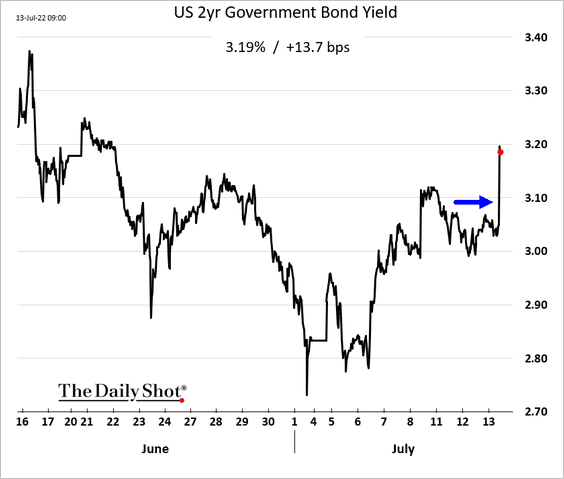
The Treasury curve hasn’t been this inverted since 2000.

• Market-based inflation expectations have been moderating.
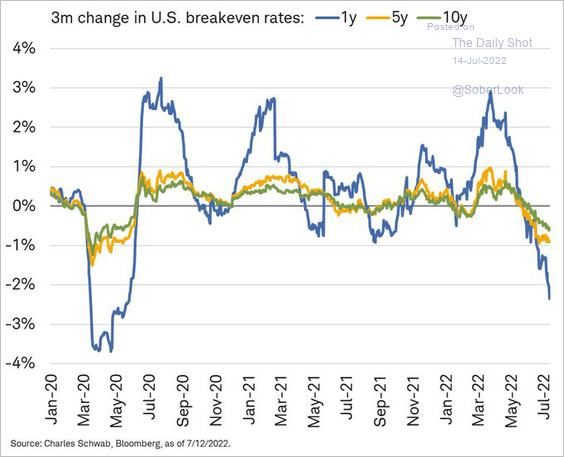 Source: @LizAnnSonders
——————–
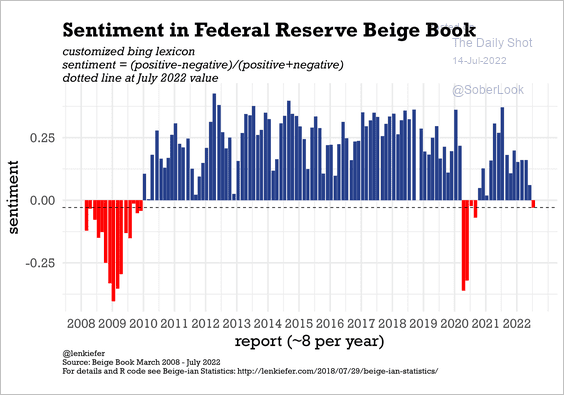
3. The Fed’s Beige Book is sending a warning signal.
The Beige Book: – … several Districts reported growing signs of a slowdown in demand, and contacts in five Districts noted concerns over an increased risk of a recession. Most Districts reported that consumer spending moderated as higher food and gas prices diminished households’ discretionary income.
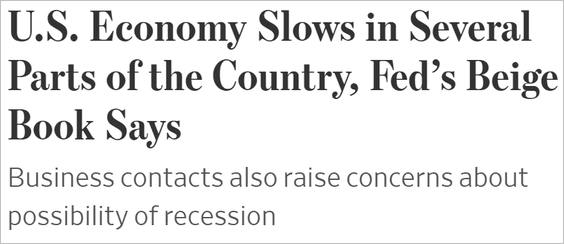 Source: @WSJ Read full article
Sentiment has deteriorated.
 Source: @lenkiefer
——————–
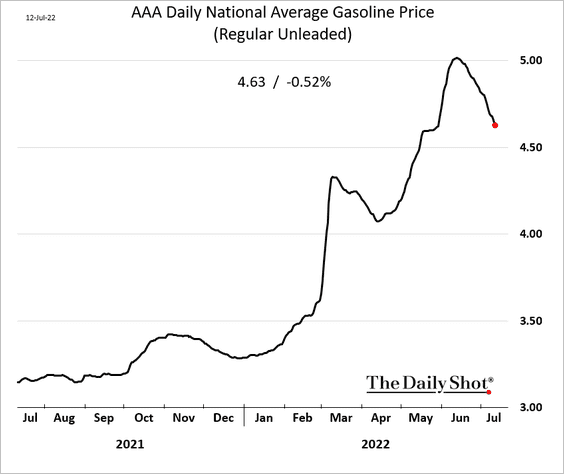
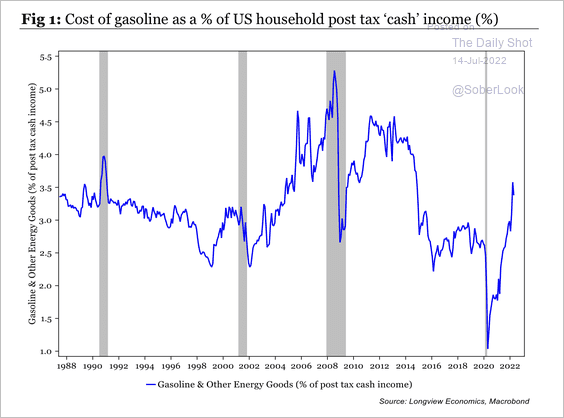
4. US gasoline prices continue to ease.
Filling up the tank is absorbing around 3.5% of household income.
 Source: Longview Economics
——————–
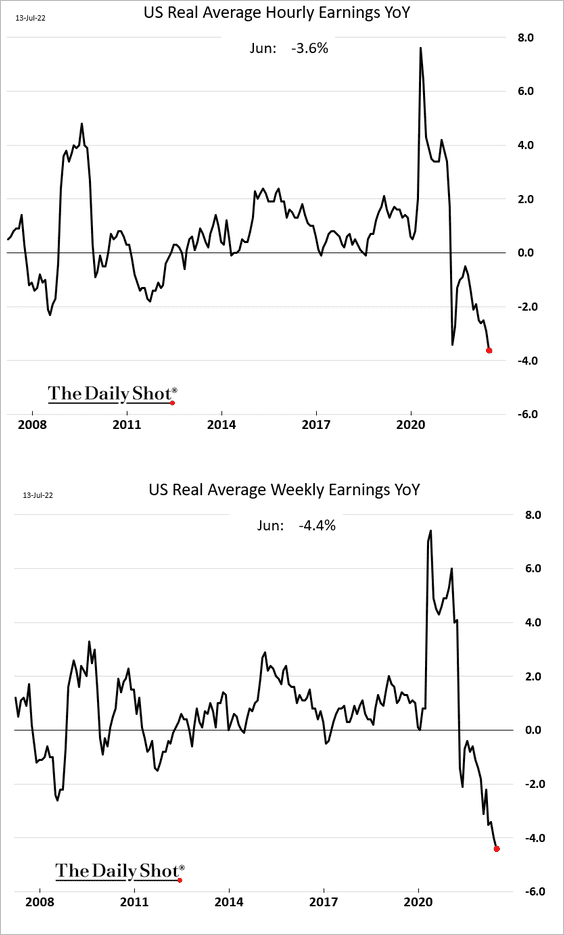
5. Real wages are sinking.
Back to Index
Canada
1. The BoC surprised the markets with a 100 bps hike. The Fed is likely to follow.
 Source: Reuters Read full article
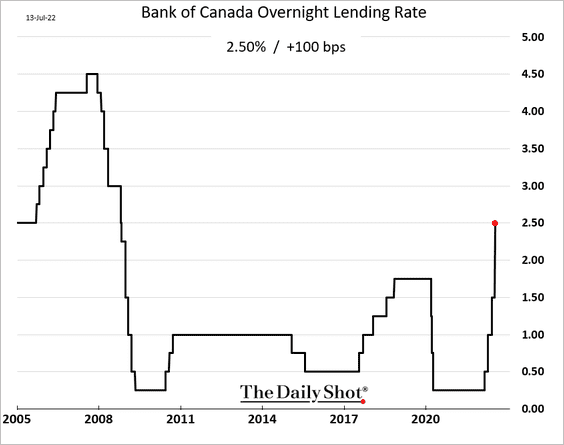
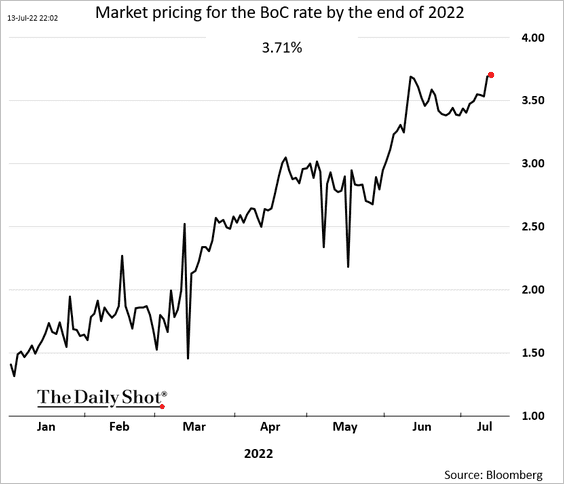
• The BoC is now expected to take rates above 3.7% by the end of the year.
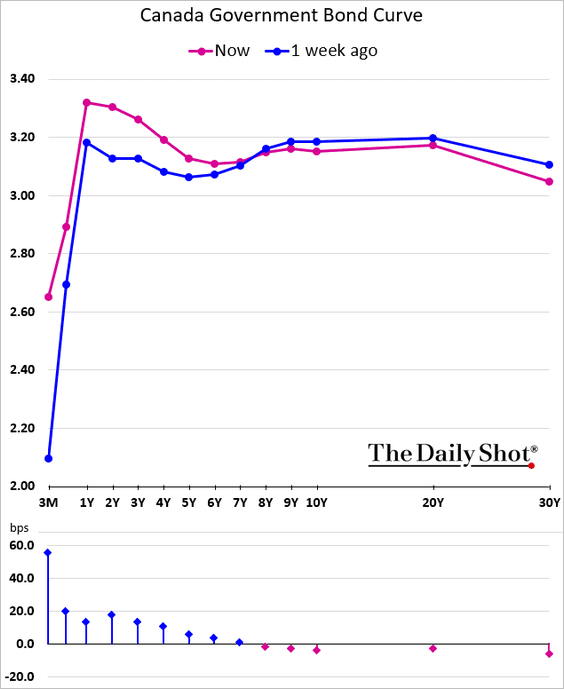
• The yield curve is highly inverted now.
——————–
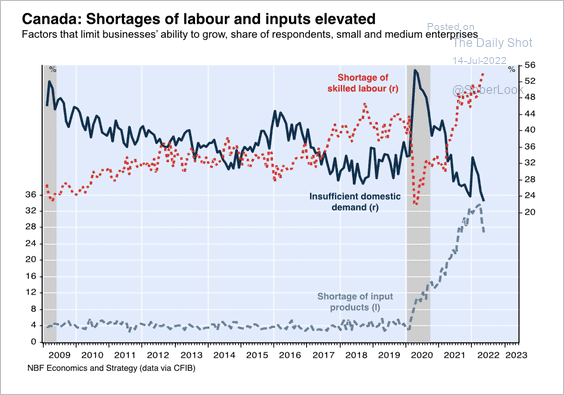
2. There is a record shortage of labor and input products.
 Source: Economics and Strategy Group, National Bank of Canada
3. Purchasing power has not kept pace with surging house prices.
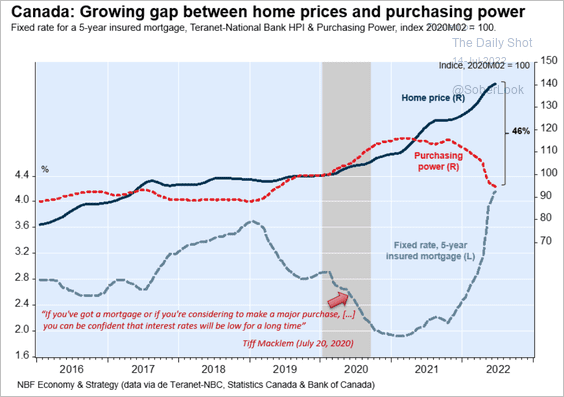 Source: Economics and Strategy Group, National Bank of Canada
Back to Index
The United Kingdom
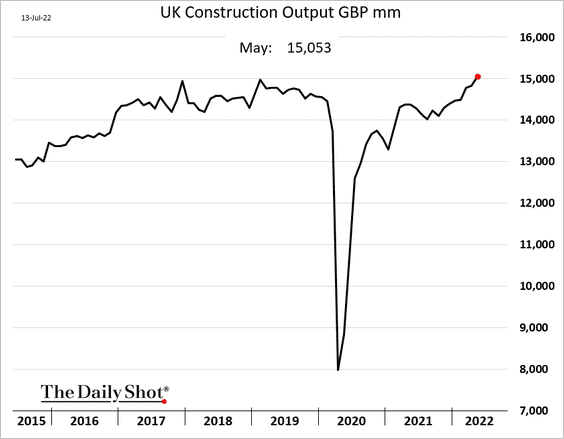
1. As we mentioned yesterday, the monthly GDP estimate topped expectations.
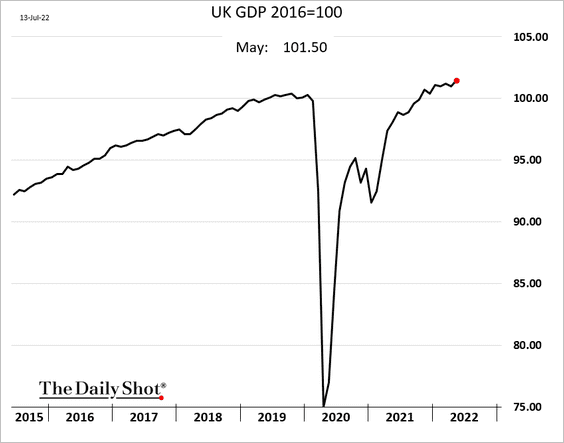
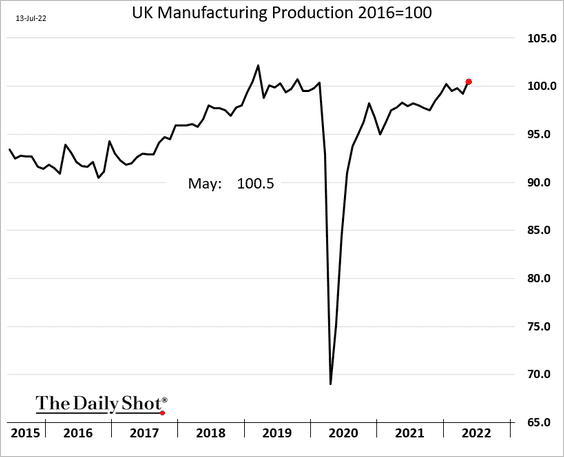
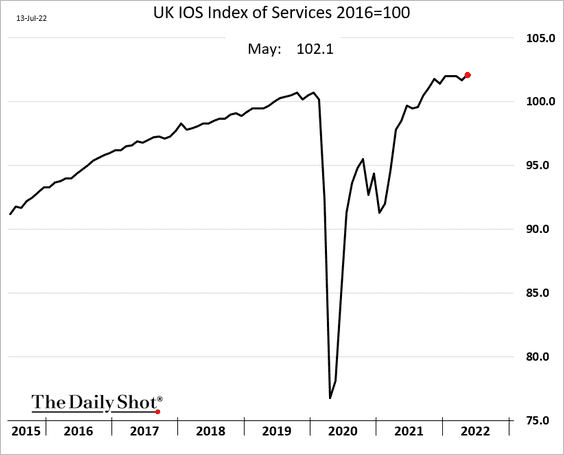
All major business sectors exceeded forecasts.
• Manufacturing:
• Services:
• Construction:
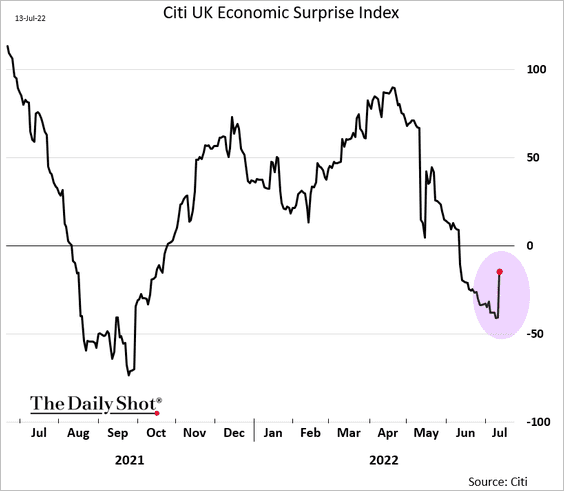
The Citi Economic Surprise Index jumped.
——————–
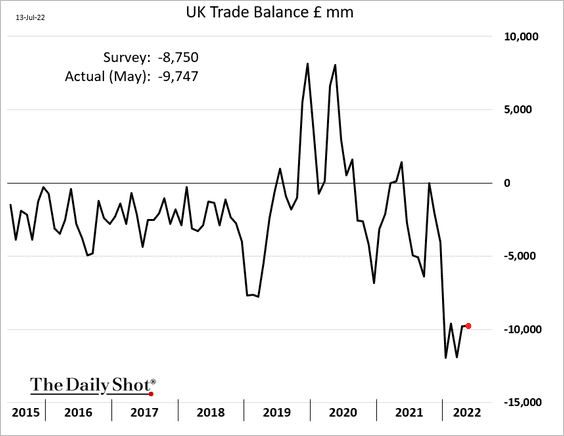
2. UK’s trade gap was wider than expected in May.
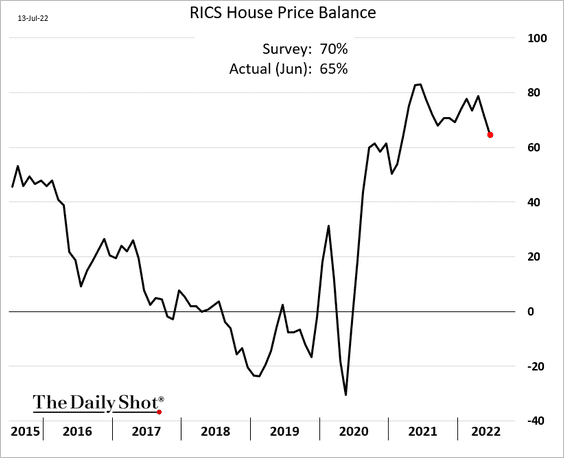
3. The housing market cooled somewhat last month.
Back to Index
The Eurozone
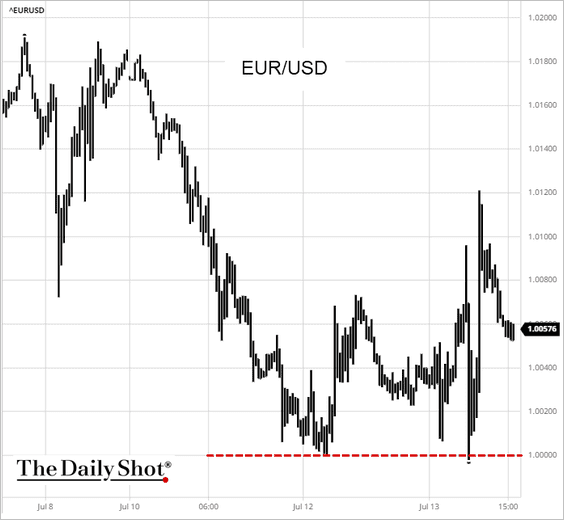
1. For now, the euro is holding support at parity.
 Source: barchart.com
The ECB needs to boost the euro to ease energy pain.
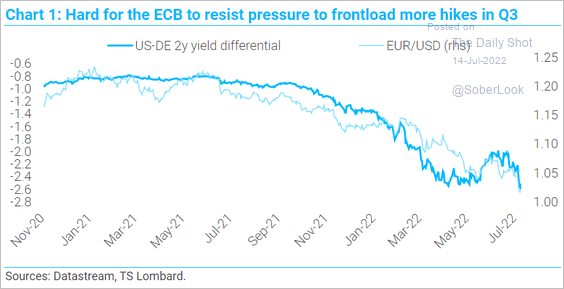 Source: TS Lombard
——————–
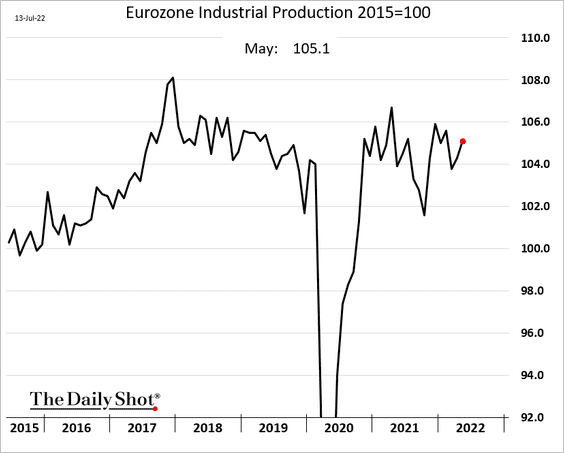
2. Euro-area industrial production improved in May.
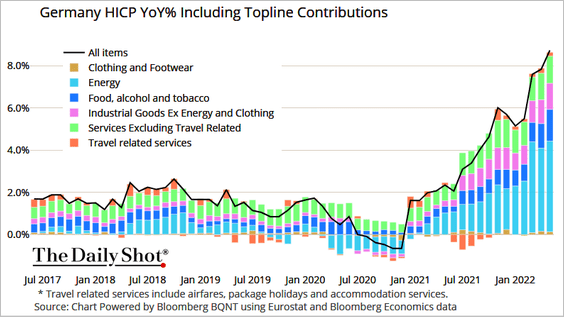
3. Here are the components of Germany’s CPI.
 Source: @TheTerminal, Bloomberg Finance L.P.
Back to Index
Asia – Pacific
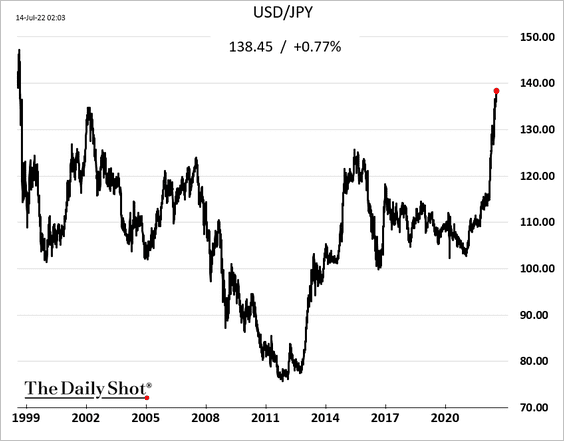
1. The yen hit the lowest level since 1998, with USD/JPY approaching 140.
2. Here is Bloomberg’s Asia currency index.
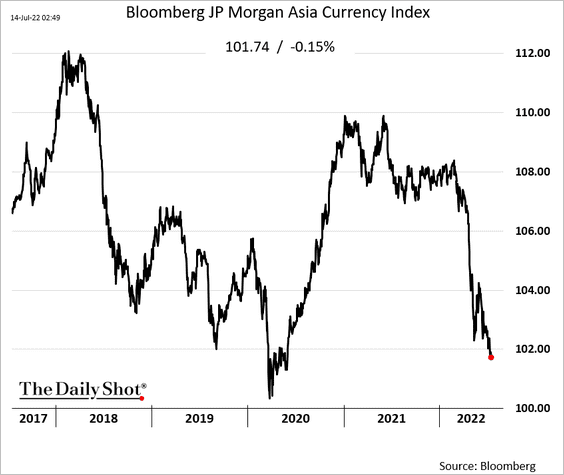
Asian currencies have declined alongside the selloff in cyclical versus defensive stocks.
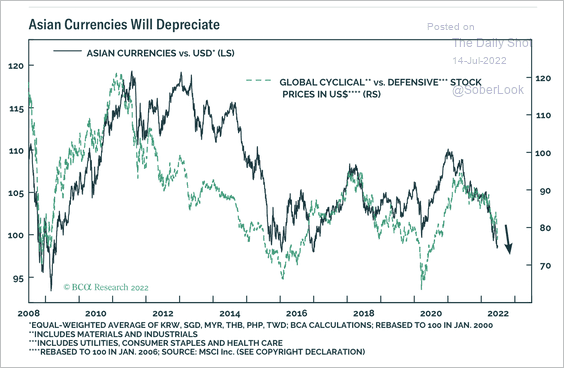 Source: BCA Research
——————–
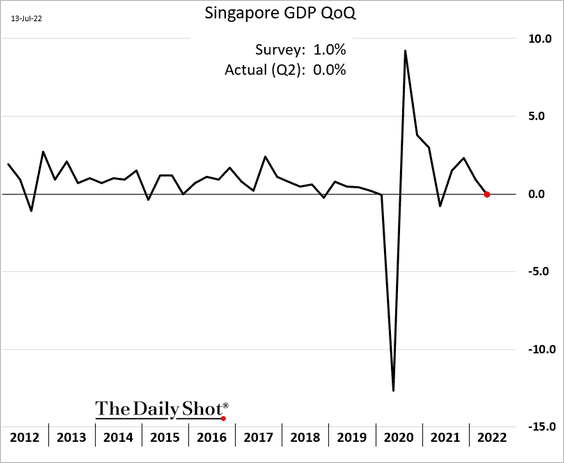
3. Singapore’s economy was flat last quarter. We are probably looking at a decline in Q3.
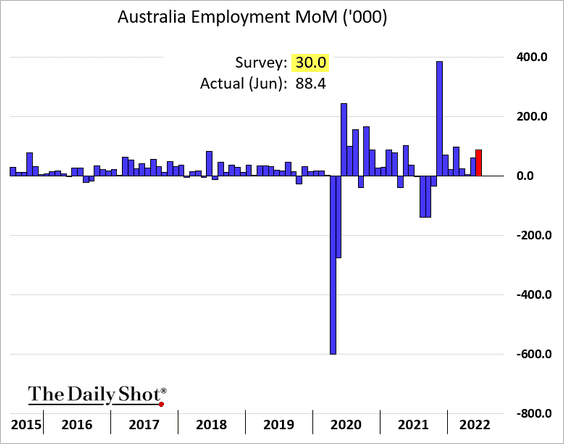
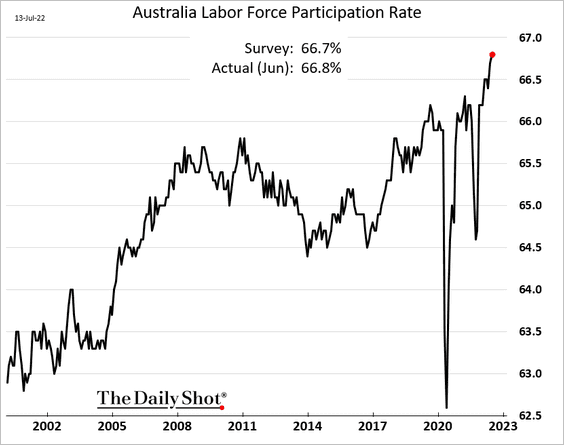
4. Australia’s labor market remains remarkably strong.
• Job gains (almost three times the number expected):
• The unemployment rate (lowest since 1974):
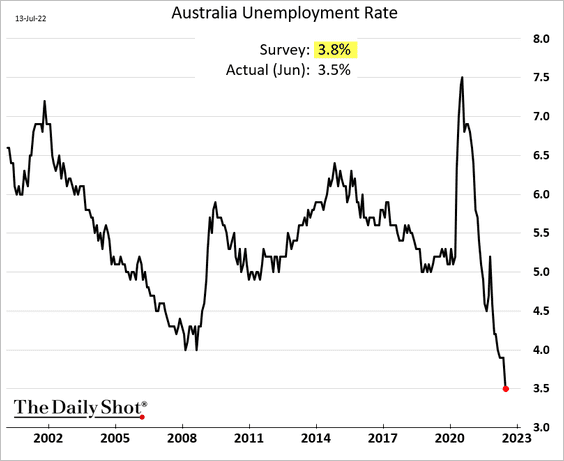
 Source: Reuters Read full article
• Labor force participation (amazing!):
Back to Index
China
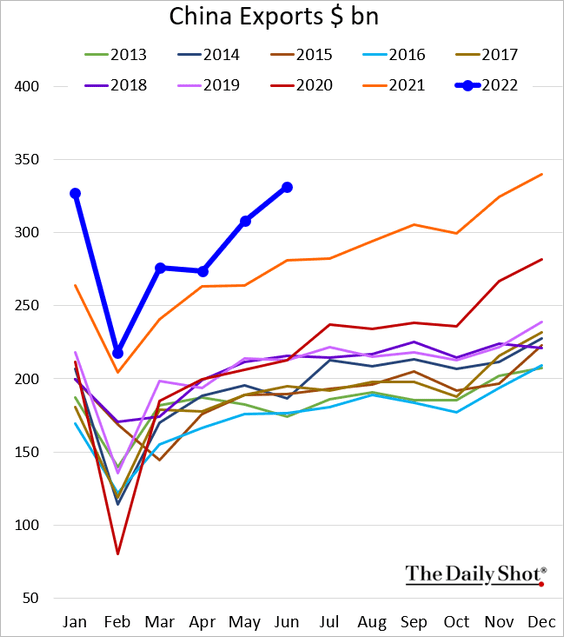
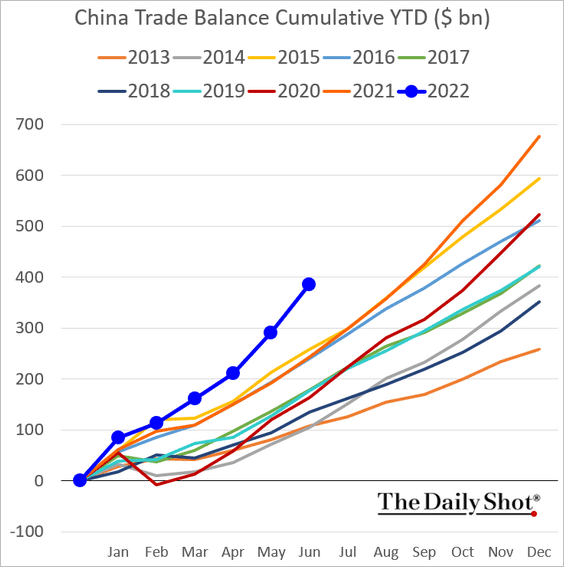
1. Exports accelerated last month.
 Source: Reuters Read full article
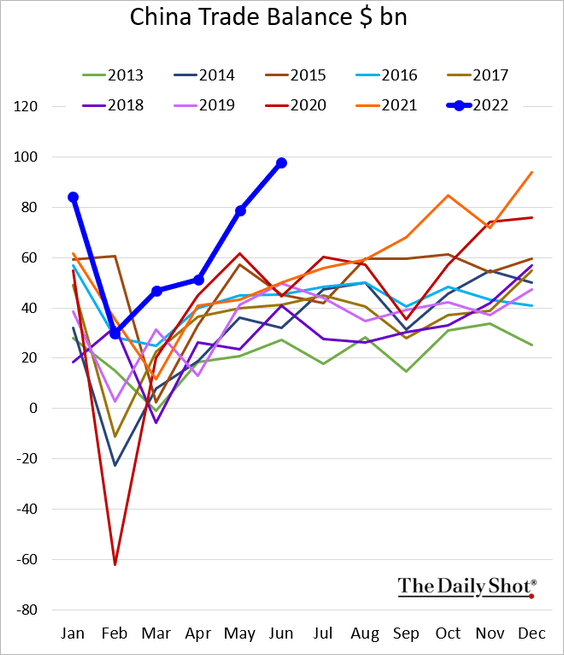
Import gains were more modest, …
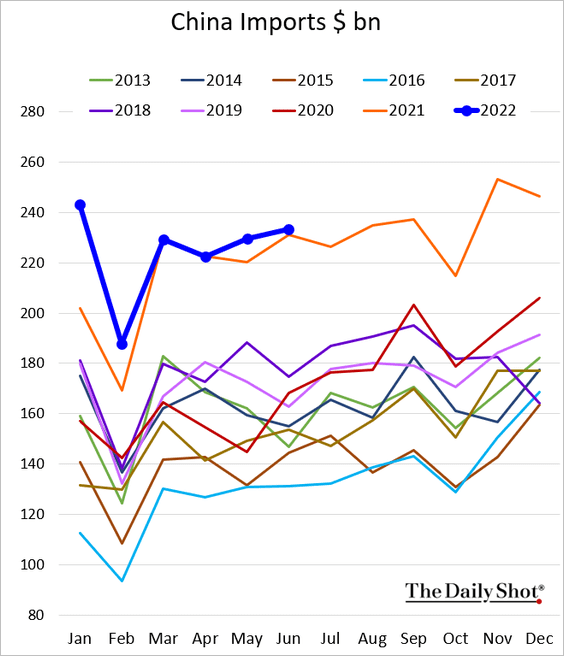
… resulting in a surge in China’s trade surplus.
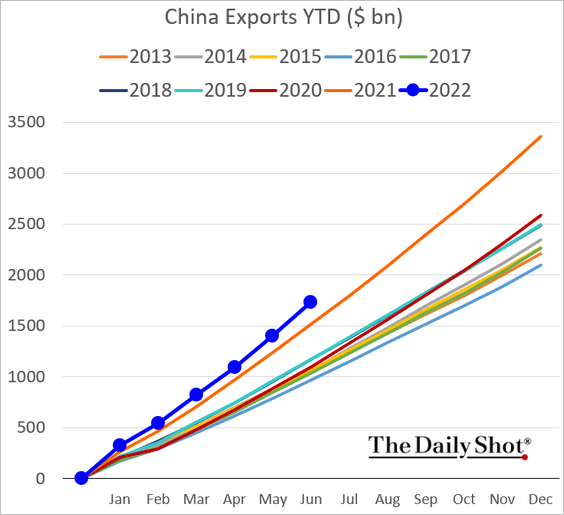
Here are the cumulative year-to-date charts.
——————–
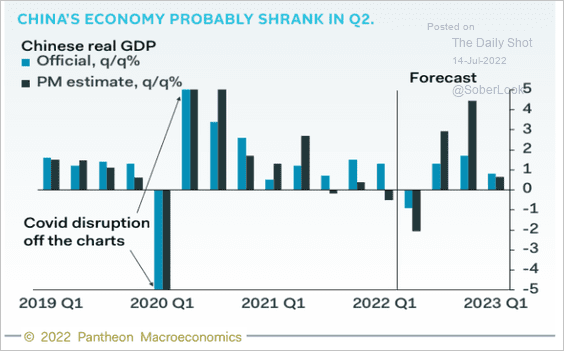
2. The economy probably contracted last quarter due to lockdowns.
 Source: Pantheon Macroeconomics
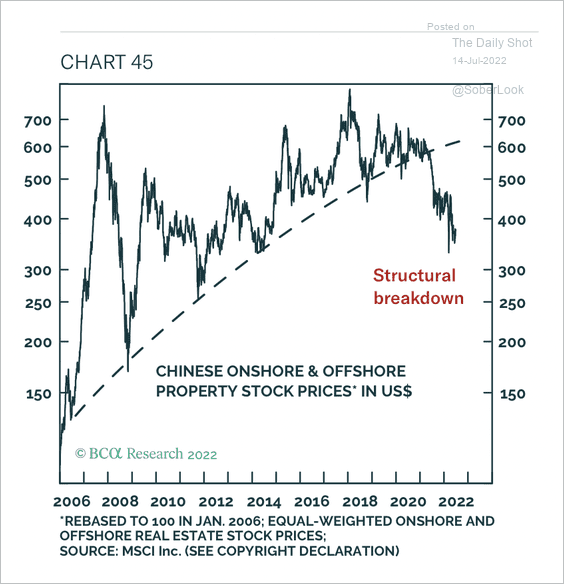
3. Property stocks have broken below their long-term uptrend.
 Source: BCA Research
Back to Index
Emerging Markets
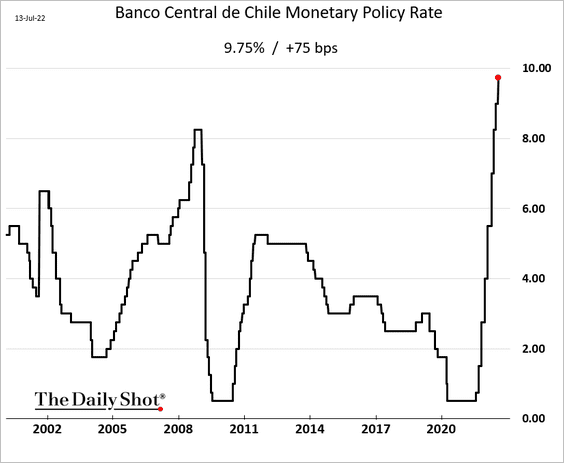
1. Chile’s central bank hiked rates again and promised more to come.
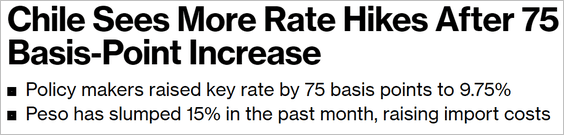 Source: Bloomberg Read full article
——————–
2. The Philippine central bank surprised the markets with a 75 bps hike.
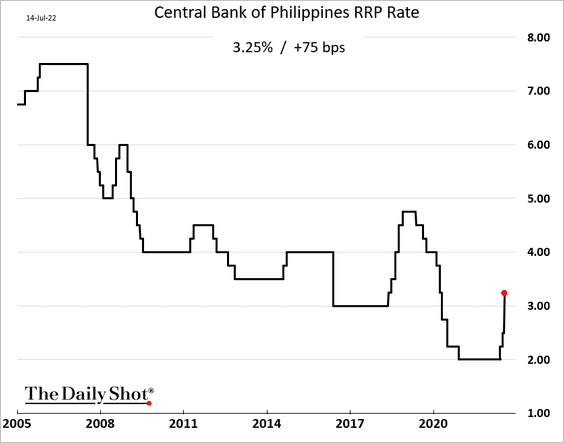
 Source: Reuters Read full article
——————–
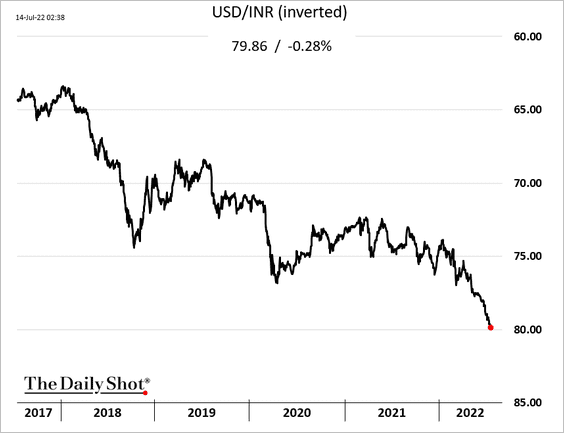
3. The Indian rupee continues to hit record lows, approaching 80 to the dollar.
4. Next, we have EM exposure to an economic downturn in the EU.
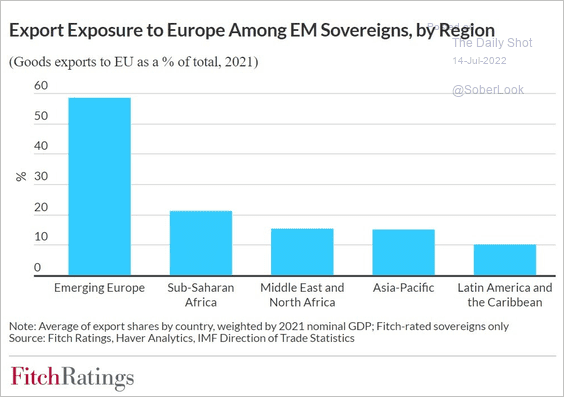 Source: Fitch Ratings
Back to Index
Cryptocurrency
1. This chart shows the crypto market capitalization by segment.
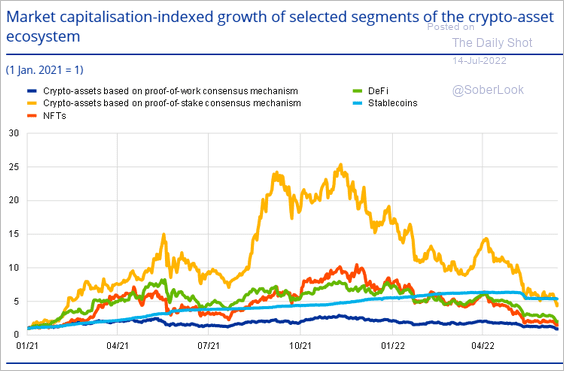 Source: ECB Read full article
2. Celsius filed for bankruptcy.
 Source: Reuters Read full article
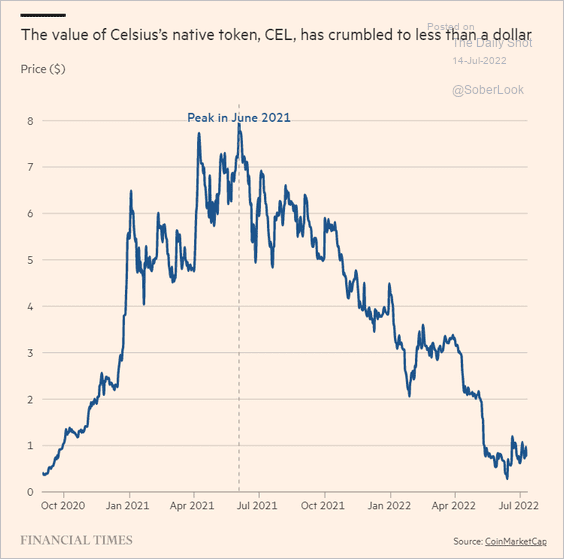 Source: @financialtimes Read full article
Back to Index
Commodities
1. Gold is entering a seasonally favorable period.
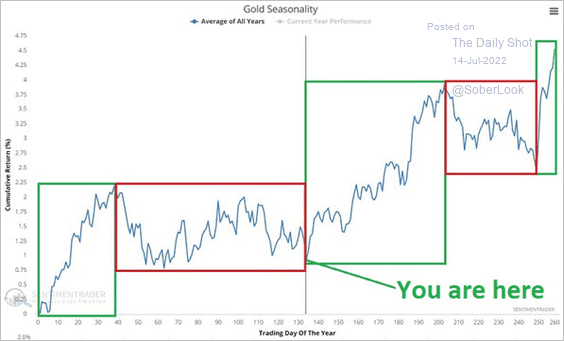 Source: SentimenTrader
Gold is testing the uptrend support.
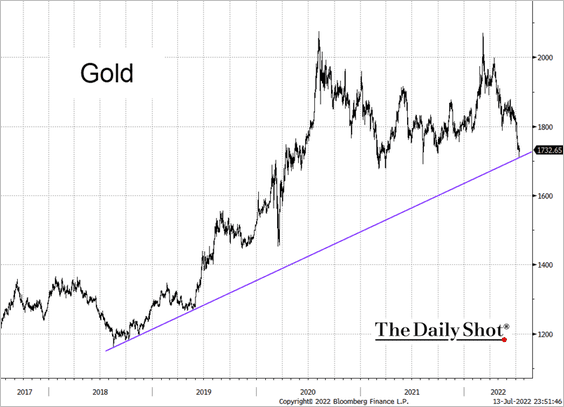 Source: @TheTerminal, Bloomberg Finance L.P.
——————–
2. Most commodities are significantly below their peak from the last couple of years.
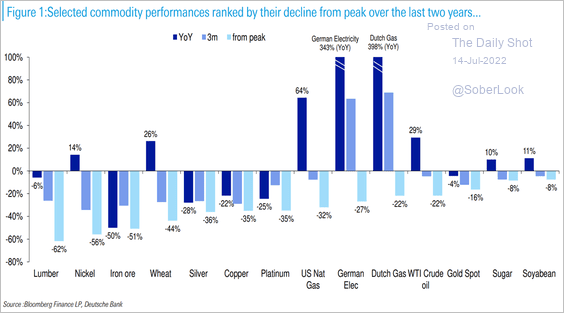 Source: Deutsche Bank Research
Back to Index
Energy
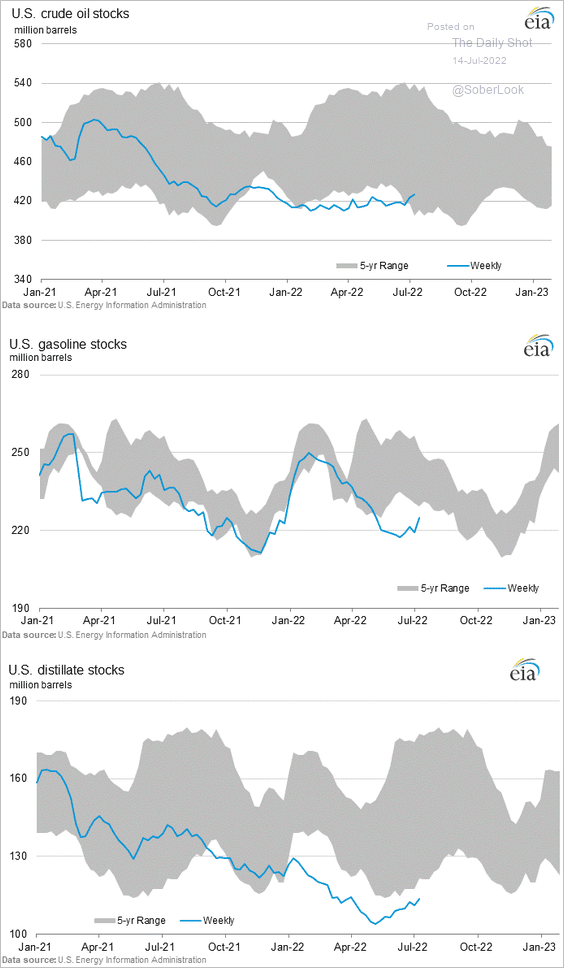
1. US gasoline demand tumbled last week.
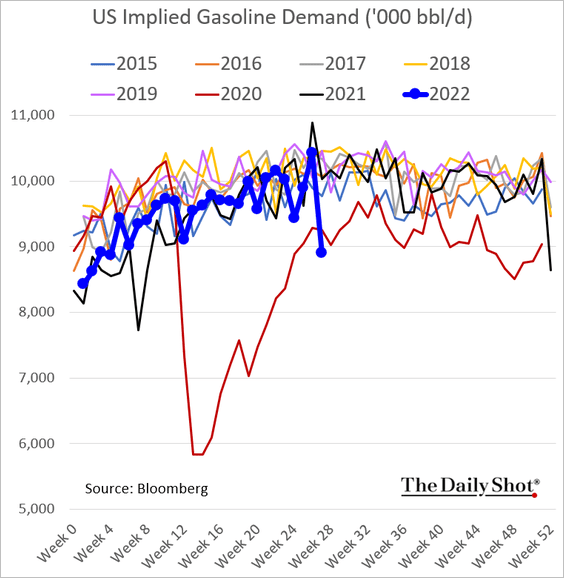
Americans are cutting back.
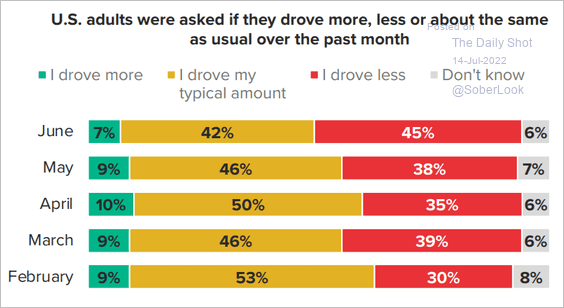 Source: Morning Consult
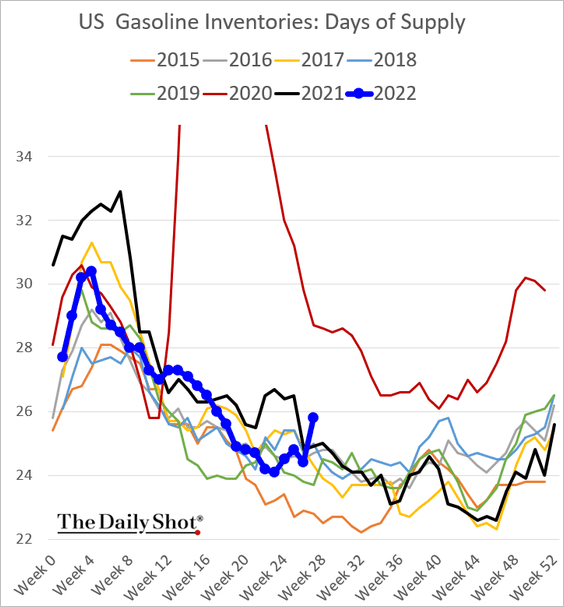
Gasoline inventories jumped.
2. US crude oil inventories are back inside the 5-year range.
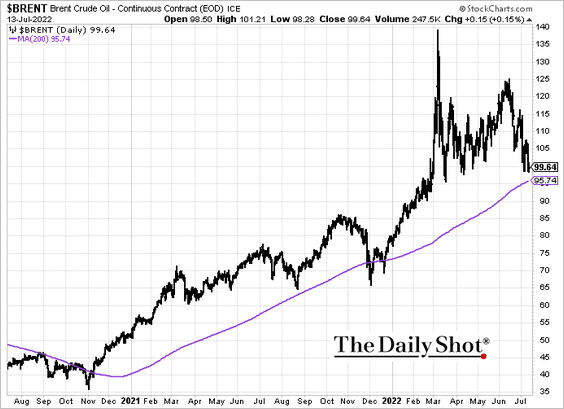
3. Will Brent test support at the 200-day moving average?
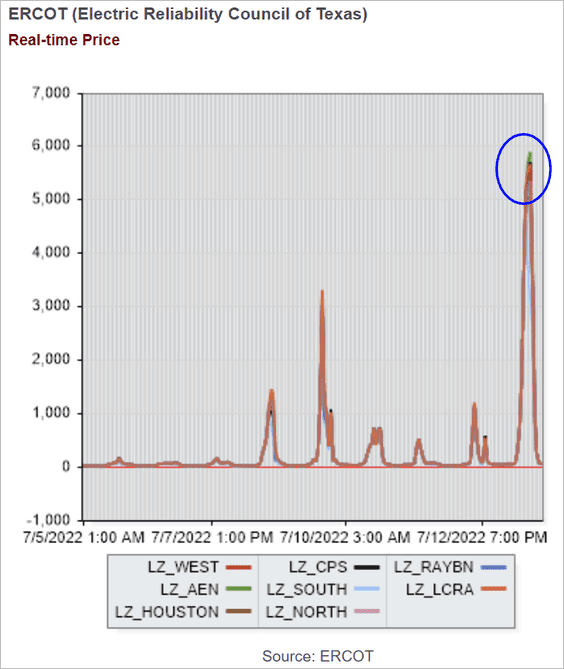
4. Texas electricity prices are soaring.
 Read full article
Back to Index
Equities
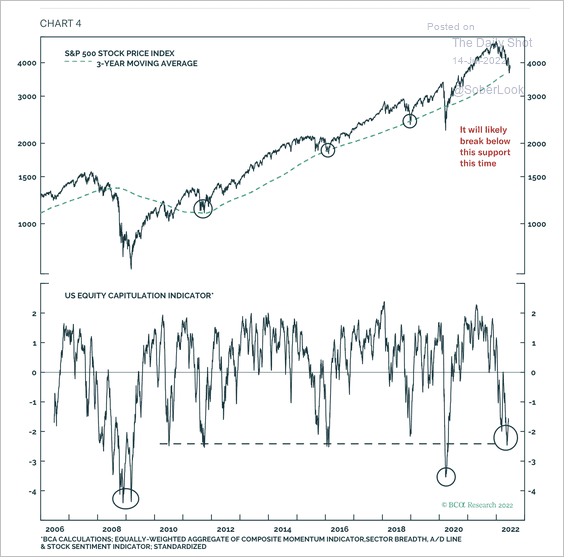
1. Capitulation is not yet extreme in the S&P 500.
 Source: BCA Research
2. Typically, market turnarounds occur after 90% of stocks cross above their 50-day moving average. We are not there yet.
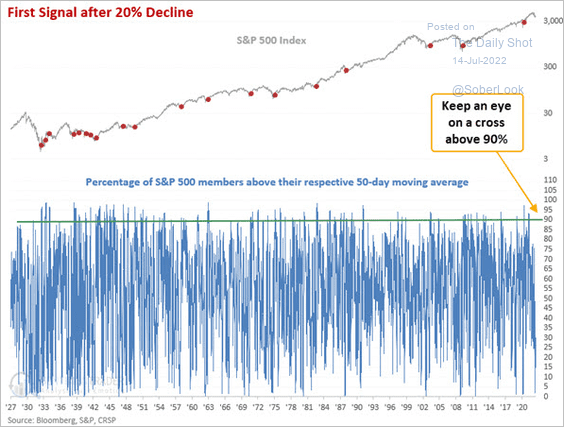 Source: SentimenTrader
3. The S&P 500 Q2 consensus earnings expectations have been deteriorating outside of the energy and materials sectors.
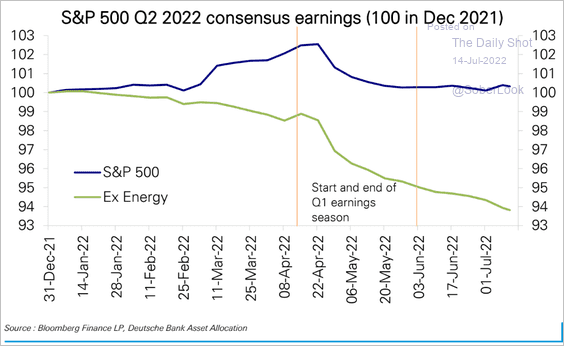 Source: Deutsche Bank Research
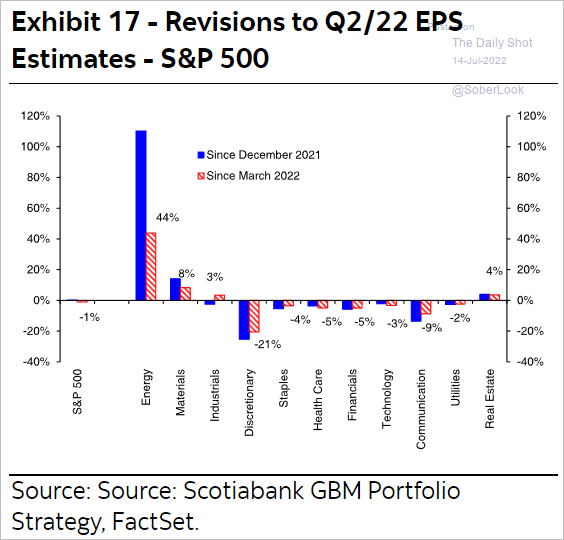 Source: Hugo Ste-Marie, Portfolio & Quantitative Strategy Global Equity Research, Scotia Capital
——————–
4. Valuations of growth stocks versus value stocks remain elevated.
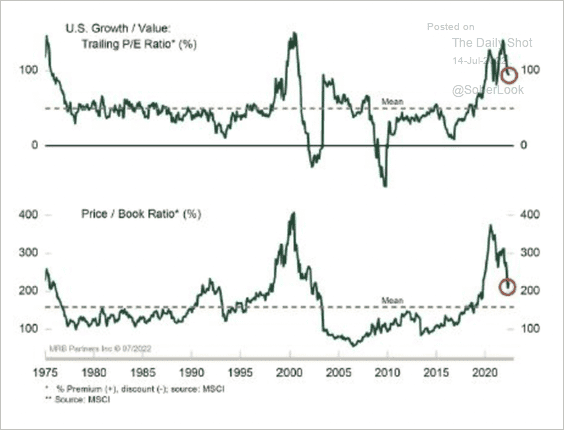 Source: MRB Partners
5. Will the correction in commodities trigger another leg lower in stocks?
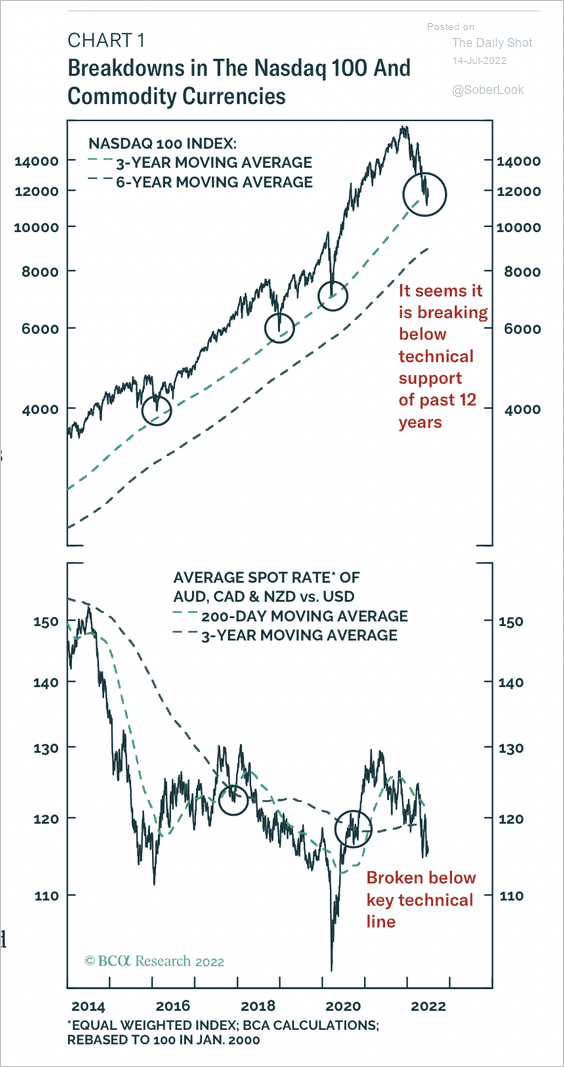 Source: BCA Research
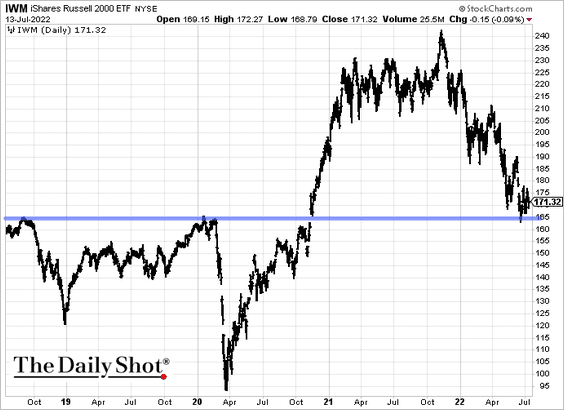
6. The Russell 2000 is holding support for now.
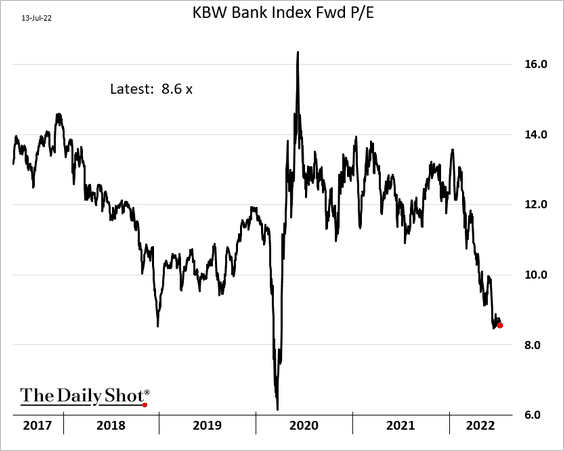
7. Bank shares have underperformed sharply this month.
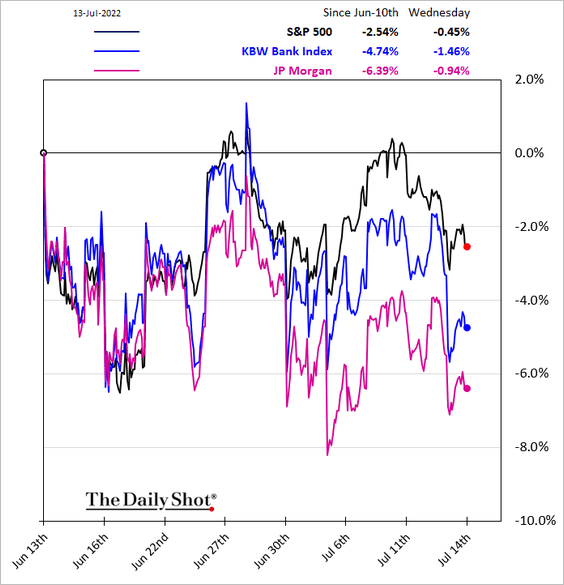
Valuations look attractive.
——————–
8. Which sectors have the highest operating leverage?
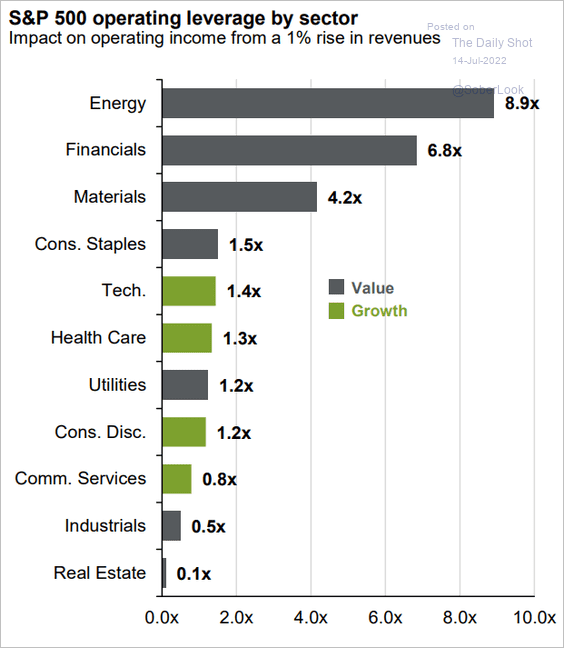 Source: J.P. Morgan Asset Management
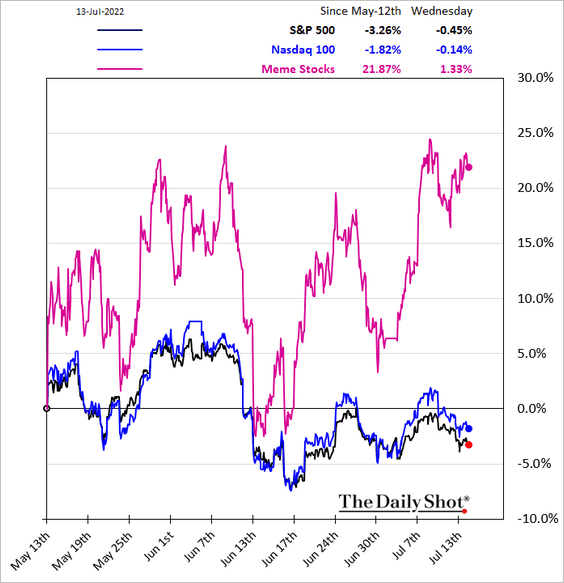
9. Meme stocks have been rallying.
Back to Index
Credit
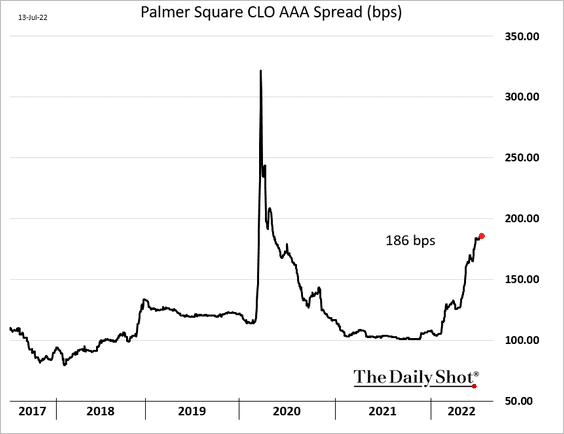
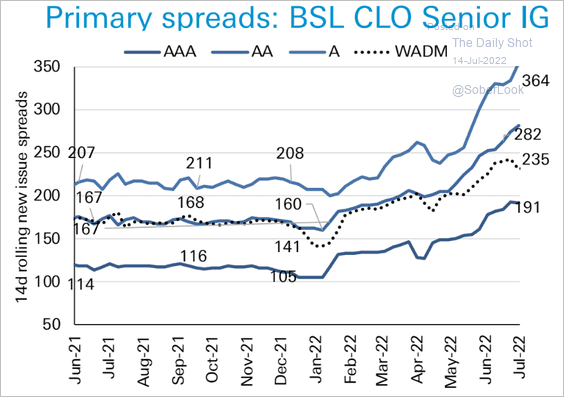
1. CLO funding costs continue to climb.
 Source: Deutsche Bank Research
——————–
2. European HY spreads have diverged from equity implied vol.
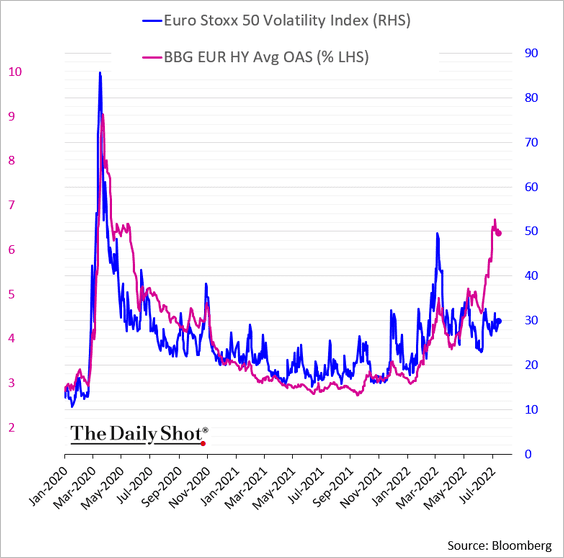 h/t @mikamsika
3. This chart shows cumulative fund flows across credit asset classes over the past 12 months.
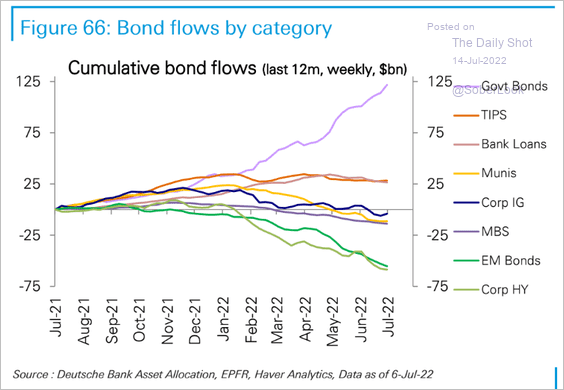 Source: Deutsche Bank Research
Back to Index
Global Developments
1. Financial stress levels and the US dollar tend to be correlated.
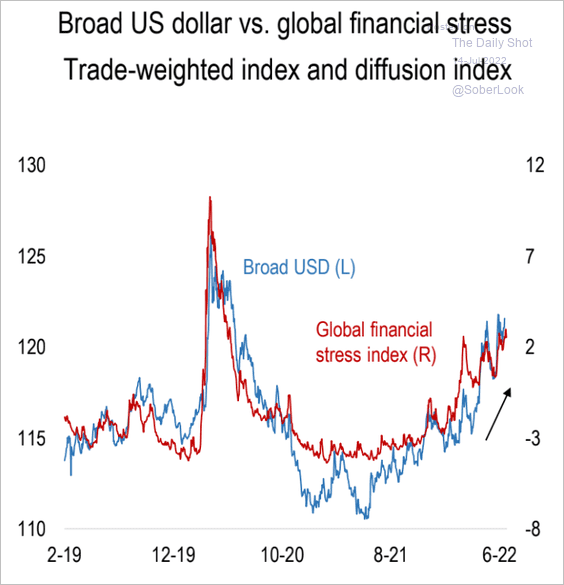 Source: Numera Analytics
2. The construction sector is grappling with labor shortages as Covid-induced restrictions limit the movement of workers across international borders.
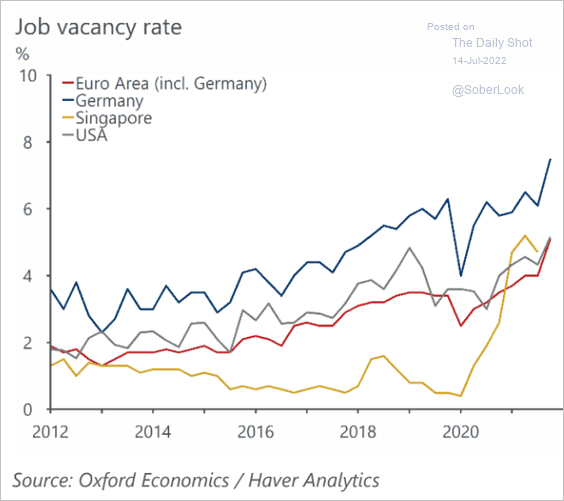 Source: Oxford Economics
3. Private credit impulse in advanced economies has turned negative this year.
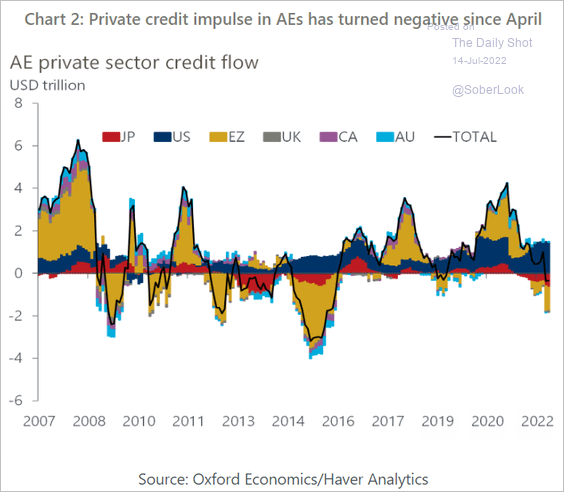 Source: Oxford Economics
——————–
Food for Thought
1. Semiconductor spending:
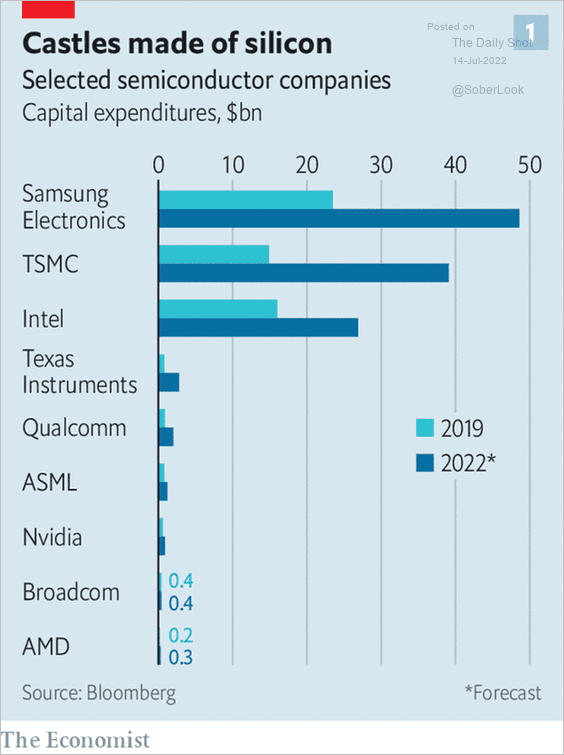 Source: @jessefelder, The Economist Read full article
2. Investing in robotics:
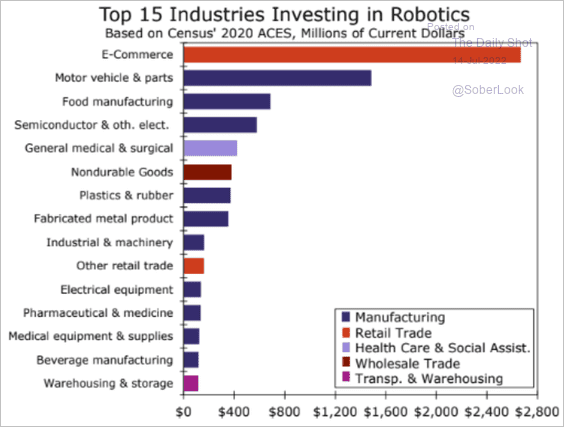 Source: Wells Fargo Securities
3. Tech lobbying:
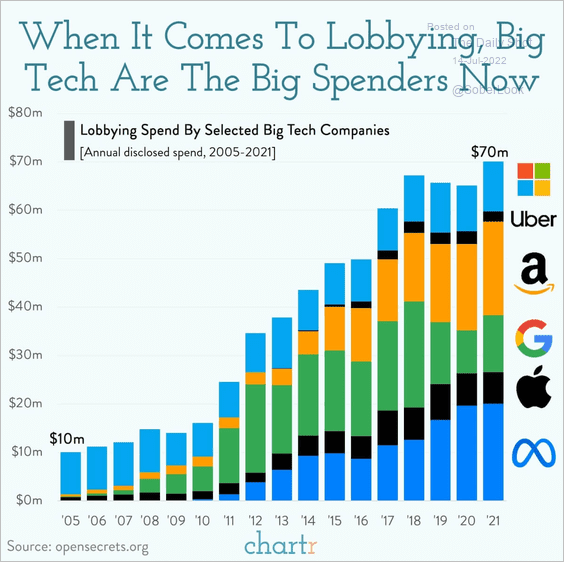 Source: @chartrdaily
4. Presidential approval vs. consumer sentiment:
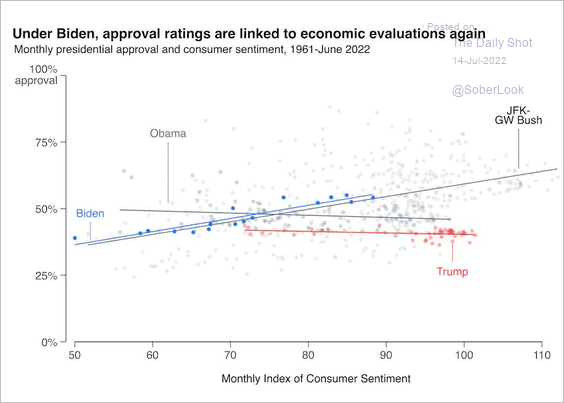 Source: @rp_griffin, @monkeycageblog, @johnmsides Read full article
5. Climate footprint of selected foods:
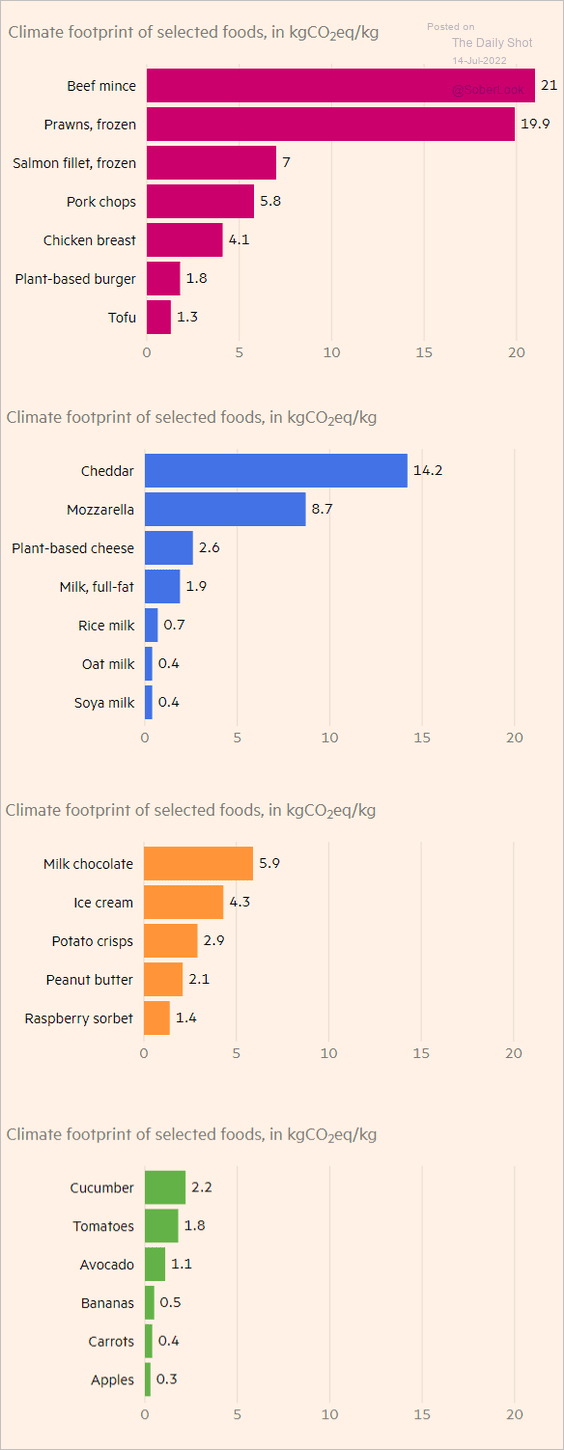 Source: @financialtimes Read full article
6. Russian fossil fuel revenues:
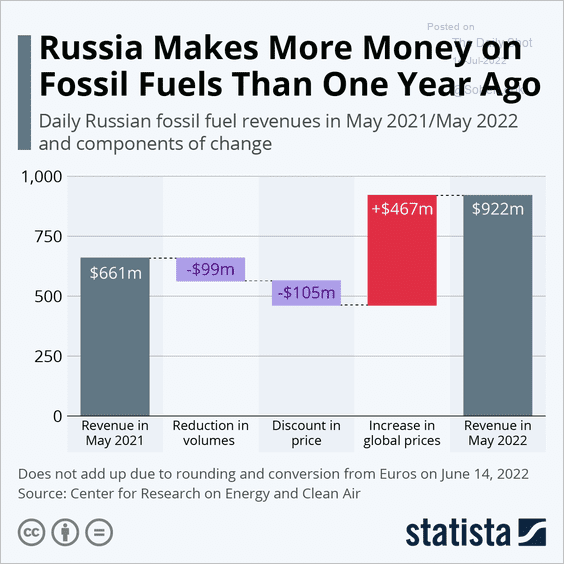 Source: Statista
7. Word count and age of national constitutions:
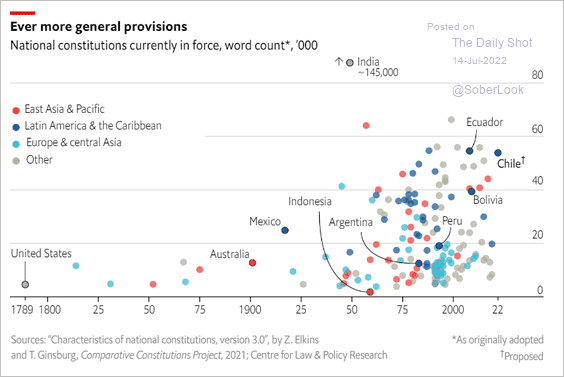 Source: The Economist Read full article
——————–
Back to Index