The Daily Shot: 13-Jul-22
• Administrative Update
• The United States
• The United Kingdom
• The Eurozone
• Europe
• Asia – Pacific
• China
• Emerging Markets
• Cryptocurrency
• Commodities
• Energy
• Equities
• Credit
• Rates
• Global Developments
• Food for Thought
Administrative Update
To cancel your recurring subscription to The Daily Shot, please log into your account and click “cancel.” More information is available here.
Back to Index
The United States
1. The NFIB small business sentiment continues to deteriorate, with the June figures well below forecasts.

It’s worth noting that the Chamber of Commerce Small Business Index paints a very different picture.
 Source: Small Business Index Read full article
Why such a difference? The NFIB tends to represent very small businesses, and its survey results sometimes converge with consumer sentiment indicators.
 Source: NFIB
The NFIB index also tends to be correlated to the stock market, which points to further deterioration in sentiment.
 Source: Pantheon Macroeconomics
Here are some trends from the NFIB report.
• Outlook:

• Sales expectations:

• CapEx expectations:

• Jobs hard to fill:

• Compensation plans:

• Price plans:

• Inflation is the most important problem:

• Poor sales are the most important problem:

——————–
2. All eyes are on the CPI report this morning. Here are some updates on inflation.
• The core CPI has overshot the NFIB selling prices index because larger firms have been expanding their margins. That trend will be reversing as demand slows.
 Source: Pantheon Macroeconomics
• Shelter-related costs are expected to continue driving the core CPI.
 Source: Nomura Securities
• Here is a projection from Nomura.
 Source: Nomura Securities
• There will also be a one-time CPI pop from telecom services.
Nomura: – We also expect a temporary boost in June CPI from wireless telecom service prices. A major carrier announced an increase of $1.35 in monthly administrative charges, effective June. Considering its market share, we expect CPI’s wireless telecom service prices to increase 1.0% m-o-m.
 Source: Nomura Securities
• Rent CPI should begin to slow.
 Source: Redfin
• High-frequency indicators from YipitData suggest that vehicle CPI is moderating.
 Source: YipitData
• Inflation is increasingly demand-driven, according to Deutsche Bank. Since demand can be subdued with a tighter monetary policy, this trend should encourage the Fed to keep raising rates.
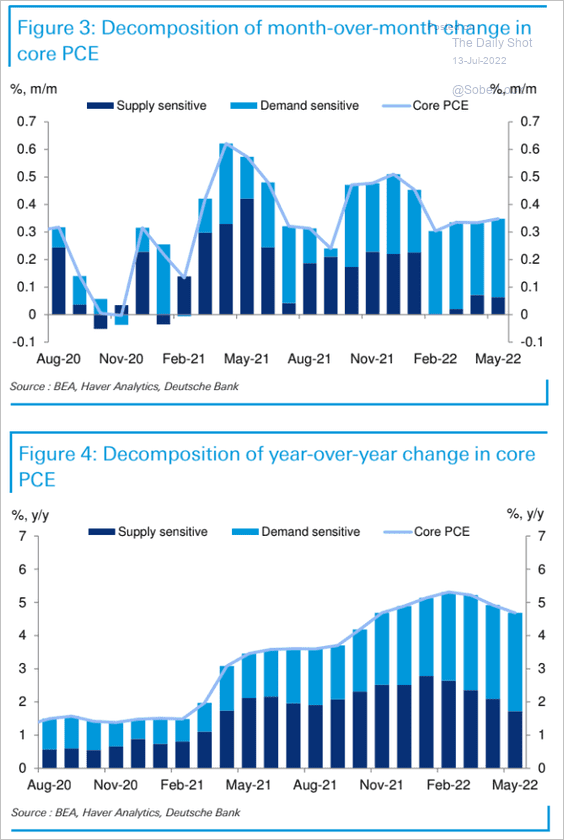 Source: Deutsche Bank Research
• A demand/supply proxy (based on retail sales and industrial production) points to sharp declines in core inflation ahead.
 Source: Industrial Alliance Investment Management Inc.
• The Phillips Curve has been steep lately.
 Source: Oxford Economics
• Here is some good news for the Fed. Longer-term consumer inflation expectations are not rising.
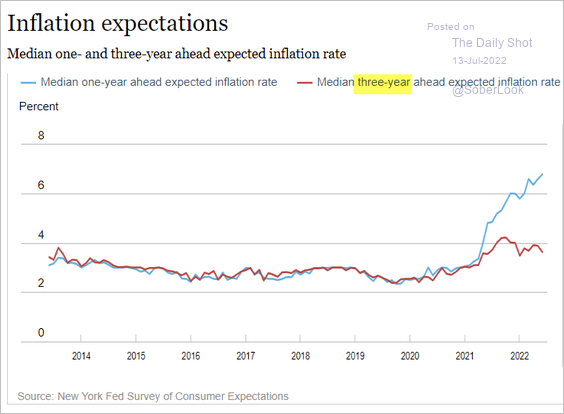 Source: NY Fed
——————–
3. Supply chain pressures are gradually easing.
 Source: BCA Research
• The Oxford Economics supply chain pressures index:
 Source: Oxford Economics
• Container shipping costs:

• Vessel backlog at US West Coast ports:
 Source: Oxford Economics
——————–
4. The 10-year/1-year portion of the Treasury curve is now heavily inverted as recession concerns rise.

Back to Index
The United Kingdom
1. The May GDP report surprised to the upside. More on this tomorrow.

2. Business investment has been slowing
 Source: Pantheon Macroeconomics
3. Workers have been getting less training.
 Source: Resolution Foundation Read full article
4. Real wages continue to deteriorate.
 Source: Chart and data provided by Macrobond
5. Next, we have some data on Boris Johnson’s replacement.
• Betting market probabilities:
 Source: The Telegraph Read full article
• Endorsements from MPs:
 Source: The Economist Read full article
Back to Index
The Eurozone
1. Germany’s ZEW expectations index hit the lowest level since the Eurozone debt crisis.

It’s not looking good for the Eurozone economy in the months to come.
 Source: Pantheon Macroeconomics
2. Bund yields are rolling over as the market prices in a recession ahead (3 charts).

 Source: BofA Global Research; III Capital Management
 Source: @WeberAlexander, @markets Read full article
——————–
3. EUR/USD liquidity has dropped since the start of the year, driven by a widening in spreads and a drop in market depth, according to Deutsche Bank. The decline in market participation could trigger greater price swings in the coming days.
 Source: Deutsche Bank Research
4. Weak demand from China has been a headwind for the euro.
 Source: BCA Research
5. How would Germany’s economy be impacted if the nation lost access to Russian energy?
 Source: JP Morgan Research; III Capital Management
6. Croatia joins the Eurozone.
 Source: Reuters Read full article
Back to Index
Europe
1. Danish inflation rate soars above 9%.

2. Severe rationing and demand destruction would set in without Russian gas imports.
 Source: Bruegel Read full article
How reliant are European countries on Russian gas?
 Source: Oxford Economics
——————–
3. Here is a picture of the European heat wave.
 Source: Copernicus Read full article
4. This chart shows the growth trajectory of internet sales across the EU.
 Source: Eurostat Read full article
Back to Index
Asia – Pacific
1. Japan’s yield curve is artificially steep in the long end as the BoJ tries to pin down the 10yr JGB.

Also, JGBs are now less sensitive to global bond volatility.
 Source: Piper Sandler
——————–
2. South Korea’s central bank hiked rates by 50 bps for the first time since it started using rates as its key policy tool.

3. New Zealand’s central bank also hiked rates by 50 bps (as expected).

New Zealand’s property bubble is deflating.

——————–
4. Australia’s job vacanices hit extreme levels.
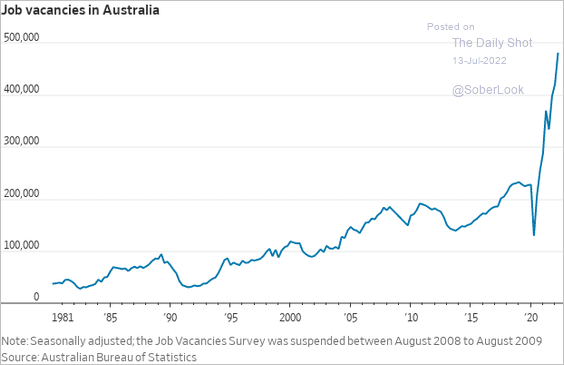 Source: @WSJ Read full article
Back to Index
China
1. Shanghai steel futures continue to tumble.

2. Policy support could moderately boost home sales in high-tier cities, according to Fitch.
 Source: Fitch Ratings
3. Road freight traffic remains weak because of COVID lockdowns.
 Source: JP Morgan Research
Back to Index
Emerging Markets
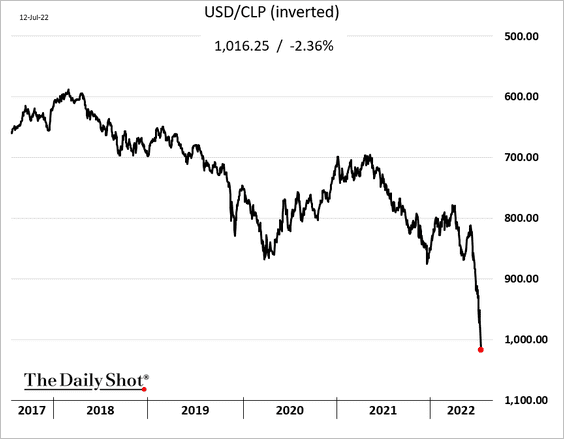
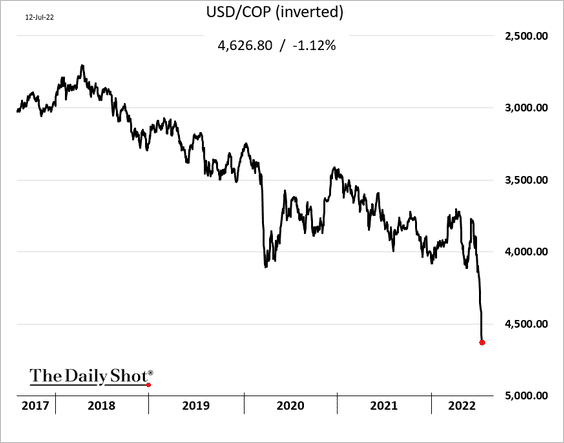
1. The Chilean peso is crashing with copper.
The Colombin peso is under pressure as well, hurt by the political situation and softer oil prices.
——————–
2. Mexican manufacturing output continues to climb.

By the way, Mexico is highly exposed to US recession risks.
 Source: Numera Analytics
——————–
3. Hungary’s central bank hiked rates by 200 bps again.

The yield curve is becoming more inverted.

——————–
4. Turkey’s USD bond yields continue to surge.

5. Ukraine’s bonds are collapsing as default looms.

 Source: Reuters Read full article
——————–
6. The number of distressed EM sovereigns is surging.
 Source: @acemaxx, @MorganStanley
7. South Africa’s manufacturing output remains well below pre-COVID levels.

8. India’s inflation report was a touch softer than expected.

Industrial production is holding up well.

——————–
9. Vietnam’s vehicle sales tumbled in June.

Back to Index
Cryptocurrency
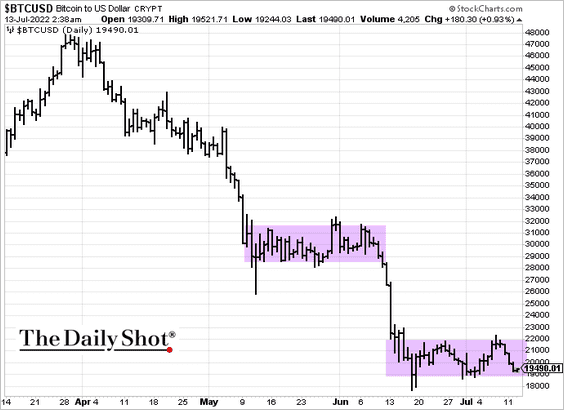
Bitcoin is trading in the lower end of the recent range. Haven’t we seen this movie a month ago?
Back to Index
Commodities
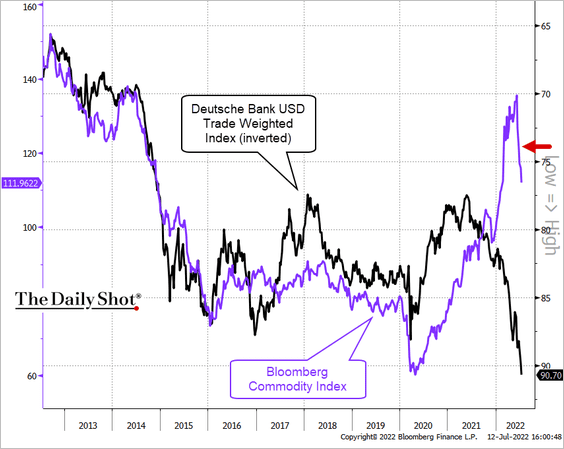
1. The dollar’s persistent strength is taking a toll on commodities.
 Source: @TheTerminal, Bloomberg Finance L.P.
2. Rising credit spreads tend to be a tailwind for gold.
 Source: Numera Analytics
3. What are the drivers of the recent decline in copper prices?
 Source: Numera Analytics
Back to Index
Energy
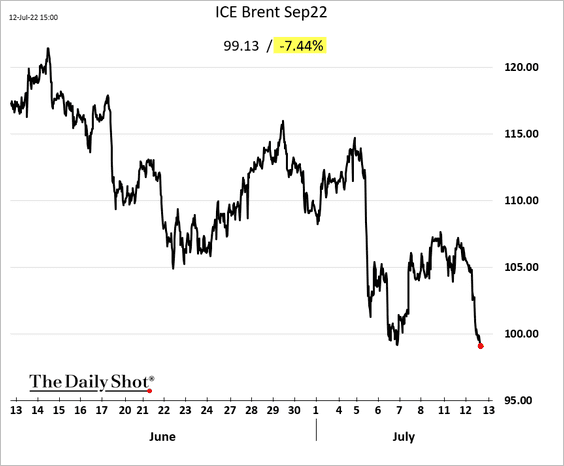
1. Oil took a hit on Tuesday …
 Source: Reuters Read full article
… amid recession concerns.

——————–
2. The 10-day Nord Stream 1 maintenance has started. The key question is whether Russian gas deliveries return to prior levels.
 Source: Deutsche Bank Research
If not, Germany will face severe gas rationing this winter.
 Source: Deutsche Bank Research
Europe could be facing an unprecedented energy crisis.
 Source: @rdomenechv, @TheEconomist Read full article
——————–
3. Who owns Russian oil cargo ships?
 Source: @RobinBrooksIIF, @JonathanPingle
4. Energy investment is set to pick up by 8% this year, mostly linked to higher prices, according to IEA.
 Source: IEA
• The pipeline of new coal, hydropower, and nuclear projects has weakened in recent years, but the number of gas-fired projects under development continues to grow.
 Source: IEA
• The rise of sustainable energy investment and financing has been concentrated in advanced economies.
 Source: IEA
• The surge in material prices has increased the cost of clean energy technologies (2 charts).
 Source: IEA
 Source: IEA
• Investment in battery storage is expected to rise significantly this year.
 Source: IEA
——————–
5. Air conditioners are cranking in Texas.
 Source: @JKempEnergy
Back to Index
Equities
1. We’ve had 33 consecutive weeks of more stocks hitting new lows than new highs.
 Source: @allstarcharts
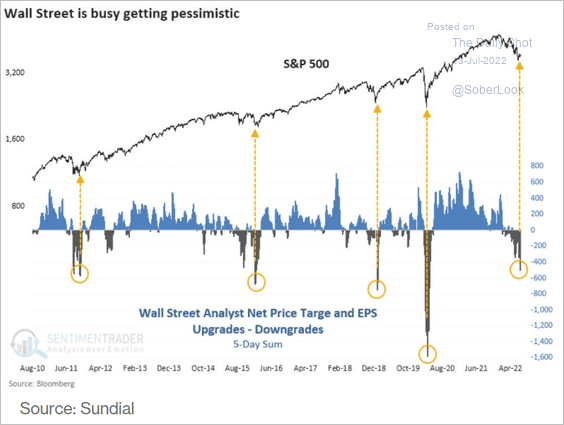
2. Earnings downgrades are picking up speed.
 Source: @jessefelder, Bloomberg, SentimenTrader Read full article
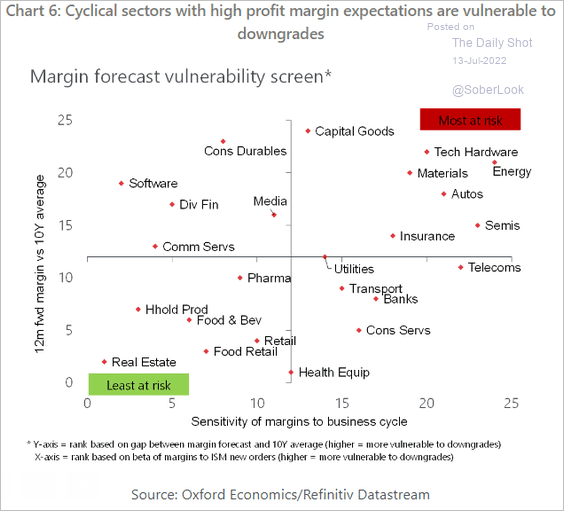
3. Forecasts for profit margins look too optimistic.
 Source: Yardeni Research
Which sectors face the highest risk to profit margins?
 Source: Oxford Economics
——————–
4. This chart shows the attribution of growth in earnings per share.
 Source: J.P. Morgan Asset Management
5. Valuations on non-US shares look attractive.

6. Is your mutual fund underperforming? Shares favored by mutual funds have been lagging the S&P 500 lately.

7. Financials are testing long-term support.
 h/t @mikamsika
8. Demand for out-of-the-money equity put options remains depressed (see comment below).
 Source: The Convexity Maven
Implied volatility is low relative to stock prices.

Back to Index
Credit
1. High-yield bond volatility keeps climbing.

2. Rising high-yield spreads point to increased defaults ahead.
 Source: Citi Private Bank
A correction in North American credit markets is underway, which could trigger a build-up in nonperforming loans and defaults toward early next year, according to S&P.
 Source: S&P Global Ratings
——————–
3. Large bankruptcies increased last month.
 Source: Bloomberg Law Read full article
4. Investment-grade bonds are on track for the worst year on record.
 Source: Deutsche Bank Research
5. European high-yield bond spreads have blown out.
 Source: @RichardDias_CFA
Back to Index
Rates
1. The spread between rates and equity implied volatility is near the highest levels since the financial crisis.


——————–
2. High-frequency indicators point to lower Treasury yields ahead.
• Cyclical vs. defensive stocks:
 Source: @MrBlonde_macro
• Copper-to-gold ratio:
 Source: @TheTerminal, Bloomberg Finance L.P.
• Industrial metals:
 Source: @MrBlonde_macro
——————–
3. Capital Economics still expects the fed funds rate to peak around 4%.
 Source: Capital Economics
Back to Index
Global Developments
1. FX implied volatility continues to climb.

2. Covid-induced supply chain disruptions paired with elevated construction demand in 2021 drove a jump in construction costs across the globe, particularly for single-family homes.
 Source: Oxford Economics
3. Easing supply stress points to slower producer price gains ahead.
 Source: Numera Analytics
4. Global business investment is about to take a hit, …
 Source: Oxford Economics
… dragging down economic growth.
 Source: Oxford Economics
——————–
5. There has been a steady decline in productivity growth over the last 50 years.
 Source: Danske Bank
6. Risk appetite among investors has diminished, reflected by the decline in stock prices and rising corporate bond spreads.
 Source: Capital Economics
7. This chart shows the total debt as a percent of GDP split into government, corporations, and households.
 Source: Incrementum
——————–
Food for Thought
1. Share of young people living with their parents in OECD countries:
 Source: OECD Read full article
2. Movement of people from mainland China to Hong Kong:
 Source: The Economist Read full article
3. Abortions in the US:
 Source: Statista
4. US student debt distribution:
 Source: USAFacts
5. Newspaper publishers:
 Source: @chartrdaily
6. US traffic fatalities:
 Source: @axios Read full article
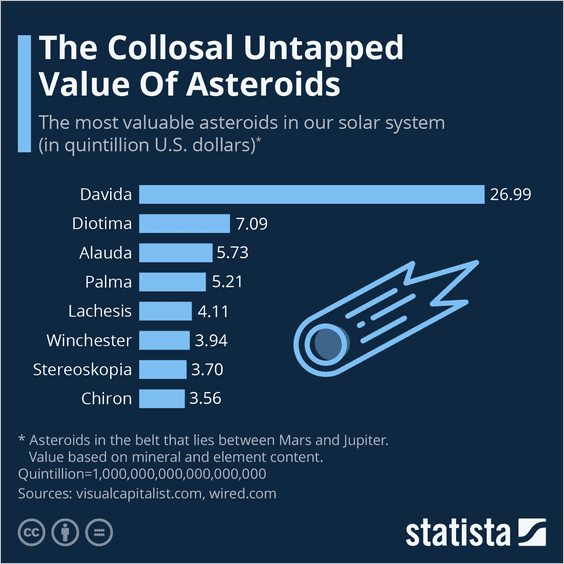
7. Most valuable asteroids:
 Source: Statista
——————–
Back to Index
