
The Daily Shot: 15-Jul-22
• The United States
• Canada
• The United Kingdom
• The Eurozone
• Europe
• Japan
• Asia – Pacific
• China
• Emerging Markets
• Cryptocurrency
• Commodities
• Energy
• Equities
• Rates
• Food for Thought
The United States
1. Let’s begin with some updates on inflation.
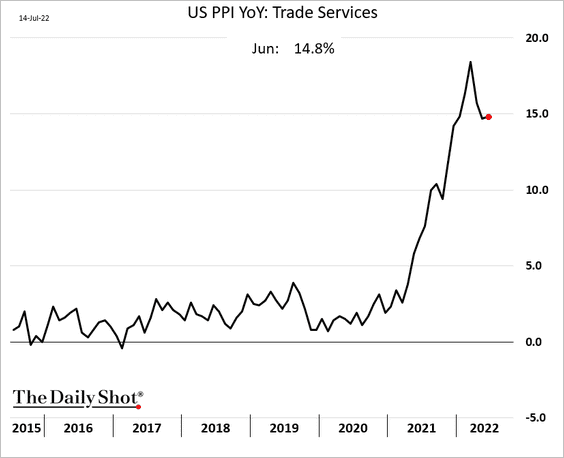
• The headline PPI index surprised to the upside, showing persistent upstream inflationary pressures.
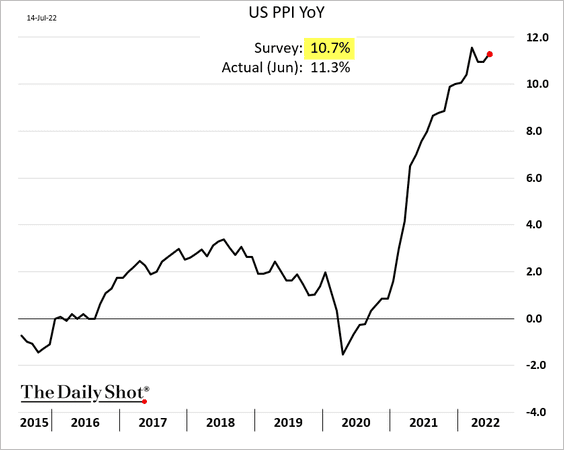
However, the underlying index, the core PPI ex. trade services (business markups), shows signs of moderating.

 Source: Reuters Read full article
• As we saw yesterday, the consumer inflation surge has been ugly across all key metrics. Below is the Atlanta Fed’s Sticky CPI (3-month changes).

• Here is the price index deviation from the Fed’s 2% target.
 Source: Mizuho Securities USA
• Energy inflation has been painful for US households (2 charts).

 Source: @WSJ Read full article
• Next, we have a select set of CPI components shown on a month-over-month basis. These sectors’ price gains in June were particularly severe as inflation broadly permeates the economy.
– Food away from home:

– Flour and flour mixes:

– Vehicle maintenance (by the way, this is putting pressure on insurers’ margins):

– Dental services:

– Nursing homes:

• Will airline fares moderate in the months ahead?
 Source: Pantheon Macroeconomics
What about food inflation?
 Source: Wells Fargo Securities
• Here is the NY Fed’s UIG inflation indicator.
 Source: NY Fed Read full article
• Has the CPI peaked? This chart shows Deutsche Bank’s CPI forecast.
 Source: Deutsche Bank Research
• The markets are increasingly convinced that the Fed will win its inflation fight as the central bank becomes more hawkish.
 Source: @stlouisfed Read full article
——————–
2. Jobless claims climbed above 2019 levels last week. However, there tends to be some noise around the 4th of July holiday.

• Continuing claims remain low.

• Women are coming back into the labor force. Men are not.
 Source: Deutsche Bank Research
——————–
3. Mortgage applications dipped below 2015 levels, down about 18% from a year ago.
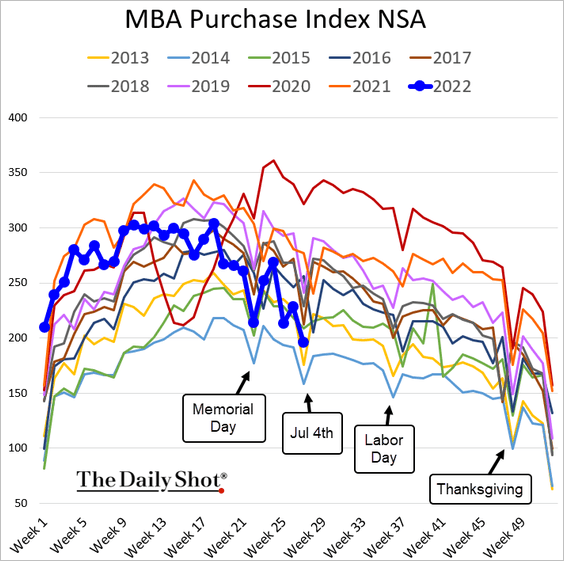
This chart shows the rate lock count.
 Source: AEI Center on Housing Markets and Finance
——————–
4. Now, let’s take a look at recession risks.
• Bloomberg’s nowcast GDP model indicates that the US is already in a recession (2 consecutive quarters of declines).
 Source: Bloomberg Read full article
And so does the Atlanta Fed’s GDPNow model.
 Source: Alpine Macro
What are the drivers of GDPNow?
 Source: BCA Research
• This chart shows Piper Sandler’s recession probability model.
 Source: Piper Sandler
• Sharp declines in equity valuations signal a recession.
 Source: Merrill Lynch
And so do tight financial conditions (2 charts).
 Source: Evercore ISI Research
 Source: Alpine Macro
• This table shows the relative amount of lead time between the deterioration in economic indicators and a recession.
 Source: Blackstone Read full article
• The market keeps pushing forward the timing of a recession.
 Source: Deutsche Bank Research
• Consumers are cutting spending in preparation for a potential recession.
 Source: MagnifyMoney
But households still have a strong cash buffer despite drawing down on savings.
 Source: Blackstone Read full article
Here is a look at real household net worth compared to previous recessions.
 Source: Blackstone Read full article
Back to Index
Canada
1. Manufacturing sales declined less than expected in May.

2. The BoC boosted its inflation forecasts and downgraded GDP estimates.
 Source: Scotiabank Economics
 Source: Scotiabank Economics
——————–
3. Canada’s external trade is heavily reliant on energy sales.
 Source: @RichardDias_CFA
Back to Index
The United Kingdom
1. Home price appreciation should be moderating.
 Source: Pantheon Macroeconomics
2. Heathrow is not ready to return to pre-pandemic volumes.
 Source: @WSJ Read full article
3. Union membership has been declining for decades.
 Source: Resolution Foundation Read full article
4. Here is the composition of UK government spending since 1700.
 Source: OBR Read full article
5. What’s happening on the political front?
• Votes for leadership candidates:
 Source: BBC Read full article
• Betting market probabilities and poll results:
 Source: BBC Read full article
Back to Index
The Eurozone
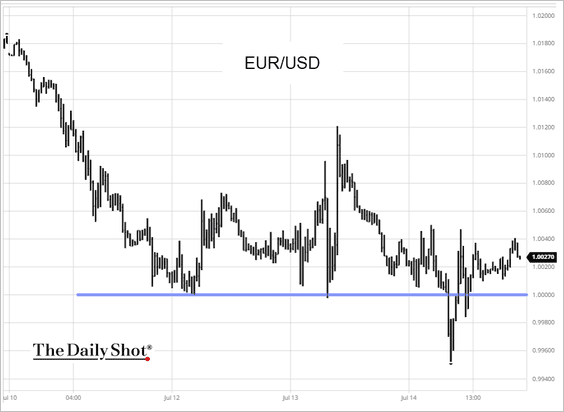
1. The euro briefly dipped below parity but rebounded.
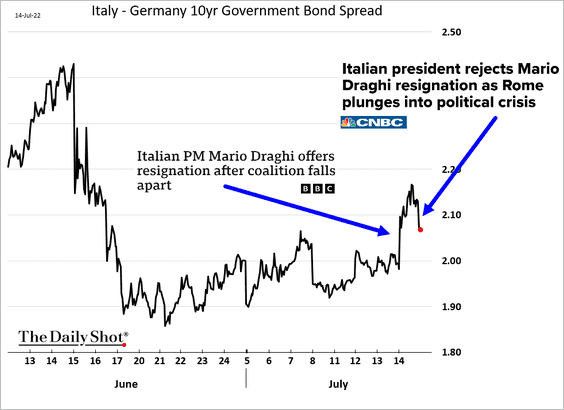
2. Italian politics is spooking debt markets again.
3. New car registrations remain soft.

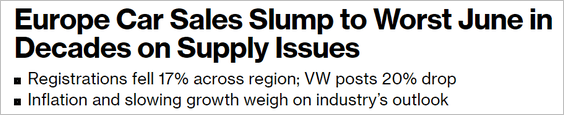 Source: @business Read full article
——————–
4. PMI data suggest that the rebound in industrial production will be short-lived.
 Source: Pantheon Macroeconomics
5. This chart shows corporate profit share (as opposed to labor share) in the Eurozone.
 Source: Eurostat Read full article
6. The rise in corporate loans is outpacing household loans in France.
 Source: Fitch Ratings
Corporate demand for loans has been weak except for France (2 charts).
 Source: Fitch Ratings
 Source: Fitch Ratings
Back to Index
Europe
1. Sweden’s CPI report was ugly.

Here are some forecasts from Nordea and Riksbank.
 Source: Nordea Markets
Sweden’s unemployment rate remains very low.

A 75 bps rate hike ahead?
 Source: Nordea Markets
——————–
2. Czech consumer inflation has gone vertical (now above 17%).

 Source: ING
——————–
3. Vessel waiting times are off the highs but remain elevated.
 Source: VesselsValue
4. Europe could be running on empty this winter (“gas” means natural gas).
![]() Source: @ANZ_Research
Source: @ANZ_Research
5. Wildfire seasons are starting earlier.
 Source: Statista
Back to Index
Japan
1. Machine tool orders have been a bit softer.

2. Service sector activity is rebounding.

3. Will the 10-year Japanese government bond yield track the rise in Treasury yields without being pinned down by the BoJ? (2 charts)
 Source: SOM Macro Strategies
 Source: SOM Macro Strategies
Back to Index
Asia – Pacific
1. The South Korean won continues to tumble vs. USD.

2. Singapore’s central bank tightened monetary policy by strengthening the currency.
 Source: ING
Back to Index
China
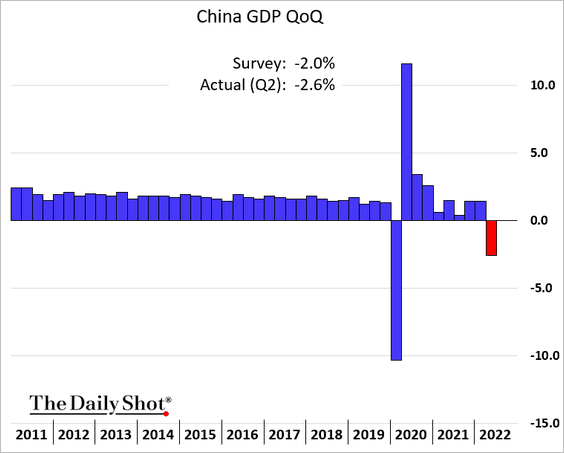
1. The economy contracted more than expected last quarter.
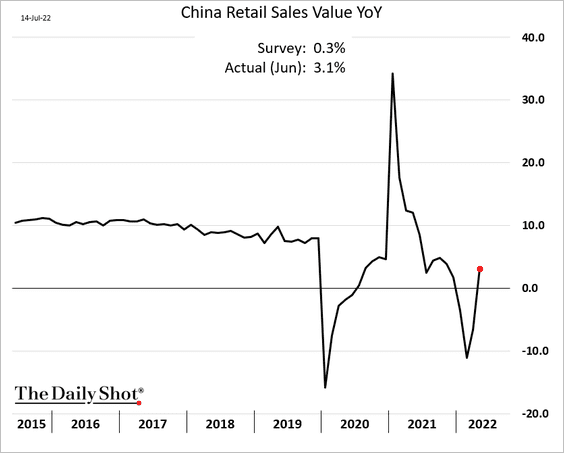
2. Industrial production bounced back in June.

The rebound in retail sales was larger than expected.
——————–
3. New home prices continue to drift lower.

4. New home completion delays are prompting homebuyers to refuse to pay mortgages.
 Source: @wealth Read full article
With bad debt potentially piling up, bank shares are under pressure.

——————–
5. Steel prices are crashing.

And metallurgical coal is following.

Back to Index
Emerging Markets
1. Chile’s central bank announced a foreign exchange intervention program to halt the peso’s decline, injecting $25 billion into the market.
 Source: Bloomberg Read full article
2. Argentina’s CPI hit 64%.

3. India’s trade deficit hit a record.

4. Turkey’s industrial production is holding up well.

5. Russia’s foreign reserves declined further, partially driven by weaker gold prices.


——————–
6. The Wisdomtree EM currency ETF is at support.
 Source: barchart.com
Back to Index
Cryptocurrency
1. Major cryptos declined over the past week, although ether (ETH) is starting to outperform.
 Source: FinViz
2. ETH is testing long-term support around its 2018 price peak, although upside appears to be limited.

For now, the ETH/BTC ratio is stabilizing.

——————–
3. The correlation between bitcoin and the Nasdaq 100 has been declining.

4. High transaction volumes lead to rising usage costs on the Ethereum network. This can open the door for new blockchains, although higher capacity for transactions could mean weaker security, according to BIS.
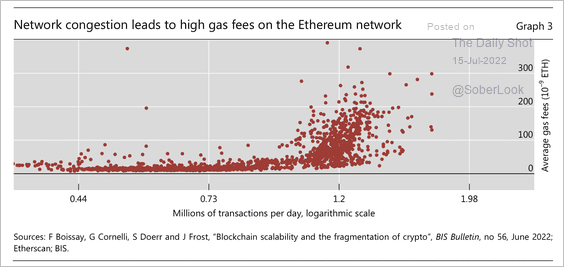 Source: BIS
5. The price of ETH depends on new user growth, which has collapsed.
 Source: BIS
6. Only 29% of altcoins have outperformed BTC over the past 90 days. Over the past month, however, BTC has underperformed the broader crypto market. That suggests a balanced appetite for risk among crypto traders.
 Source: BlockchainCenter
7. A majority of US consumers surveyed by Deutsche Bank view bitcoin as an alternative asset or store of value.
 Source: Deutsche Bank Research
Back to Index
Commodities
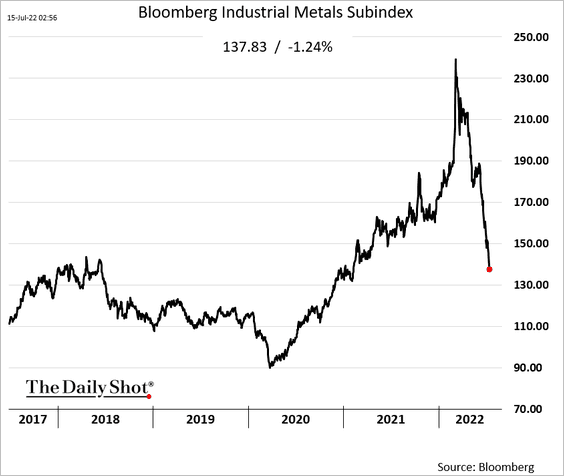
1. Industrial commodities continue to face headwinds.
• Iron ore:

• Copper:

• Aluminum:

• Bloomberg’s industrial metals index:
——————–
2. Next, we have some data on global lithium reserves and resources.
 Source: Fitch Solutions Macro Research
3. Coffee futures are rolling over on a strong US dollar and an improving harvest in Brazil.

Back to Index
Energy
1. Merger activity in the energy space is on pace to exceed last year’s deal value, driven by upstream projects (2 charts).
 Source: PitchBook Read full article
 Source: PitchBook
——————–
2. Energy firms have focused more on cash distributions than CapEx.
 Source: @EIAgov
Back to Index
Equities
1. According to the PPI report, corporate margin growth is off the highs but not crashing.
2. Will we see an outright decline in S&P 500 revenues?
 Source: Trahan Macro Research
• Leading indicators point to more companies ending up with negative earnings growth.
 Source: Trahan Macro Research
• According to Trahan Macro, when the ISM PMI new orders component dips below 50, S&P 500 earnings usually contract.
 Source: Trahan Macro Research
• Piper Sandler’s model shows significant earnings deterioration by the year’s end.
 Source: Piper Sandler
——————–
3. The US dollar strength is a headwind for corporate sales growth.
 Source: BofA Global Research; @SamRo

——————–
4. This chart shows US equity market capitalization relative to the broad money supply.
 Source: Gavekal Research
5. Retail investors are increasingly cautious, but we are not at the COVID-era lows yet.
 Source: TD Ameritrade
6. Bonds don’t provide a hedge for stocks in an inflationary environment.
 Source: BofA Global Research
7. Smart money is ignoring the pressure to sell.
 Source: @sentimentrader, @JasonGoepfert
8. The Nasdaq 100/S&P 500 ratio held the uptrend support.

9. Next, we have some sector performance updates.
• Consumer Staples:

• Utilities:

• Transportation/logistics (what does the FedEx share price tell us about the economy?)
![]()
• Communication Services:

• Tech and semiconductors:


Back to Index
Rates
1. The 2-year breakeven rate (inflation expectations) broke below its year-long uptrend.
 Source: Evercore ISI Research
2. This chart shows short-term bond yield volatility in select economies.
 Source: S&P Dow Jones Indices
——————–
Food for Thought
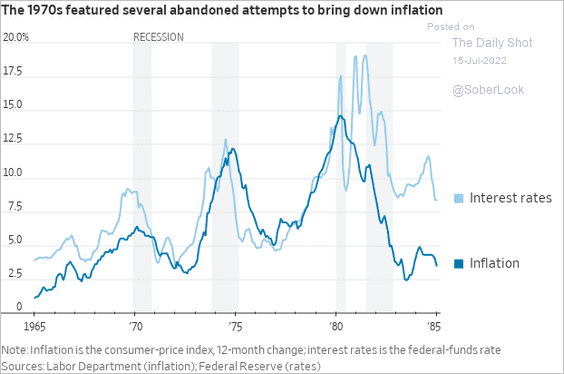
1. Attempts to bring down inflation in the 1970s:
 Source: @WSJ Read full article
2. Business spending in the COVID era:
 Source: Wells Fargo Securities
3. Coffee chain visits:
 Source: Placer.ai
4. Digital penetration in retail sales:
 Source: McKinsey & Company Read full article
5. Levi’s sales:
 Source: @chartrdaily
6. Heads of state assassinated since 2000:
 Source: Statista
7. Deforestation in Brazil’s Amazon:
 Source: Mongabay Read full article Further reading
8. US sentiment over time:
 Source: Harvard CAPS/The Harris Poll Read full article
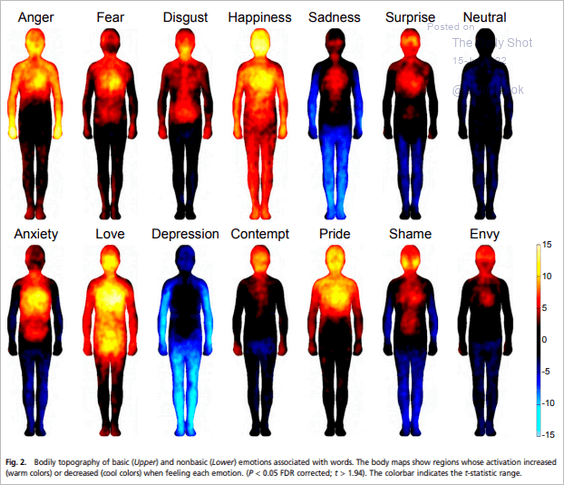
9. Body maps of human emotions – increased sensations (red/yellow) or decreased (blue):
 Source: Aalto University, h/t Charles Carter Read full article
——————–
Have a great weekend!
Back to Index