
The Daily Shot: 22-Jul-22
• The United States
• Canada
• The United Kingdom
• The Eurozone
• Japan
• Australia
• China
• Emerging Markets
• Cryptocurrency
• Commodities
• Energy
• Equities
• Alternatives
• Credit
• Rates
• Global Developments
• Food for Thought
The United States
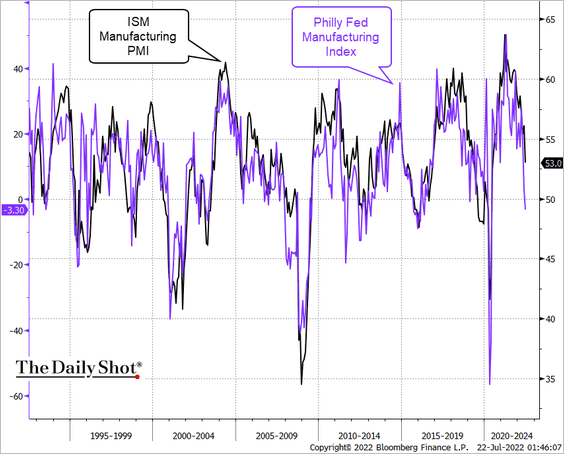
1. The Philly Fed’s regional factory activity index plummeted this month, …
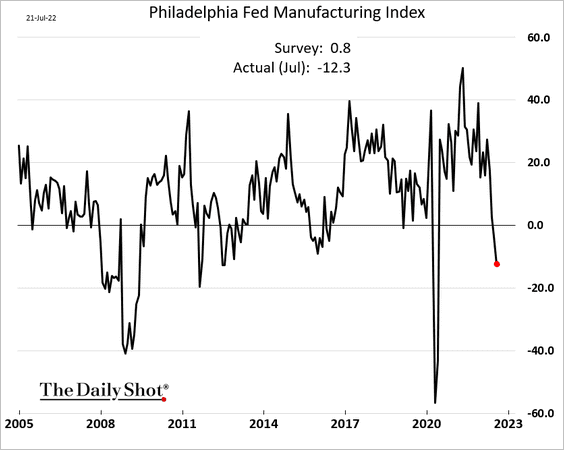
… as demand evaporated.
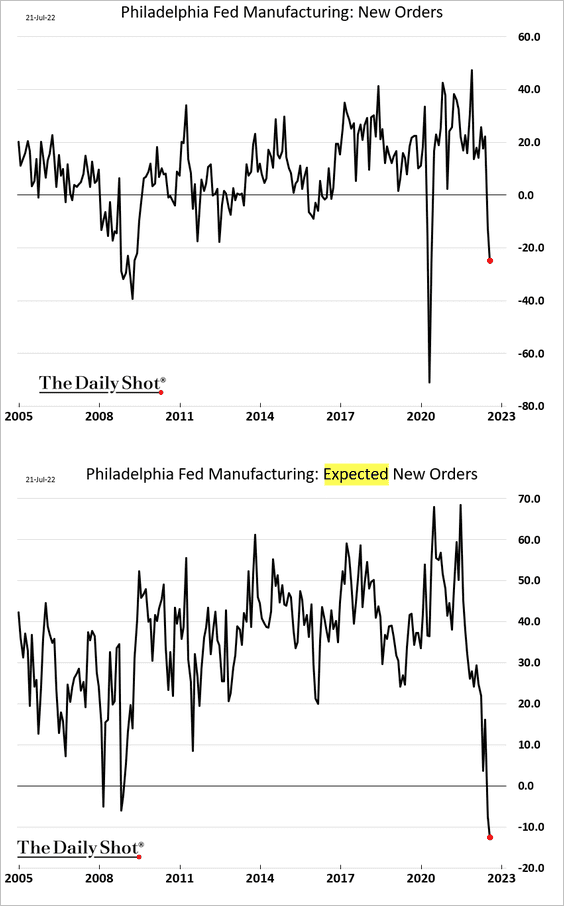
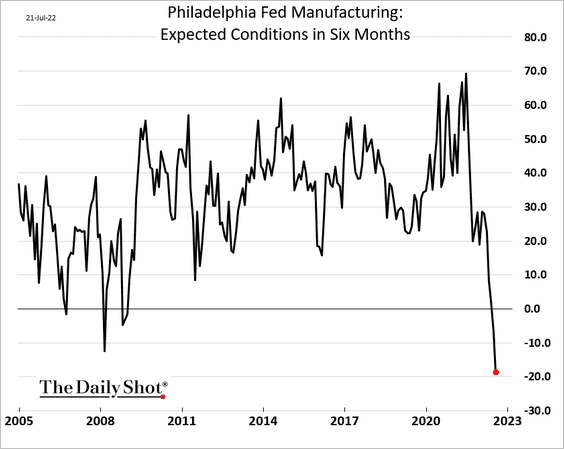
• The expectations index dipped well below the 2008 trough.
• CapEx expectations point to a sharp pullback in investment.
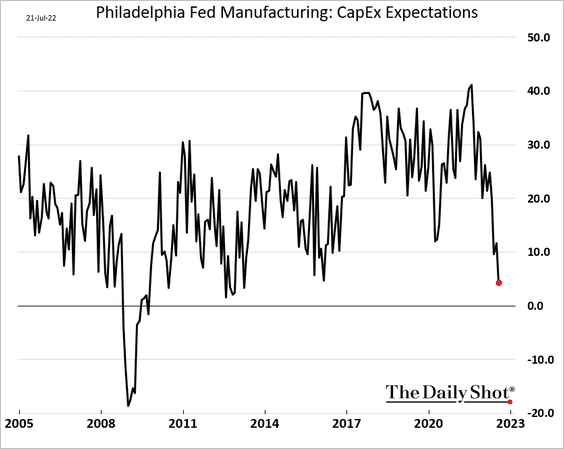
The combined Philly Fed and NY Fed manufacturing CapEx indices signal dwindling business investment at the national level.
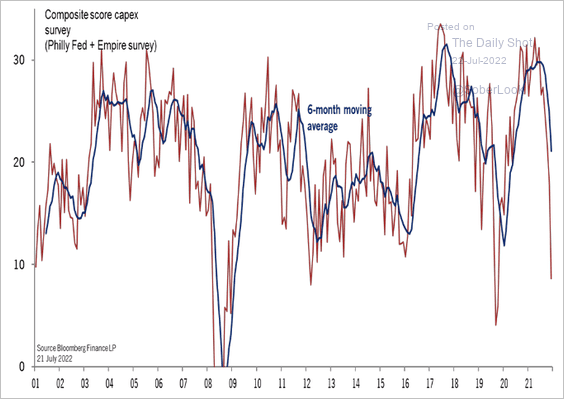 Source: @TCosterg
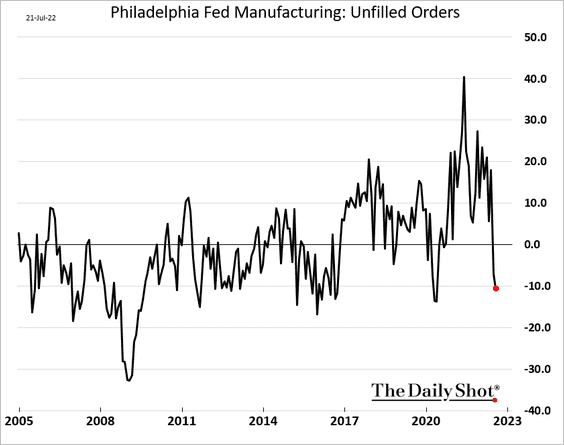
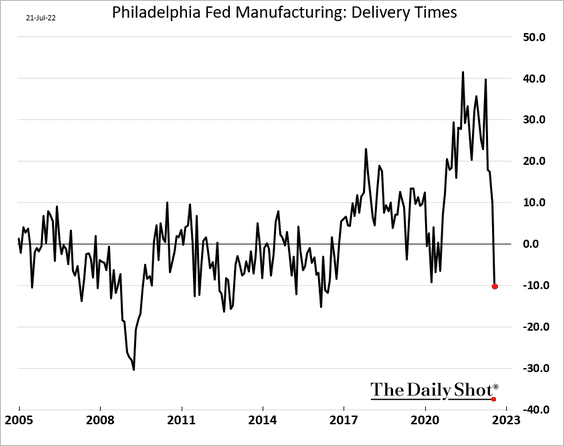
• Supply bottlenecks are gone as demand deteriorates (2 charts).
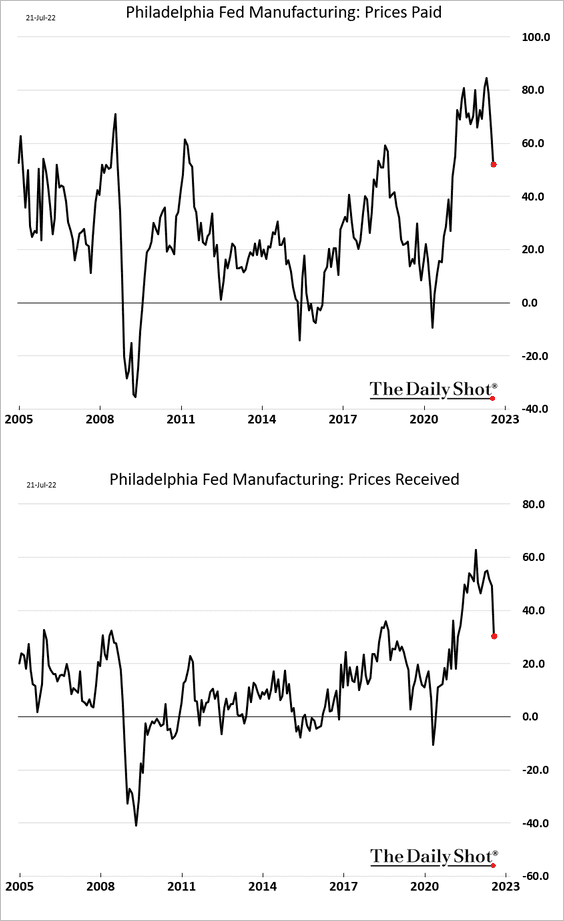
• Price pressures are easing.
• The manufacturing sector appears to be entering a recession.
——————–
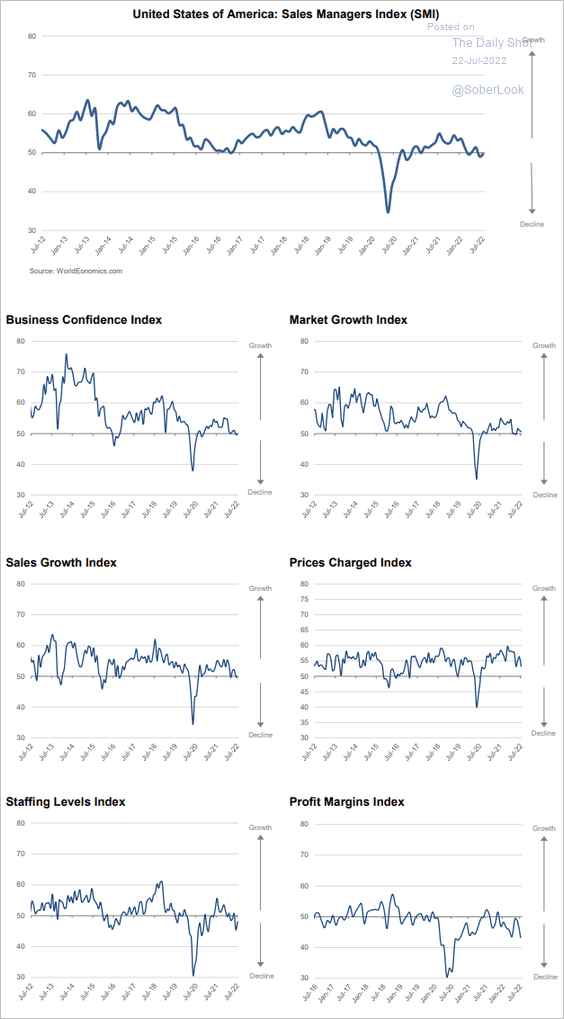
2. The World Economics SMI report shows US business activity treading water. Profit margins are shrinking.
 Source: World Economics
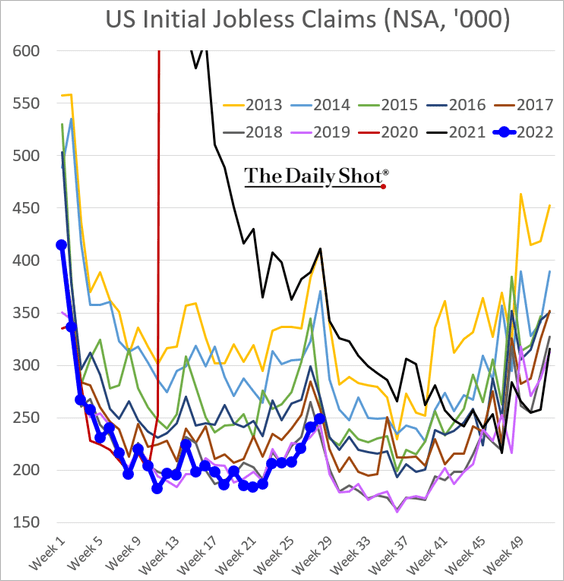
3. Initial jobless claims are now moving above the pre-COVID seasonal trend.
4. The index of leading economic indicators declined more than expected last month.
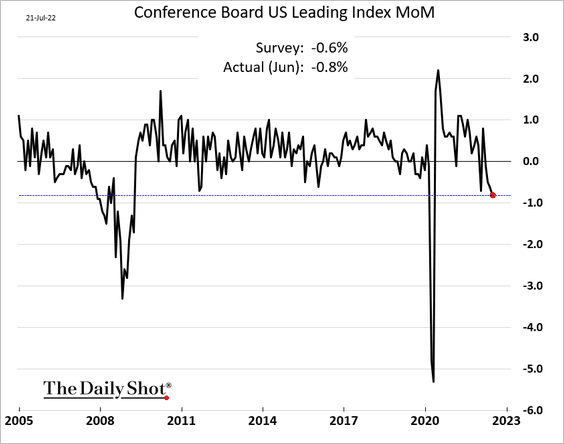
Here is the breakdown.
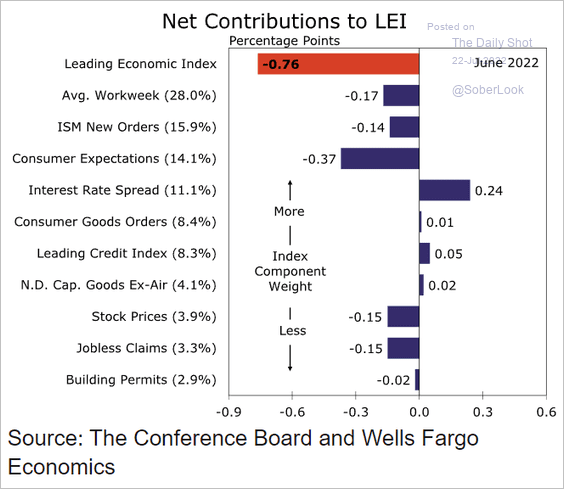 Source: Wells Fargo Securities
——————–
5. Soft economic data sent Treasury yields sharply lower.
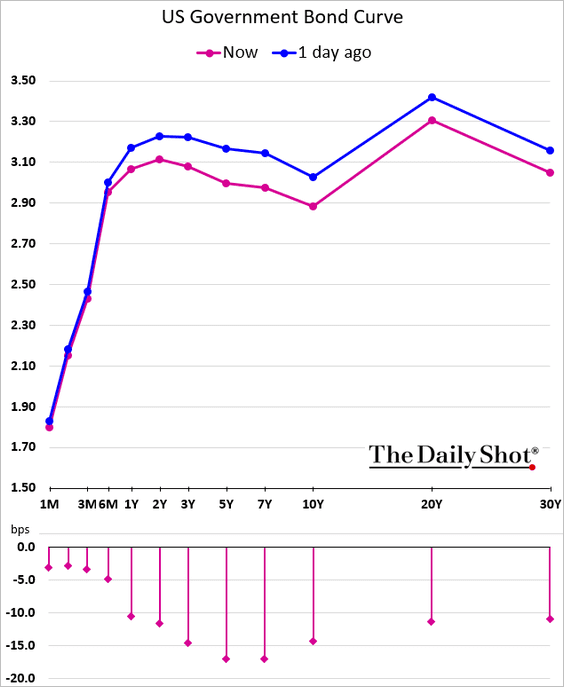
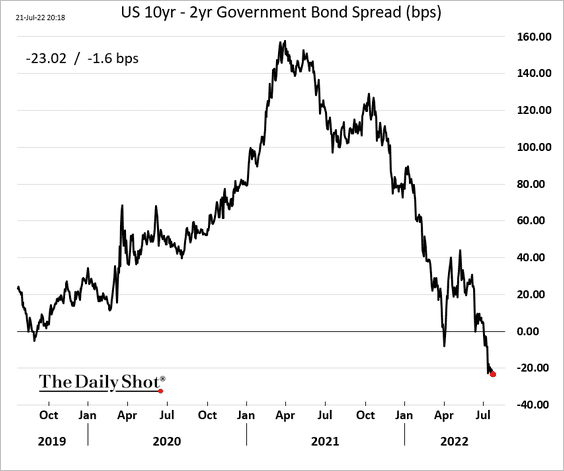
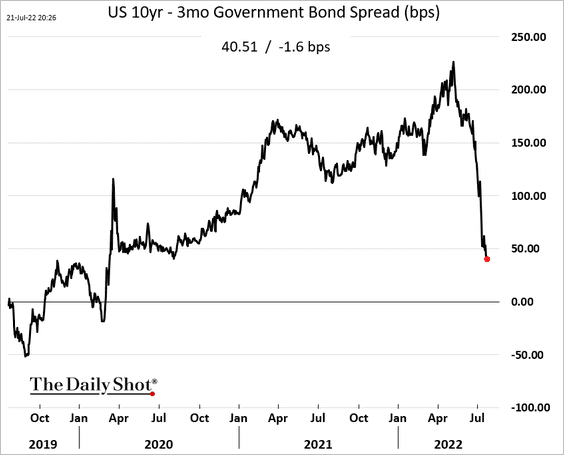
The yield curve inversion deepened.
——————–
6. The Evercore ISI trucking company survey is still elevated but continues to move down.
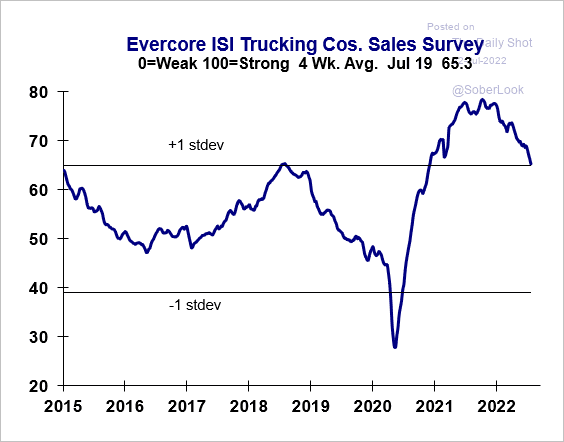 Source: Evercore ISI Research
7. COVID hospitalizations are on the rise again.
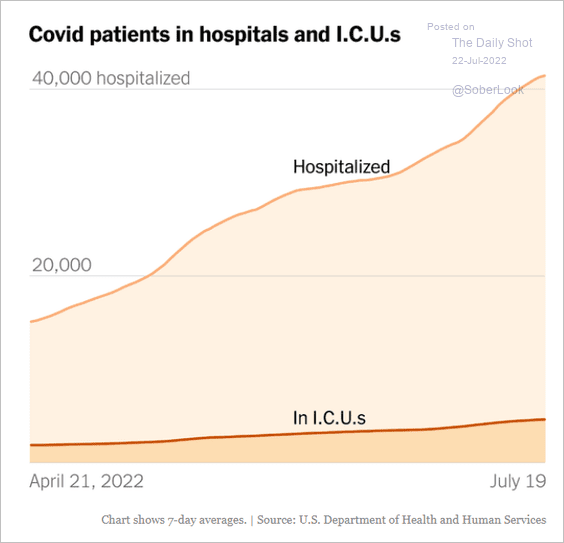 Source: The New York Times Read full article
Back to Index
Canada
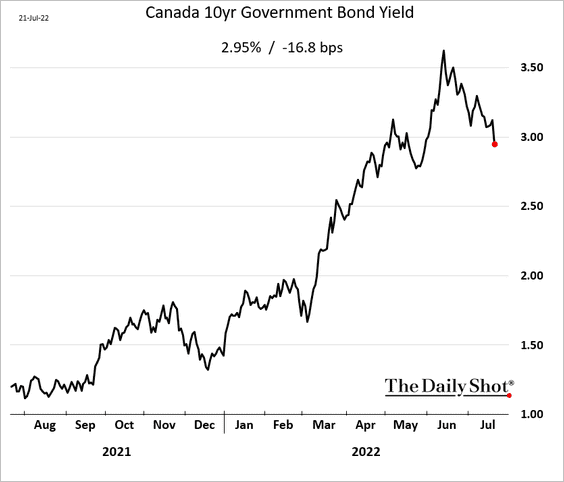
1. Bond yields declined sharply on Thursday.
2. Here is a measure of housing affordability from Capital Economics.
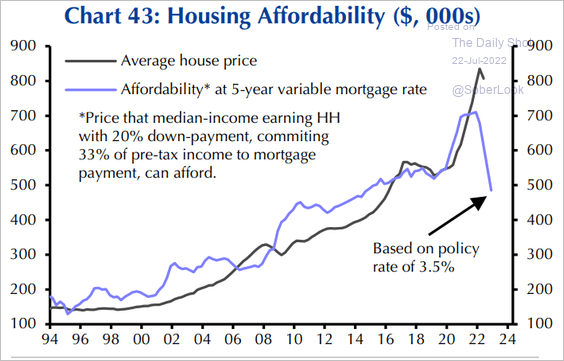 Source: Capital Economics
Back to Index
The United Kingdom
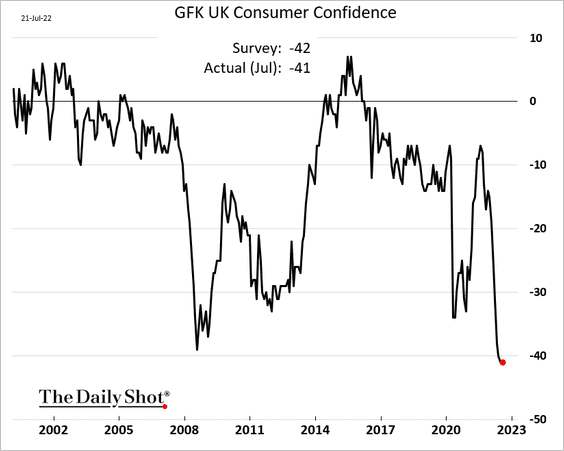
1. Consumer confidence held steady this month, matching June’s record low level.
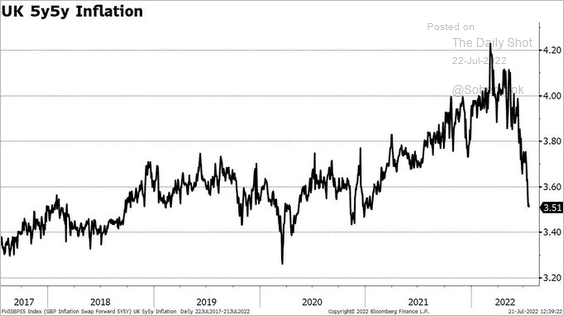
2. Long-term inflation expectations are easing.
 Source: @Garth_Friesen
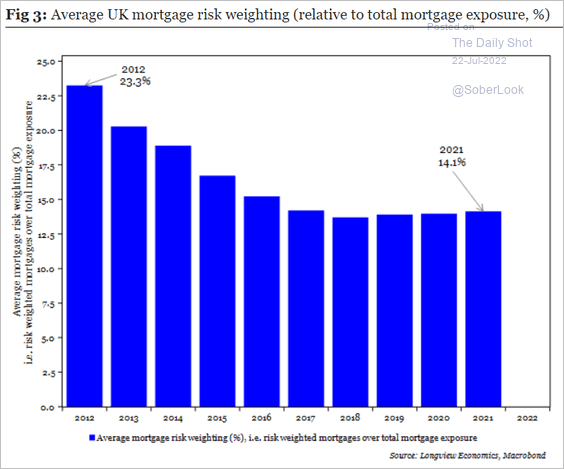
3. Banks’ exposure to mortgages is much lower than it was a decade ago.
 Source: Longview Economics
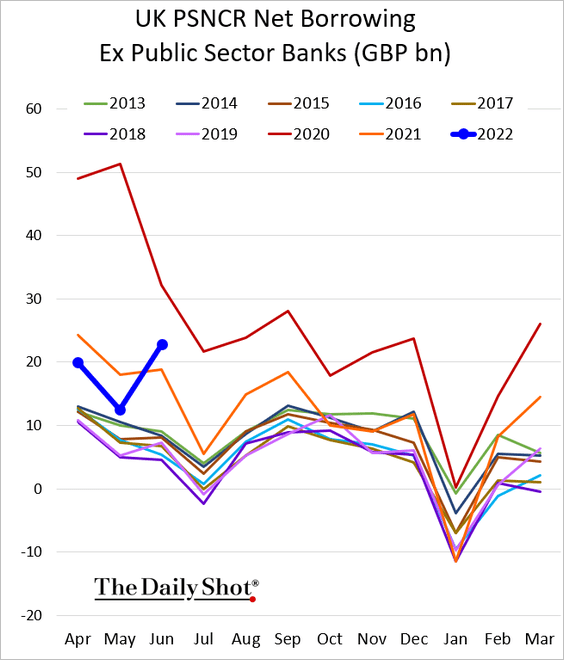
4. Government borrowing picked up last month.
Back to Index
The Eurozone
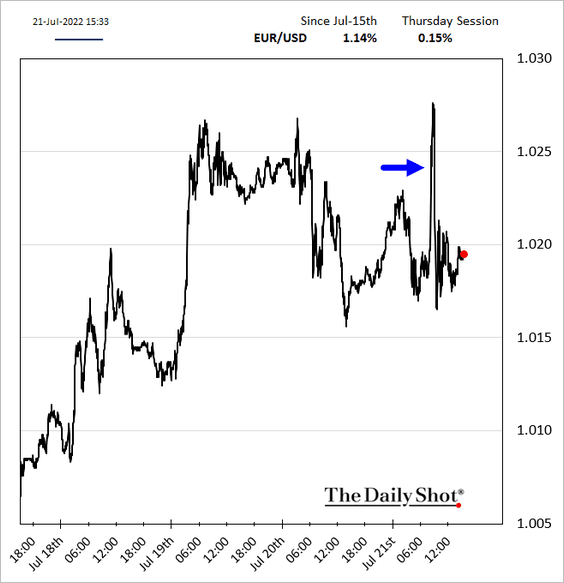
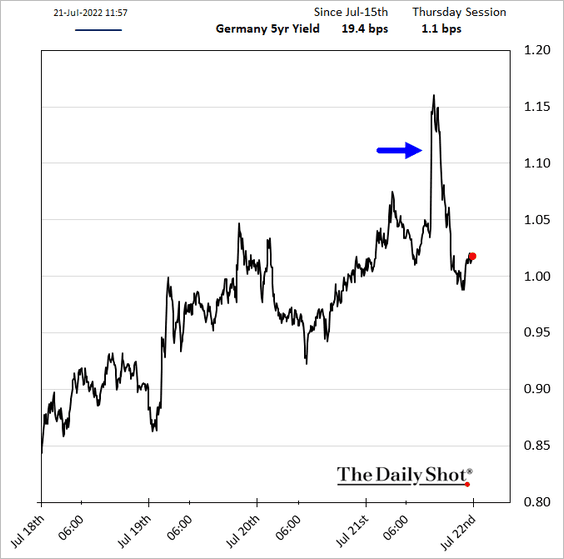
1. The ECB raised rates by 50 bps.
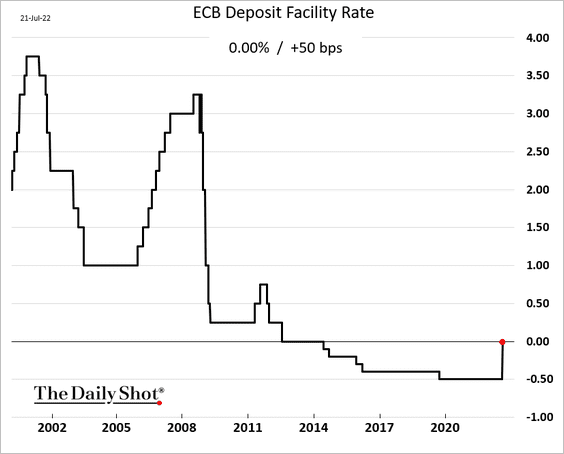
• The euro and bond yields jumped but retreated shortly after as the ECB provided no guidance on further action.
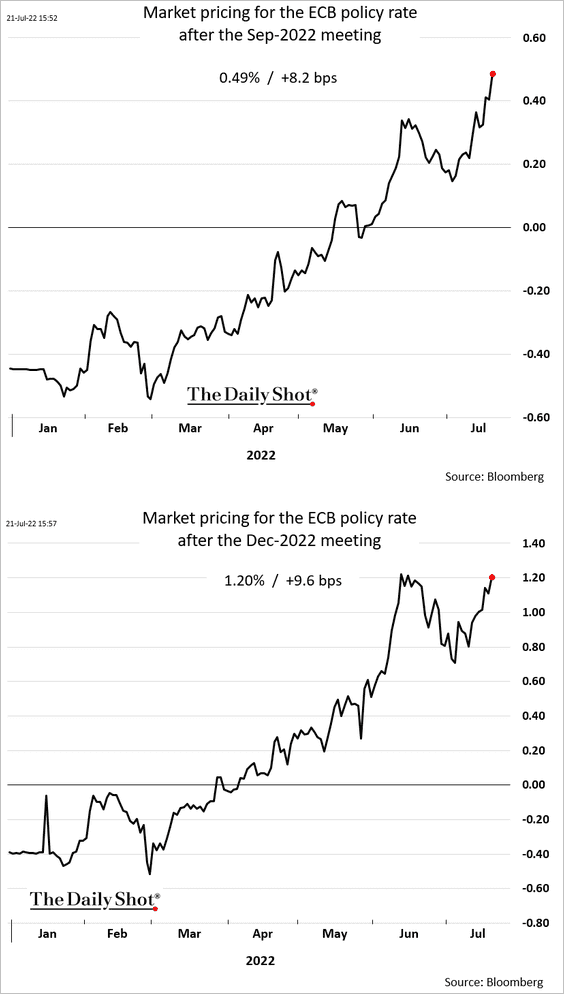
• Here are the ECB rate expectations after the September meeting (the market expects another 50 bps) and after the December meeting.
• How far will the ECB take its rate hikes? Not very far, according to forecasts.
– Markert expectations and Danske Bank’s forecast:
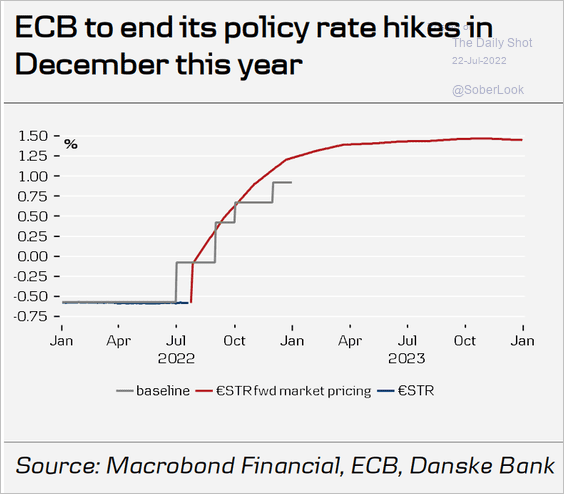 Source: Danske Bank
– Wells Fargo’s forecast:
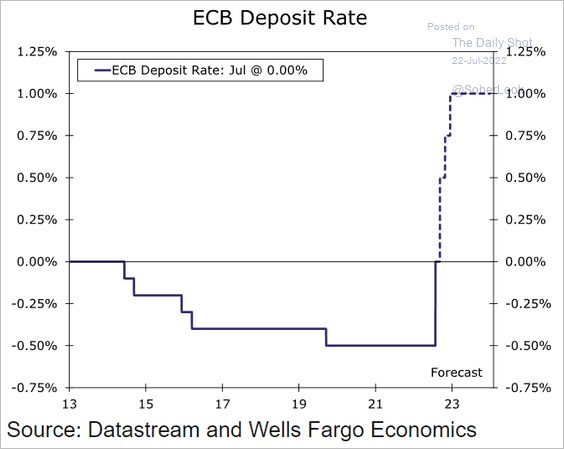 Source: Wells Fargo Securities
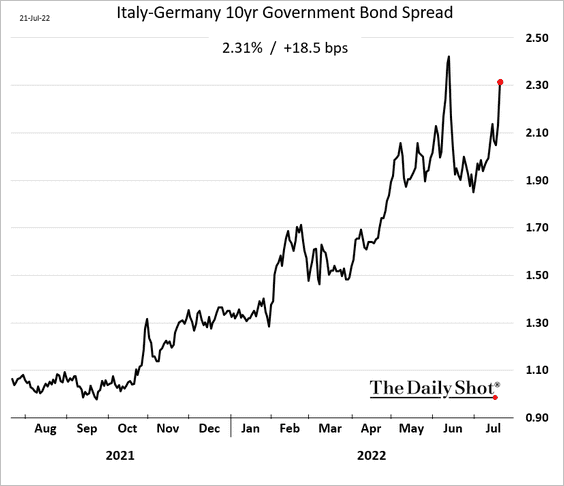
• The ECB introduced its anti-fragmentation tool, the Transmission Protection Instrument or TPI. The central bank is prepared to boost its balance sheet even as it hikes rates. While TPI is a powerful tool, it should be viewed as a deep out-of-the-money “ECB put” – used in more extreme downside scenarios.
Italian bond yields and spreads climbed further.
——————–
2. Germany appears to be in recession, with the July PMI report signaling a contraction in business activity. More on this on Monday.
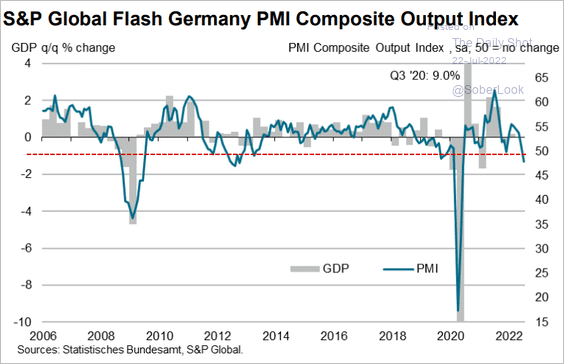 Source: S&P Global PMI
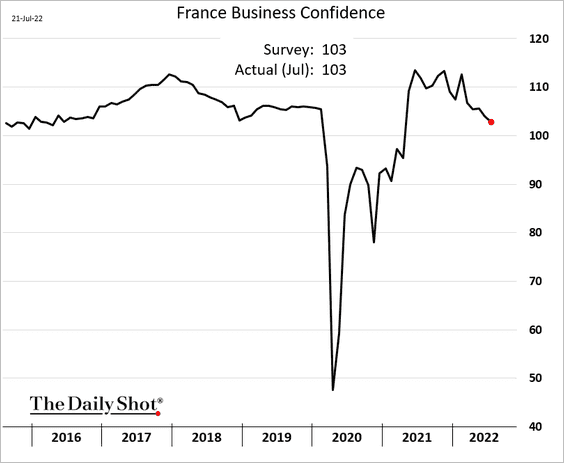
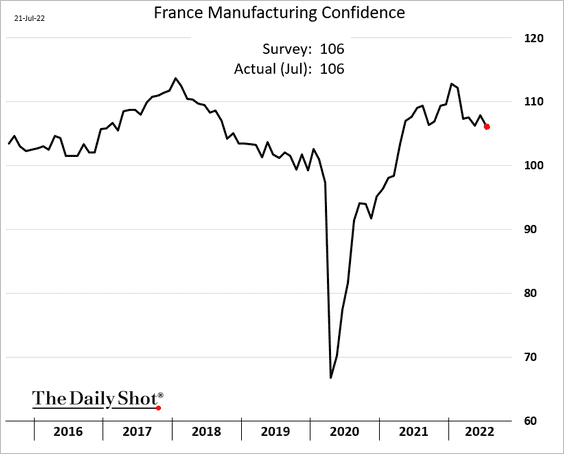
3. French business confidence has been holding up relatively well.
——————–
4. This scatterplot shows the Eurozone’s public finance metrics.
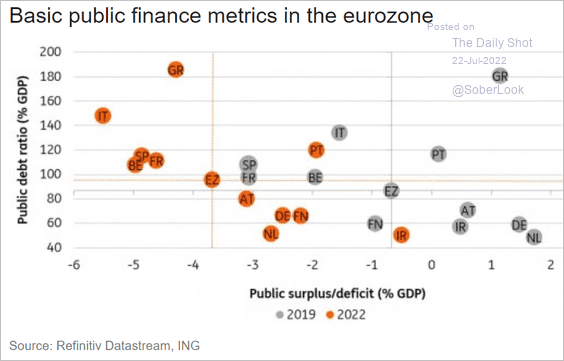 Source: ING
Back to Index
Japan
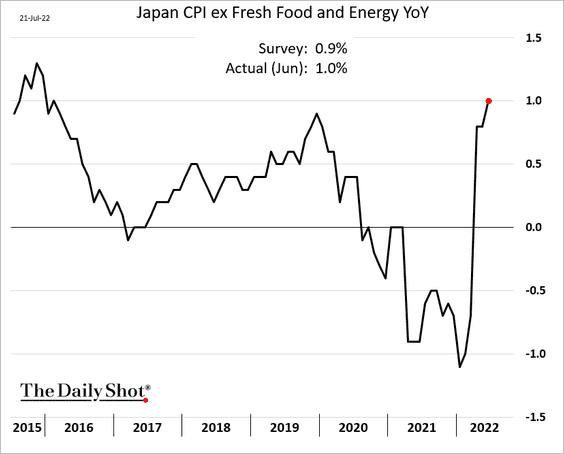
1. Japan’s core CPI hit 1% for the first time since 2016.
2. Manufacturing output slipped into contraction territory.
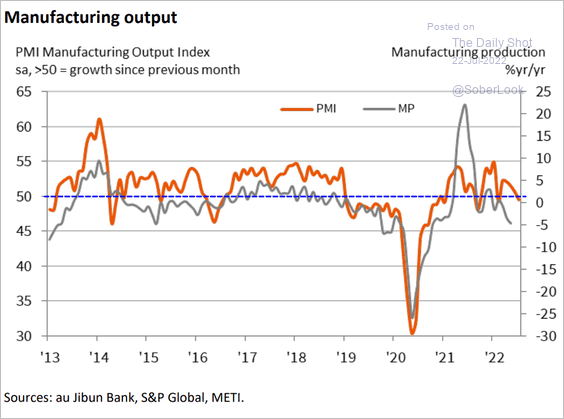 Source: S&P Global PMI
Growth in service activity has slowed.
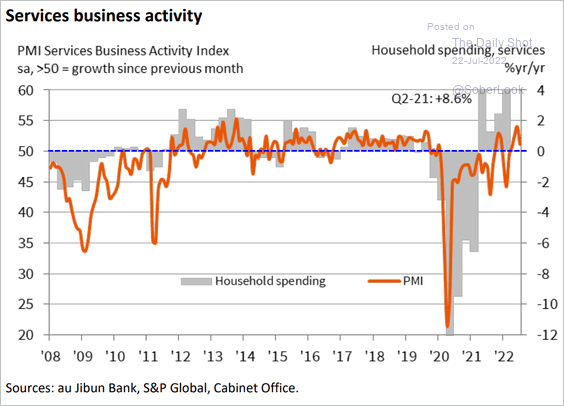 Source: S&P Global PMI
——————–
3. “And then there was one.”
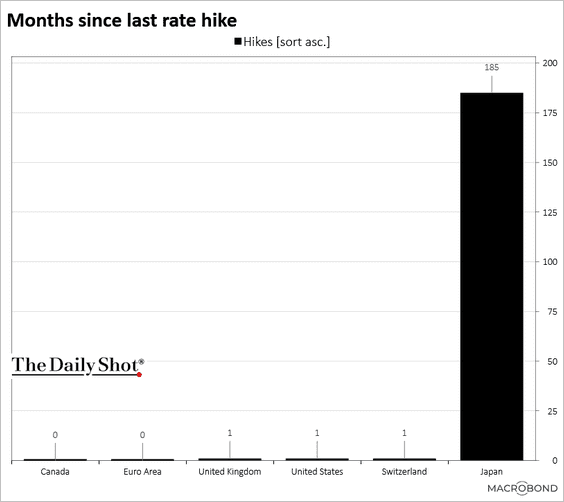 Source: Chart and data provided by Macrobond
Back to Index
Australia
1. Manufacturing is holding up, but service-sector growth has stalled.
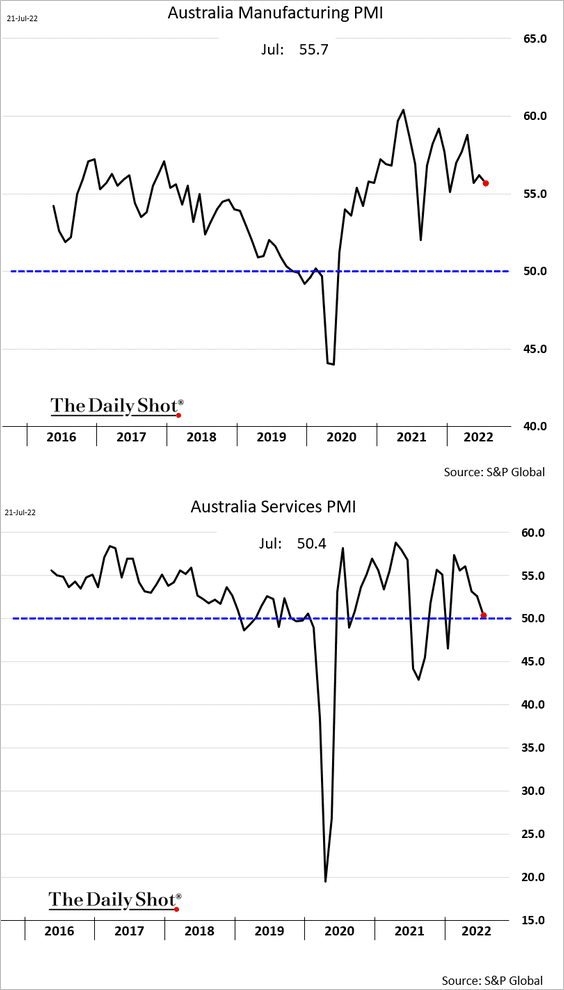
Here is the composite PMI output index.
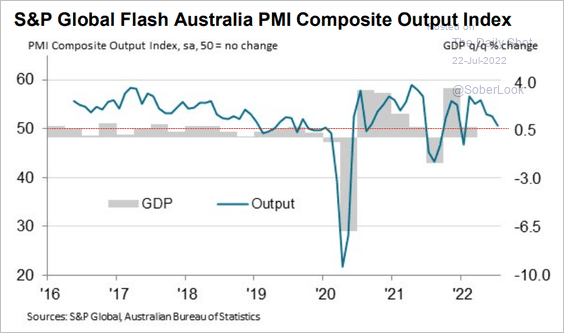 Source: S&P Global PMI
——————–
2. Despite high levels of debt, households have sizable holdings of assets, boosted by strong growth in house prices over the past year.
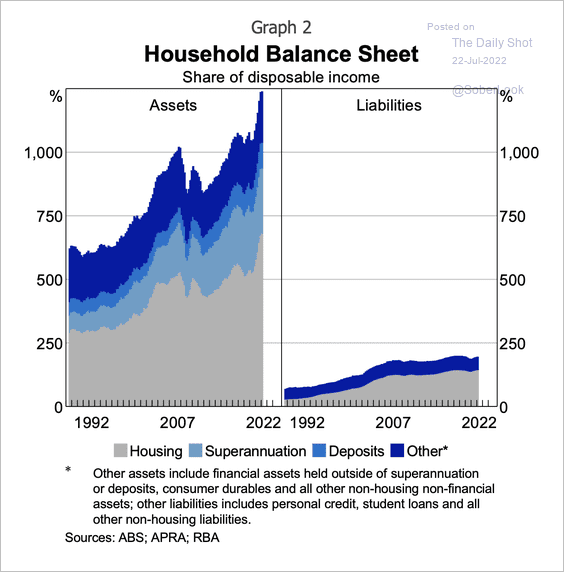 Source: RBA Read full article
The ratio of household credit to income is lower than the headline figure when accounting for high savings levels.
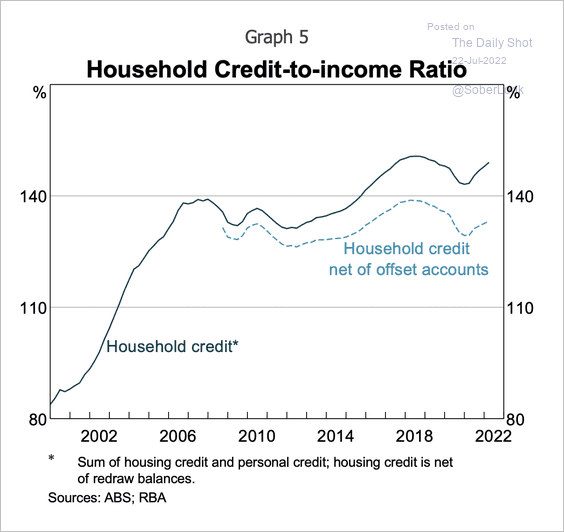 Source: RBA Read full article
A 300 basis point rise in variable mortgage rates would equate to large repayment increases for just under 30 percent of borrowers, according to RBA estimates.
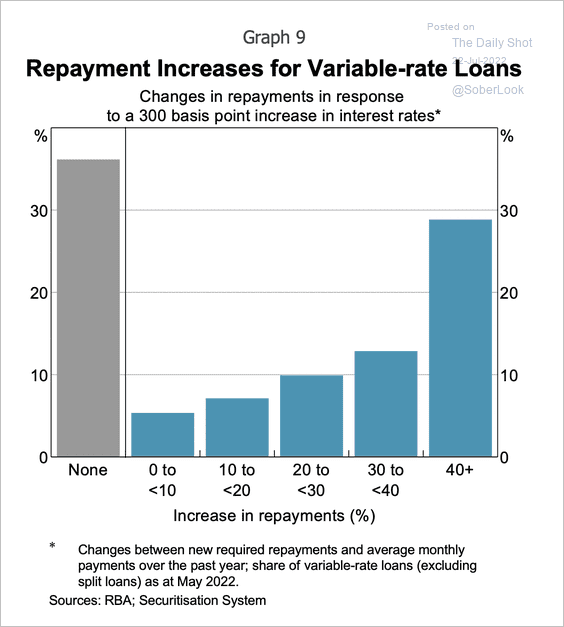 Source: RBA Read full article
——————–
3. COVID cases are on the rise again.
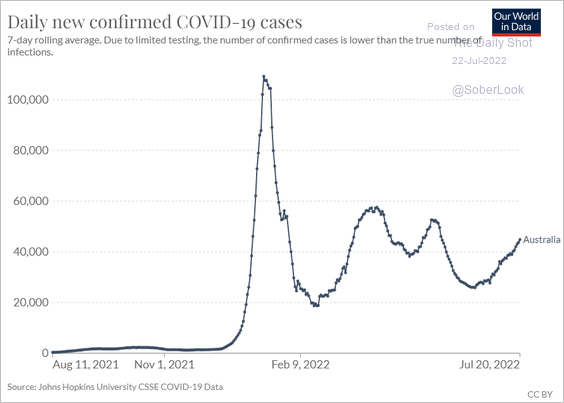 Source: Our World In Data
 Source: Reuters Read full article
Back to Index
China
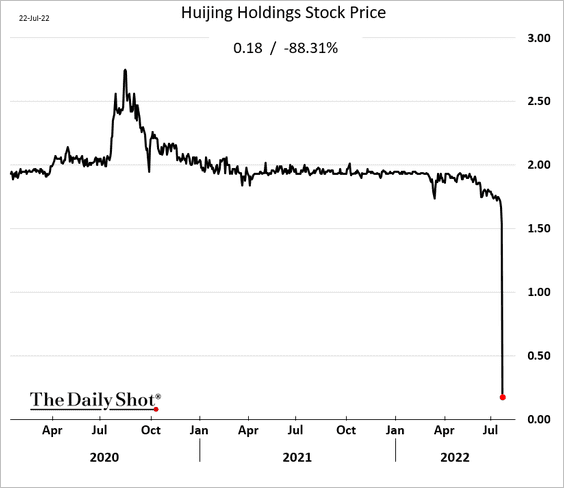
1. Huijing Holdings, a property developer, swapped $108 million of bonds due this week for new debt (effectively a default). Hong Kong-based shares collapsed.
There are a lot of unfinished homes out there.
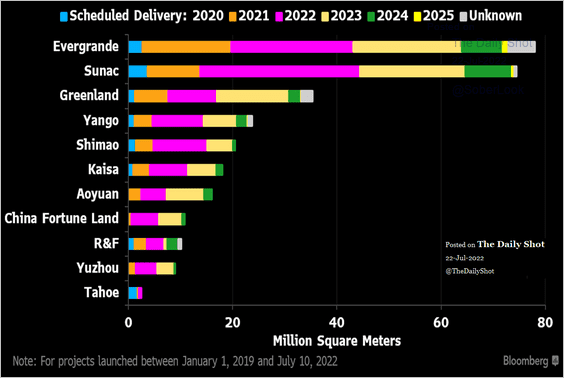 Source: @markets Read full article
——————–
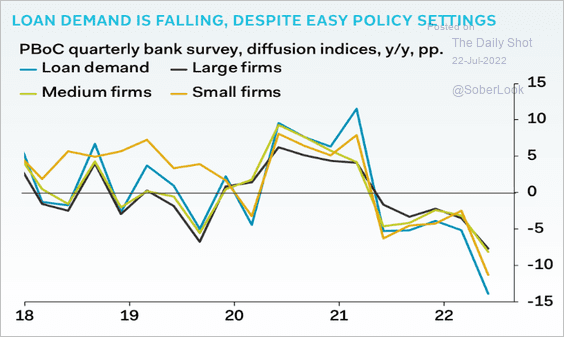
2. Business loan demand has deteriorated.
 Source: Pantheon Macroeconomics
3. Youth unemployment continues to climb.
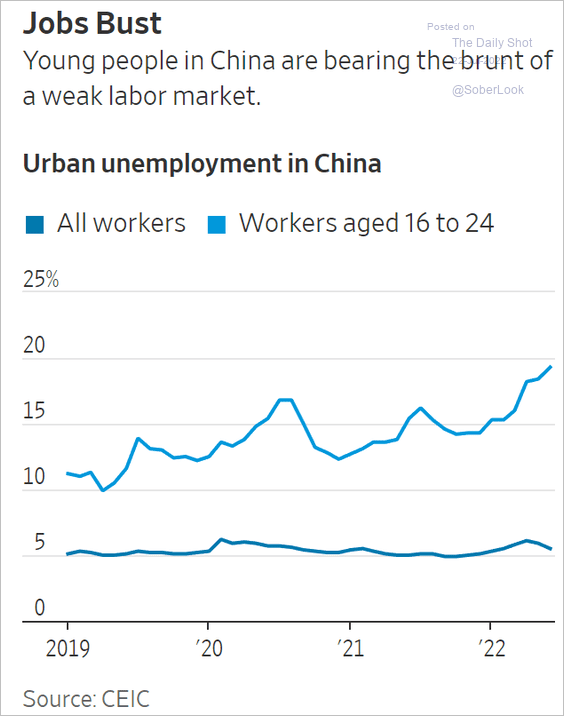 Source: @WSJ Read full article
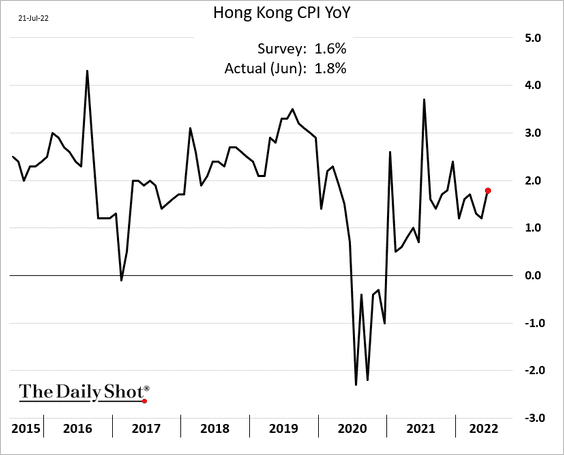
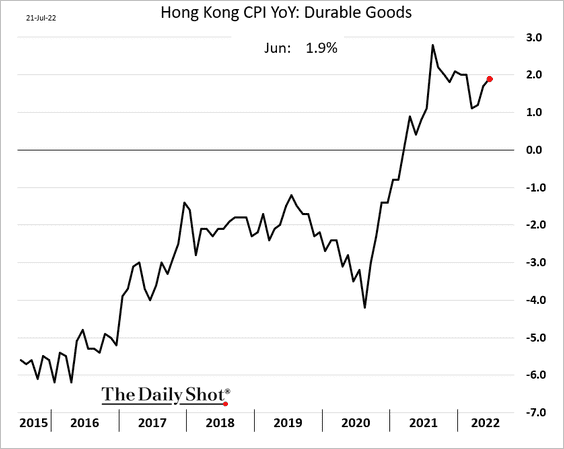
4. Hong Kong’s inflation surprised to the upside.
Back to Index
Emerging Markets
1. Mexican retail sales were strong in May.
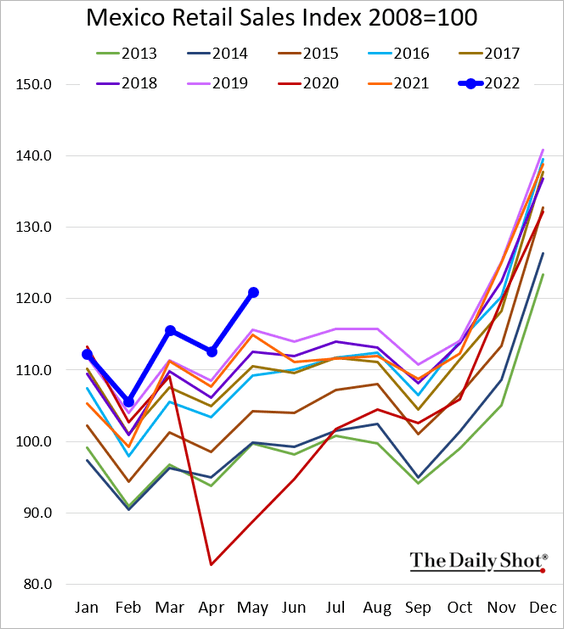
Separately, Mexico has not been able to take advantage of the US-China trade spat the way Vietnam did.
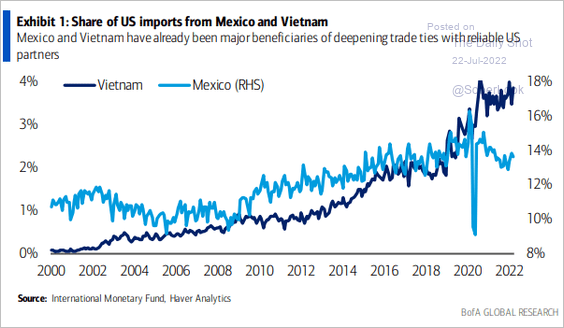 Source: BofA Global Research; @MikeZaccardi
——————–
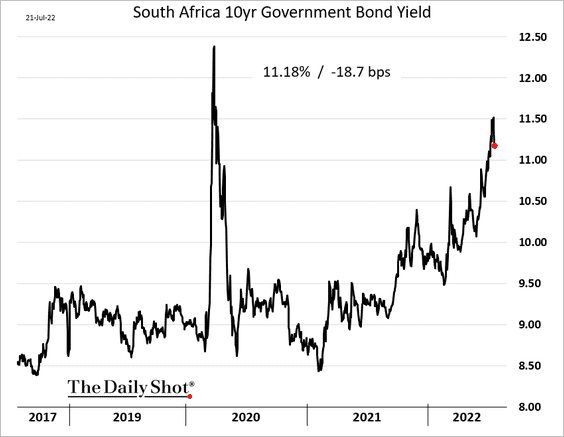
2. South Africa’s central bank surprised with a 75 bps rate hike.
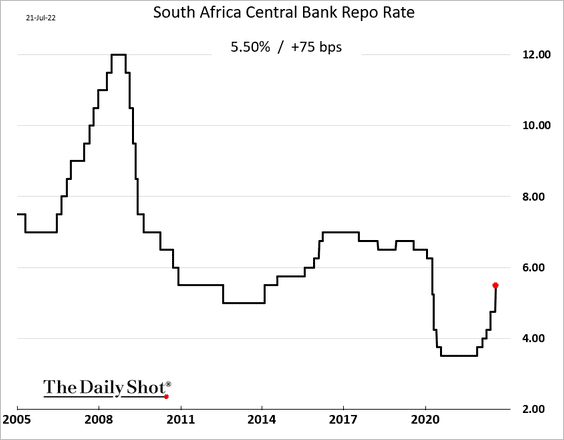
Bond yields dropped as investors bet that the central bank is now committed to tackling inflation.
——————–
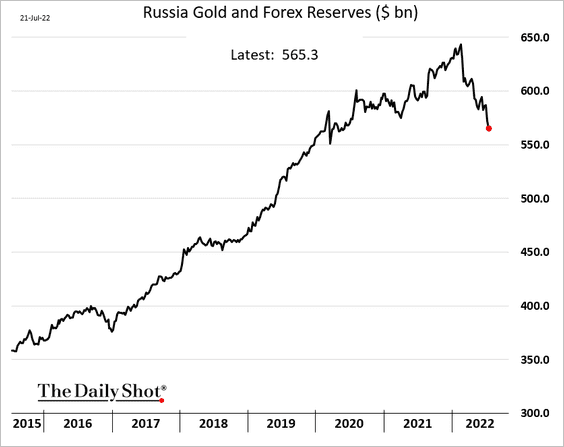
3. Russia’s FX reserves continue to fall, partially pulled lower by weaker gold prices.
4. Ukraine devalued the hryvnia by 20% to protect foreign reserves.
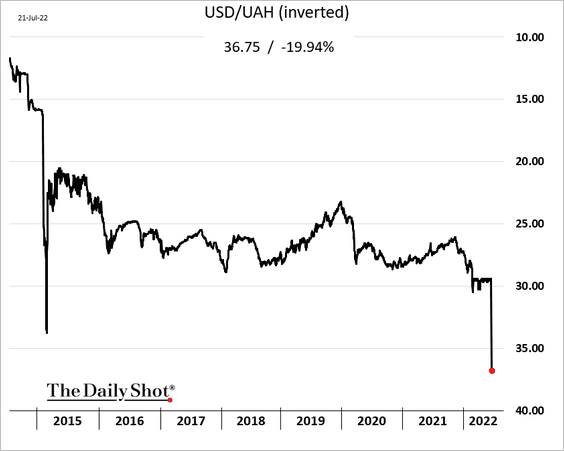
 Source: Barron’s Read full article
——————–
5. EM real money supply growth (M1) has been outpacing advanced economies.
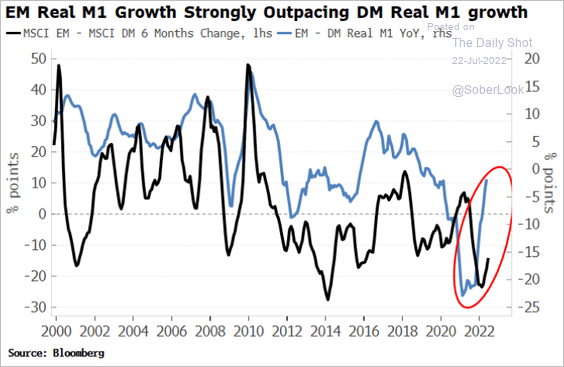 Source: Simon White, Bloomberg Markets Live Blog
Back to Index
Cryptocurrency
1. It’s been a good week for cryptos, with bitcoin cash (BCH) and ether (ETH) outperforming some of the largest tokens.
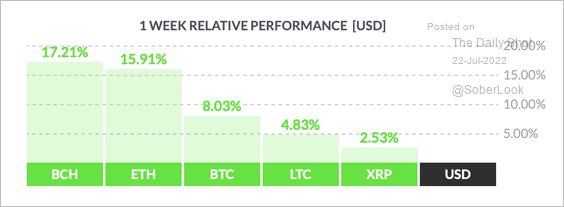 Source: FinViz
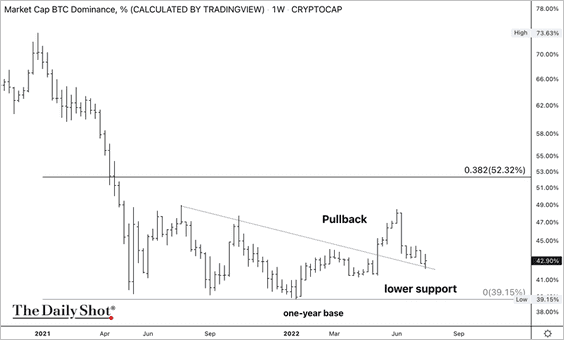
2. BTC’s market cap relative to the total crypto market cap (dominance ratio) is approaching support.
3. The crypto Fear & Greed Index exited “extreme fear” territory this week as bearish sentiment waned.
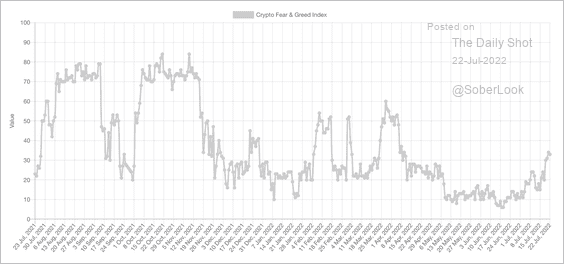 Source: Alternative.me
4. Open interest in the ETH derivatives ticked higher during the recent price jump (2 charts).
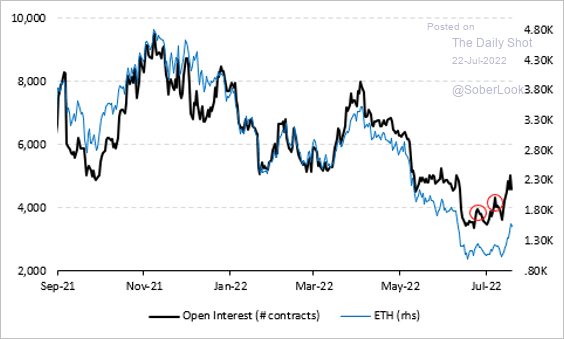 Source: Vanda Research
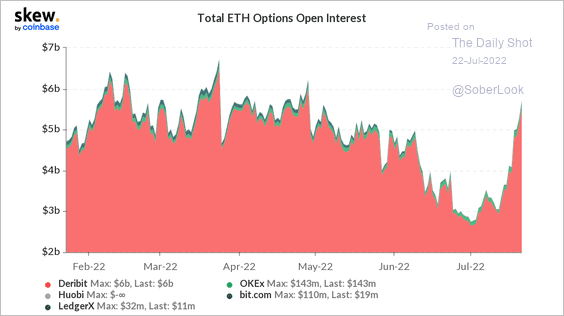 Source: Skew
——————–
5. Bitcoin’s put/call ratio is starting to decline from elevated levels.
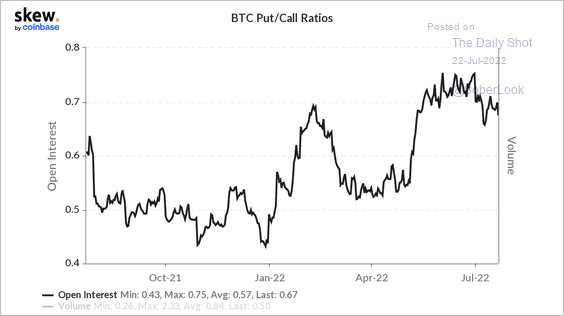 Source: Skew
6. Retail purchases of publicly traded bitcoin proxies accelerated over the past two weeks.
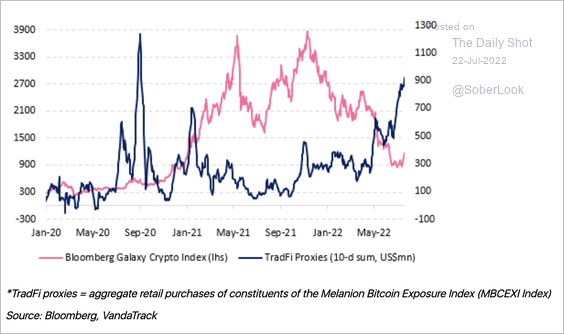 Source: Vanda Research
Back to Index
Commodities
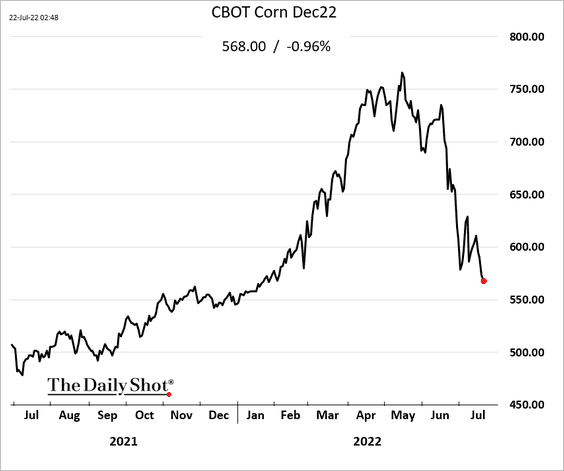
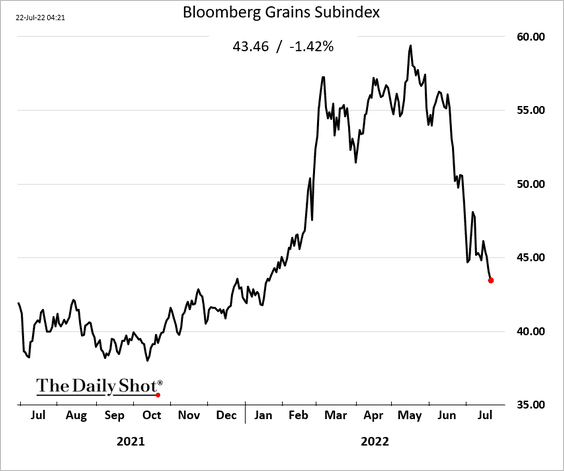
1. US grains have resumed declines.
——————–
2. Next, we have some updates on gold.
• The copper-to-gold ratio has been falling. But the ratio of copper mining shares to gold mining shares has been stable.
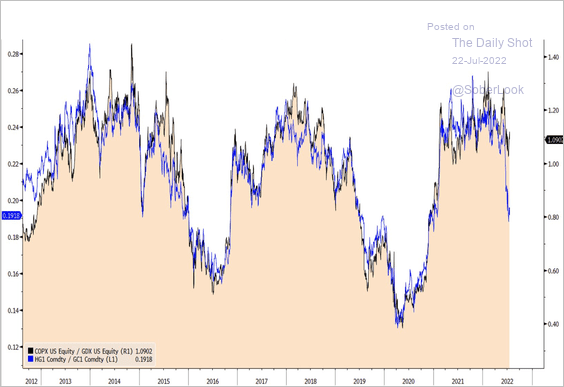 Source: @TeddyVallee
• The front-month gold futures contract displays a similar topping pattern to 2012-2013.
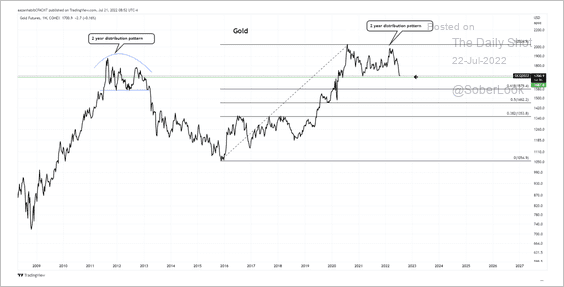 Source: Aazan Habib, Paradigm Capital
• Gold futures speculators have significantly reduced their long positions.
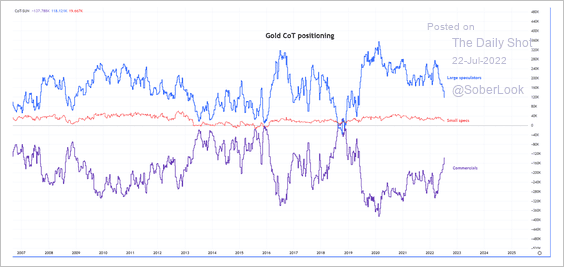 Source: Aazan Habib, Paradigm Capital
——————–
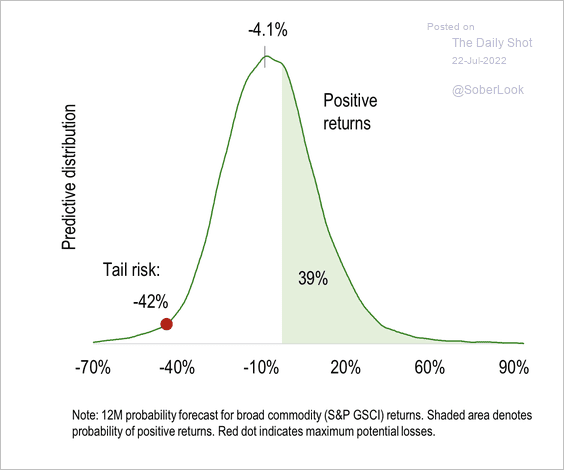
3. Numera forecasts further weakness in commodity prices over the next 12 months, …
 Source: Numera Analytics
… although non-energy commodities could outperform over the same time period.
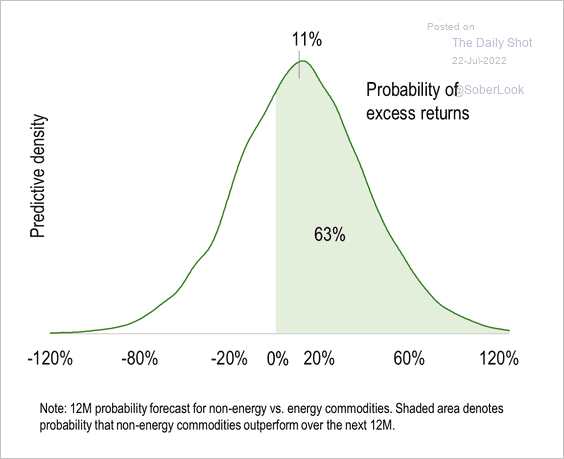 Source: Numera Analytics
Back to Index
Energy
1. What’s next for crude oil? This chart shows NYMEX crude futures.
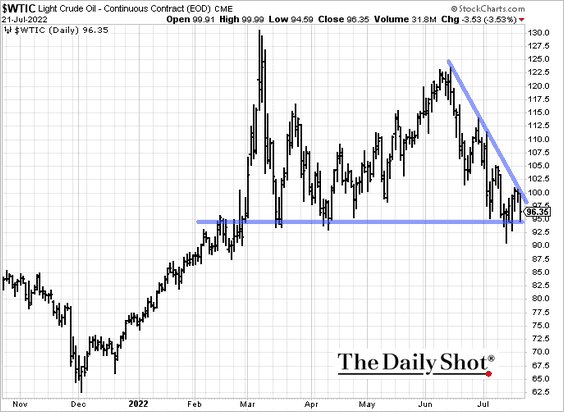
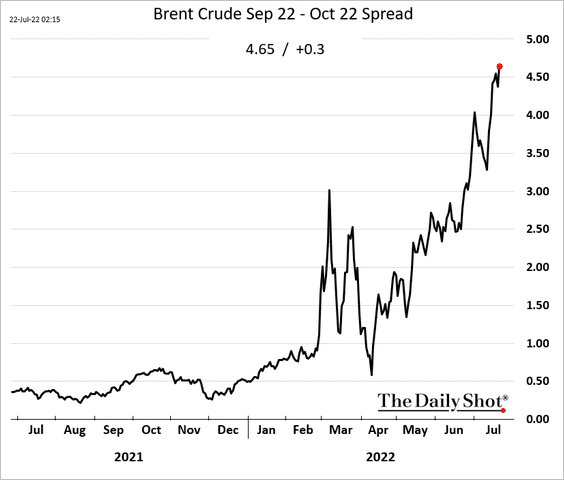
The market remains tight (deep backwardation).
——————–
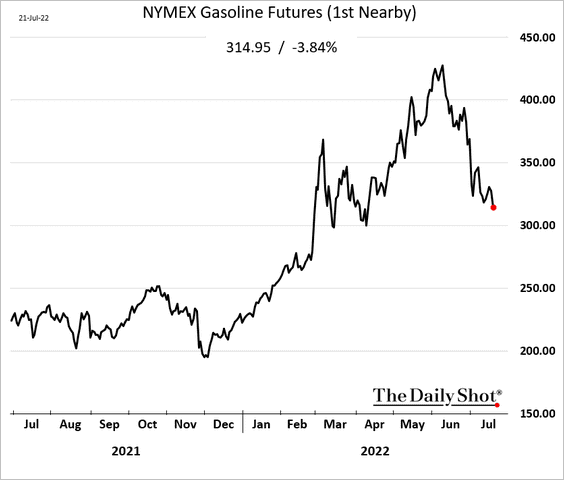
2. US gasoline futures continue to trade lower.
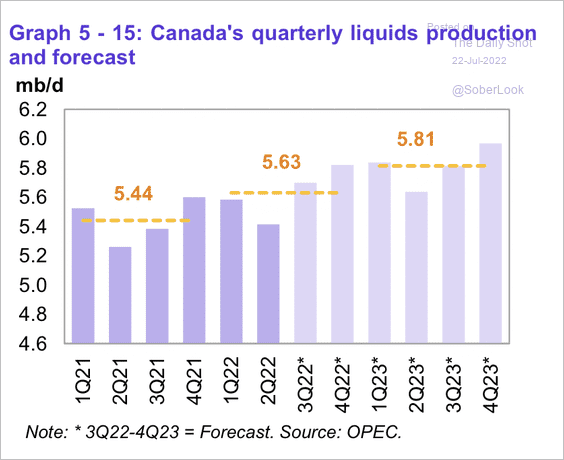
3. This chart shows key drivers of non-OPEC liquids supply growth next year.
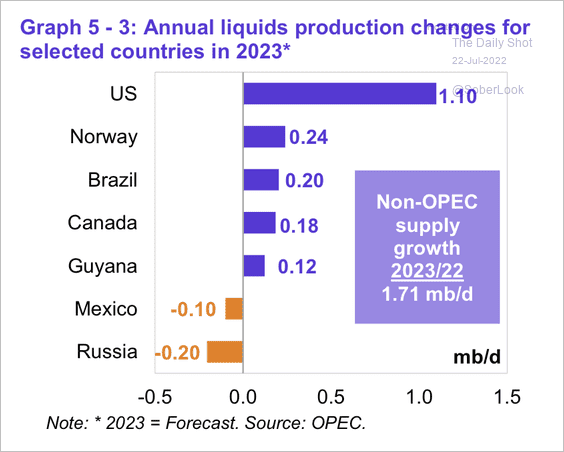 Source: OPEC
• Canada’s liquids production is forecast to gradually increase at a similar pace next year, with production mainly coming from Alberta’s oil sands, according to OPEC.
 Source: OPEC
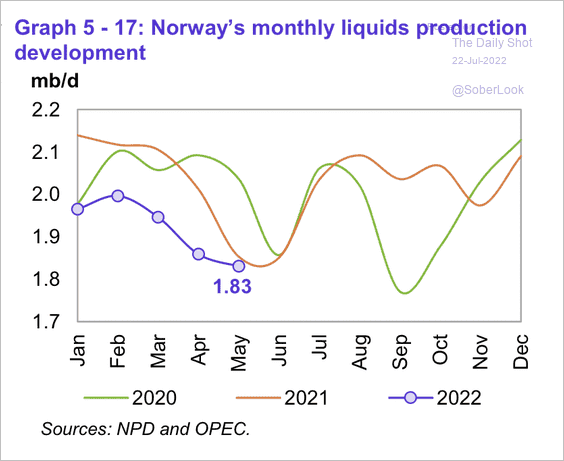
• Norway’s liquids production declined in May because of summer maintenance in offshore platforms and some operators prioritizing gas production.
 Source: OPEC
——————–
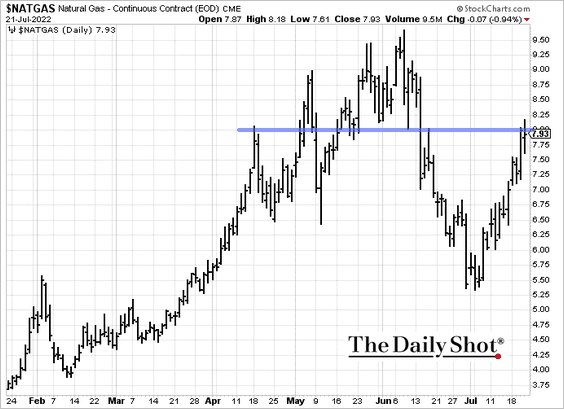
4. US natural gas is holding resistance at $8/mmbtu.
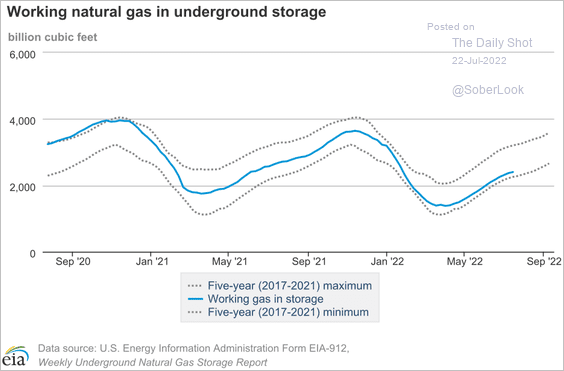
Inventories remain inside the five-year range.
——————–
5. This chart shows the US electricity generation mix.
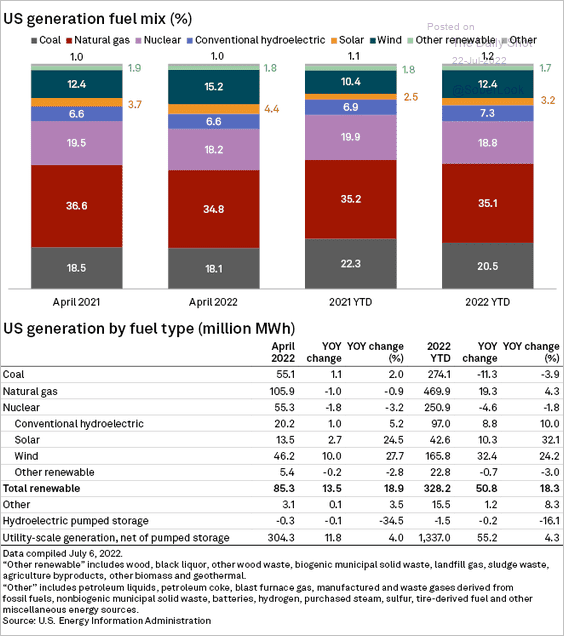 Source: S&P Global Market Intelligence
• Electricity production from solar and wind has been climbing (see comment).
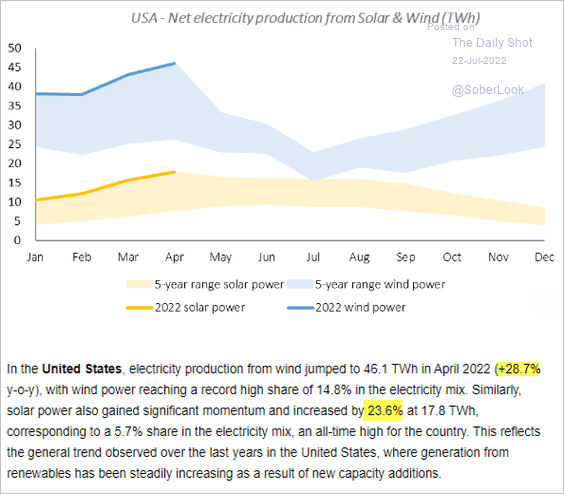 Source: IEA
• Here is a forecast from Piper Sandler.
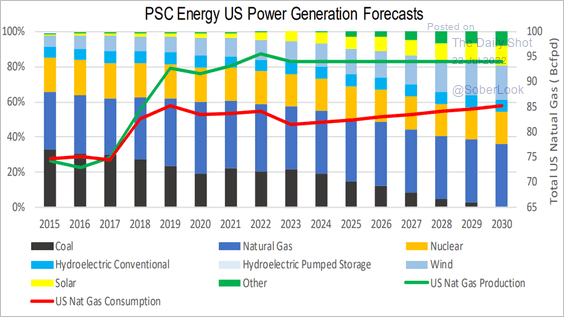 Source: Piper Sandler
Back to Index
Equities
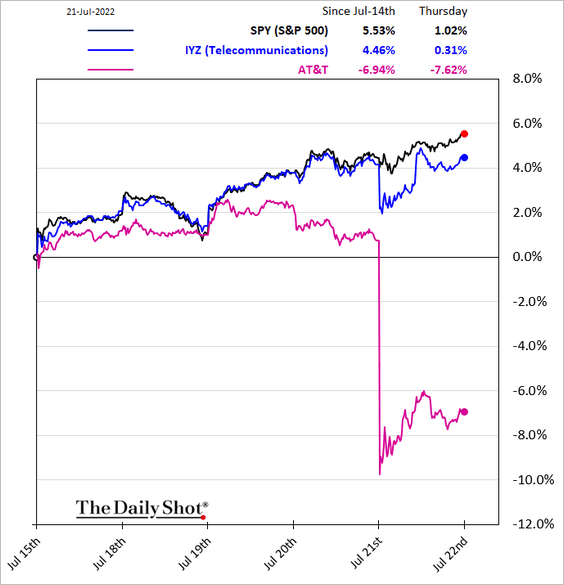
1. The rally continued on Thursday, but Snap ruined the party after the close. It’s a reminder that the operating environment has deteriorated for many firms.
 Source: @WSJ Read full article
Another example is AT&T feeling cash flow pressures.
——————–
2. The market is pricing in higher earnings-day volatility than we typically had over the past three years. This scatterplot shows implied vs. realized vol for earnings-release days.
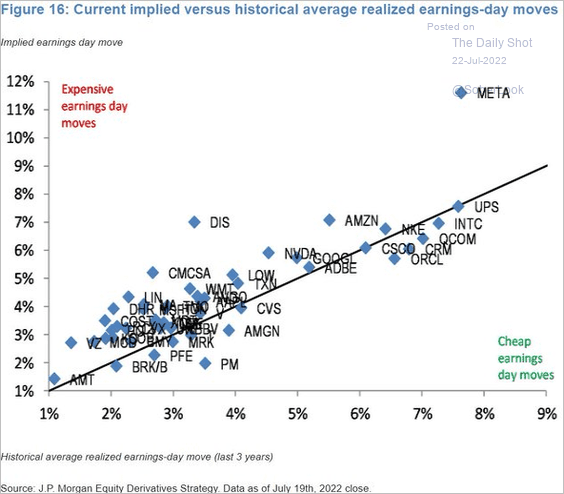 Source: JP Morgan Research; @GunjanJS
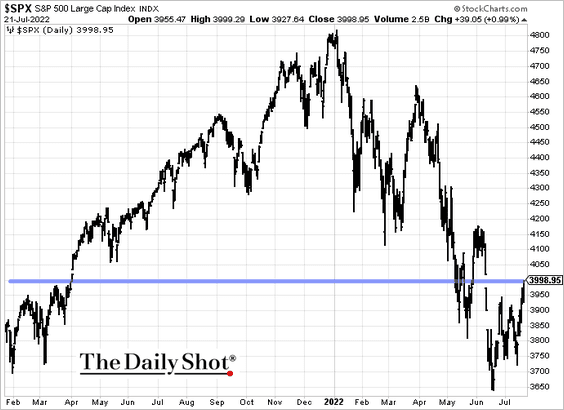
3. Will the S&P 500 hold resistance at 4,000?
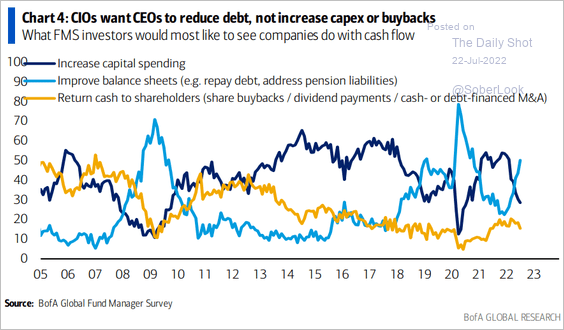
4. Fund managers want companies to cut debt rather than invest or return cash.
 Source: BofA Global Research
5. Here is market performance based on control of Congress and the White House. The most likely outcome after the midterms produces the best return.
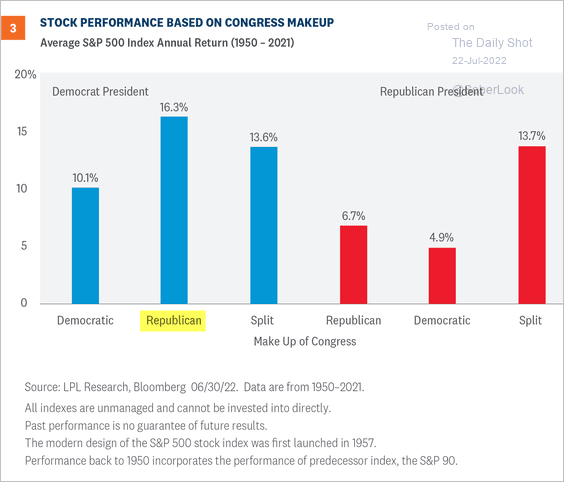 Source: LPL Research
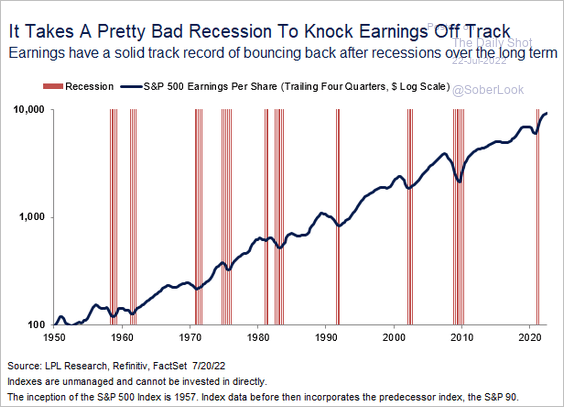
6. Earnings tend to bounce back after recessions.
 Source: LPL Research
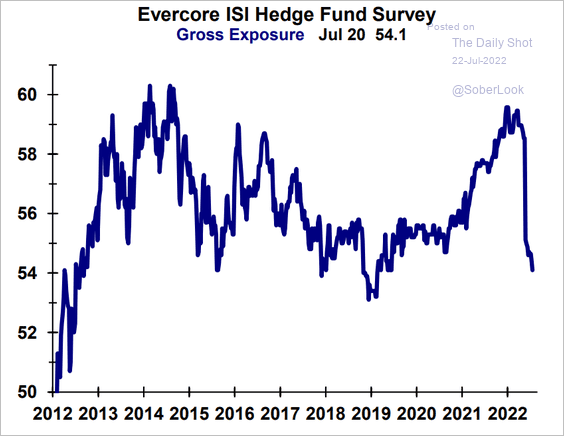
7. Equity hedge funds’ balance sheets remain relatively lean.
 Source: Evercore ISI Research
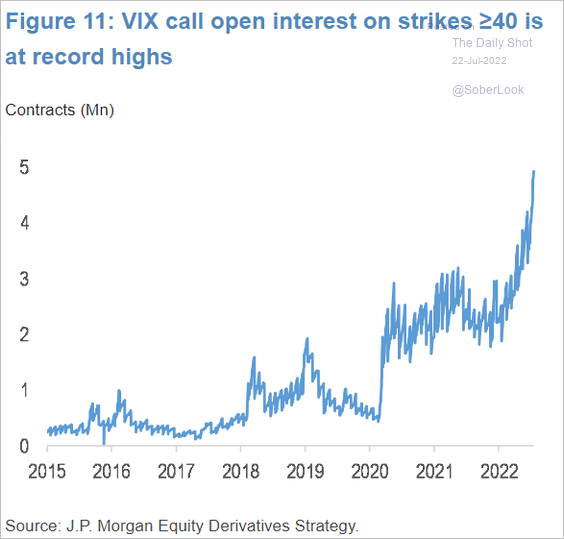
8. There has been quite a bit of interest in VIX call options at strikes above 40 (tail risk events).
 Source: JP Morgan Research; @GunjanJS
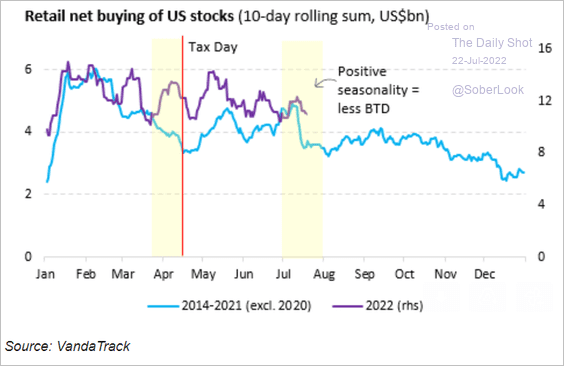
9. Retail activity in US stocks typically declines in July.
 Source: Vanda Research
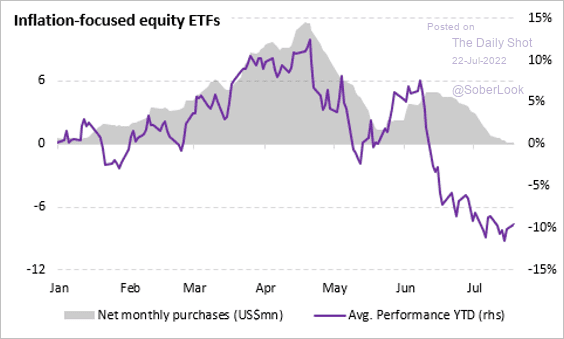
10. Net purchases of inflation-focused equity ETFs have declined over the past few months, tracking lower performance.
 Source: Vanda Research
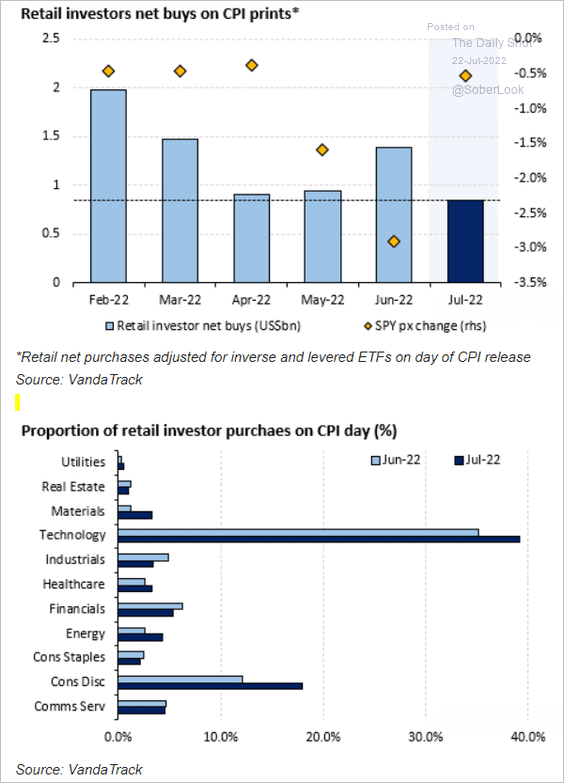
This chart shows retail investor activity in response to US CPI reports.
 Source: Vanda Research
Back to Index
Alternatives
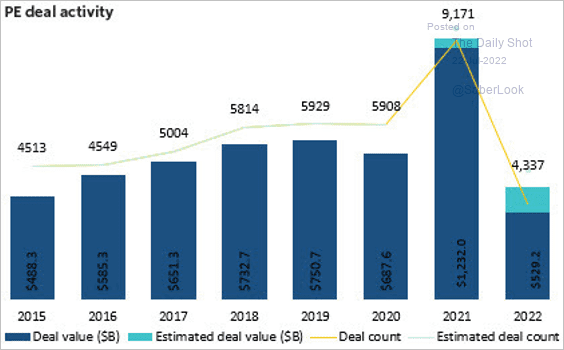
1. Private equity deal activity has slowed relative to last year but is still on a strong pace by historical standards.
 Source: PitchBook
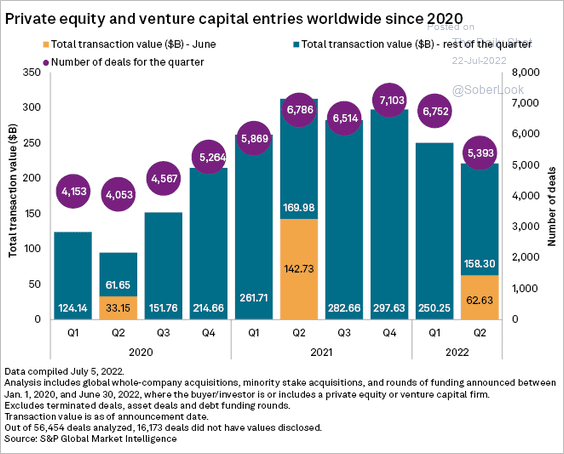 Source: S&P Global Market Intelligence
2. Of this year’s total, $77 billion was committed to venture capital funds worth more than $1 billion or more – the largest annual total raised by mega-funds.
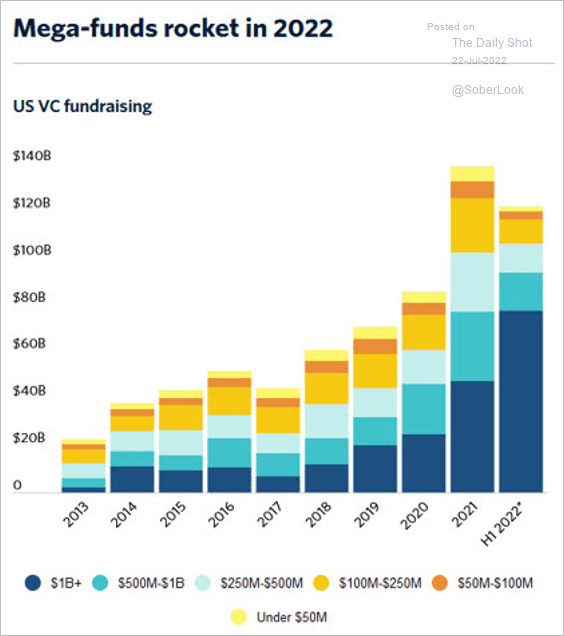 Source: PitchBook
3. US venture capital fundraising activity has sustained momentum from the end of last year. Established managers have been deploying record levels of dry powder, although the pace of activity could slow over the next six months, according to PitchBook.
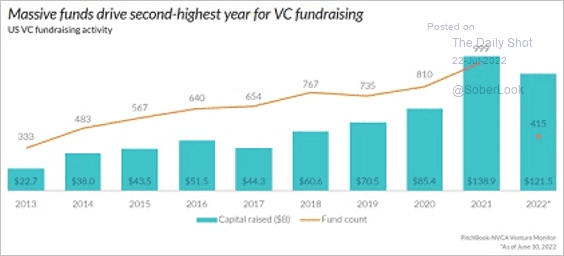 Source: PitchBook
4. Sustainability-linked startups have been raising quite a bit of capital.
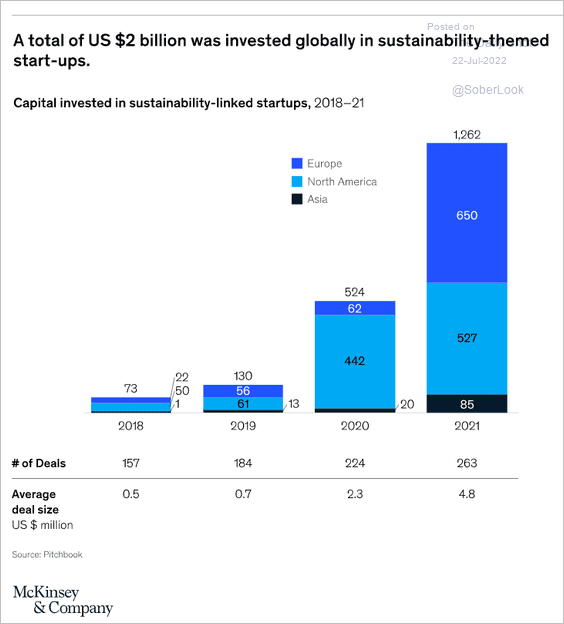 Source: McKinsey & Company
Back to Index
Credit
1. US investment-grade funds saw significant outflows in May and June (chart shows cumulative net fund flows in billions).
 Source: Deutsche Bank Research
Europe’s investment-grade fund flows remain deeply negative.
 Source: Deutsche Bank Research
——————–
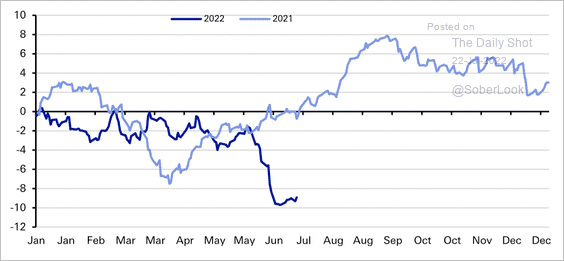
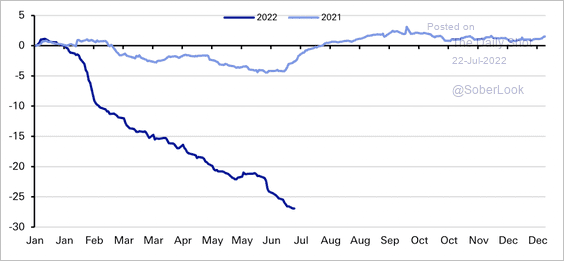
2. Subprime lending has been shrinking as a share of the overall auto loan market.
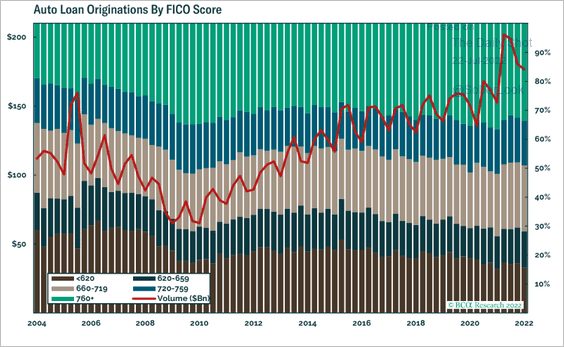 Source: BCA Research
Subprime auto delinquencies picked up last quarter.
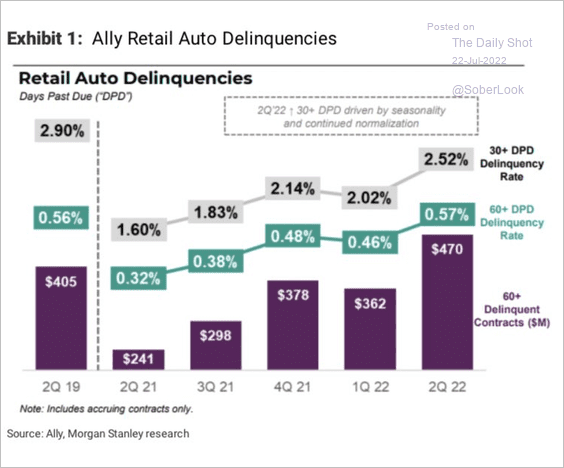 Source: Morgan Stanley Research; @carlquintanilla
Back to Index
Rates
1. Based on BofA’s survey of fund managers, rate hike expectations should begin to moderate with inflation expectations.
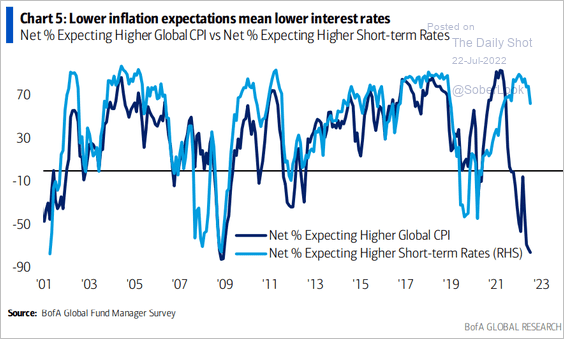 Source: BofA Global Research
2. This scatterplot shows how the yield curve flattens/inverts in response to Fed rate hikes.
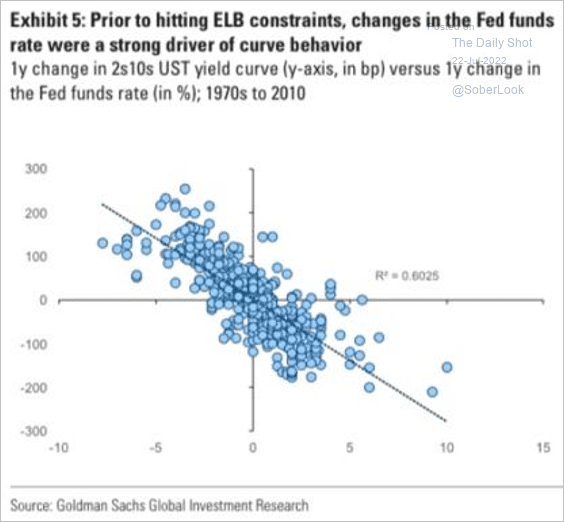 Source: Goldman Sachs
Back to Index
Global Developments
1. Housing valuations are stretched.
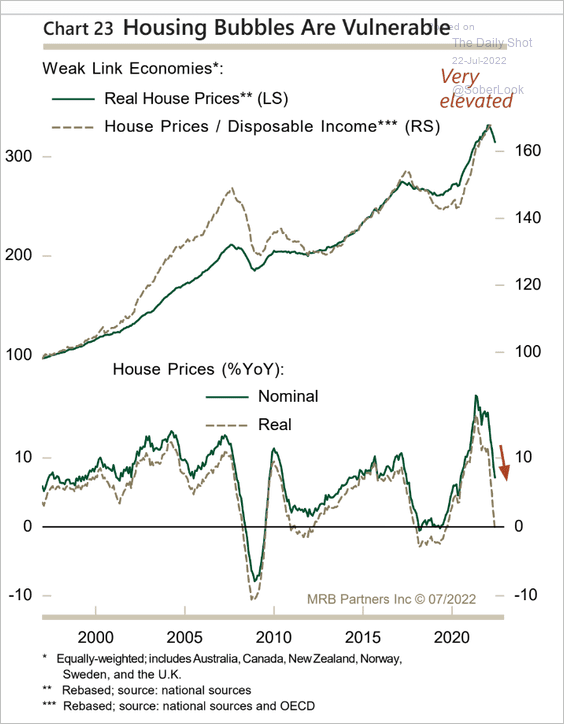 Source: MRB Partners
2. What are the key risks to financial market stability (according to BofA’s survey of fund managers)?
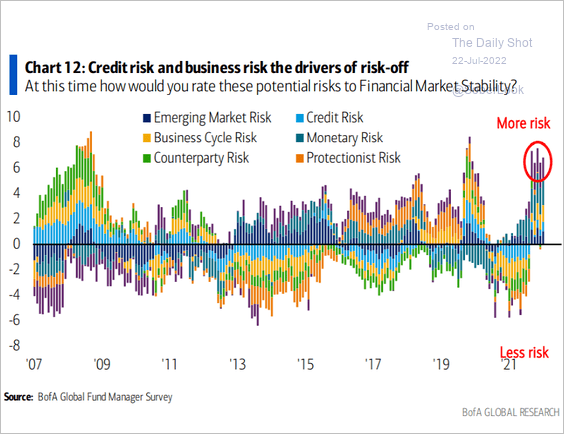 Source: BofA Global Research
3. The three largest economies are over half of global GDP.
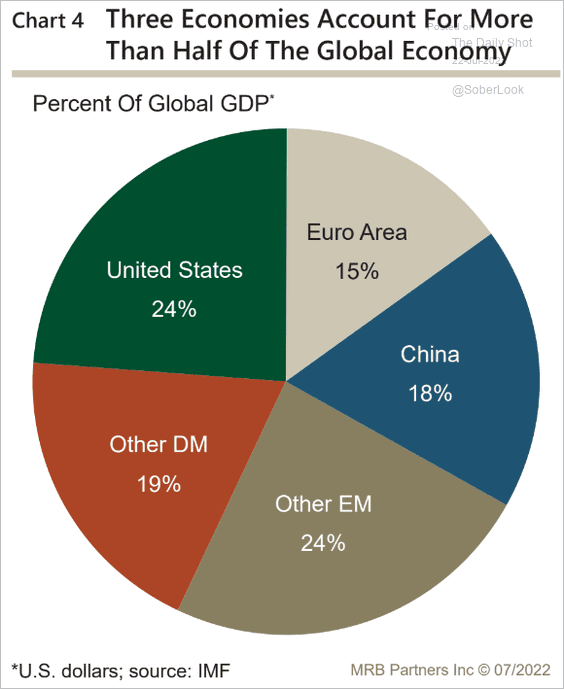 Source: MRB Partners
——————–
Food for Thought
1. The most popular online payment methods:
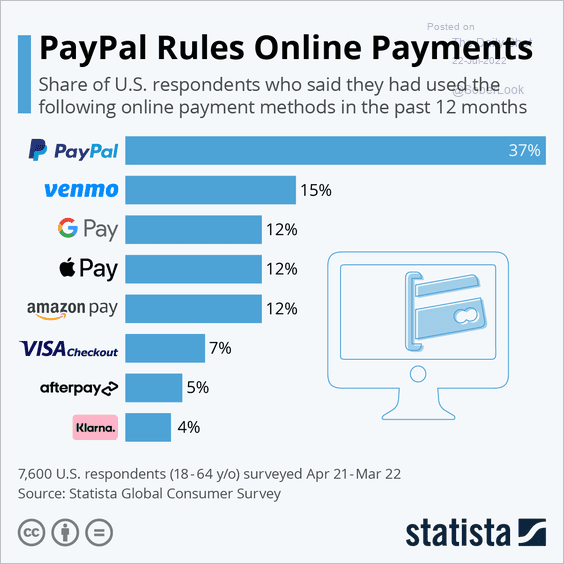 Source: Statista
2. Origins of capital coming into the US:
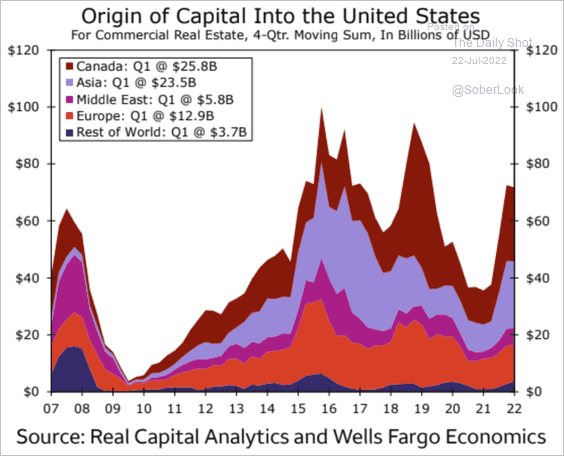 Source: Wells Fargo Securities
3. Composition of household assets by country:
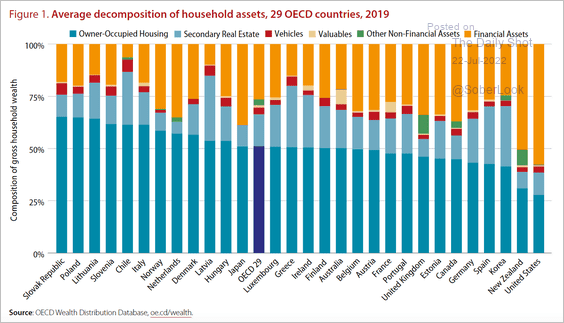 Source: OECD Read full article
4. US gun production:
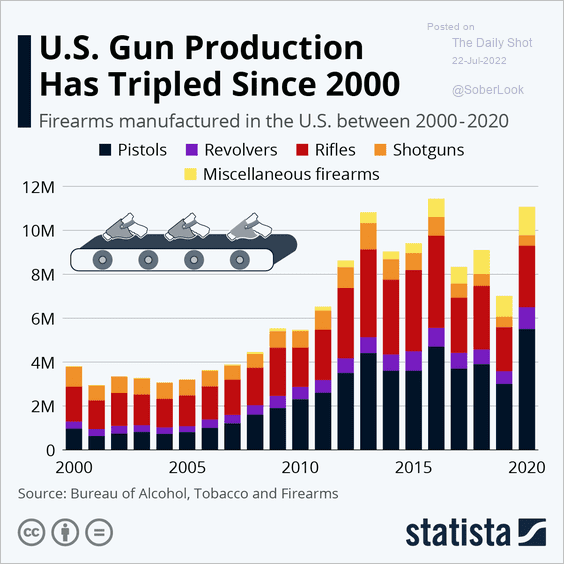 Source: Statista
5. Upward mobility vs. single motherhood rates across US metro regions:
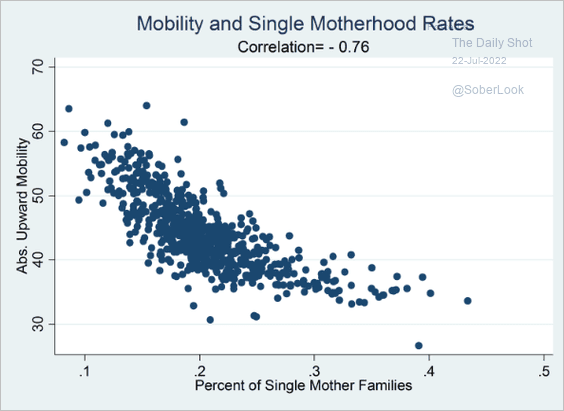 Source: Brookings Read full article
6. Some facts about nuclear energy:
![]() Source: @jessefelder, The Economist Read full article
Source: @jessefelder, The Economist Read full article
7. Getting out of a conversation:
 Source: @mattsurely
——————–
Have a great weekend!
Back to Index