
The Daily Shot: 21-Jul-22
• The United States
• Canada
• The United Kingdom
• The Eurozone
• Asia – Pacific
• China
• Emerging Markets
• Cryptocurrency
• Energy
• Equities
• Credit
• Global Developments
• Food for Thought
The United States
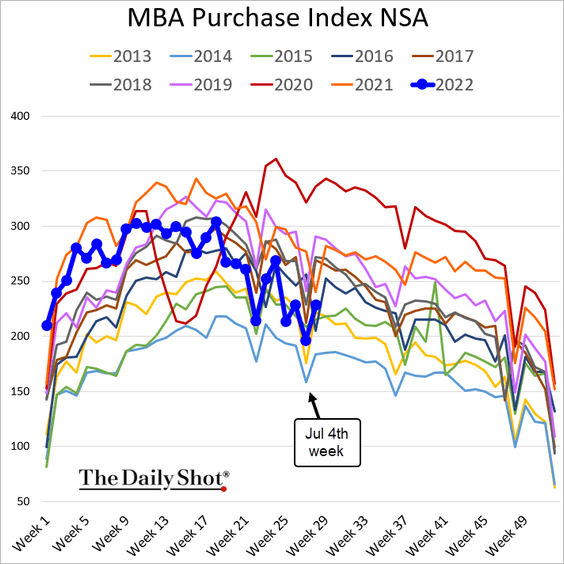
1. Let’s begin with the housing market.
• Mortgage applications continue to trend lower.
Here is the rate lock count.
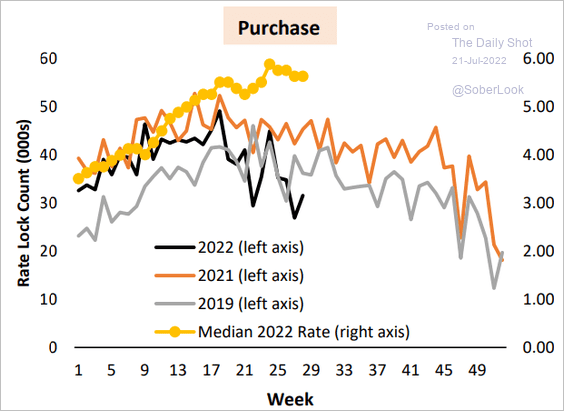 Source: AEI Center on Housing Markets and Finance
• Existing home sales are at 2019 levels, well below last year’s peak.
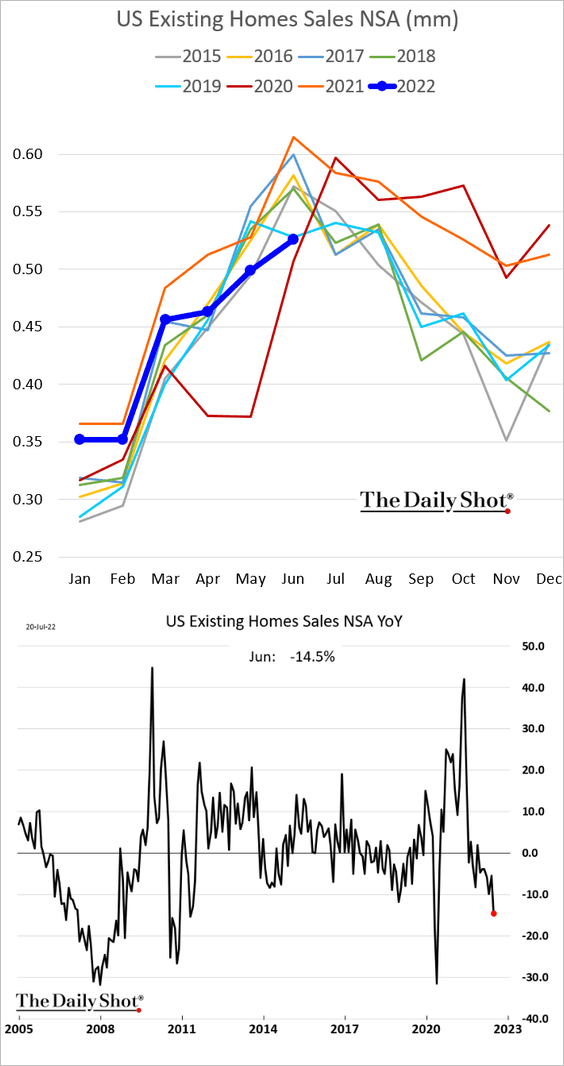
Mortgage applications point to further weakness ahead.
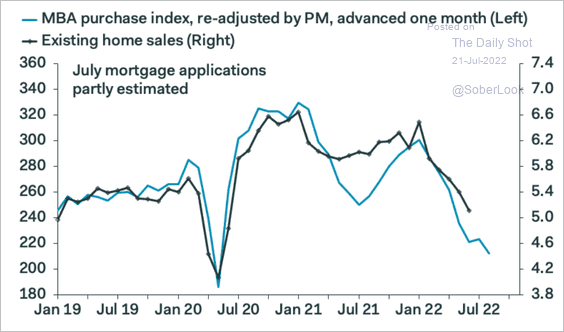 Source: Pantheon Macroeconomics
• Housing inventories are still low but climbing quickly.
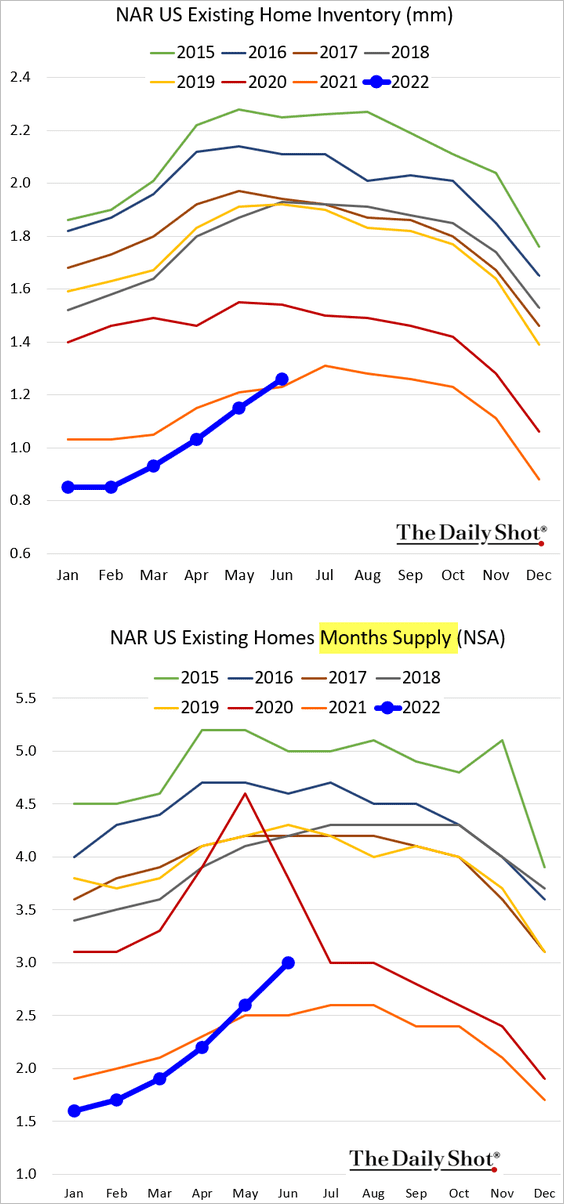
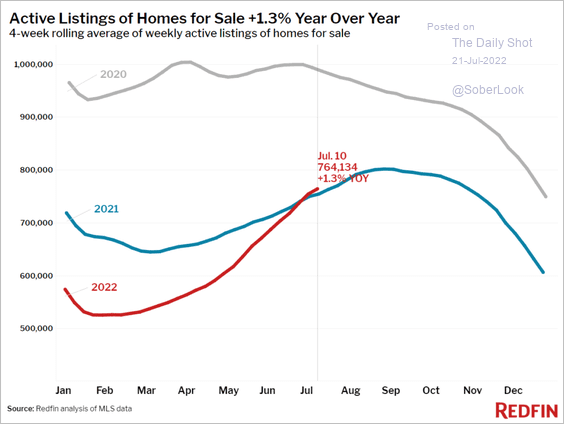 Source: Redfin
• The median price hit a record high.
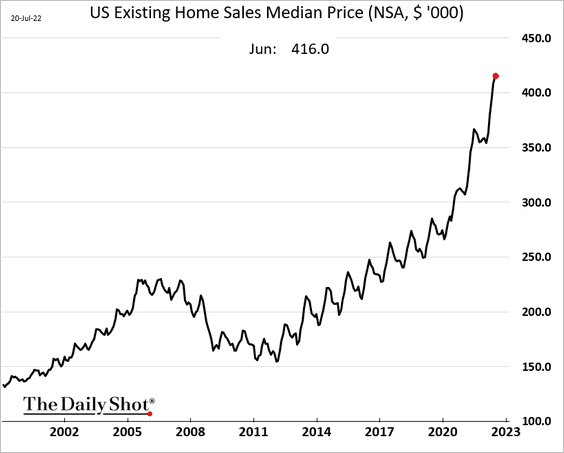
However, prices are generally higher in the summer. Pantheon Macroeconomics says that the median price declined last month on a seasonally-adjusted basis.
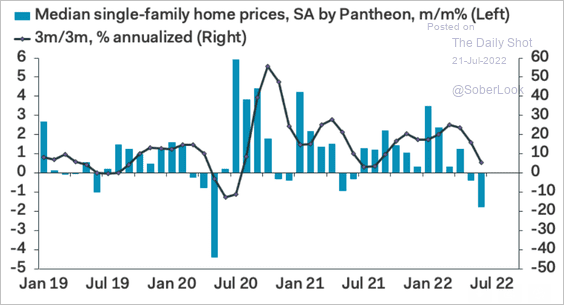 Source: Pantheon Macroeconomics
• More sellers are cutting their listing prices.
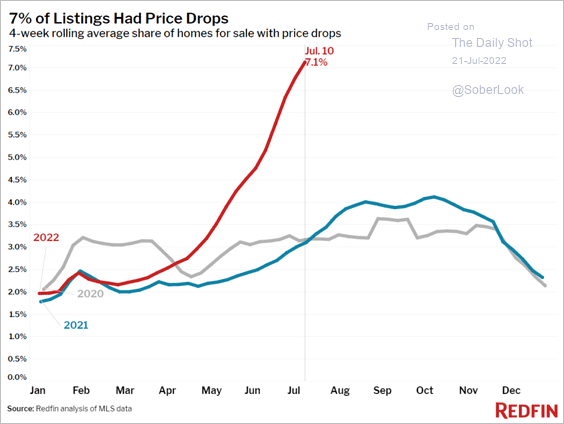 Source: Redfin
• A smaller share of buy offers resulted in a sale last month.
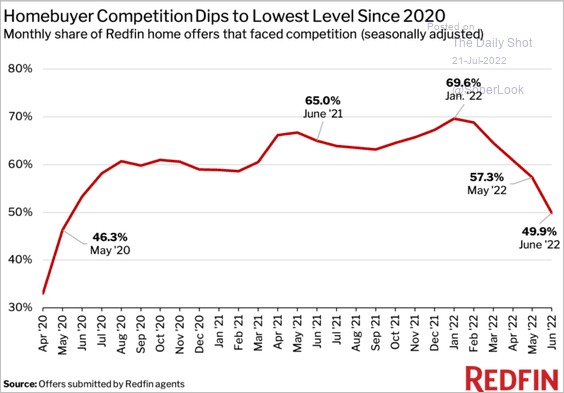 Source: Redfin
——————–
2. Consumer sentiment ticked higher over the past couple of weeks, …
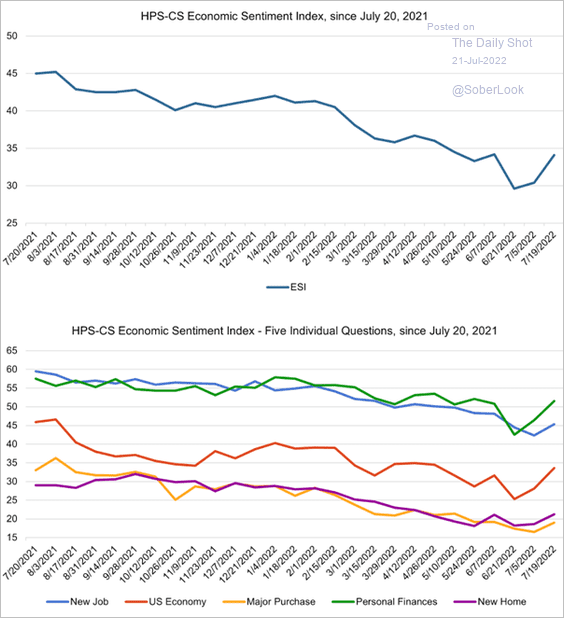 Source: @HPS_CS, @HPSInsight, @CivicScience
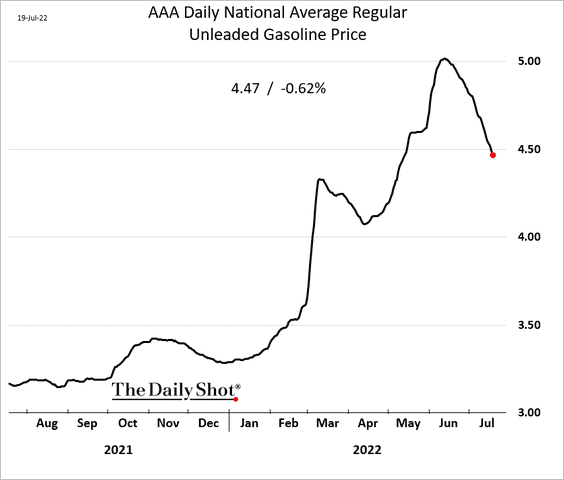
… as gasoline prices fell.
——————–
3. Various models continue to show elevated recession probabilities.
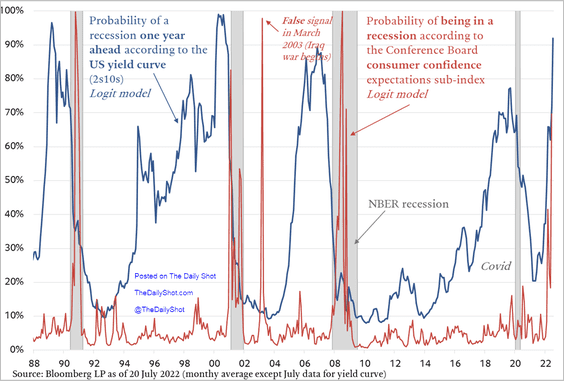 Source: @TCosterg
4. Next, we have some updates on the labor market.
• Consumer sentiment is signaling much higher unemployment ahead.
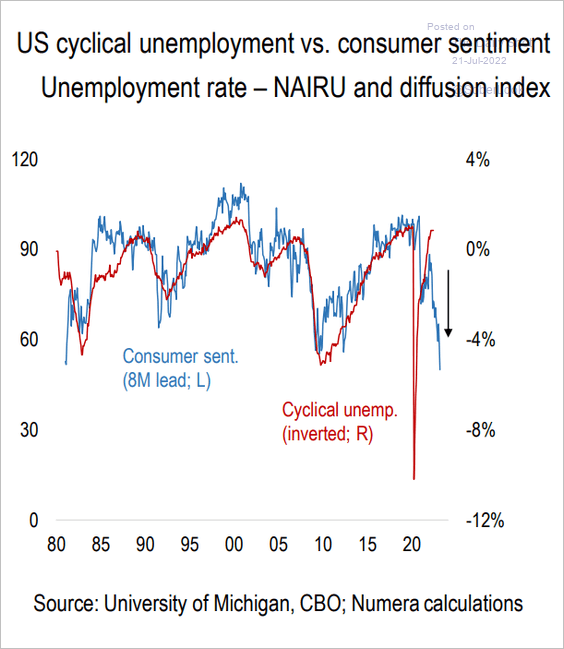 Source: @NumeraAnalytics
• Goldman sees slowing payroll gains going forward.
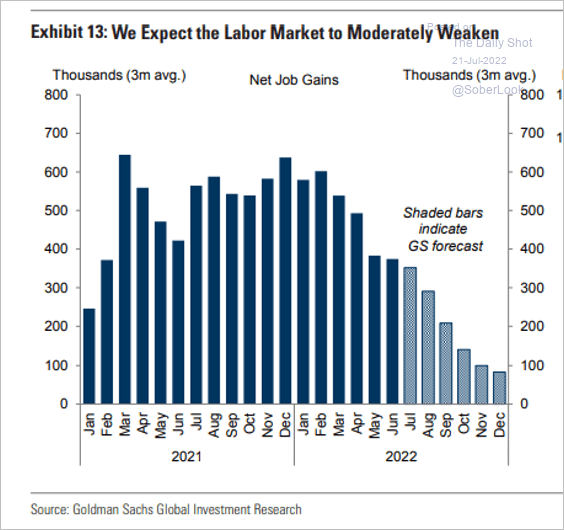 Source: Goldman Sachs; @MikeZaccardi
• As we mentioned previously, the household survey, which includes non-payrolled employment (for example, self-employment) has been much weaker than the establishment survey (more info on the two surveys here).
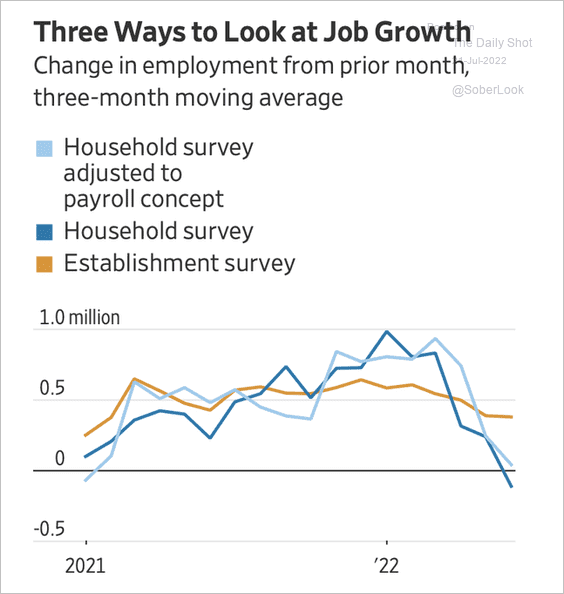 Source: @jessefelder, @WSJ Read full article
• Fewer companies plan to boost wages, according to a survey from Evercore ISI.
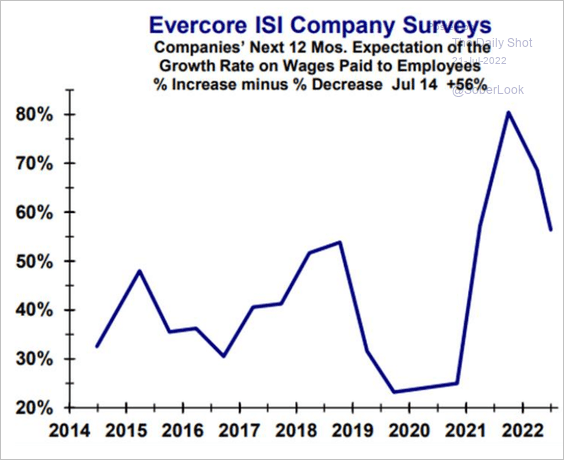 Source: Evercore ISI Research
——————–
5. Below is a prescient WSJ headline from 2006.
 Source: @WSJ Read full article
And here is one from this week. Inventory is managed differently now.
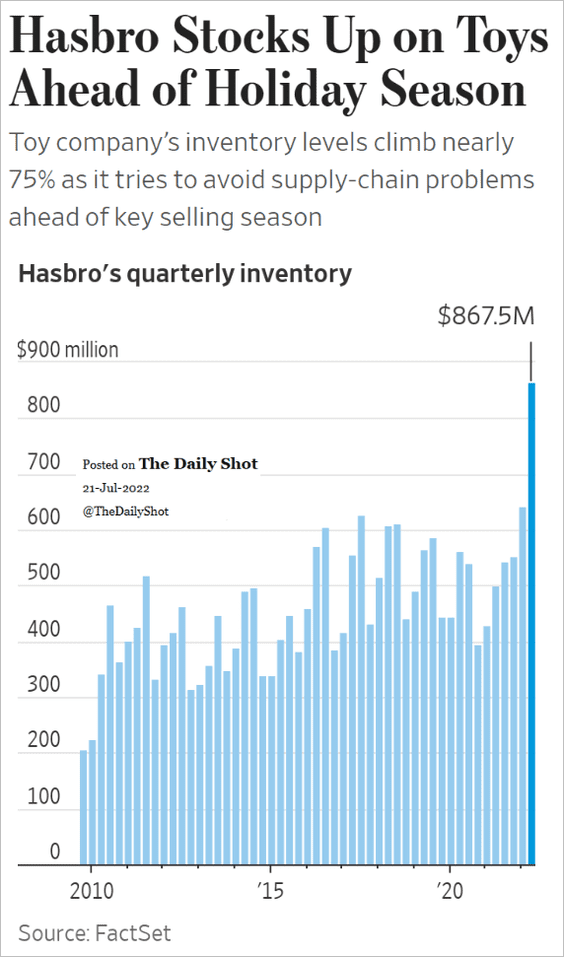 Source: @WSJ Read full article
Back to Index
Canada
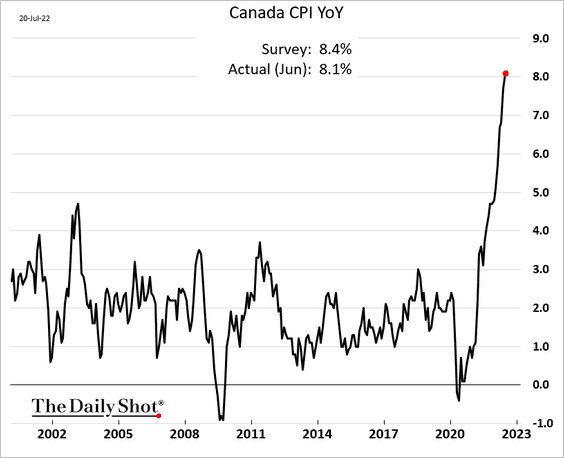
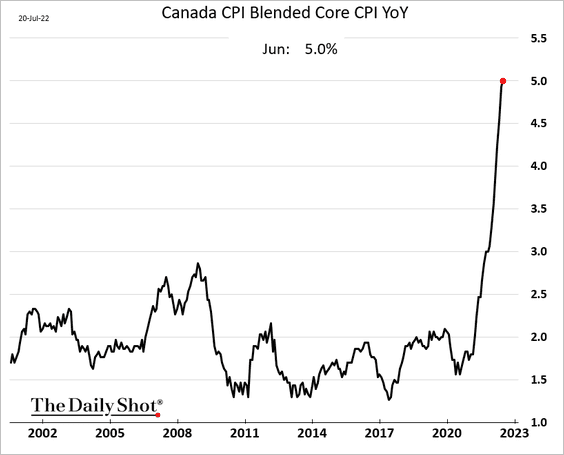
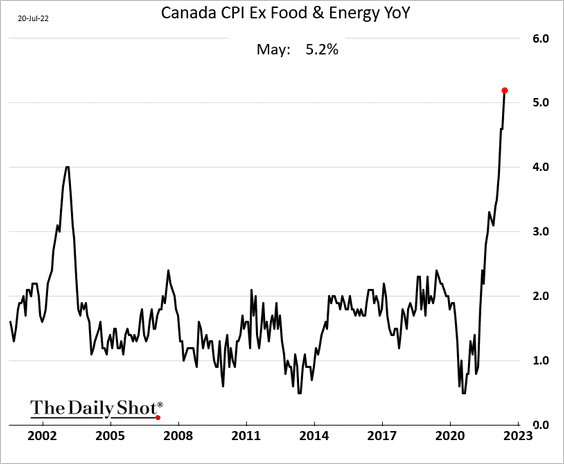
1. The headline CPI topped 8%, but the print was softer than expected.
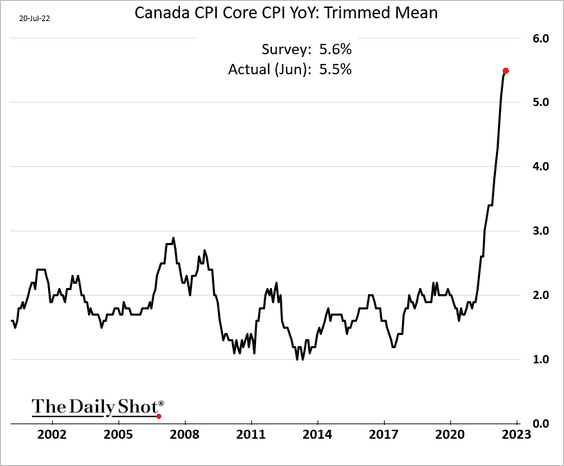
• Core inflation measures continue to climb (3 charts).
• Transportation costs (orange) have been soaring.
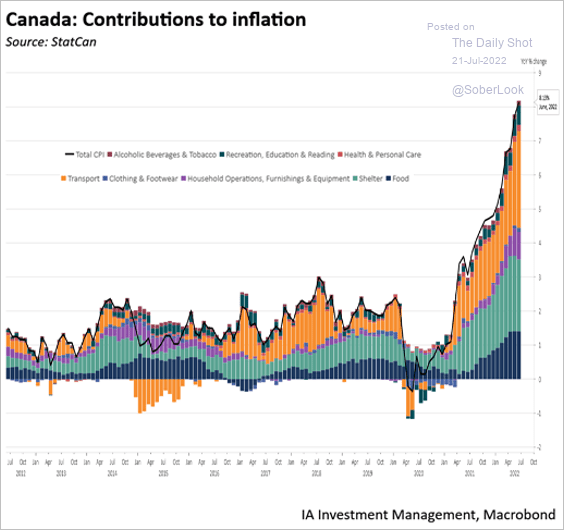 Source: Industrial Alliance Investment Management
• Here is the CPI by province.
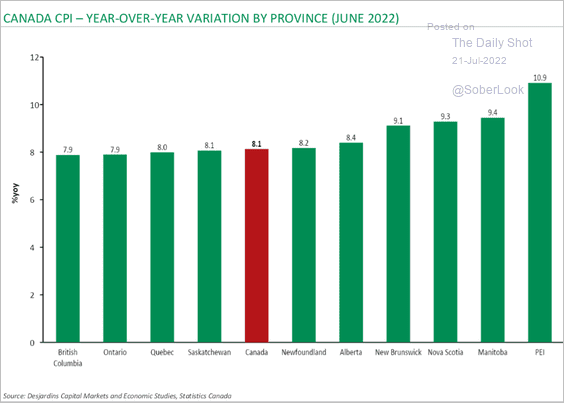 Source: Desjardins
• Here is a comparison to the US.
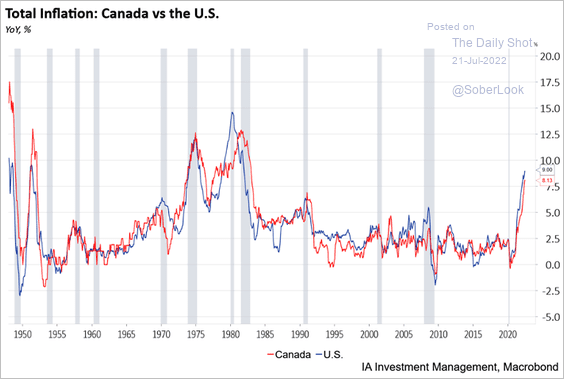 Source: Industrial Alliance Investment Management
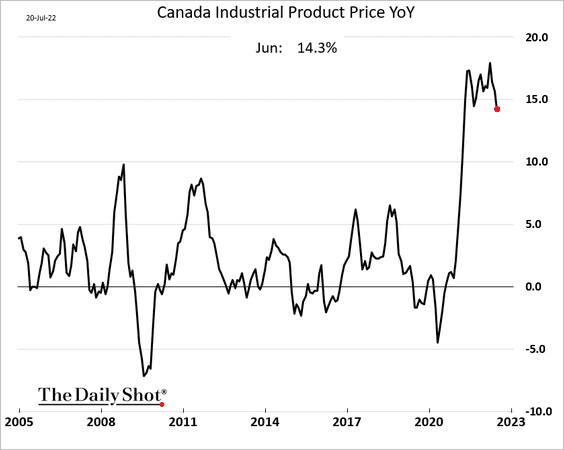
2. Industrial product inflation is off the highs but still 14% above last year’s levels.
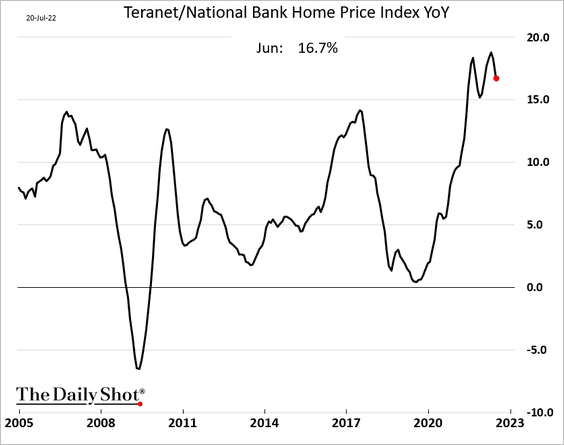
3. Home price appreciation appears to have peaked.
Here is a summary of Canada’s households and mortgages.
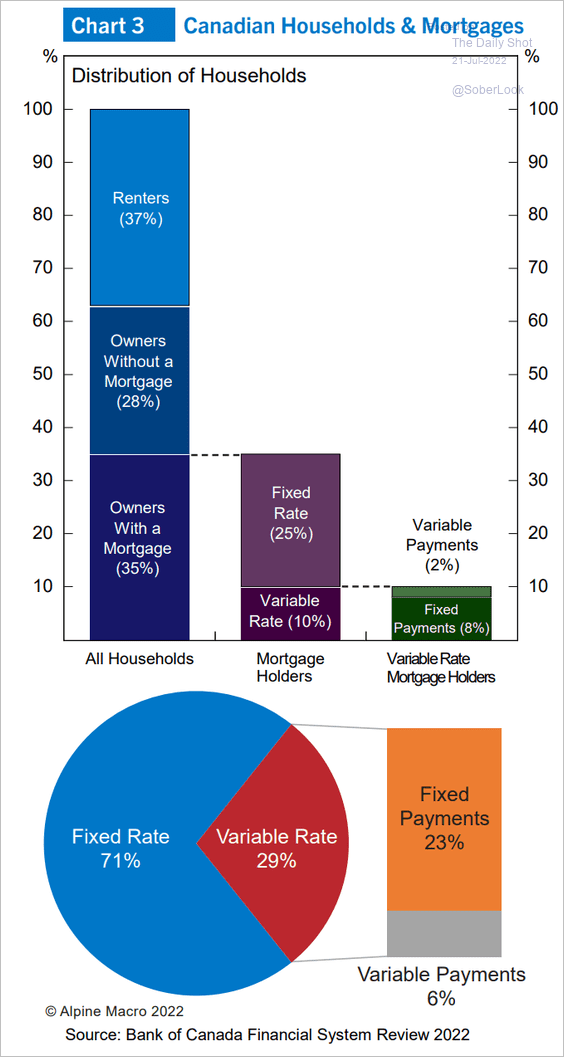 Source: Alpine Macro
——————–
4. According to credit/debit card data, consumer spending remains robust.
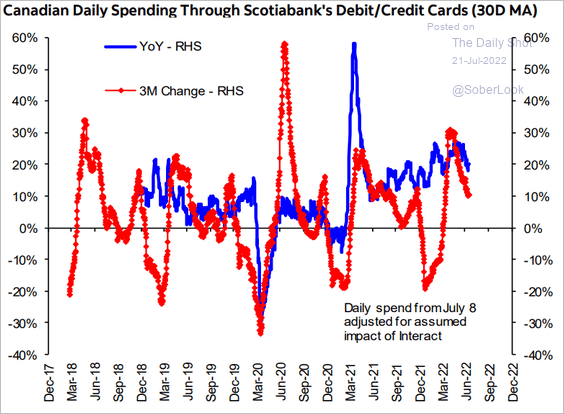 Source: Hugo Ste-Marie, Portfolio & Quantitative Strategy Global Equity Research, Scotia Capital
Back to Index
The United Kingdom
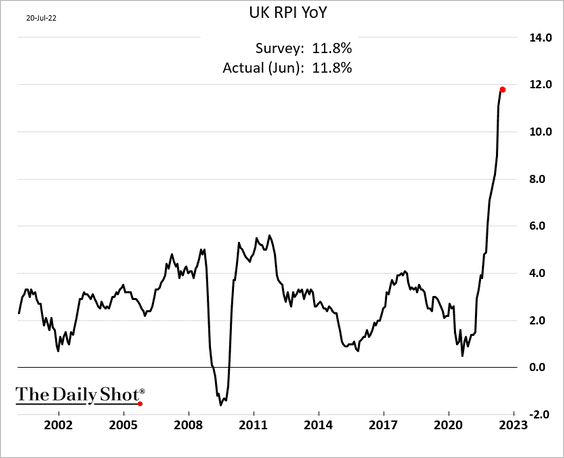
1. The headline inflation print was slightly above forecasts as prices continue to surge.
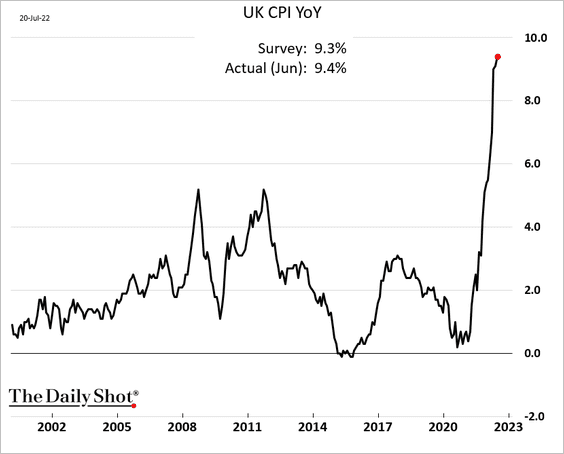
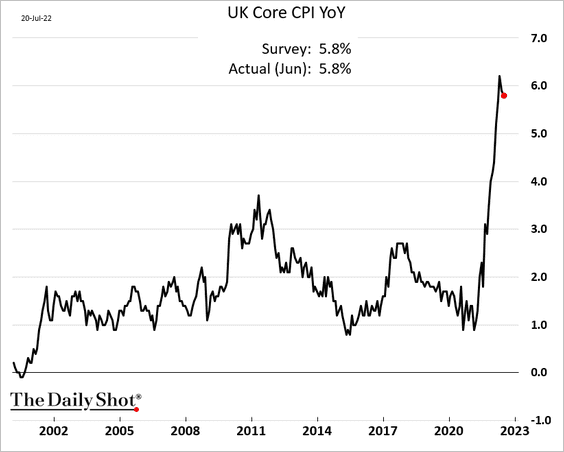
Below, we have some additional data from the CPI report.
• Core inflation:
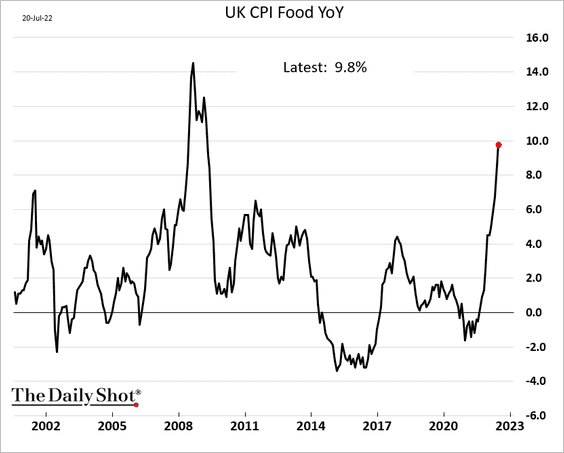
• Food:
• Transportation:
![]()
• Retail prices:
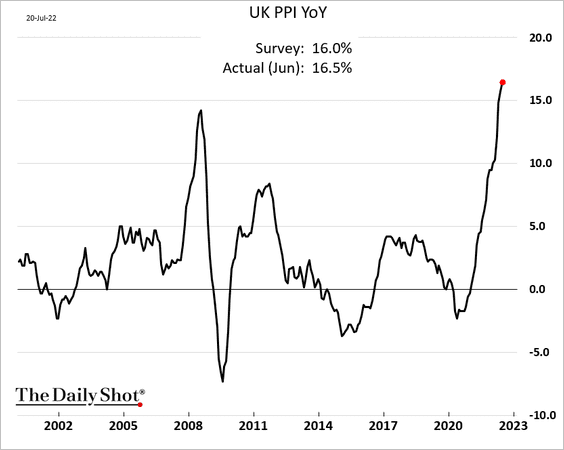
2. Producer prices are 16.5% above last year’s level.
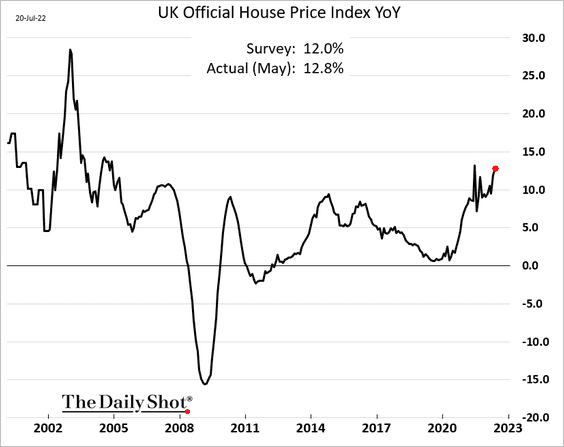
3. Home price appreciation held up well in May.
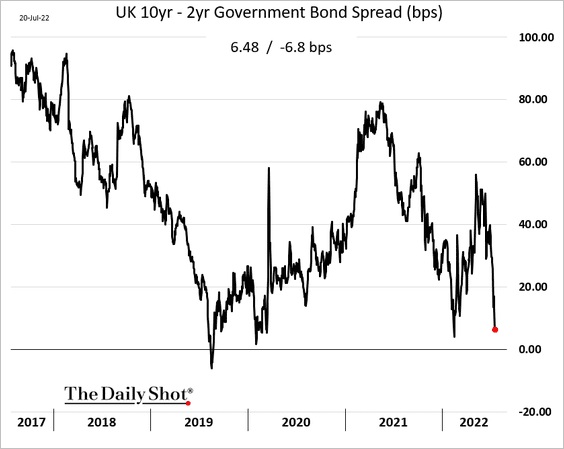
4. The yield curve is approaching inversion.
5. Liz Truss pulls ahead in the betting markets.
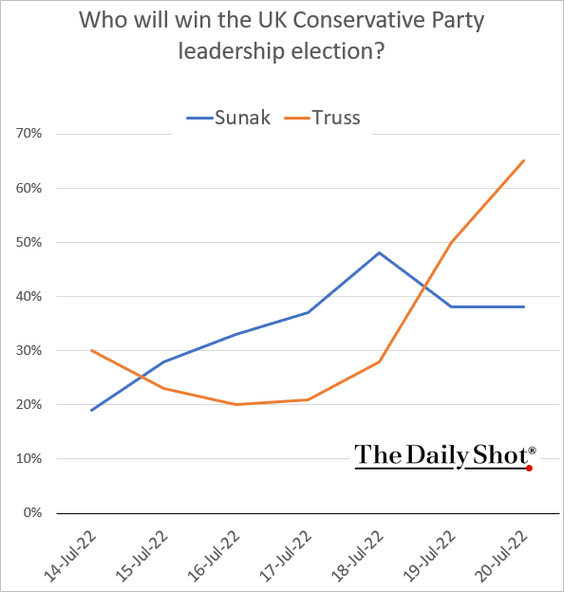 Source: @PredictIt
Back to Index
The Eurozone
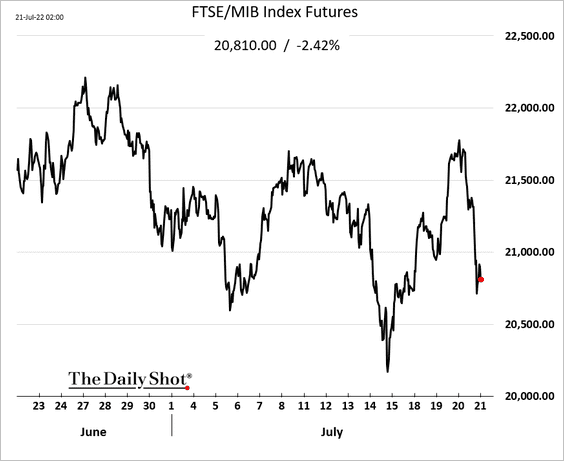
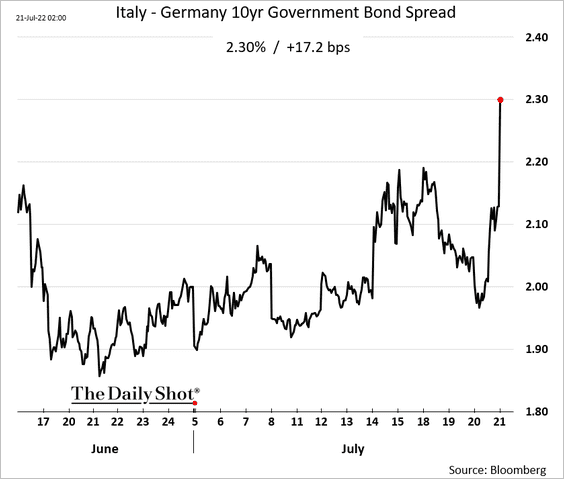
1. This is not a good outcome for Italy.
 Source: CNBC Read full article
The election will take place in the first week of October. Italian stocks and bonds took a hit.
The economy was already slowing, and this renewed political uncertainty will exacerbate the decline.
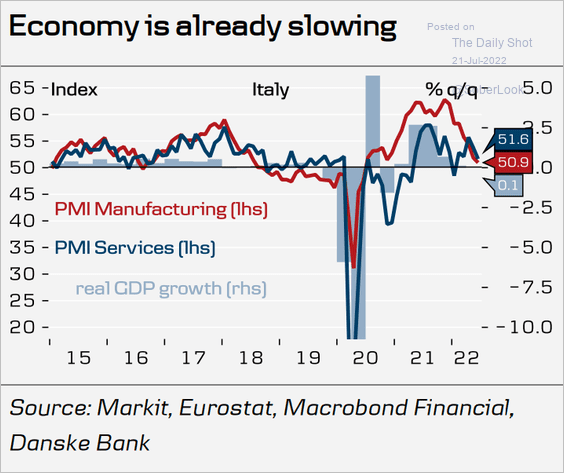 Source: Danske Bank
——————–
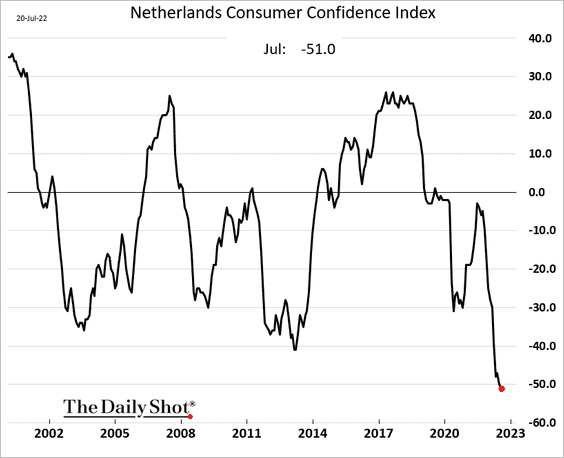
2. The Eurozone’s consumer confidence index hit a record low.
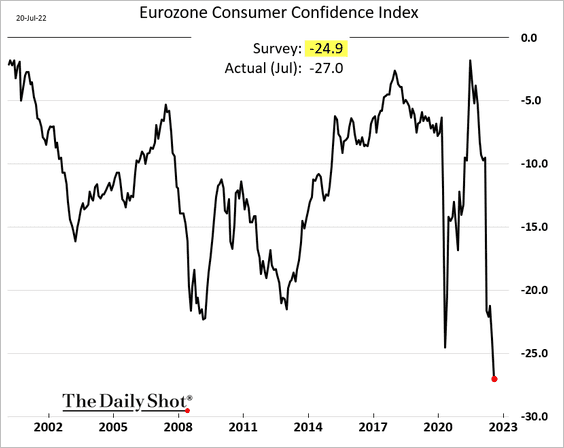
Here is the Netherlands.
——————–
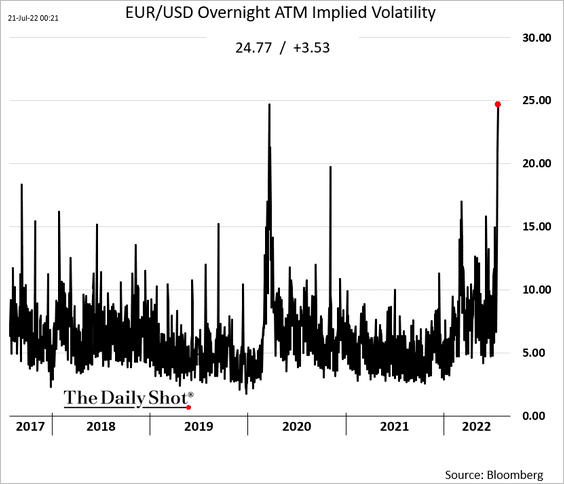
3. EUR/USD implied vol is at extreme levels ahead of the ECB.
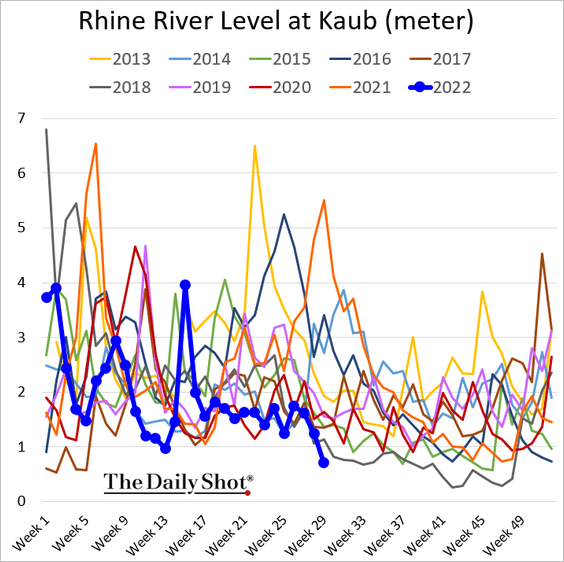
4. Germany’s logistics, particularly energy transport, is under further threat from falling water levels in the River Rhine.
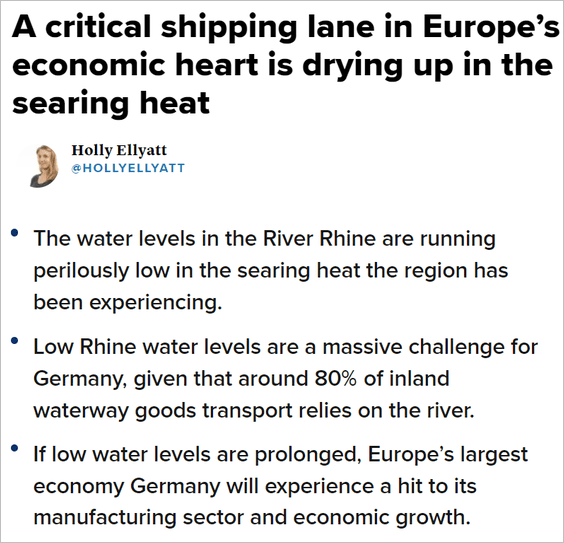 Source: CNBC Read full article
Back to Index
Asia – Pacific
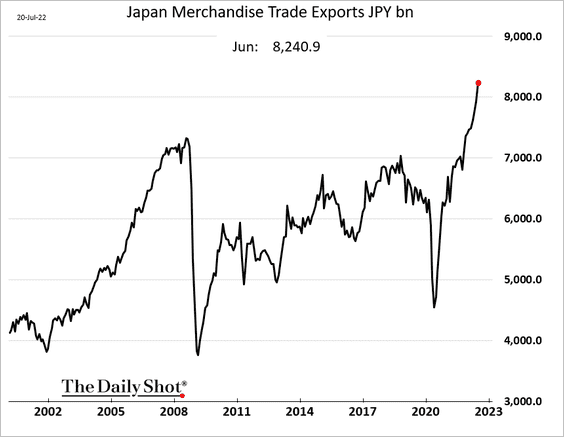
1. Japan’s June trade deficit was not as wide as expected …
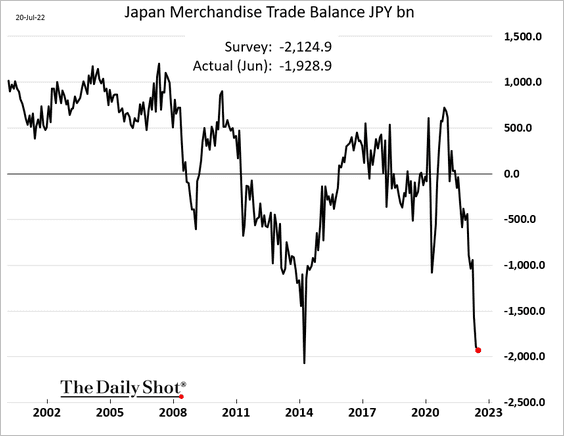
… on strong exports.
——————–
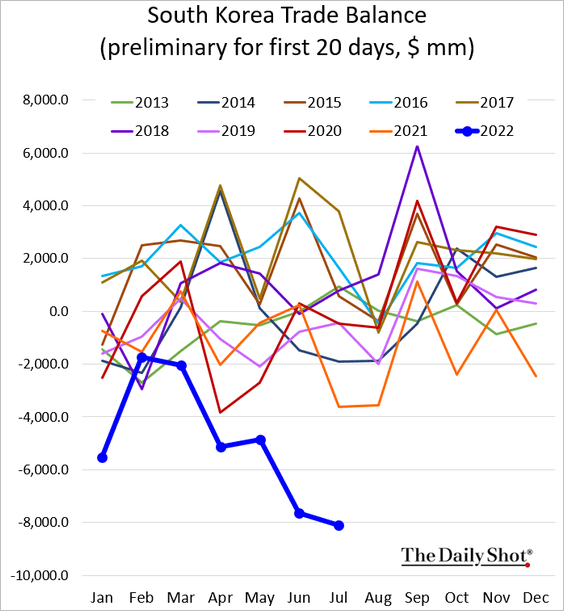
2. South Korea’s exports rebounded this month.
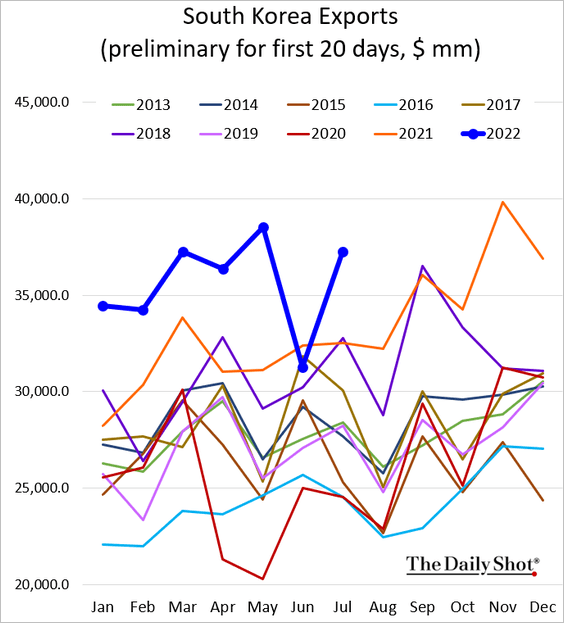
But the trade deficit hit a new record due to surging energy prices.
——————–
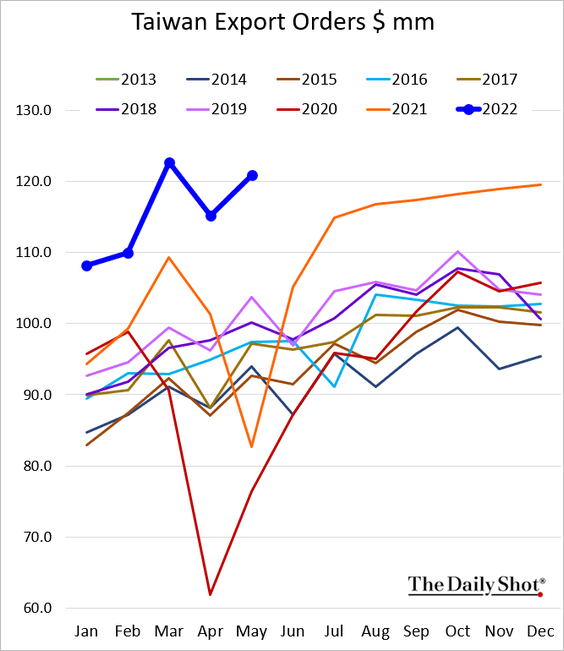
3. Taiwan’s export orders remain strong.
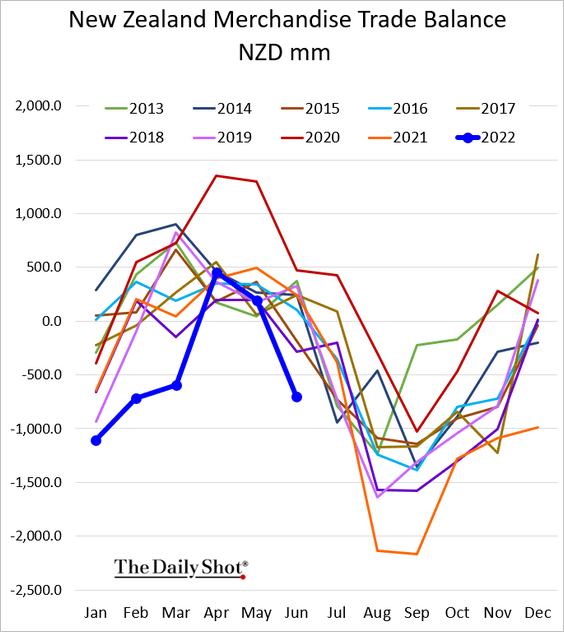
4. New Zealand’s trade deficit widened much more than usual for this time of the year due to energy prices.
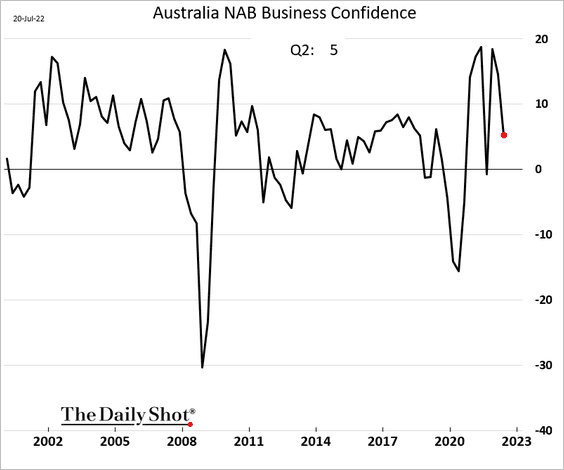
5. Australia’s business confidence declined last quarter.
Back to Index
China
1. Developer credit crisis continues to worsen.
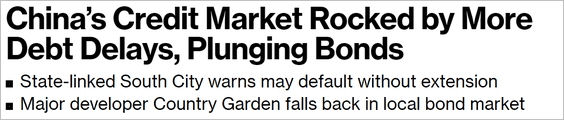 Source: @markets Read full article
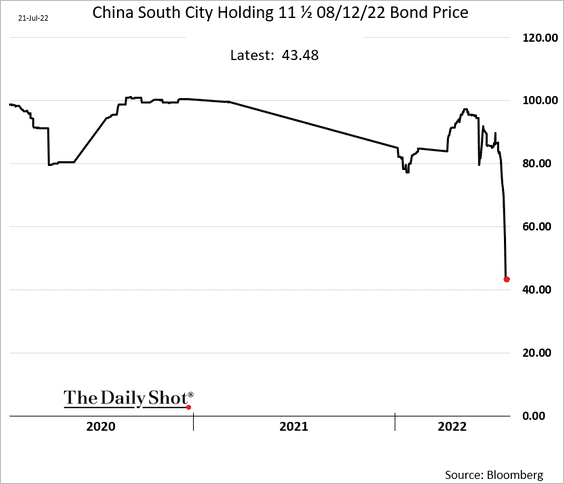
Here is the USD-denominated high-yield index.
——————–
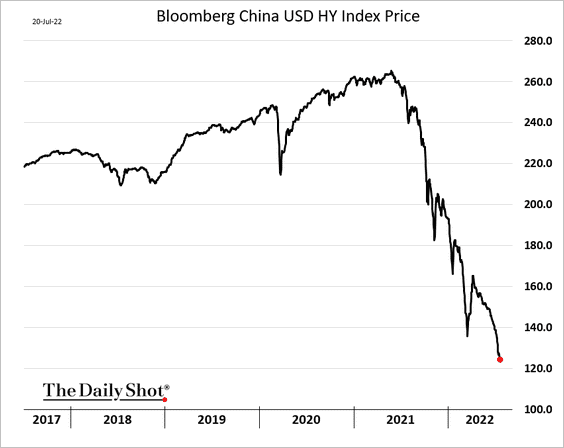
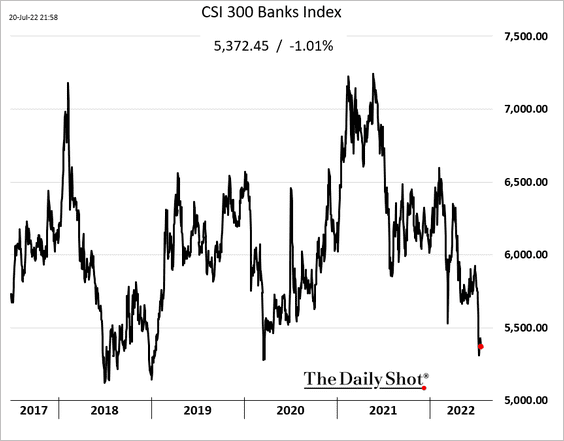
2. The stock market rebound has stalled.
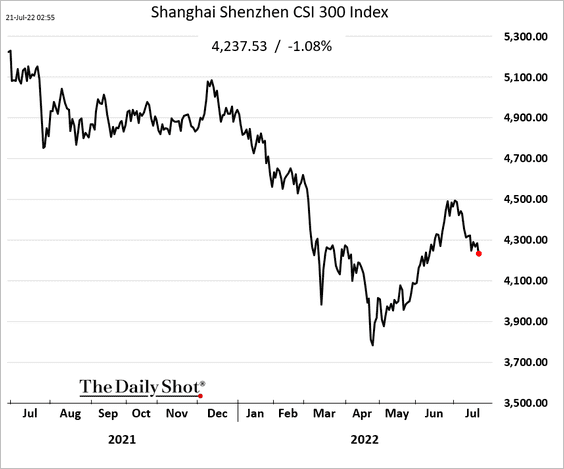
Bank shares remain under pressure.
——————–
3. Consumer confidence has been soft.
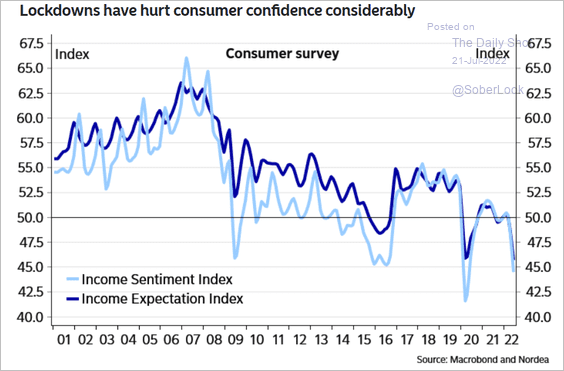 Source: Nordea Markets
4. China’s vaccination progress has slowed.
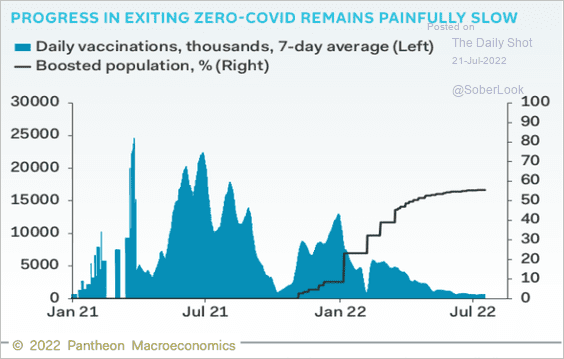 Source: Pantheon Macroeconomics
Back to Index
Emerging Markets
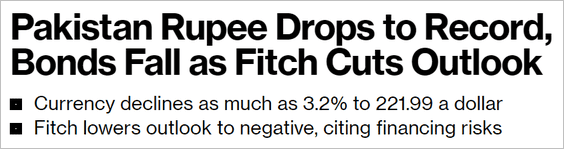
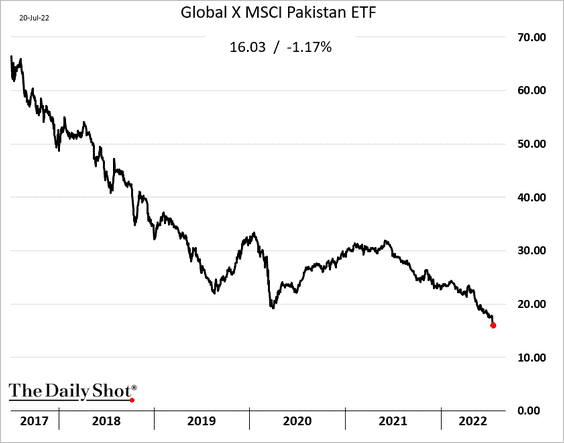
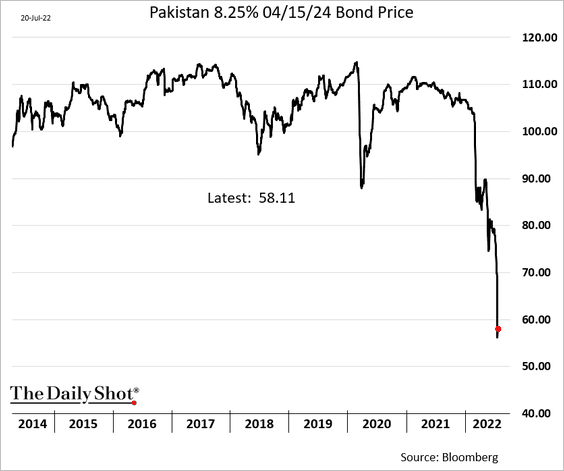
1. Investors continue to exit Pakistan’s assets.
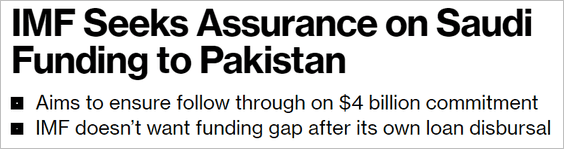 Source: Bloomberg Read full article
 Source: Bloomberg Read full article
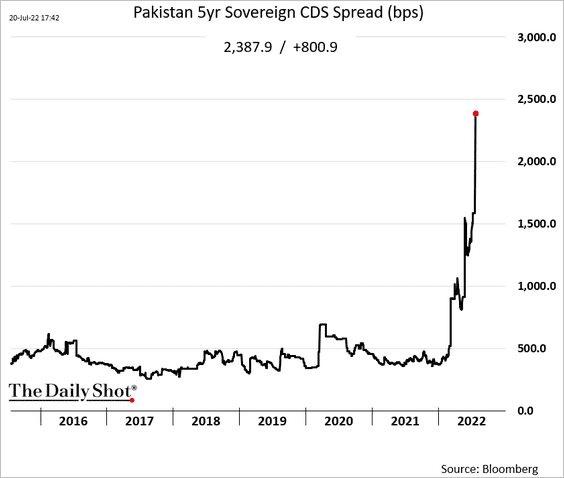
Here is the sovereign credit default swap spread.
——————–
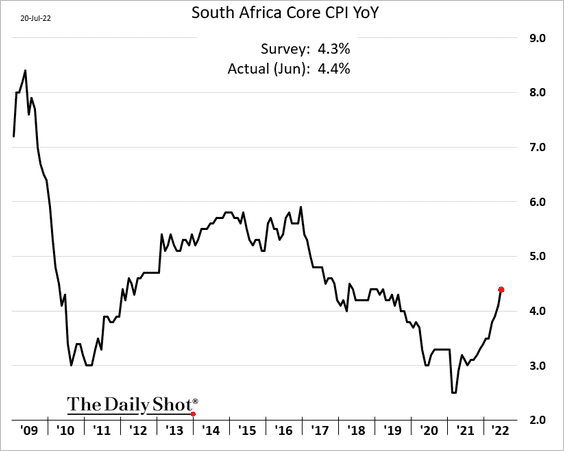
2. South Africa’s inflation is grinding higher.
3. Dollar-denominated bond spreads have widened significantly.
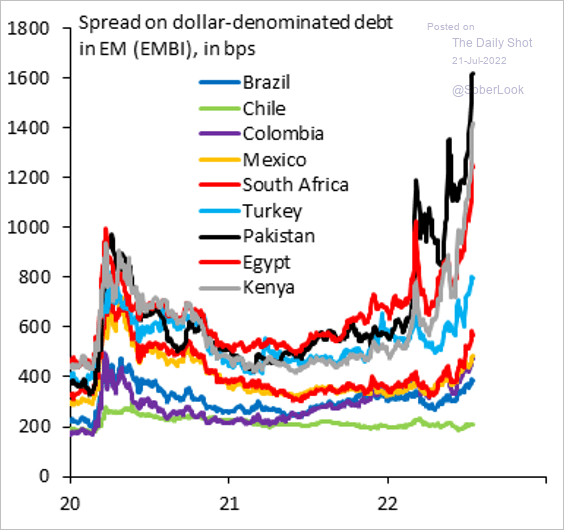 Source: @RobinBrooksIIF
4. Are Asian central banks behind the curve?
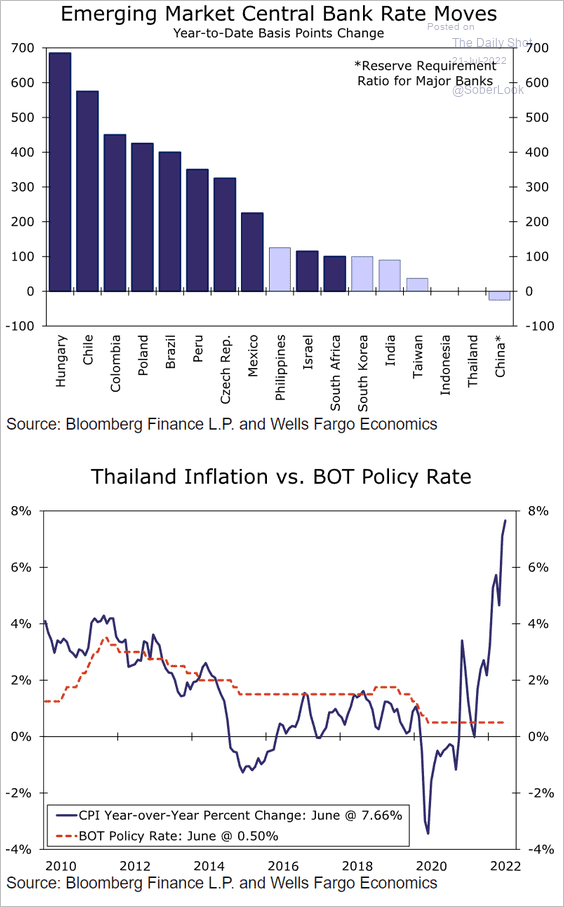 Source: Wells Fargo Securities
Back to Index
Cryptocurrency
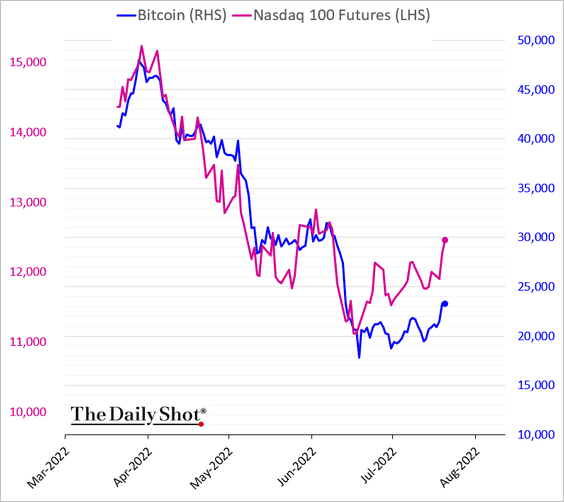
1. Bitcoin has been lagging the bounce in tech stocks.
2. Crypto market cap is back above $1 trillion.
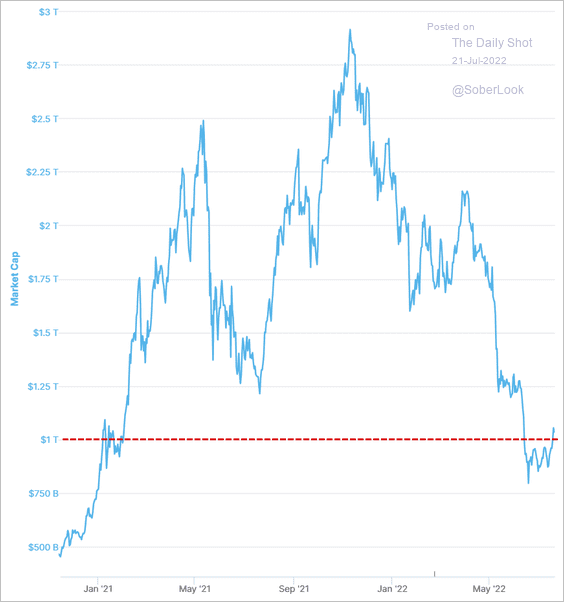 Source: CoinMarketCap
3. This chart shows major cryptoassets by the percentage of total market capitalization.
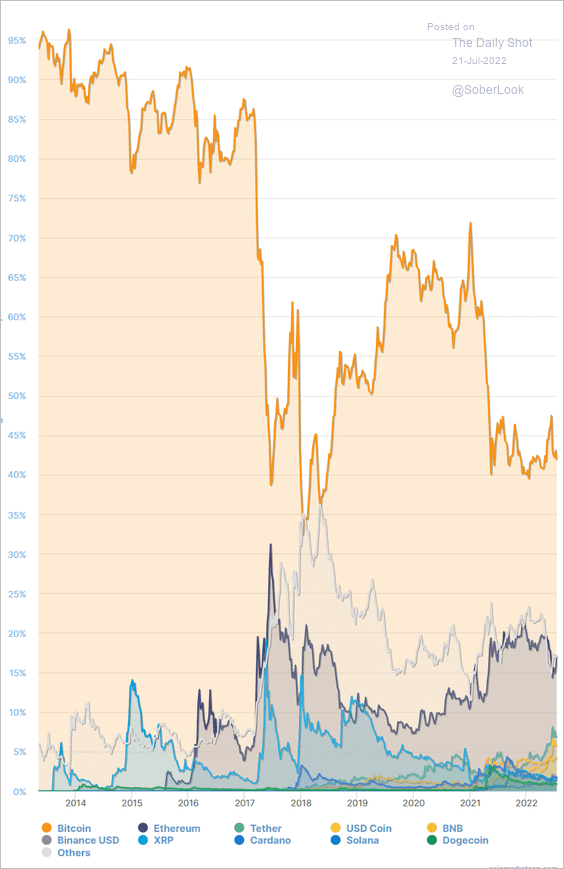 Source: CoinMarketCap
Back to Index
Energy
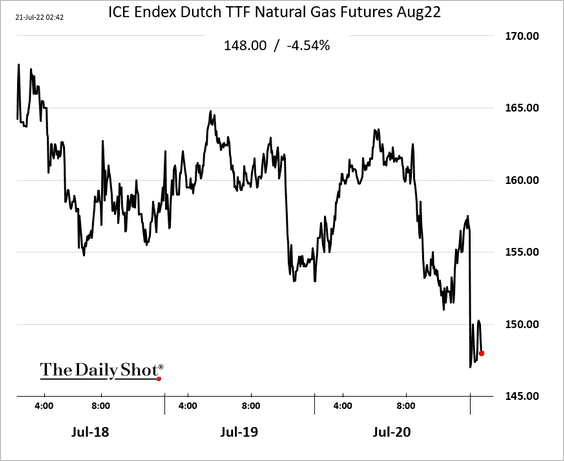
1. Russia resumed Nord Stream gas flows.
 Source: @WSJ Read full article
European natural gas prices are lower.
——————–
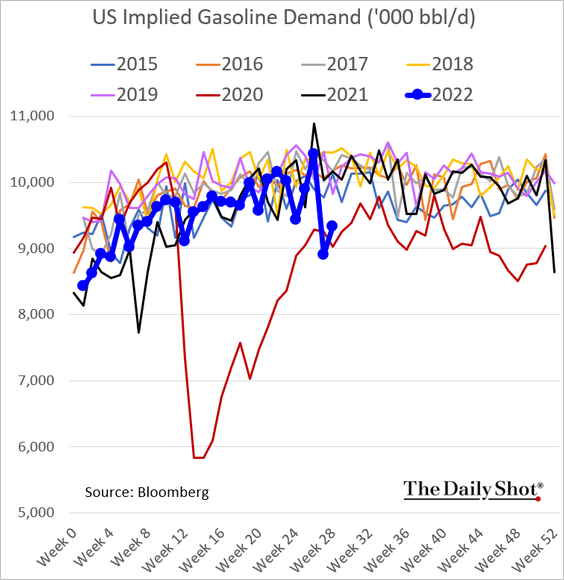
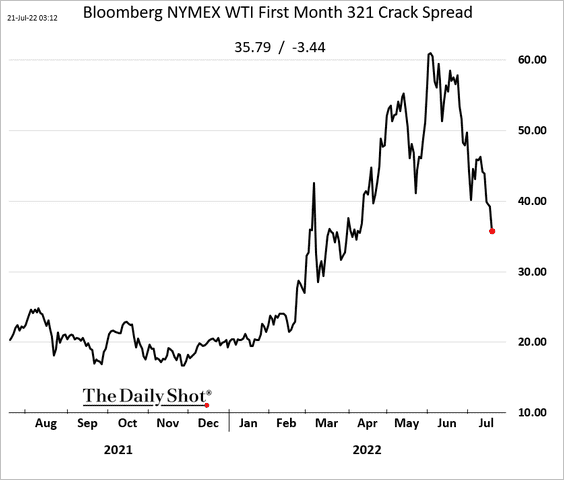
2. Us gasoline demand remains depressed (barely above 2020 levels) as drivers balk at high prices.
A recessionary signal?
• Crack spreads are falling due to weak demand.
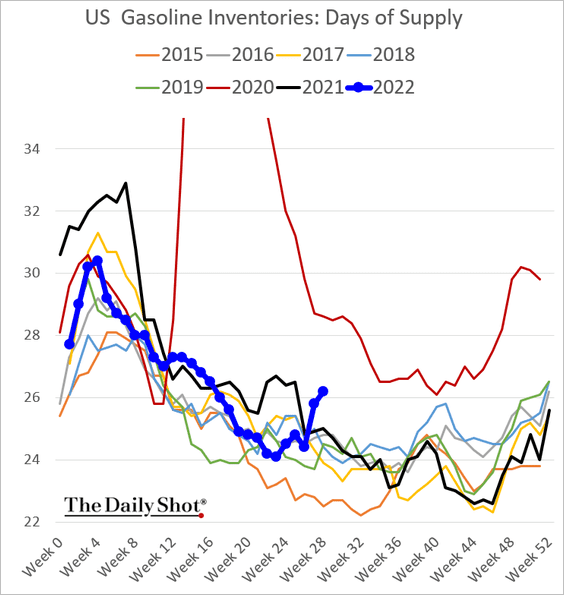
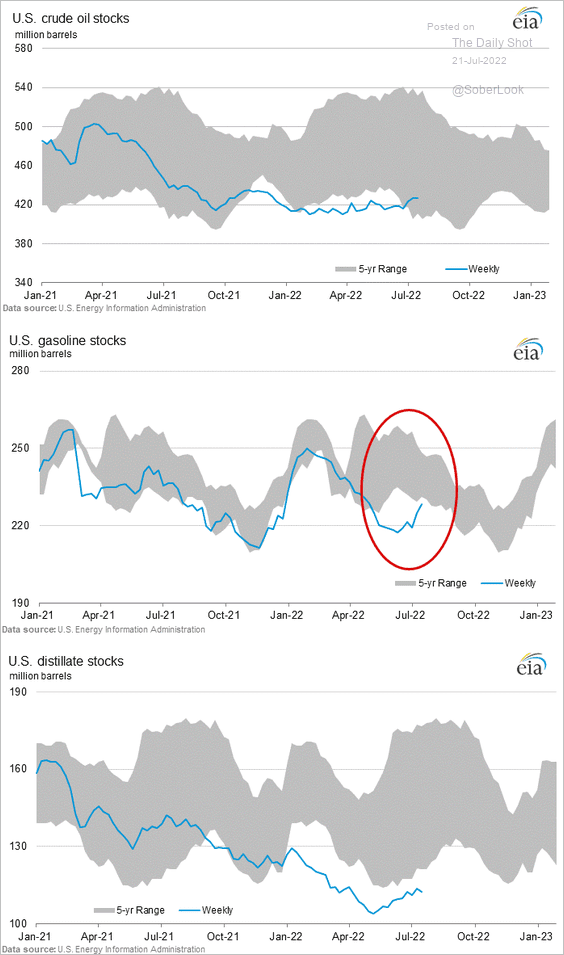
• Gasoline inventories are climbing.
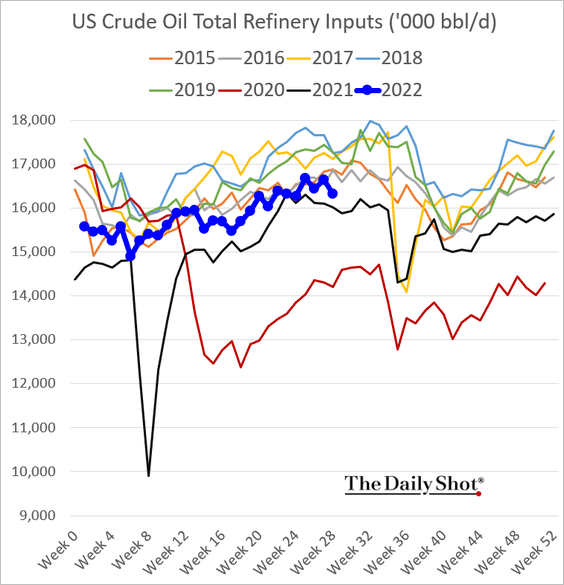
• US refinery runs softened last week.
——————–
3 Saudi oil production is near maximum levels.
 Source: @JavierBlas, @opinion Read full article
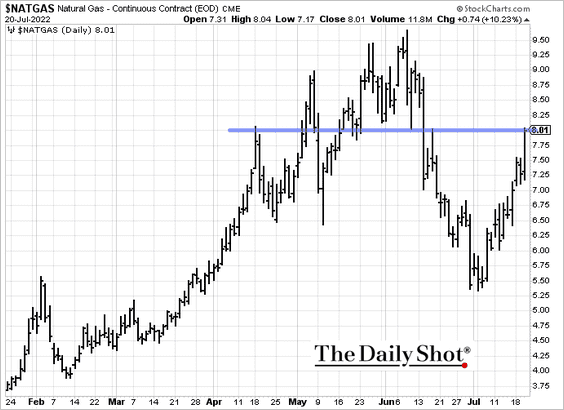
4. US natural gas is testing resistance at $8/mmbtu amid a sweltering heat wave.
Back to Index
Equities
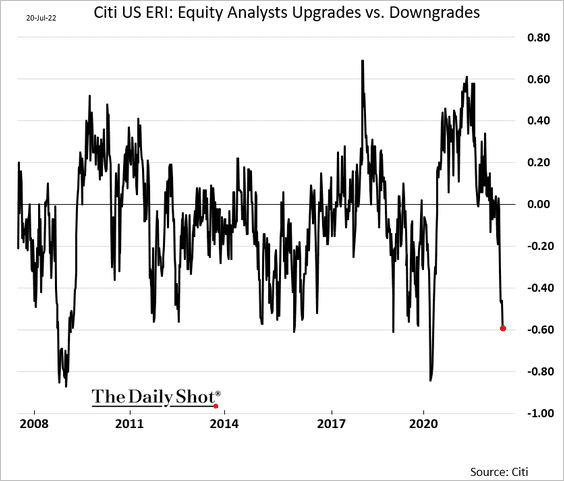
1. US corporate earnings downgrades have accelerated.
2. The rebound over the past couple of days has been very broad (2 charts).
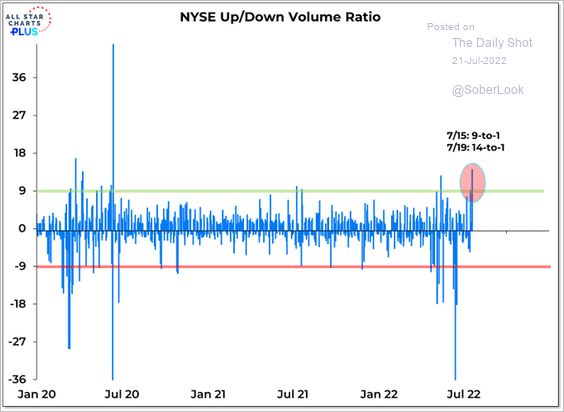 Source: @WillieDelwiche
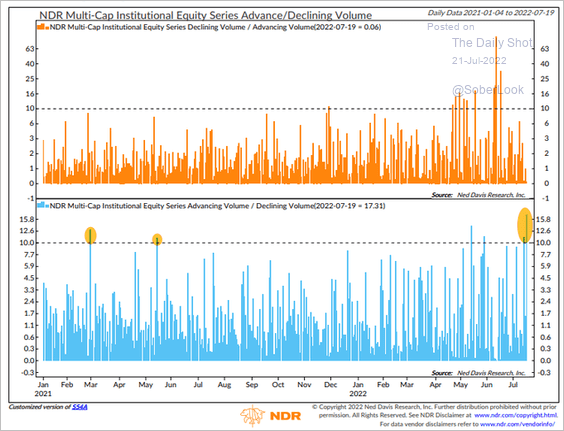 Source: @edclissold, @ndr_research
——————–
3. There is a great deal of short-covering taking place.
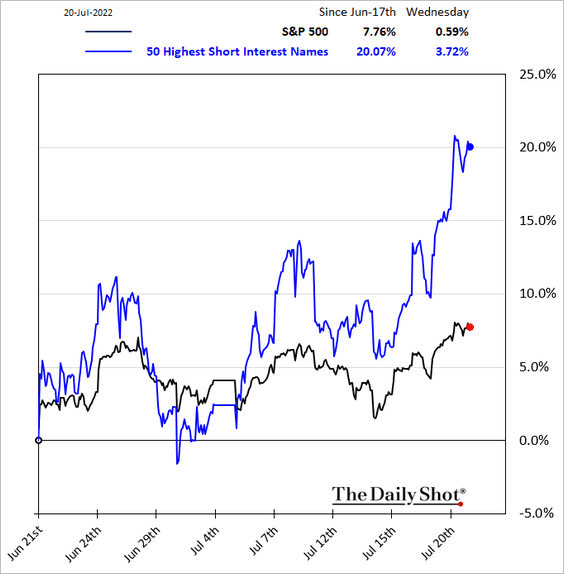
Here is equity short interest by sector.
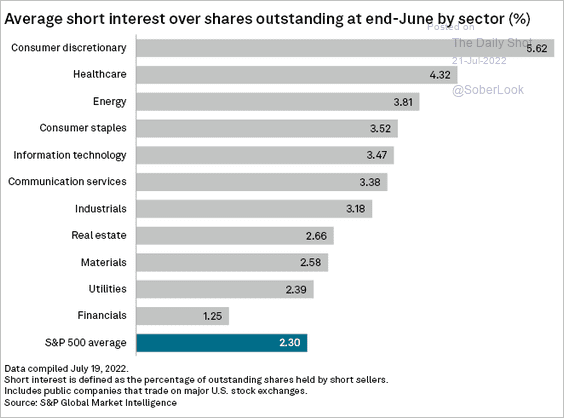 Source: S&P Global Market Intelligence
——————–
4. Retail buying has been tepid.
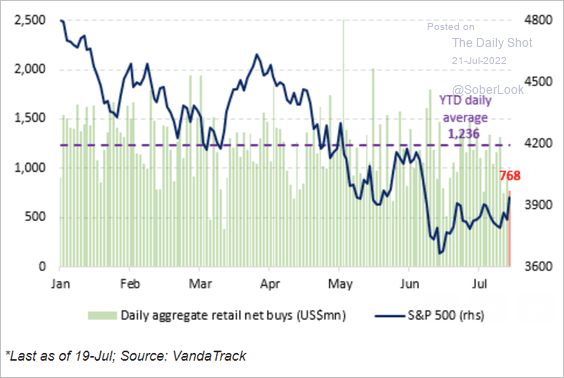 Source: Vanda Research
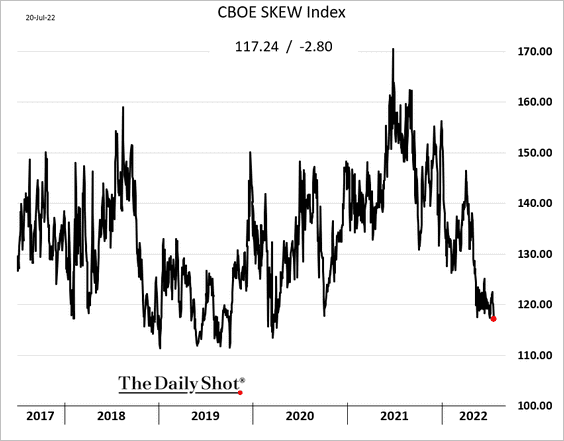
5. Demand for out-of-the-money put options (downside protection) keeps trending lower.
6. Bets on AdvisorShares Pure US Cannabis ETF surged as investors bet on federal legalization.
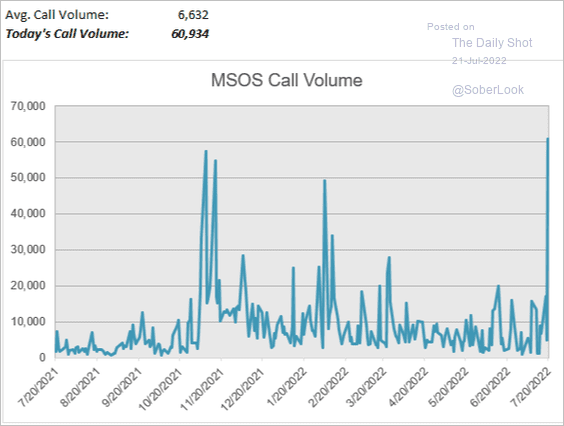 Source: @danny_kirsch
7. Margin debt is highly correlated with the broad stock market performance.
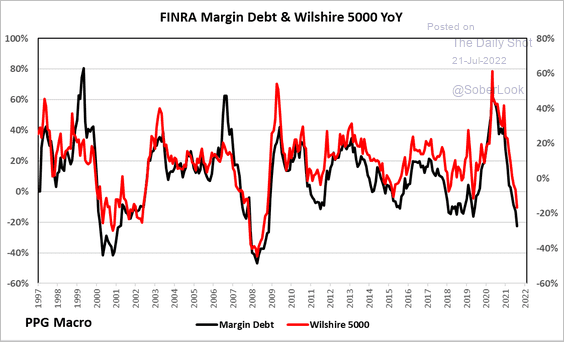 Source: @ppgmacro
8. Finally, we have S&P 500 sector composition over time.
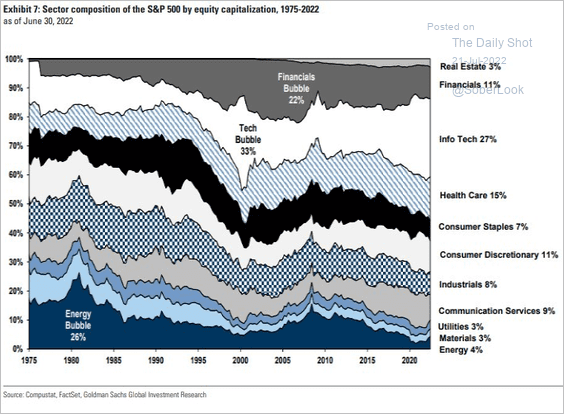 Source: Goldman Sachs
Back to Index
Credit
1. Bank losses on hung debt mount.
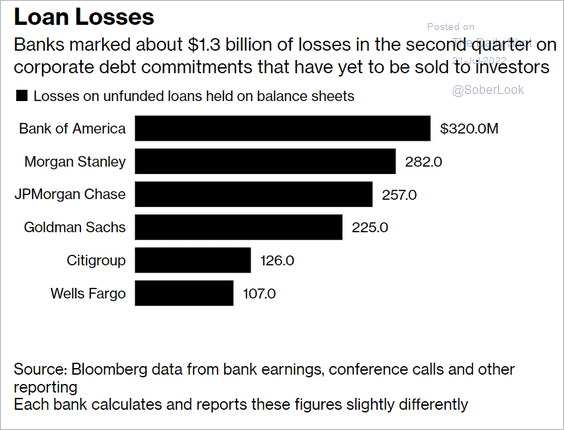 Source: Bloomberg Read full article
2. A majority of fixed income assets now yield 4% or more for the first time in a decade.
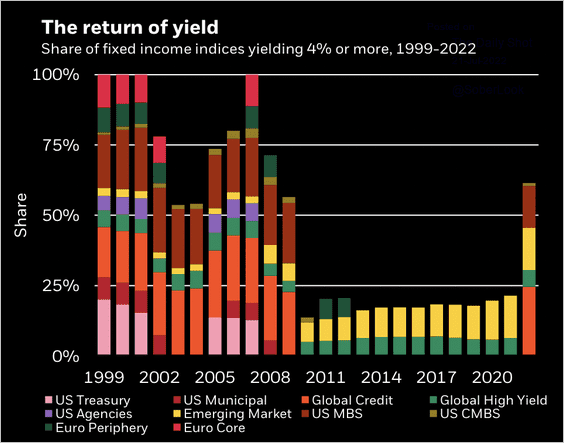 Source: BlackRock Investment Institute
3. The spread on the aggregate US investment-grade index has risen above its long-term average.
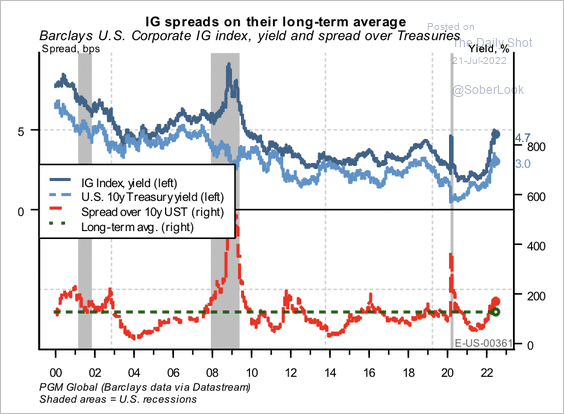 Source: PGM Global
Investors now see more yield per unit of duration risk than before the pandemic.
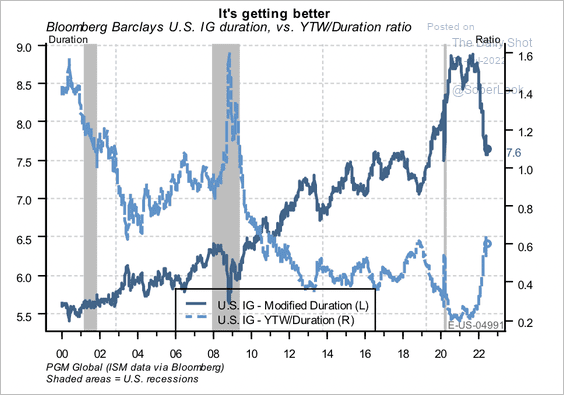 Source: PGM Global
Back to Index
Global Developments
1. Equity positioning is near extreme bearish levels.
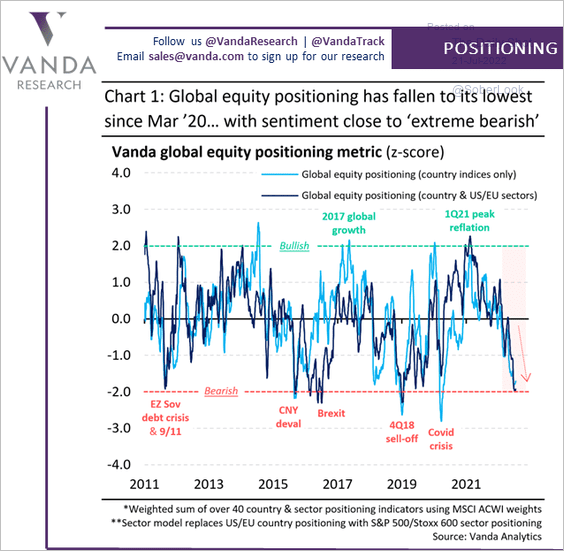 Source: @vandaresearch
2. Fund managers see long US dollar positions as the most crowded trade.
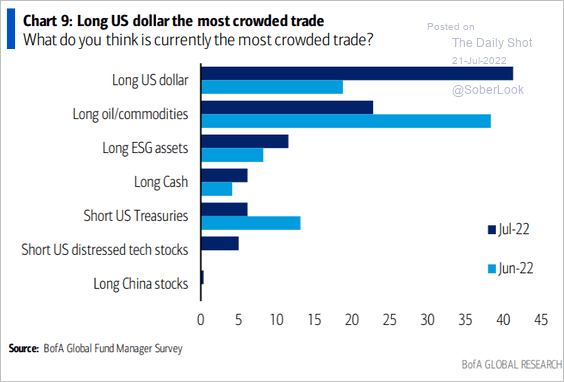 Source: BofA Global Research
3. Long-run Fed rate trajectory expectations tend to lead the US dollar.
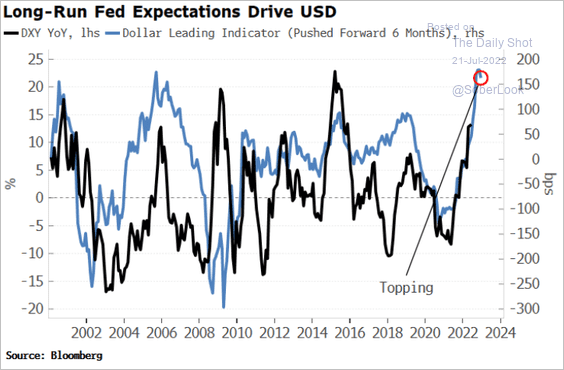 Source: Simon White, Bloomberg Markets Live Blog
4. How do different asset classes perform during periods of stagflation?
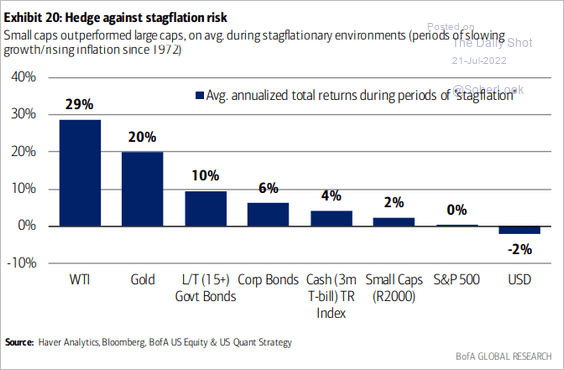 Source: BofA Global Research
——————–
Food for Thought
1. Ten largest employers in the S&P 500:
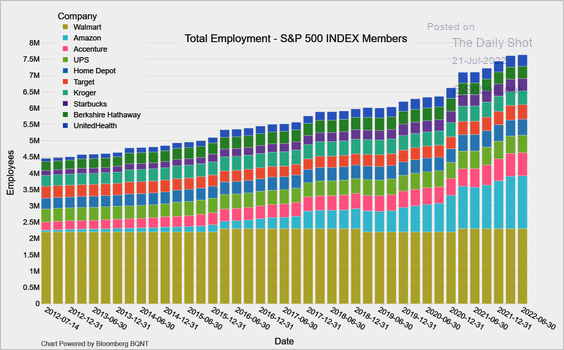 Source: @M_McDonough
• Tech mega-cap employment trends:
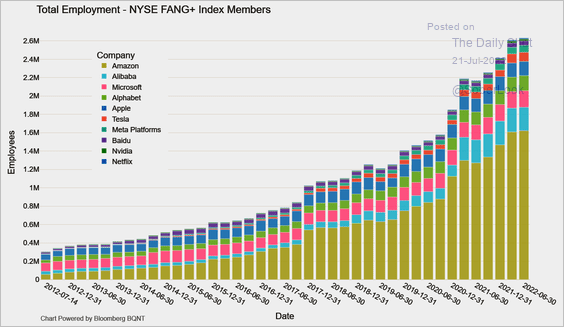 Source: @M_McDonough
——————–
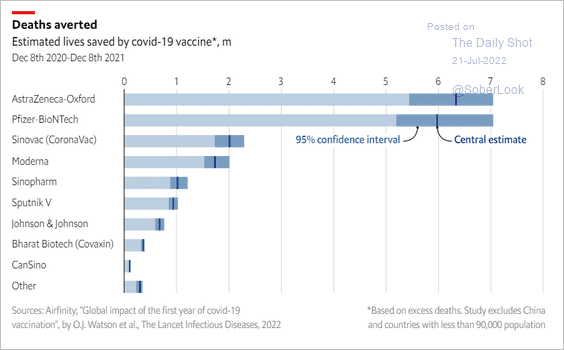
2. Lives saved with COVID vaccines:
 Source: The Economist Read full article
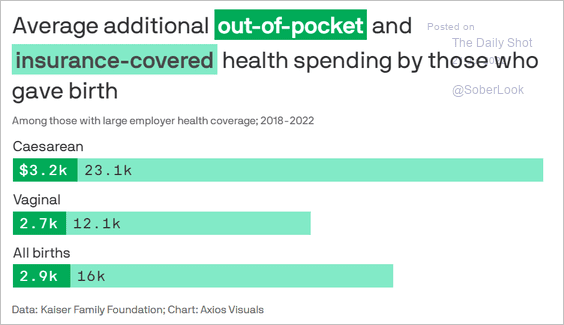
3. The costs of having a baby:
 Source: @axios Read full article
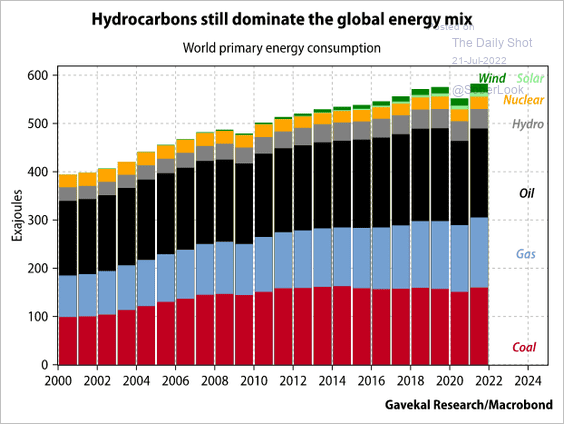
4. The global energy mix:
 Source: Gavekal Research
5. Party support across demographic groups in the US:
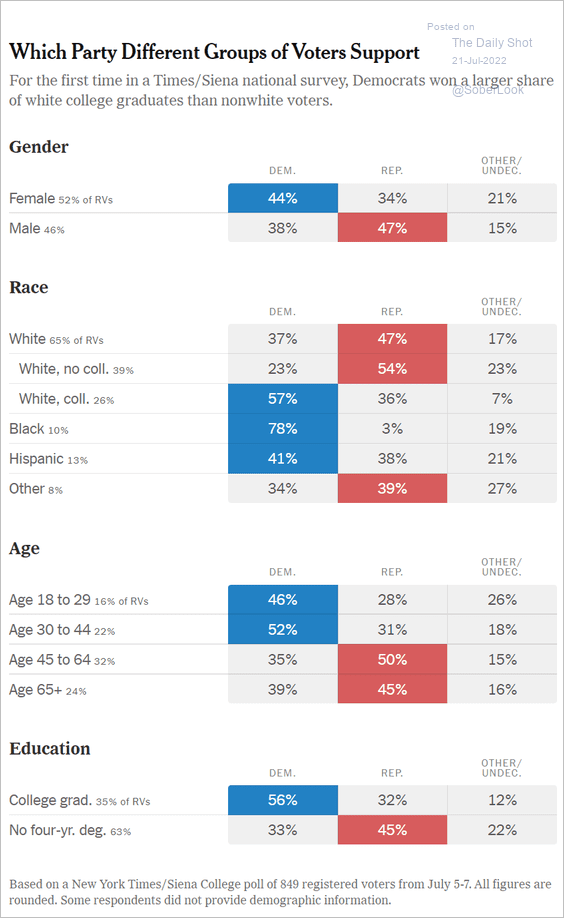 Source: The New York Times Read full article
6. Productivity of the United States Congress:
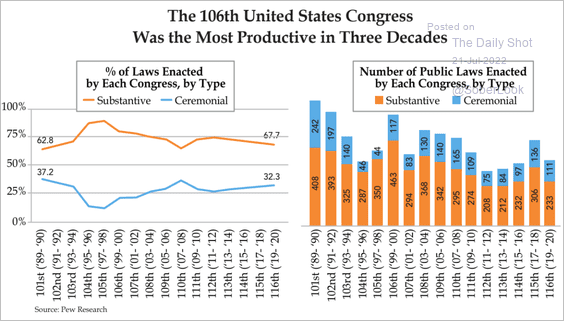 Source: Quill Intelligence
7. Number of emojis over time:
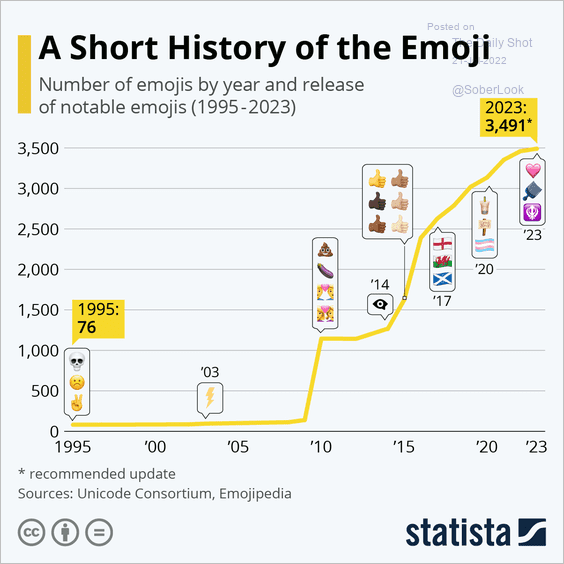 Source: Statista
——————–
Back to Index