
The Daily Shot: 13-Sep-22
• The United States
• Canada
• The United Kingdom
• The Eurozone
• Europe
• Japan
• Asia – Pacific
• China
• Emerging Markets
• Cryptocurrency
• Commodities
• Energy
• Equities
• Credit
• Rates
• Global Developments
• Food for Thought
The United States
1. Once again, let’s begin with some updates on inflation.
• Consumer inflation expectations continue to moderate …
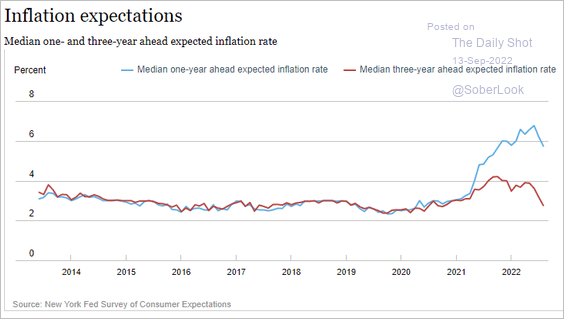 Source: Federal Reserve Bank of New York
 Source: Reuters Read full article
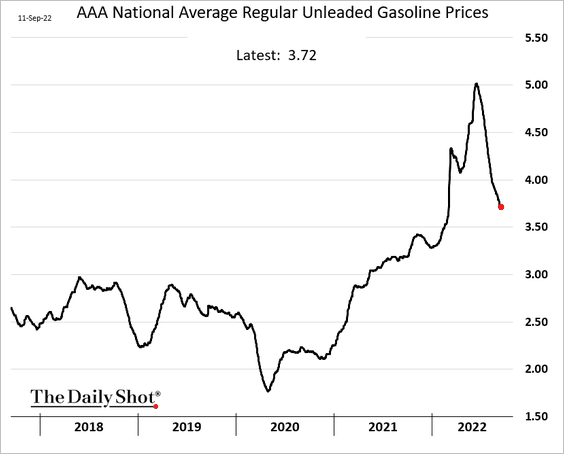
… as gasoline prices fall.
This chart shows households’ price change expectations for select items.
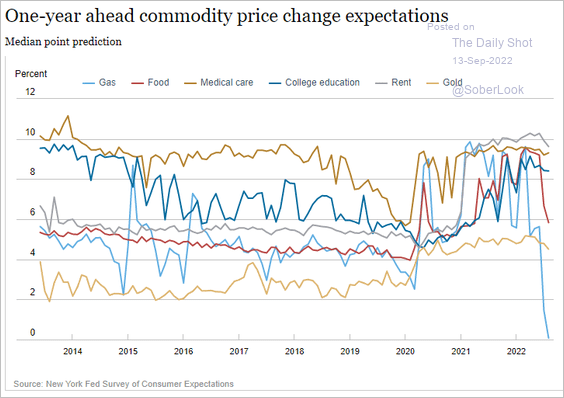 Source: Federal Reserve Bank of New York
• The ISM PMI indicators (business surveys) point to easing inflationary pressures.
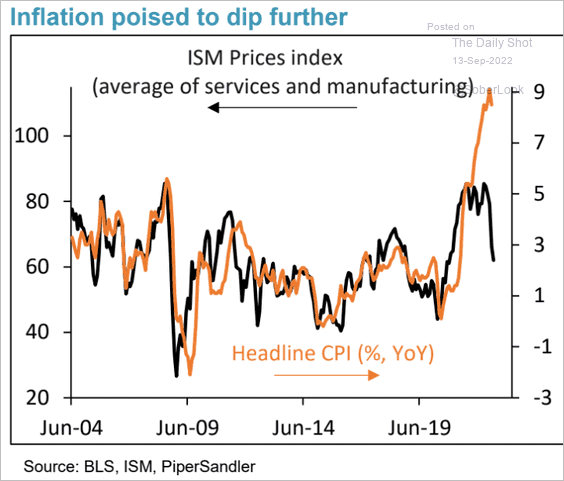 Source: Piper Sandler
• Retailers’ pricing power is waning, according to a survey from Evercore ISI.
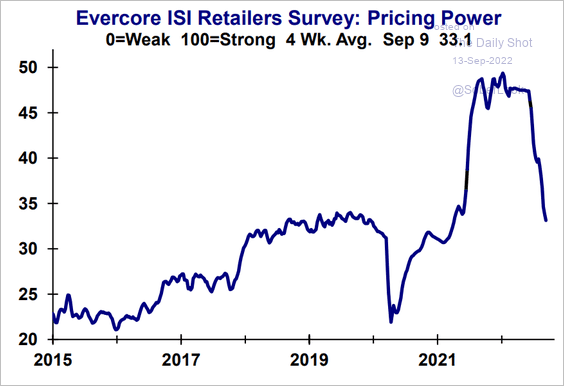 Source: Evercore ISI Research
• Food inflation climbed further in August, according to YipitData.
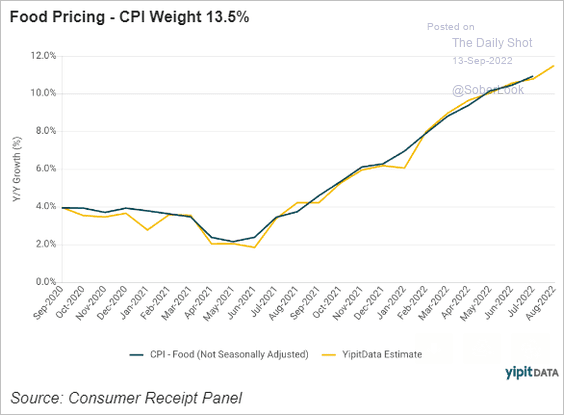 Source: YipitData
• The Cleveland Fed’s nowcast index shows elevated core inflation in August (similar to the estimates from Nomura).
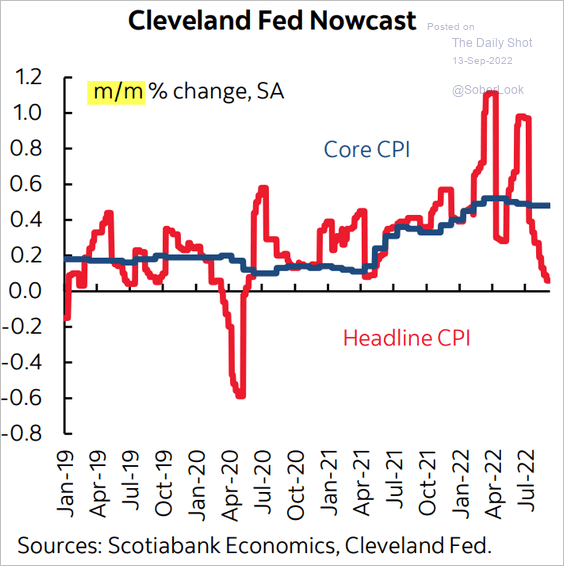 Source: Scotiabank Economics
——————–
2. Credit card spending picked up in August, according to BofA.
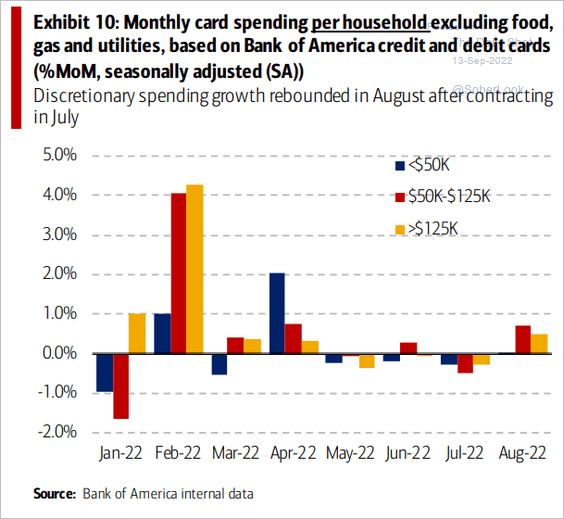 Source: The Bank of America Institute
• Credit card debt as a share of disposable income remains below pre-COVID levels.
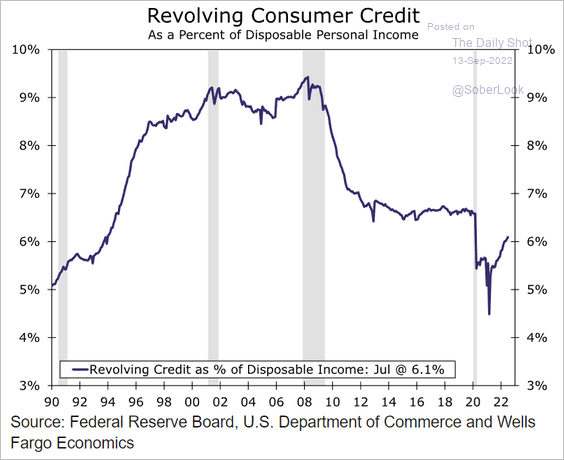 Source: Wells Fargo Securities
• Households expect tighter credit conditions ahead.
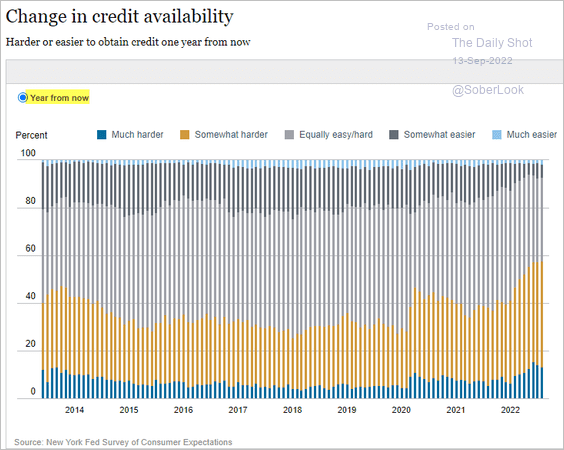 Source: Federal Reserve Bank of New York
——————–
3. Real household income growth should return to positive territory by early next year, according to Goldman.
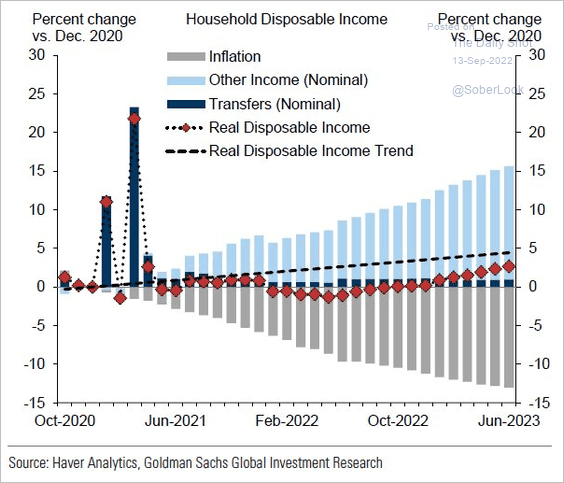 Source: Goldman Sachs; @tracyalloway
Households’ excess deposits remain elevated.
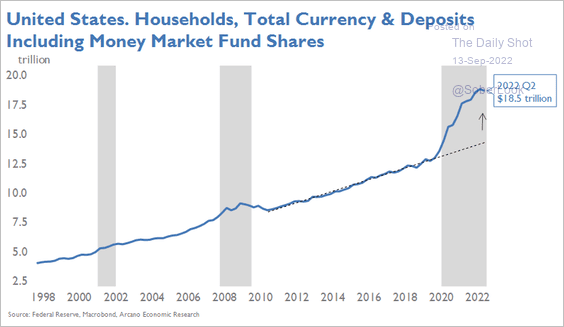 Source: Arcano Partners
——————–
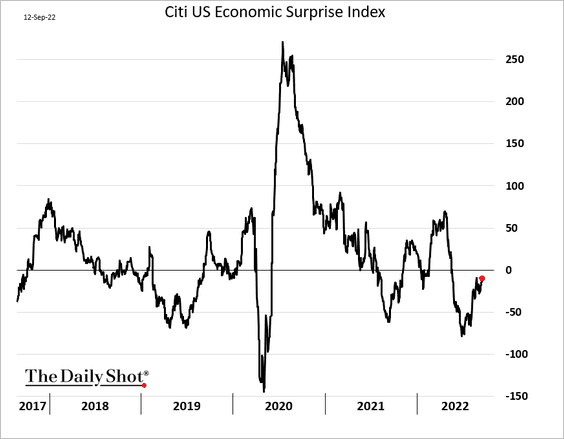
4. The Citi Economic Surprise Index is rebounding.
5. What could make the Fed “pivot” on rate hikes? (based on BofA’s survey of fund managers)
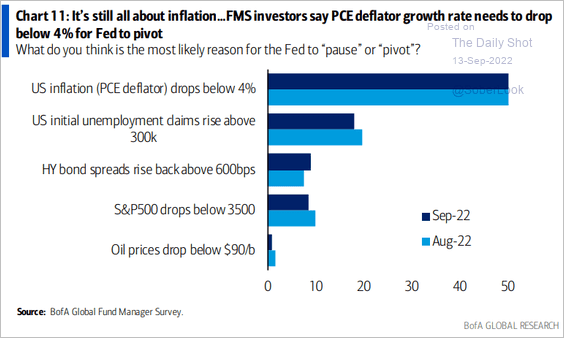 Source: BofA Global Research
Back to Index
Canada
1. Canadians are spending on experiences this year.
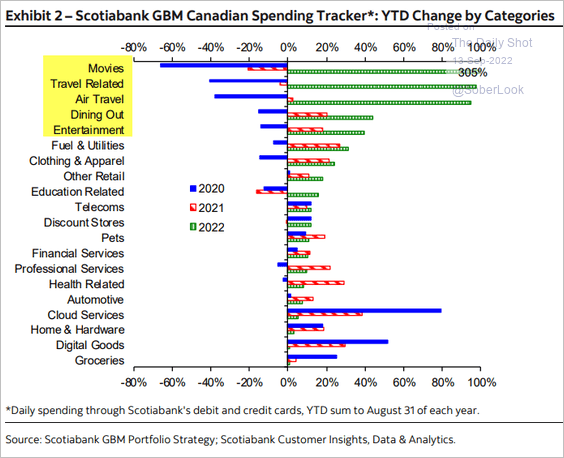 Source: Hugo Ste-Marie, Portfolio & Quantitative Strategy Global Equity Research, Scotia Capital
2. Housing affordability continues to worsen.
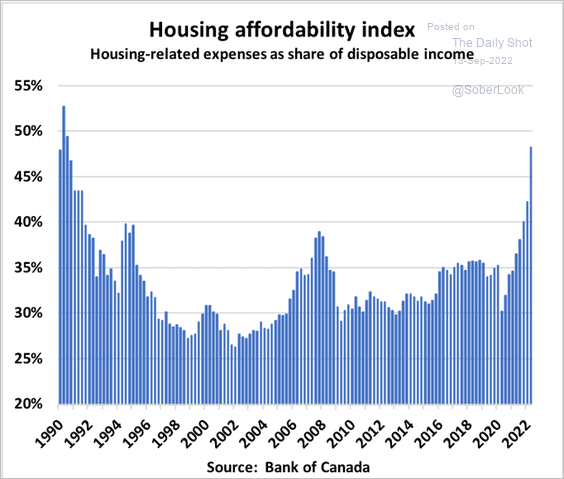 Source: @BenRabidoux
3. Canadians’ savings rate has been moderating.
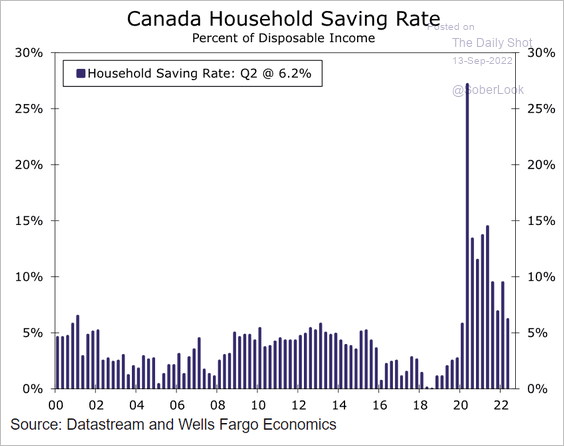 Source: Wells Fargo Securities
Back to Index
The United Kingdom
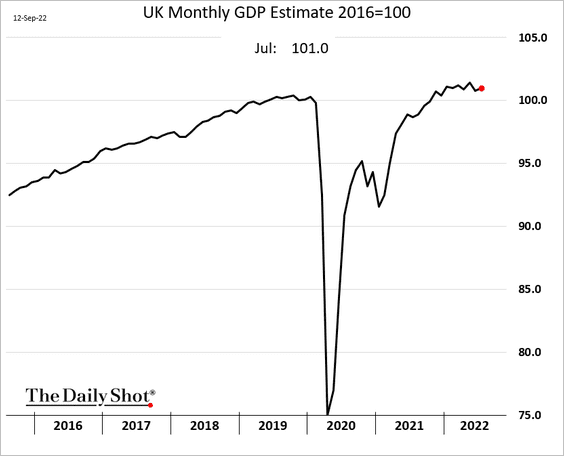
1. The GDP edged higher in July, but the gain was smaller than expected.
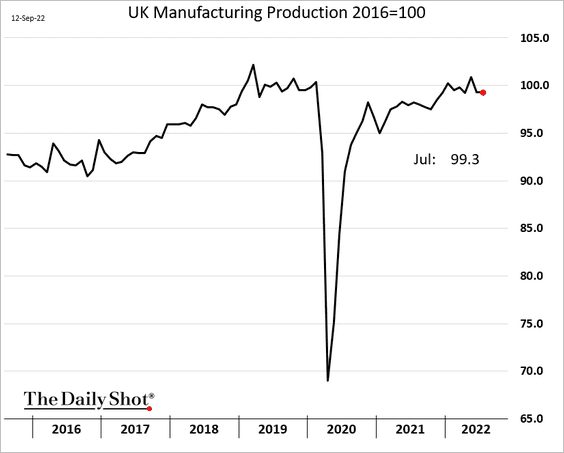
• Manufacturing production was unchanged.
• Services output improved.
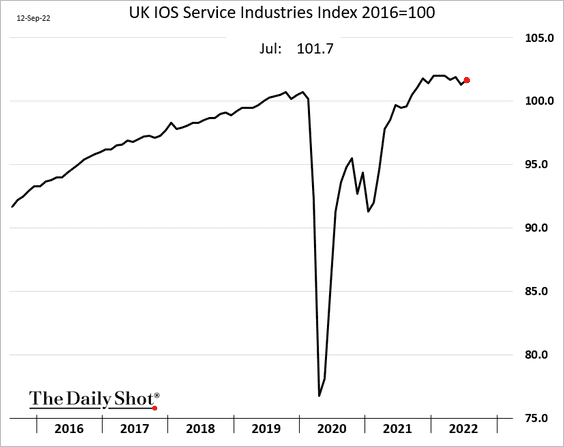
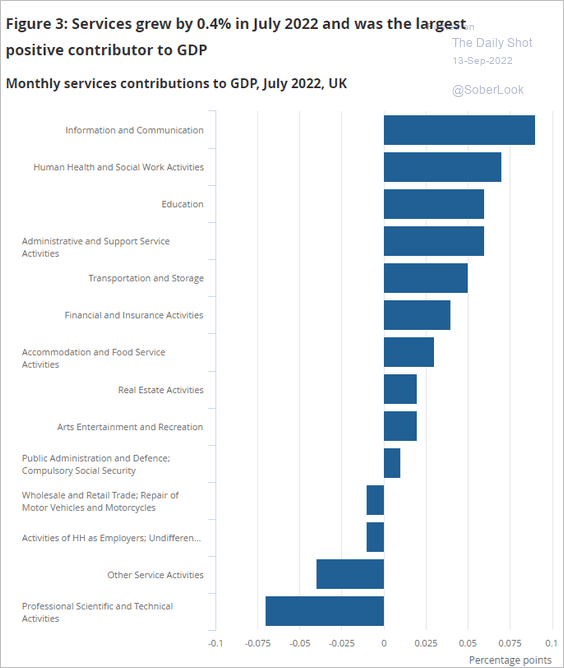 Source: ONS Read full article
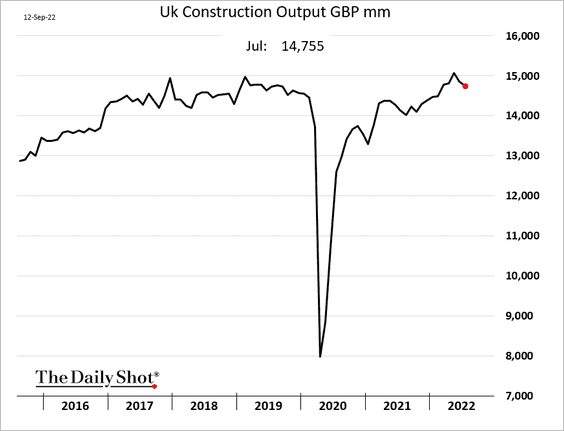
• Construction output continues to soften.
——————–
2. The trade balance will remain under pressure due to high natural gas costs.
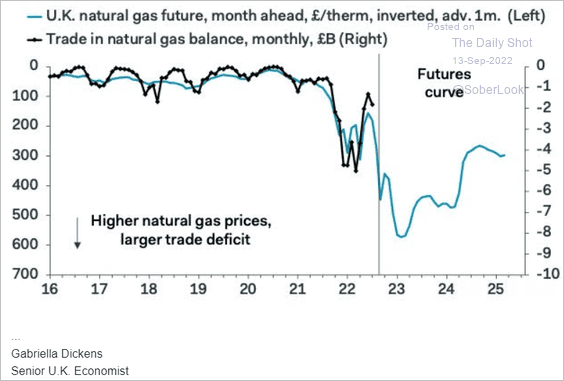 Source: Pantheon Macroeconomics
3. UK CPI has been outpacing other advanced economies.
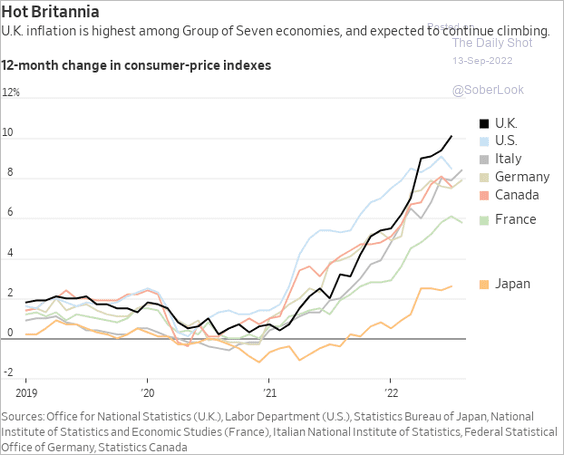 Source: @WSJ Read full article
4. UK homes are not very energy-efficient.
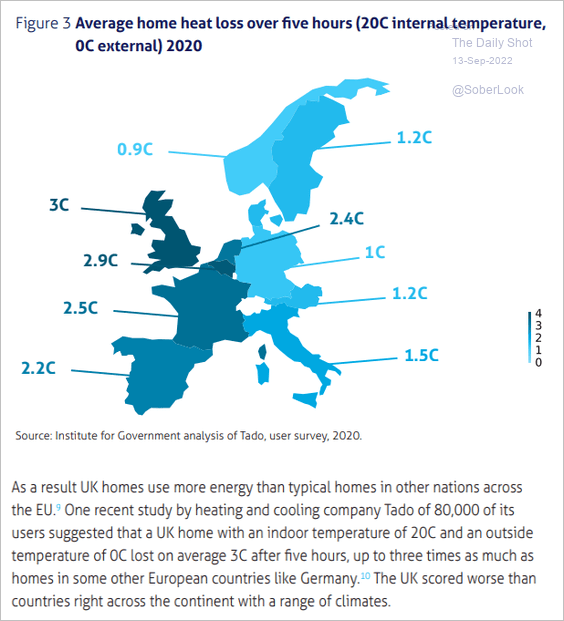 Source: Institute for Government Read full article
Back to Index
The Eurozone
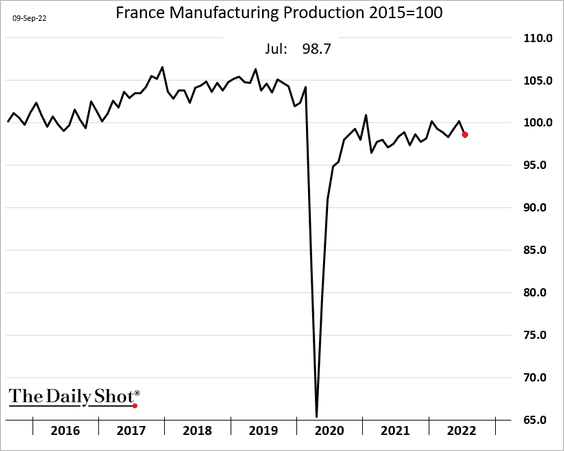
1. French manufacturing production declined in July, …
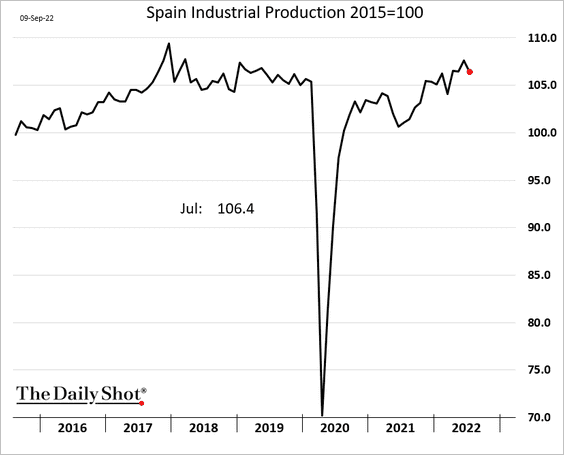
.. and so did Spain’s industrial production.
Spain’s industrial production could see further weakness ahead.
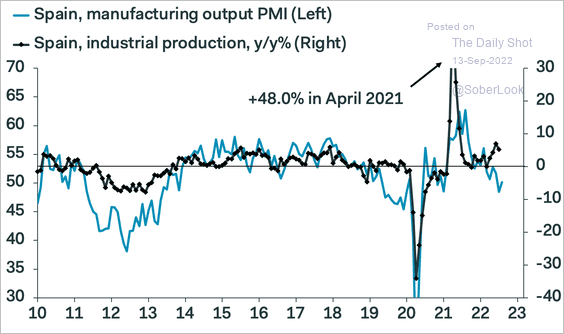 Source: Pantheon Macroeconomics
——————–
2. Spain’s tourism is nearing pre-COVID levels.
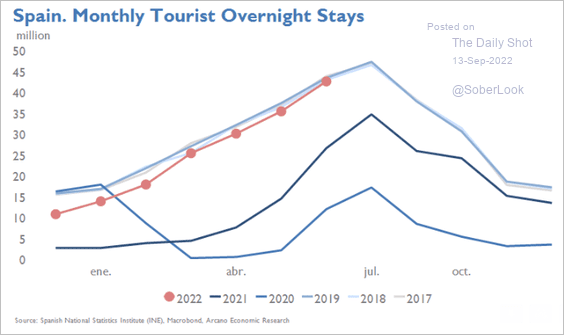 Source: Arcano Partners
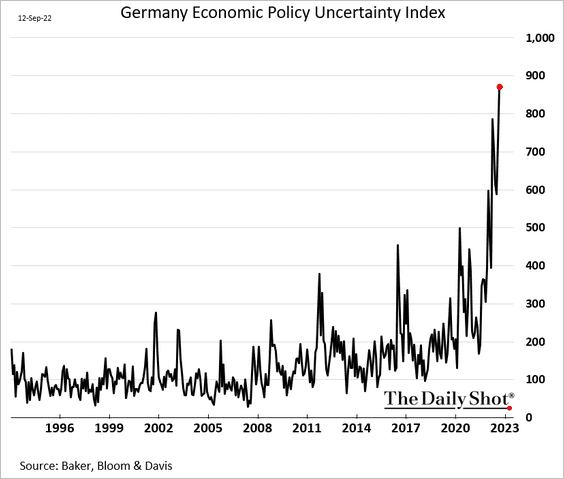
3. The Economic Policy Uncertainty Index for Germany hit a record high as the energy crisis takes a toll.
4. Italian household energy bills could reach nearly €500/month.
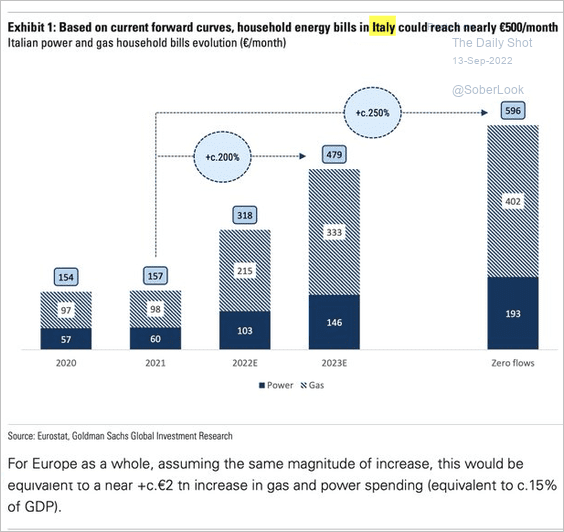 Source: @acemaxx, @GoldmanSachs
5. The Eurozone is facing stagflation just as the ECB ramps up rate hikes.
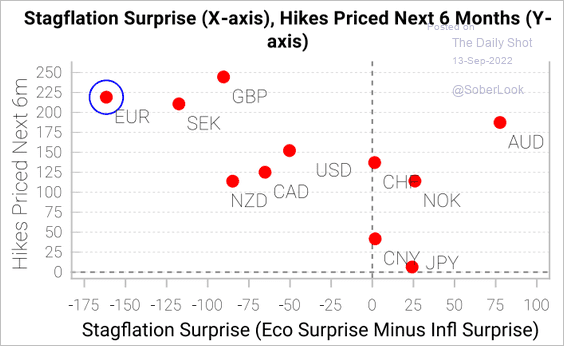 Source: Variant Perception
• Morgan Stanley expects a prolonged recession ahead.
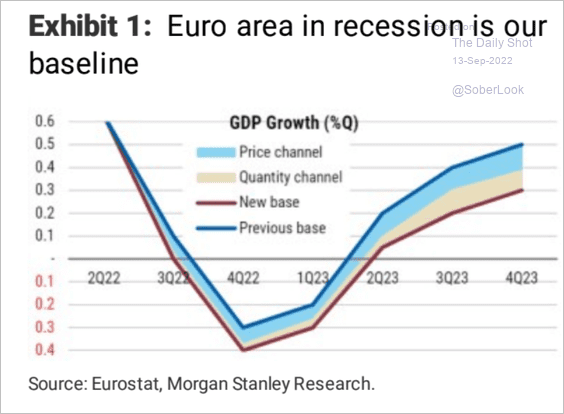 Source: Morgan Stanley Research
• Here is the Variant Perception’s leading index vs. the PMI.
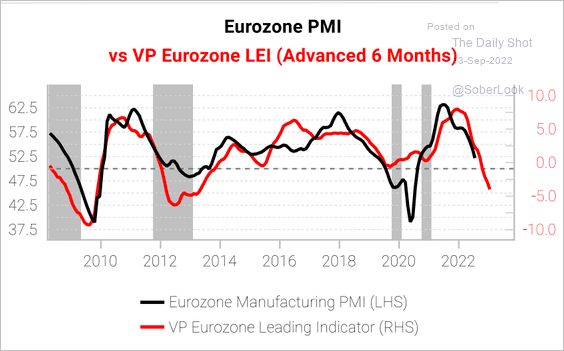 Source: Variant Perception
——————–
6. The Eurozone sovereign yields have lined up well with the debt-to-GDP ratios. Italy is a bit cheap due to election risks.
 Source: @pietphc
Back to Index
Europe
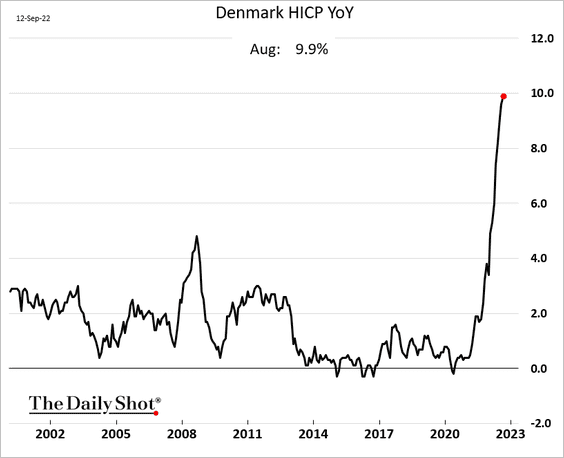
1. Denmark’s CPI is nearing 10%.
2. The Czech Republic’s CPI is starting to slow.
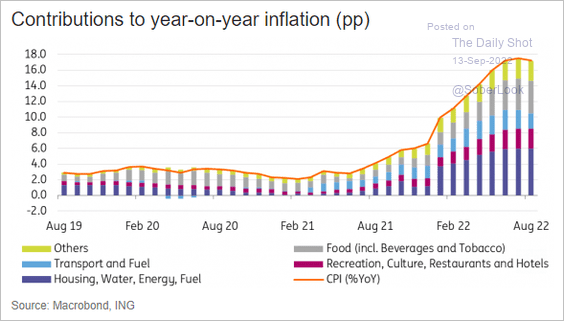 Source: ING
3. European bank shares have been outperforming in recent days.
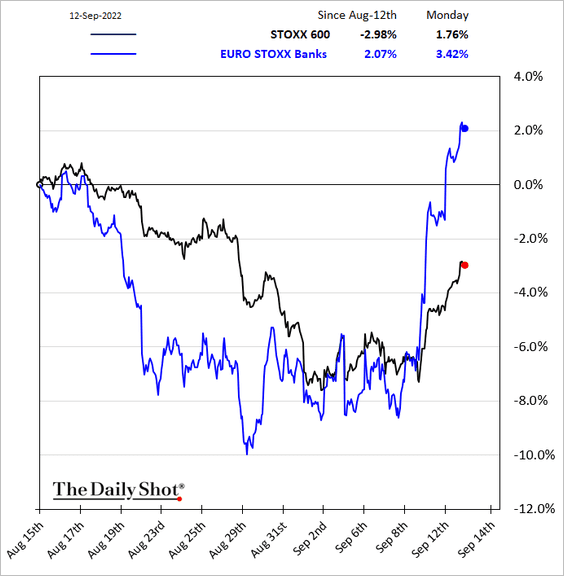
Outflows from European equities have been extreme, …
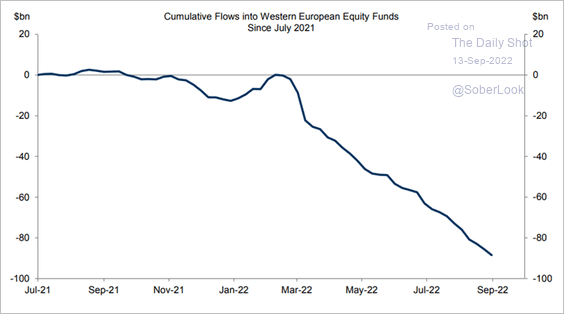 Source: @TCommodity
… amid bearish sentiment.
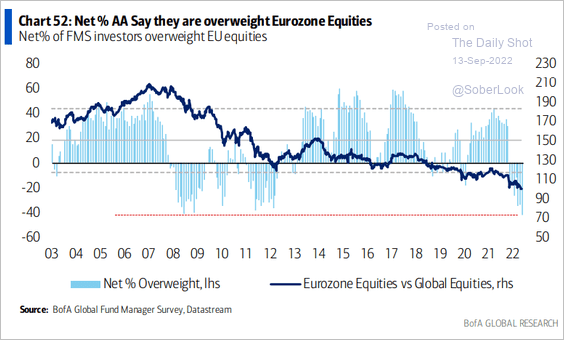 Source: BofA Global Research
——————–
4. This chart shows the EU’s energy burden as a share of GDP compared to the US.
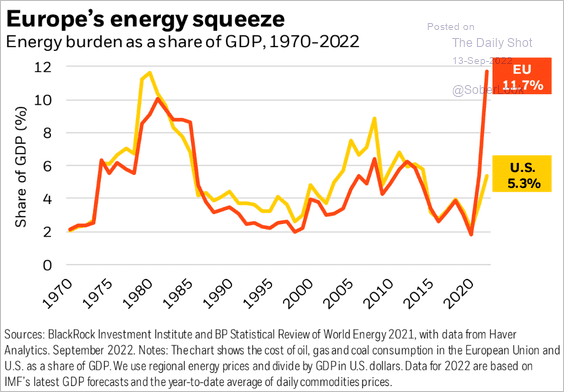 Source: BlackRock Investment Institute
5. Finally, we have the EU’s decline in greenhouse gas emissions by industry.
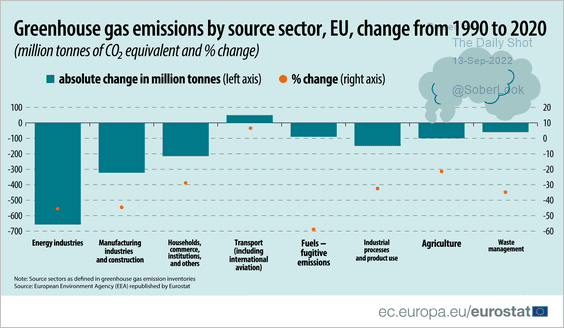 Source: Eurostat Read full article
Back to Index
Japan
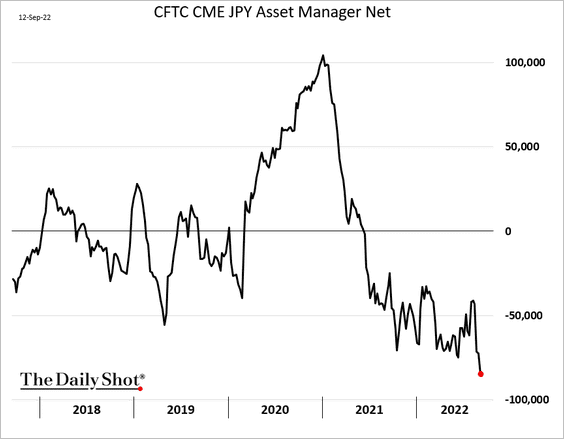
1. Asset managers are very bearish on the yen.
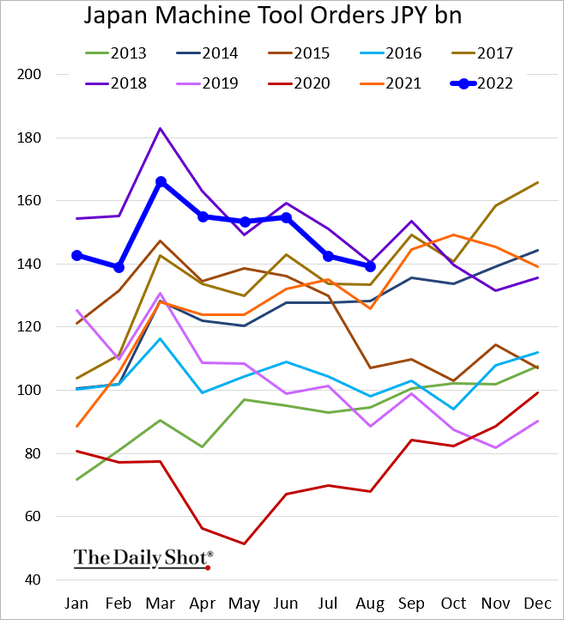
2. Machine tool orders have softened but remain above last year’s levels.
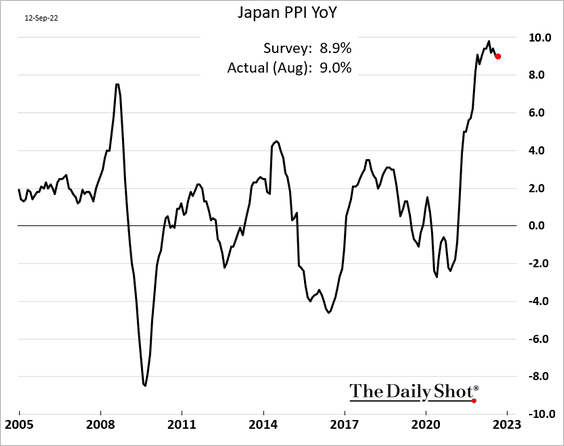
3. The PPI remains elevated.
4. Nuclear power usage is starting to recover.
![]() Source: @WSJ Read full article
Source: @WSJ Read full article
Back to Index
Asia – Pacific
1. New Zealand’s home sales remain depressed.
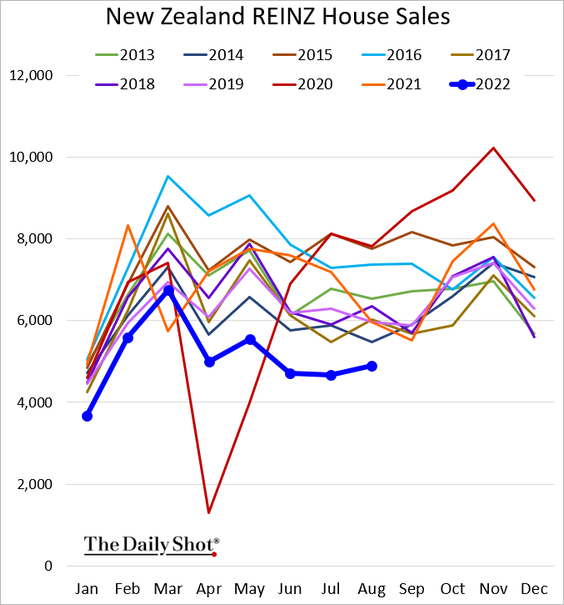
The nation’s housing market bubble has been extreme.
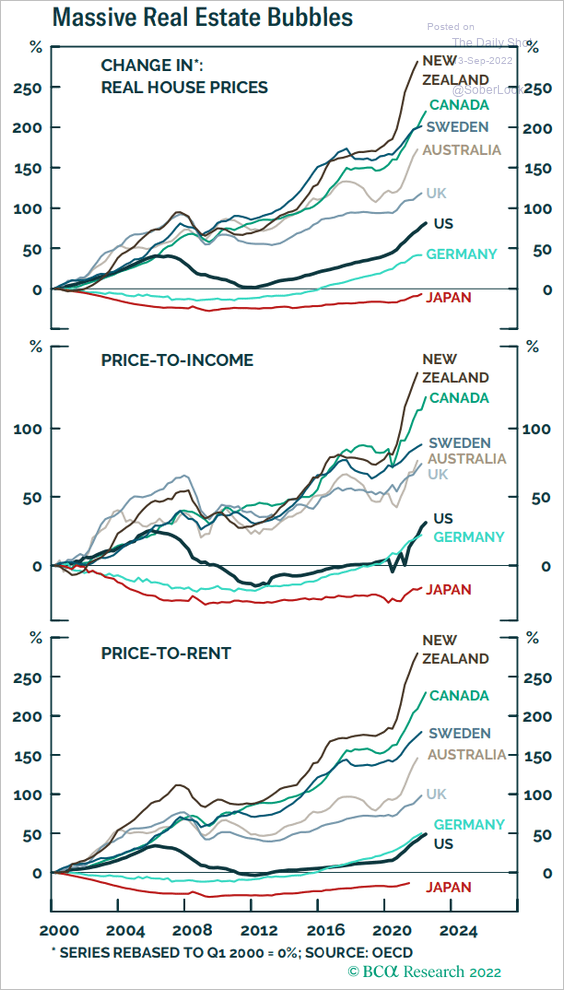 Source: BCA Research
——————–
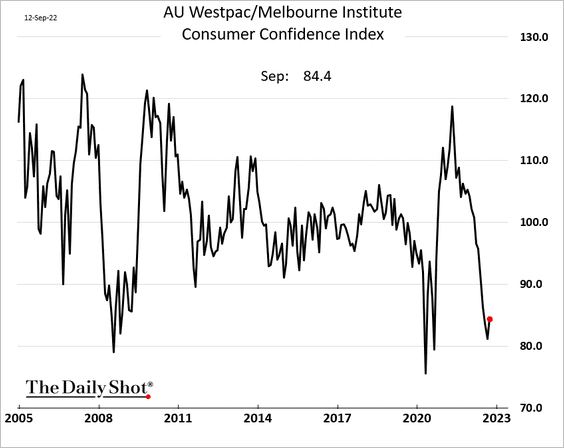
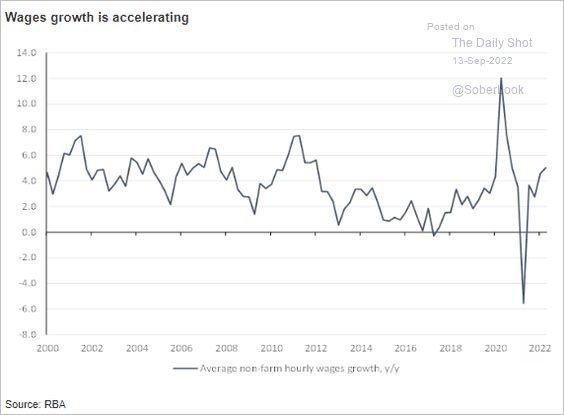
2. Next, we have some updates on Australia.
• Consumer confidence edged higher this month.
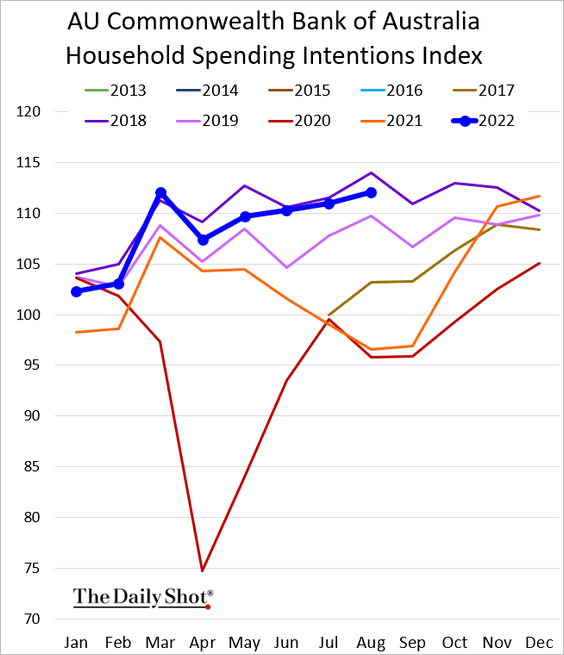
• Household spending intentions remain elevated.
• Wage growth has been strengthening.
 Source: @ANZ_Research
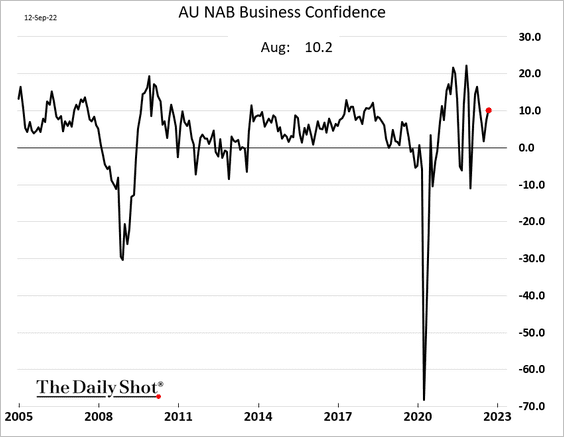
• Business confidence improved in August.
• Business profits have been surging, driven by mining.
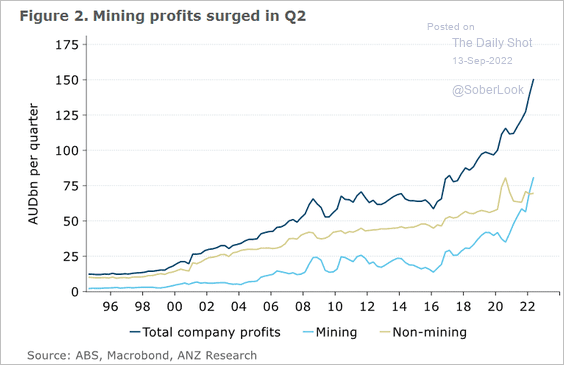 Source: @ANZ_Research
• How much will the RBA raise rates from here? Below is a forecast from Wells Fargo.
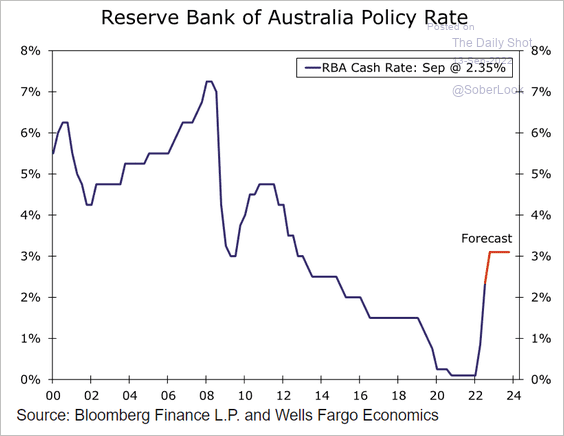 Source: Wells Fargo Securities
• Immigration is rebounding.
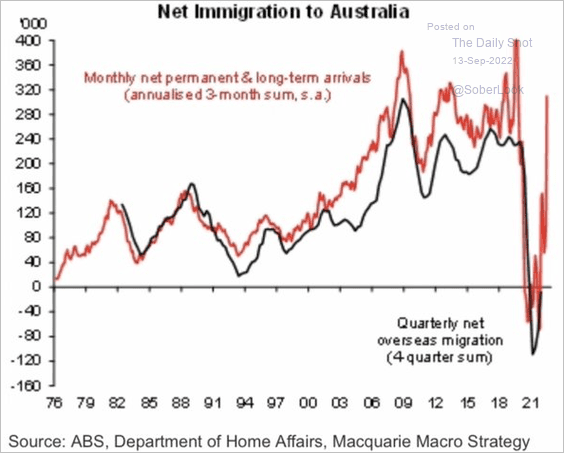 Source: Macquarie Macro Strategy; @ShaneOliverAMP
Back to Index
China
1. The renminbi’s decline this year has been extreme.
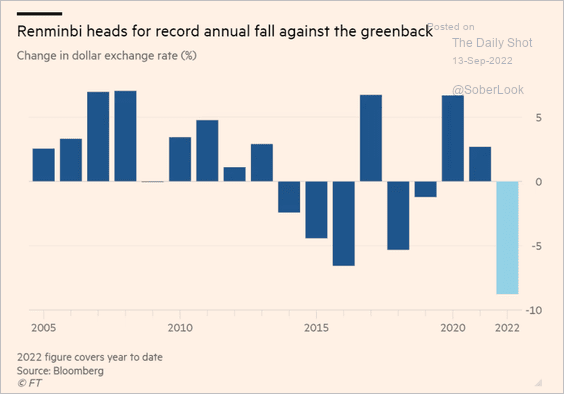 Source: @financialtimes Read full article
2. The surge in bond issuance and a trough in the credit impulse have driven infrastructure spending.
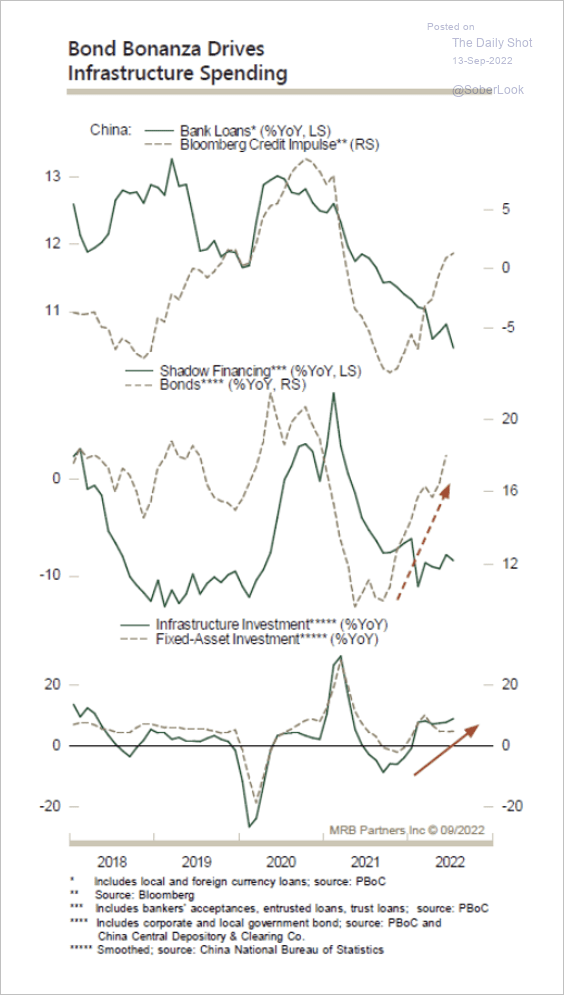 Source: MRB Partners
• Infrastructure has been a bright spot.
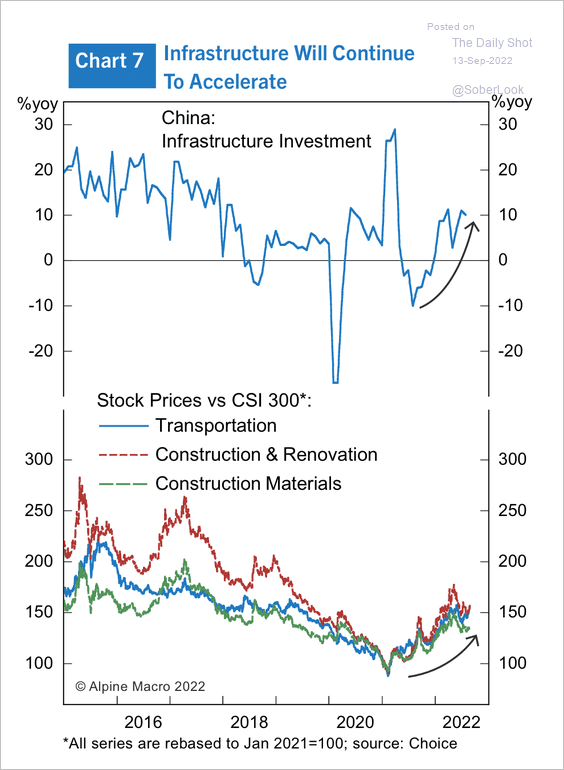 Source: Alpine Macro
• Here are China’s government bond sales.
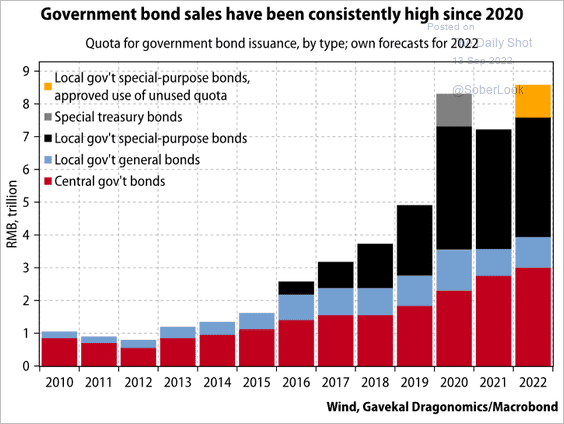 Source: Gavekal Research
• Local government debt issuance boosted total credit expansion.
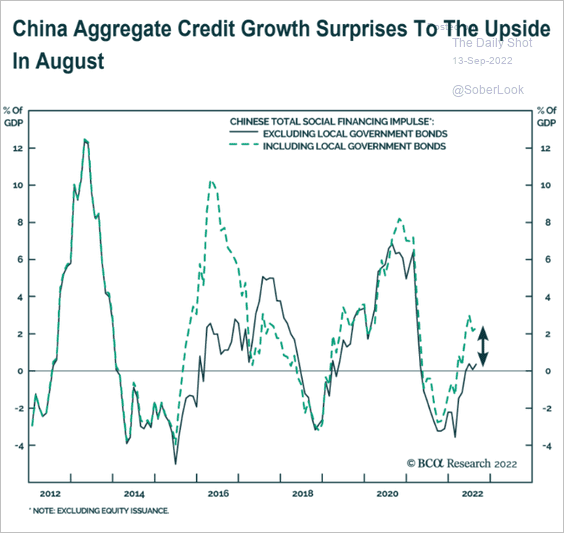 Source: BCA Research
——————–
3. Flows into Chinese local government bonds took a sharp turn negative last quarter.
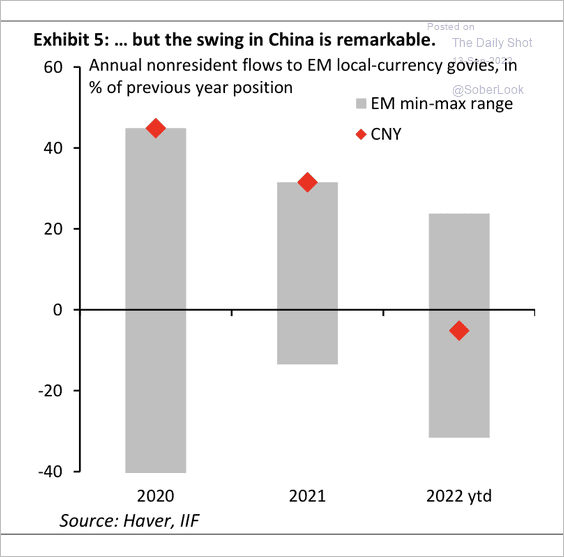 Source: IIF
4. Steel mill margins continue to weaken.
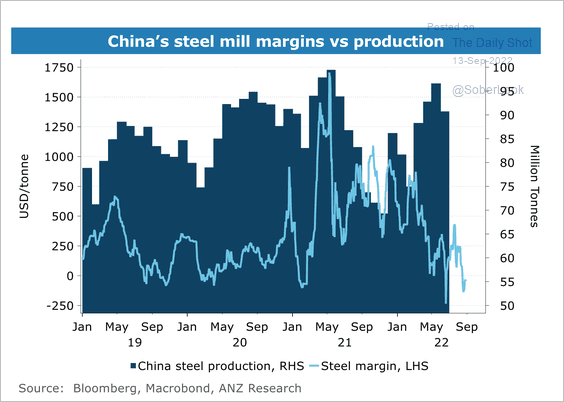 Source: @ANZ_Research
Steel and iron ore inventories are falling (2 charts).
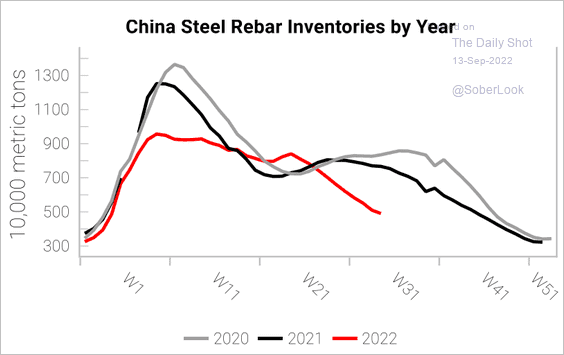 Source: Variant Perception
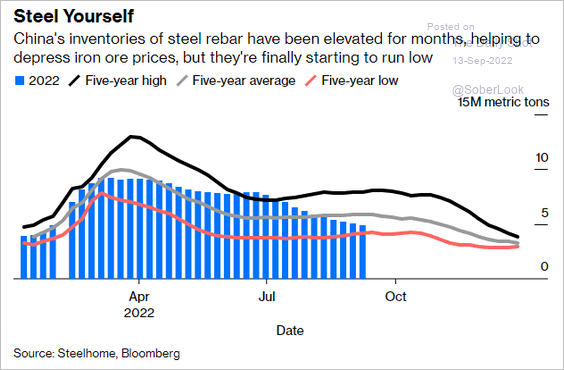 Source: Bloomberg Read full article
Back to Index
Emerging Markets
1. India’s industrial production remains robust.
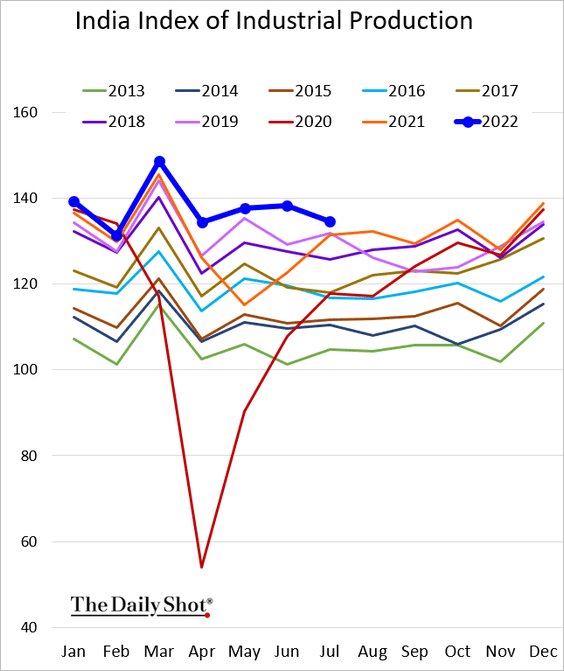
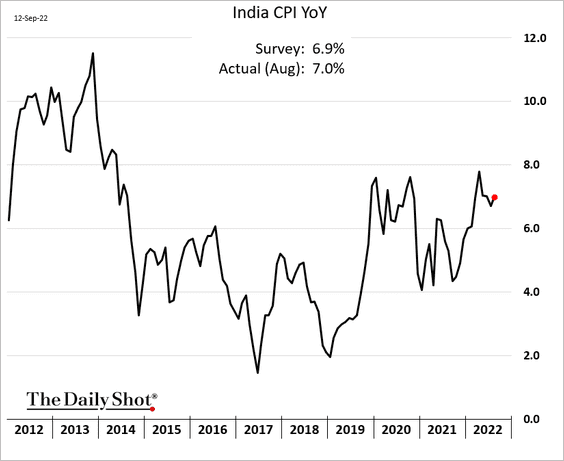
• Inflation ticked higher in August.
• The rupee is rebounding (USD/INR held resistance slightly above 80).
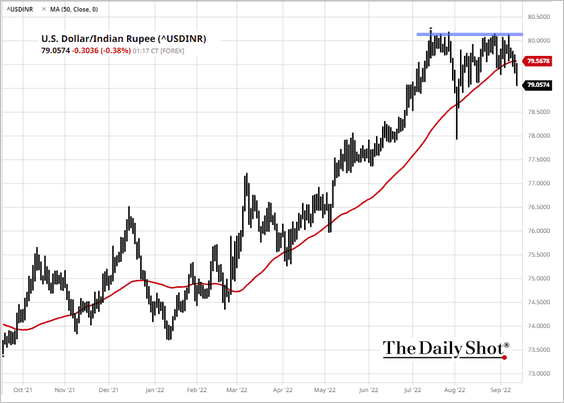 Source: barchart.com
——————–
2. Waging war has become a costly affair for Russia, even with a surge in energy income.
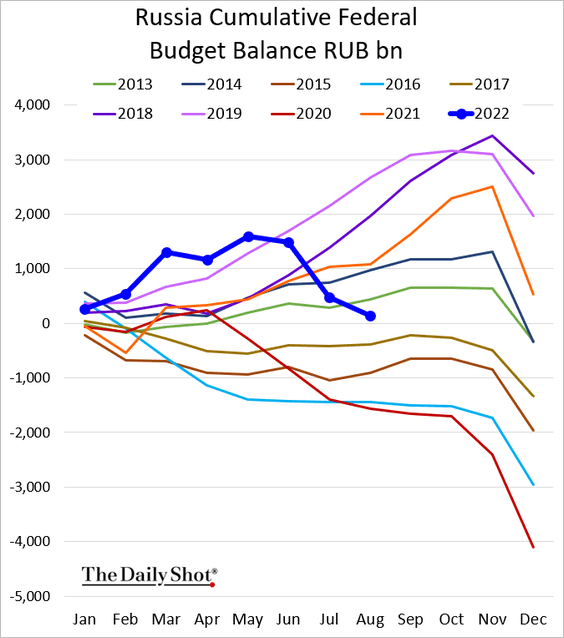 Source: Russian Ministry of Finance
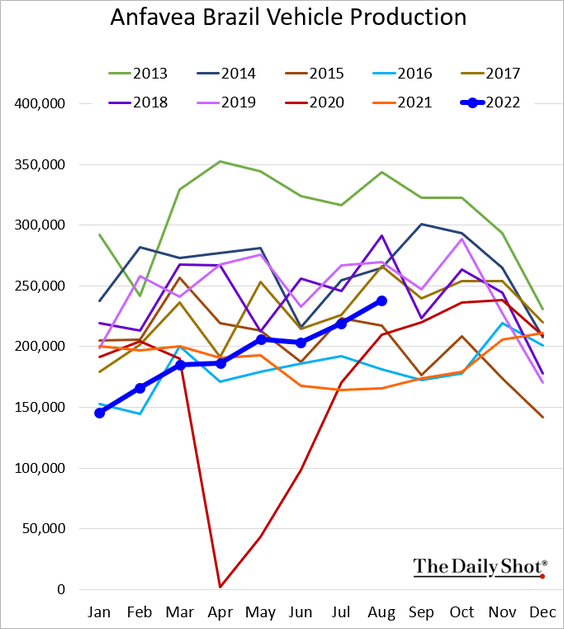
3. Brazil’s vehicle production is rebounding.
4. Outflows from local-currency government bonds remained exceptionally large last quarter, more than equities. (2 charts)
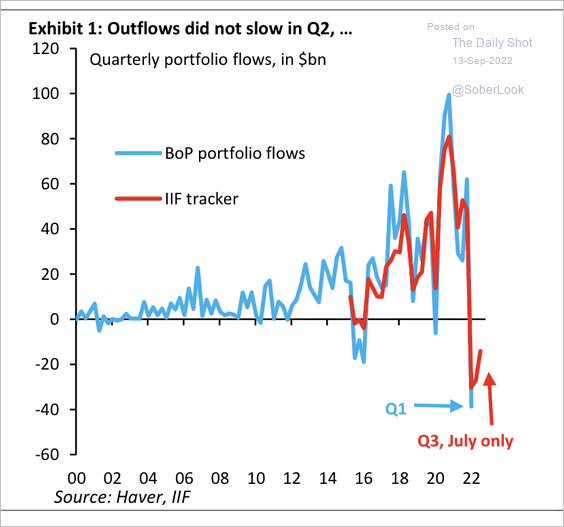 Source: IIF
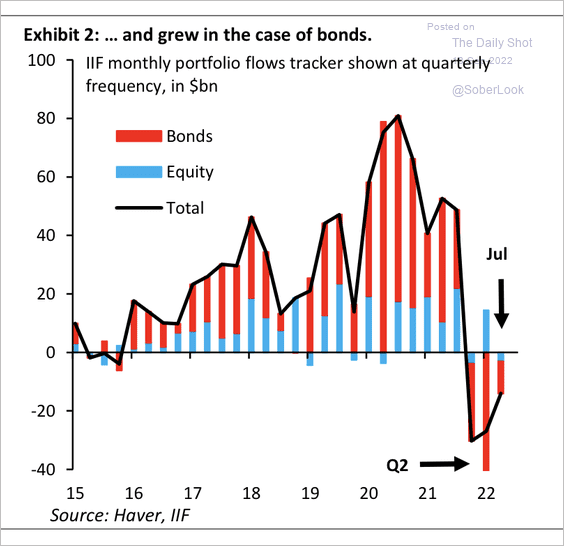 Source: IIF
Back to Index
Cryptocurrency
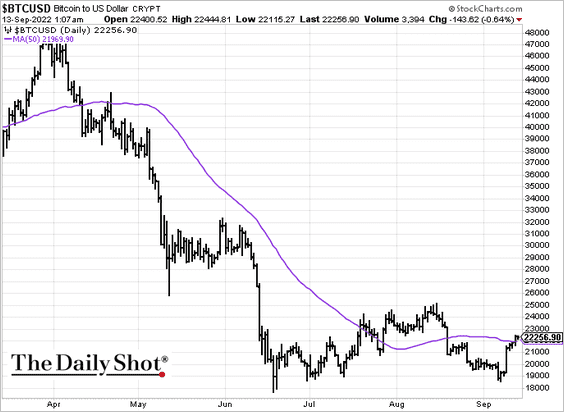
1. Bitcoin is above its 50-day moving average.
2. The BTC/ETH price ratio is holding support, which typically reflects a more defensive tone among crypto traders.
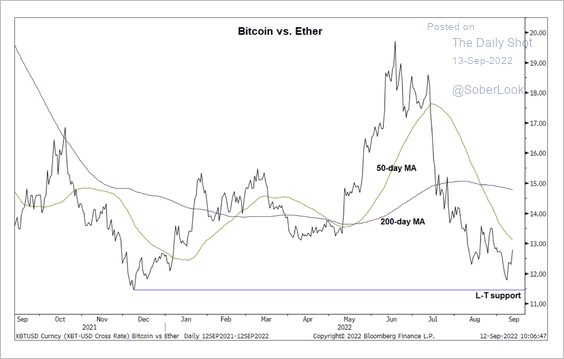 Source: @StocktonKatie
3. Crypto funds experienced outflows for the fifth consecutive week, driven by Ethereum-focused products.
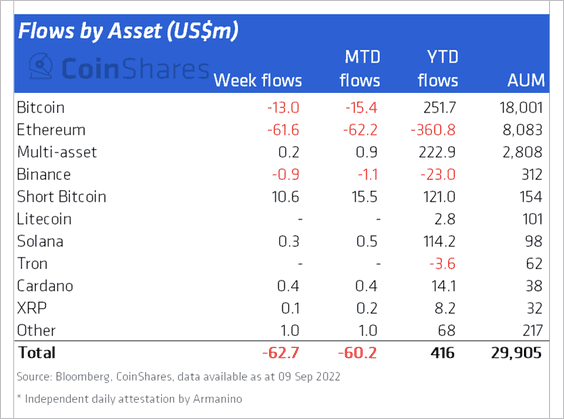 Source: CoinShares Read full article
Canadian crypto funds saw the most outflows last week.
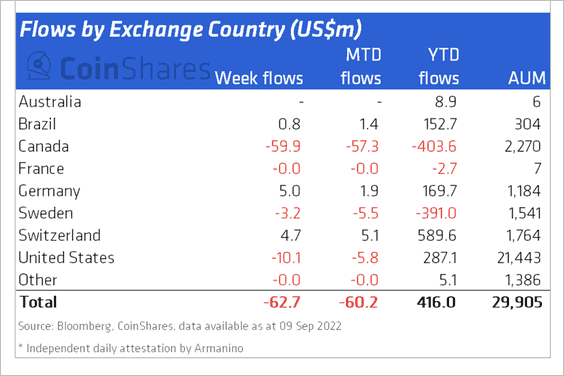 Source: CoinShares Read full article
——————–
4. This chart shows the spot transaction volume across crypto exchanges.
![]() Source: Blue Room
Source: Blue Room
Back to Index
Commodities
US soy and corn inventories are low for this time of the year.
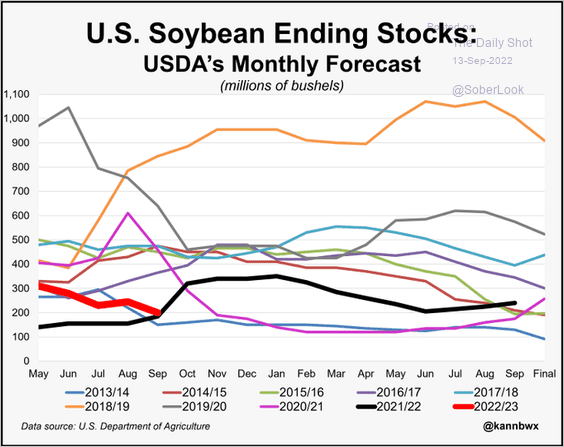 Source: @kannbwx
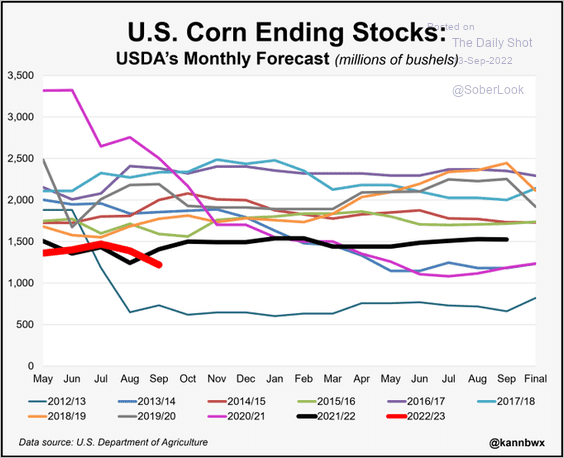 Source: @kannbwx
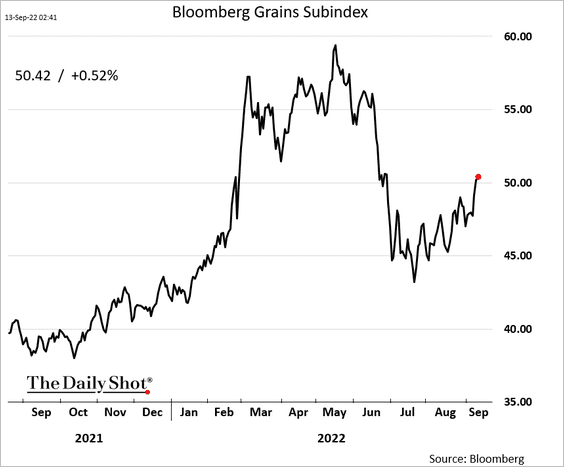
Grain prices are rebounding.
Back to Index
Energy
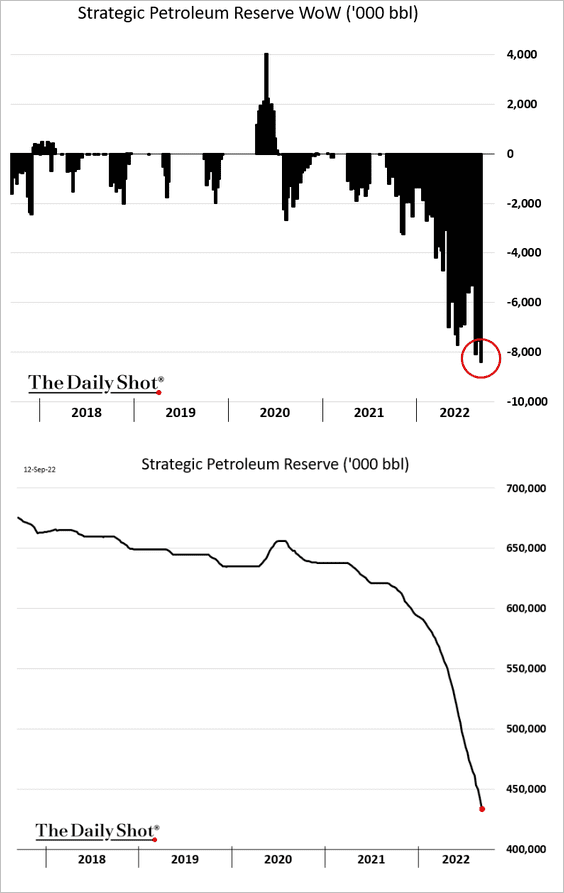
1. The US registered its largest oil release from the Strategic Petroleum Reserve last week.
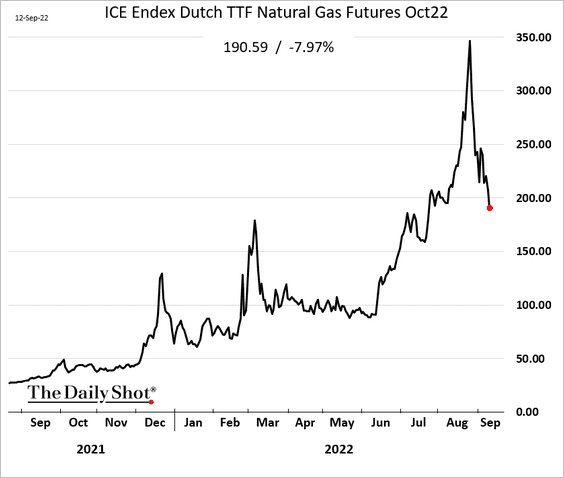
2. European natural gas futures continue to fall.
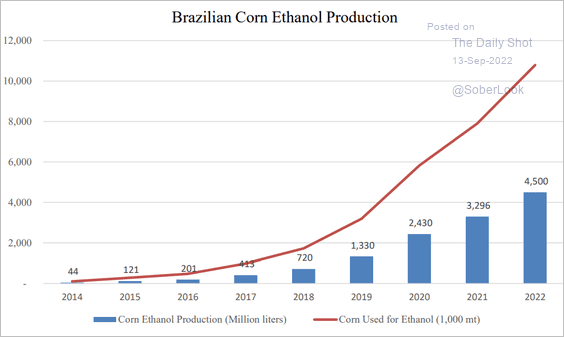
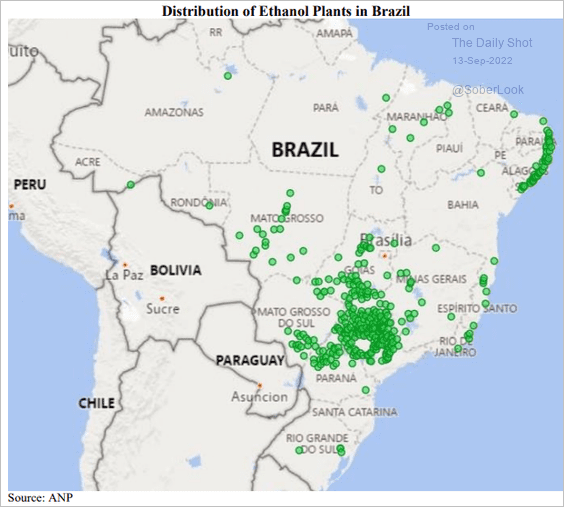
3. Brazil’s ethanol production keeps climbing.
 Source: USDA Read full article
 Source: USDA Read full article
4. Solar installations are surging.
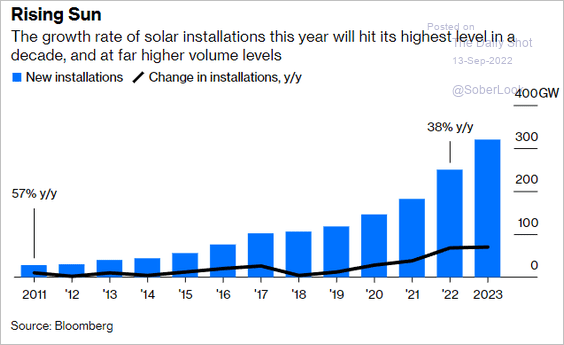 Source: Bloomberg Read full article
Back to Index
Equities
1. Professional investors’ risk aversion has reached extreme levels, according to BofA’s fund manager survey.
• Risk appetite:
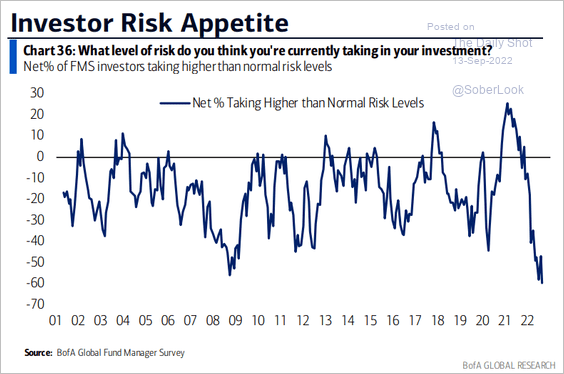 Source: BofA Global Research
• Cash levels:
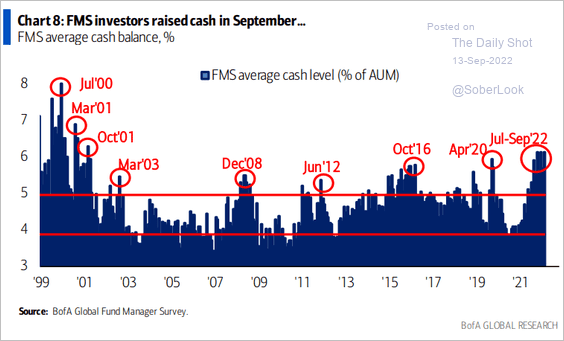 Source: BofA Global Research
• Allocation to equities:
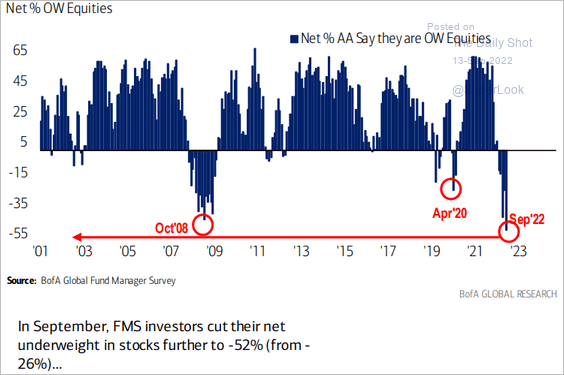 Source: BofA Global Research
——————–
2. Most institutional investors surveyed by Deutsche Bank expect the S&P 500 to reach cycle lows in 2023 or beyond.
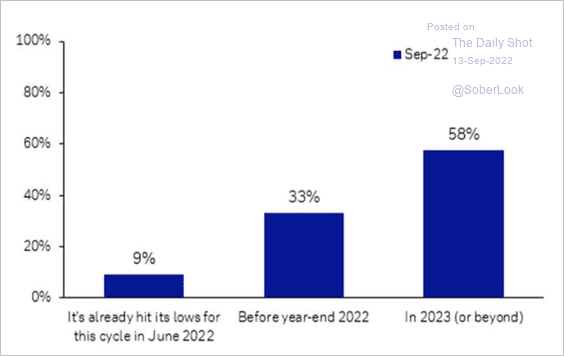 Source: Deutsche Bank Research
3. How much of a decline in earnings should we expect in a recession scenario?
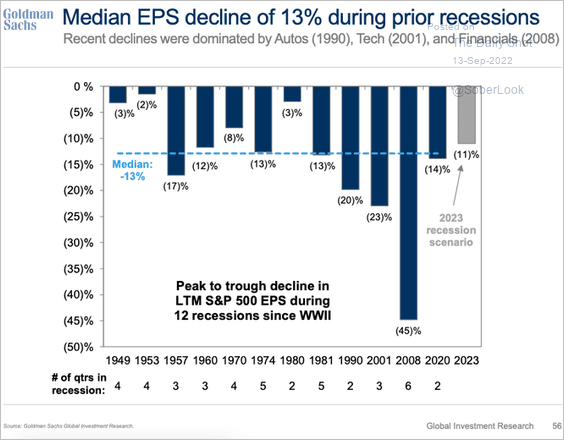 Source: Goldman Sachs; @SamRo
4. The current rebound has been broad.
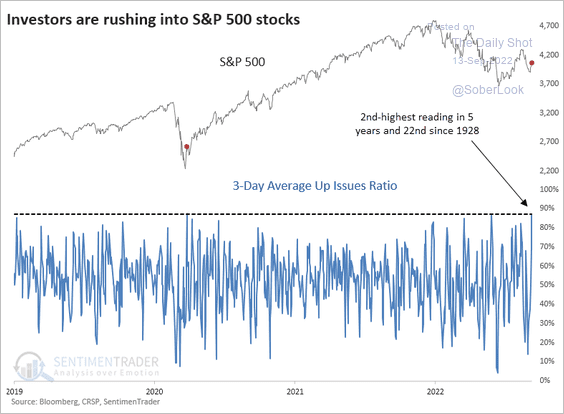 Source: SentimenTrader, h/t @pav_chartbook
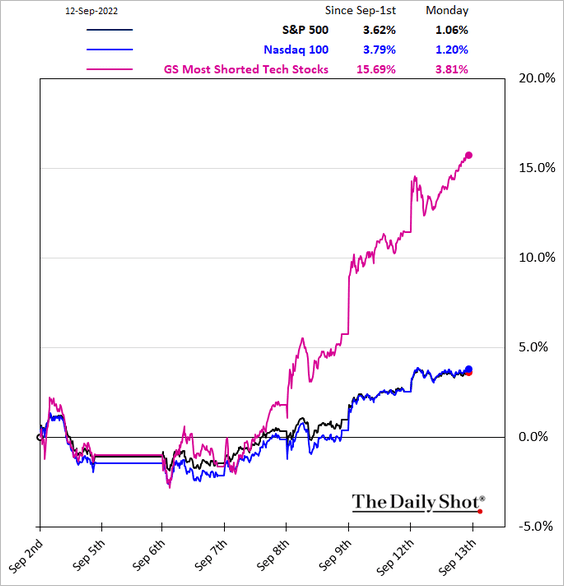
5. Most-shorted tech names staged a sharp rally in recent days amid short-covering.
6. A shift in spending patterns away from goods should benefit consumer services over retail stocks.
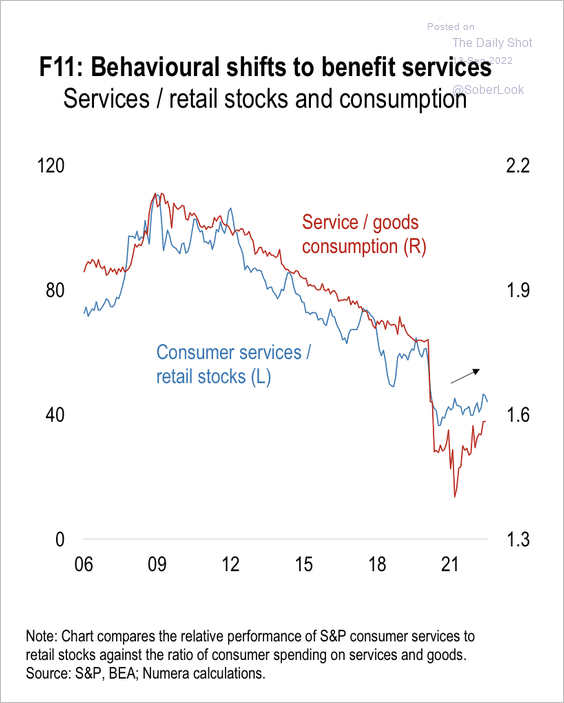 Source: Numera Analytics
7. The US market tends to strengthen after the midterm elections.
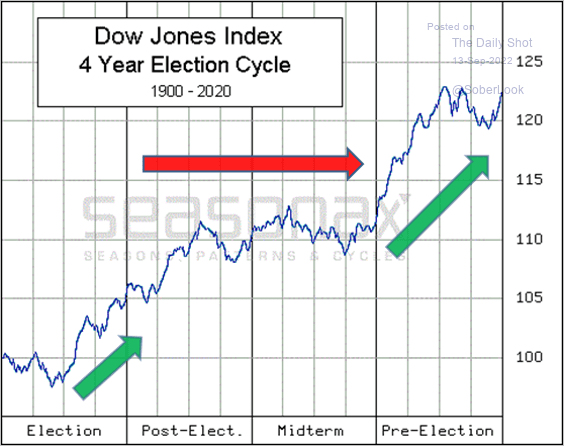 Source: @MikeZaccardi
Back to Index
Credit
1. Investment-grade bond ratings shifted to net downgrades in August.
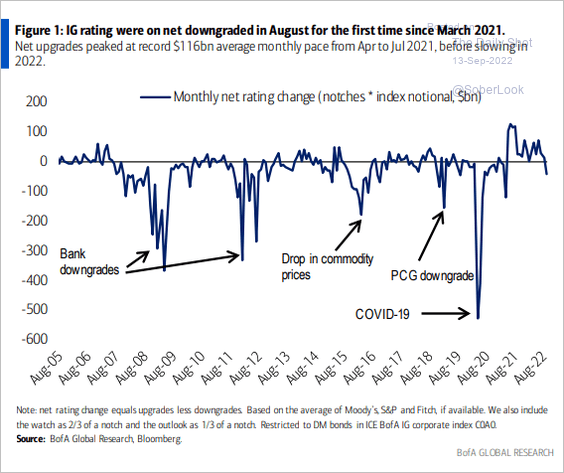 Source: BofA Global Research
2. US HY leverage is back at pre-COVID levels. Interest coverage continues to climb.
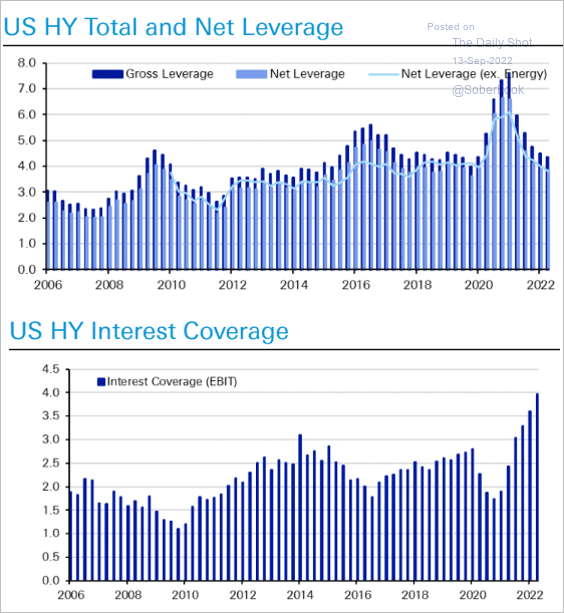 Source: Deutsche Bank Research
Investors don’t consider companies to be overleveraged anymore.
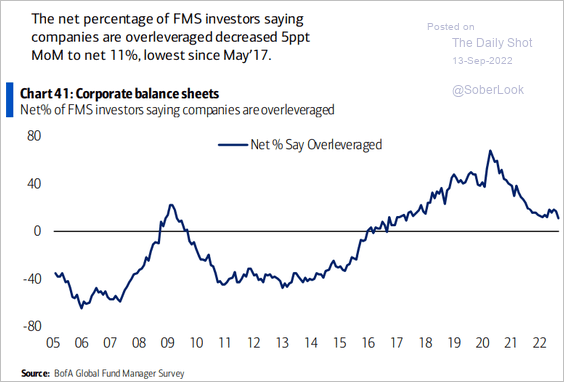 Source: BofA Global Research
——————–
3. Outflows from muni funds this year have been unprecedented.
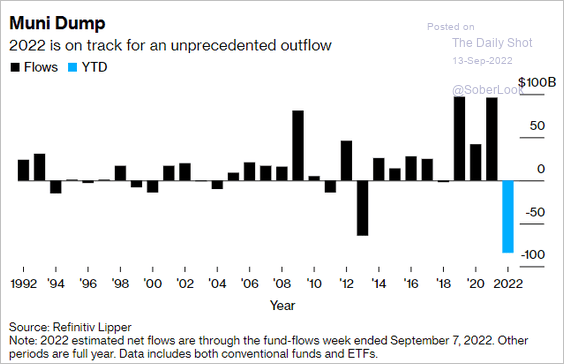 Source: Bloomberg Read full article
Back to Index
Rates
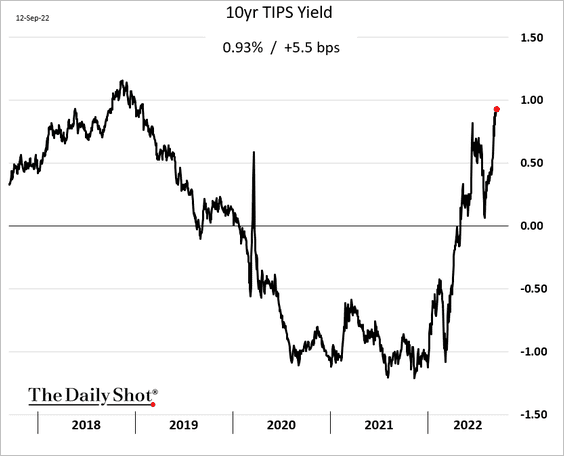
1. US real yields keep climbing, which could pose a risk for growth stocks.
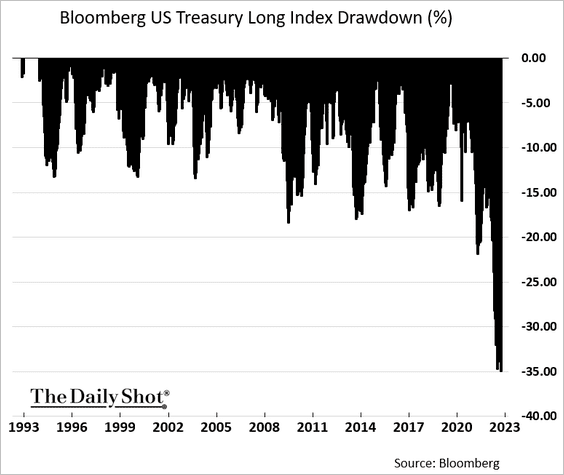
2. The drawdown in long-dated Treasuries reaches 35%.
3. Global bond volatility remains elevated.
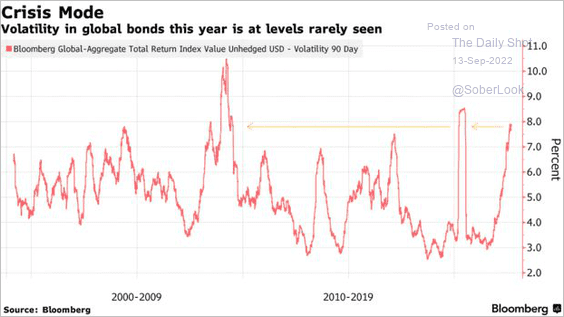 Source: @GarfieldR1966, @markets Read full article
4. This chart shows the reaction to recent CPI and payroll releases, weighted by yield variance, across the 3-year, 5-year, and 10-year Treasury tenors. The 5-year has been the most volatile.
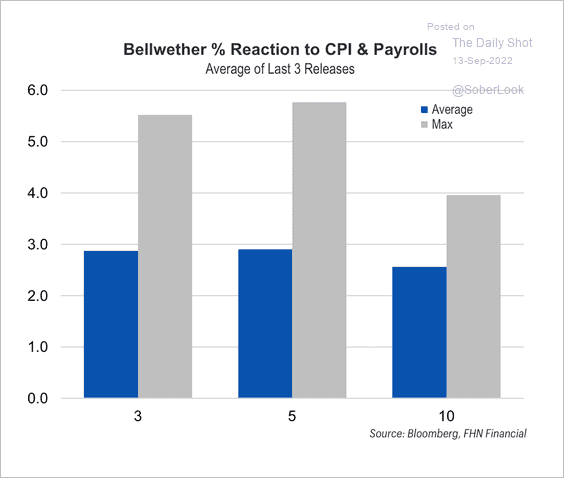 Source: FHN Financial
5. Treasury term premium has diverged from market volatility.
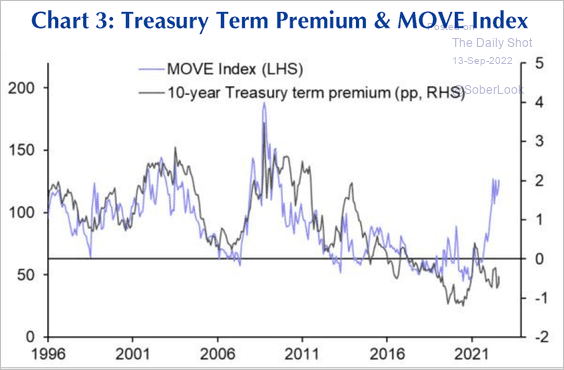 Source: Capital Economics
6. Positioning in Treasury futures has been increasingly bearish.
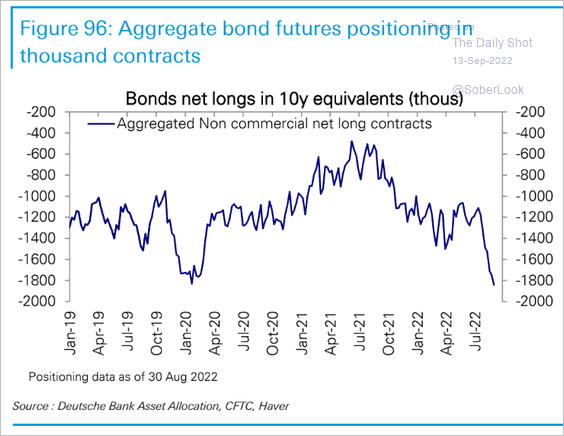 Source: Deutsche Bank Research
Back to Index
Global Developments
1. Long US dollar is the most crowded trade according to fund managers (based on a survey from BofA).
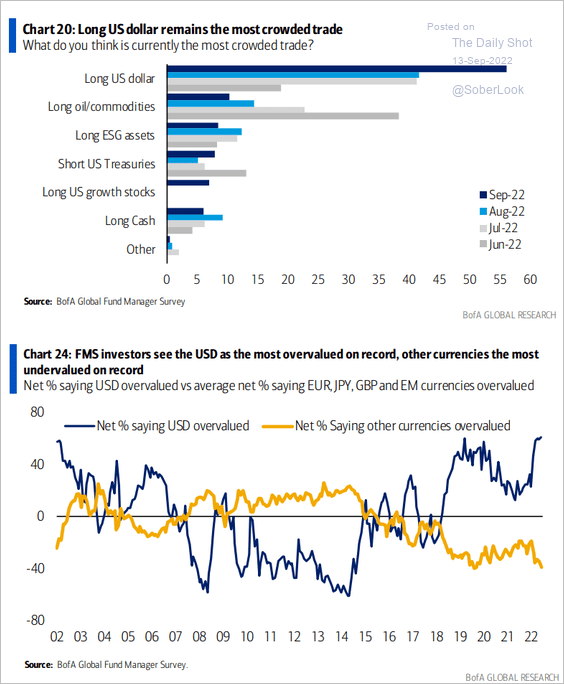 Source: BofA Global Research
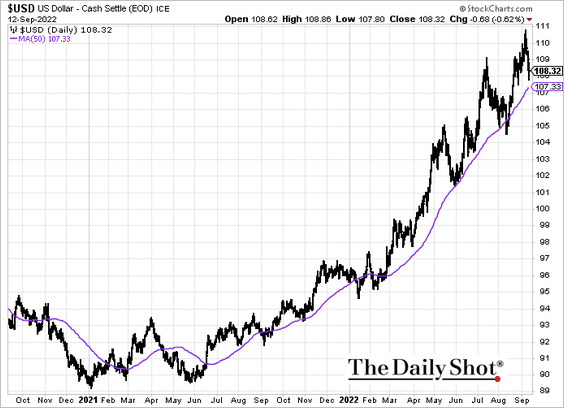
The US dollar index (DXY) is about to test support at the 50-day moving average.
——————–
2. Central banks have been depleting their currency reserves, mainly the dollar.
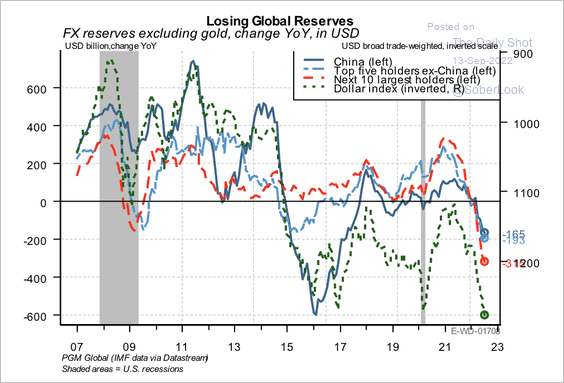 Source: PGM Global
However, the dollar has not weakened despite lower reserve allocations.
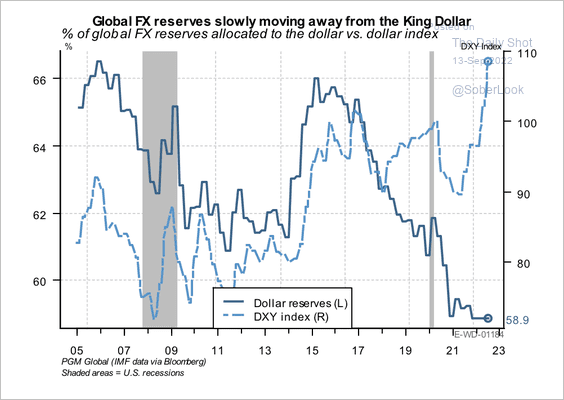 Source: PGM Global
——————–
3. The working-age population in the largest advanced economies has declined over the past few years.
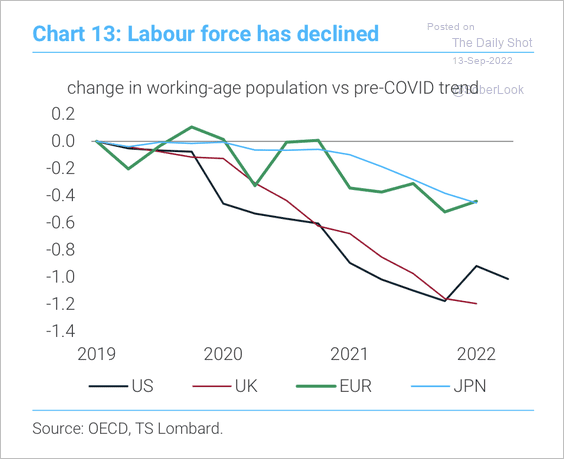 Source: TS Lombard
4. This chart shows corporate earnings growth estimates.
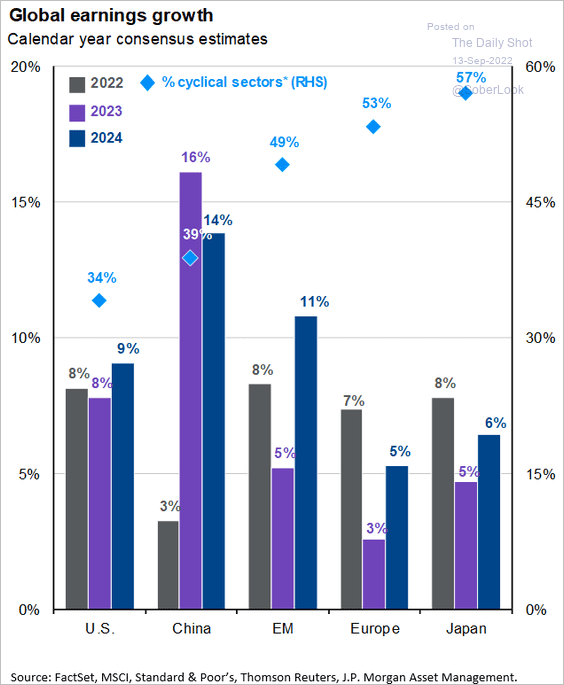 Source: J.P. Morgan Asset Management
——————–
Food for Thought
1. Biggest buyers of semiconductor tools:
 Source: Gavekal Research
2. China’s purchases of smuggled oil from Russia, Iran, and Venezuela:
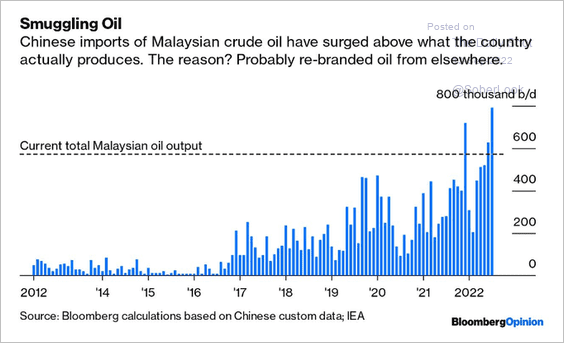 Source: @JavierBlas
3. Ukraine and nuclear energy:
![]() Source: Statista
Source: Statista
4. The H-2B visa program:
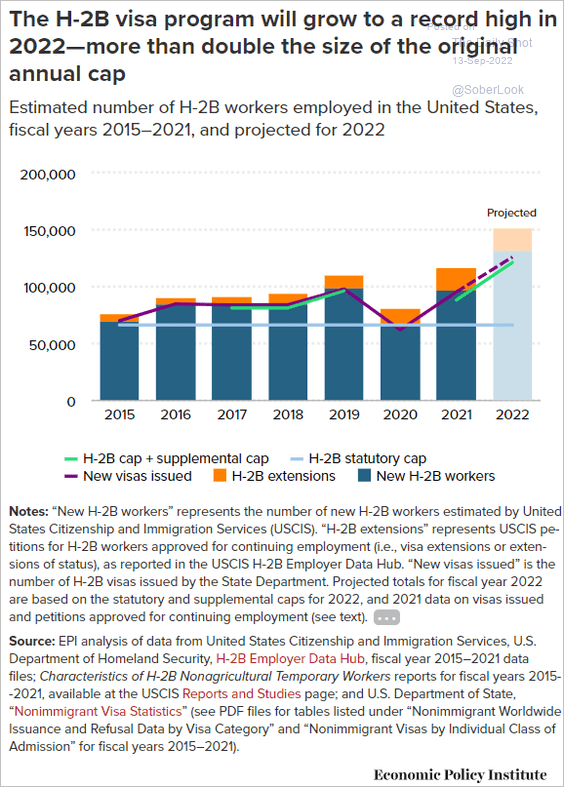 Source: EPI Read full article
5. Land area needed to power a TV, by energy source:
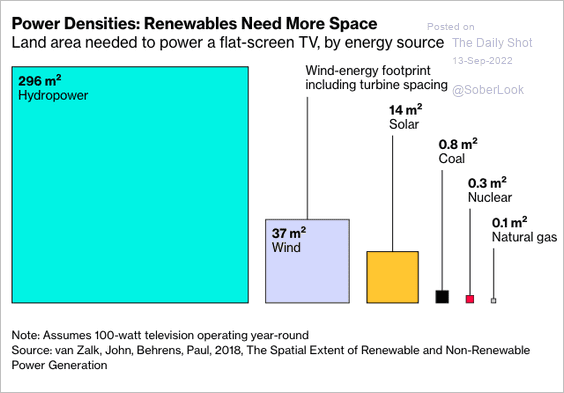 Source: @shannonosaka, @climate Read full article
6. Rivers running dry:
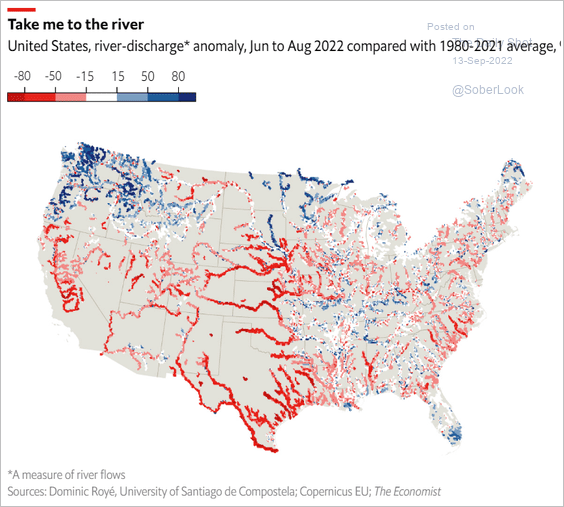 Source: The Economist Read full article
7. Former leaders jailed or prosecuted:
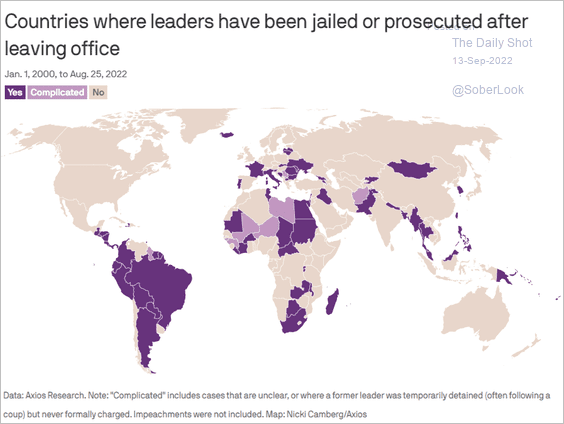 Source: @axios Read full article
8. Pet food sales:
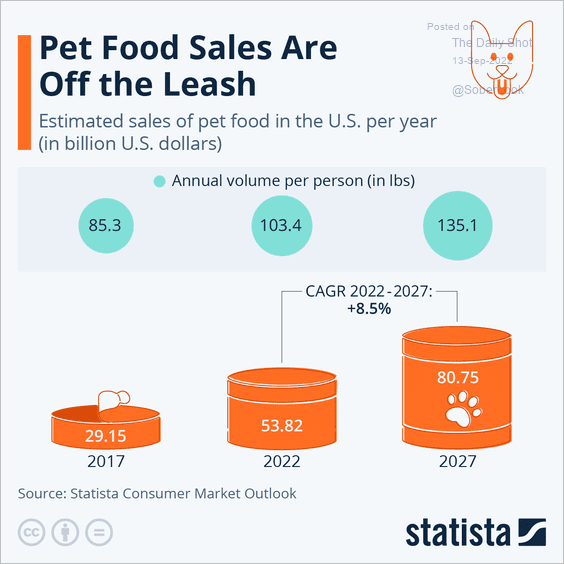 Source: Statista
——————–
Back to Index