
The Daily Shot: 15-Jun-23
• The United States
• The United Kingdom
• The Eurozone
• Europe
• Japan
• Asia-Pacific
• China
• Emerging Markets
• Cryptocurrency
• Commodities
• Energy
• Equities
• Credit
• Global Developments
• Food for Thought
The United States
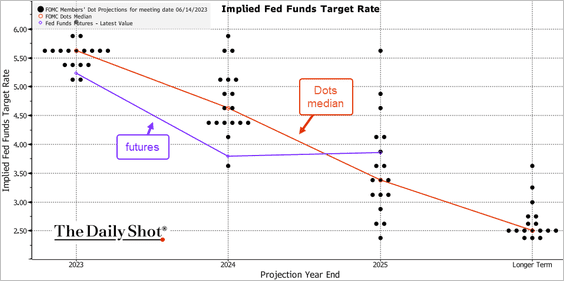
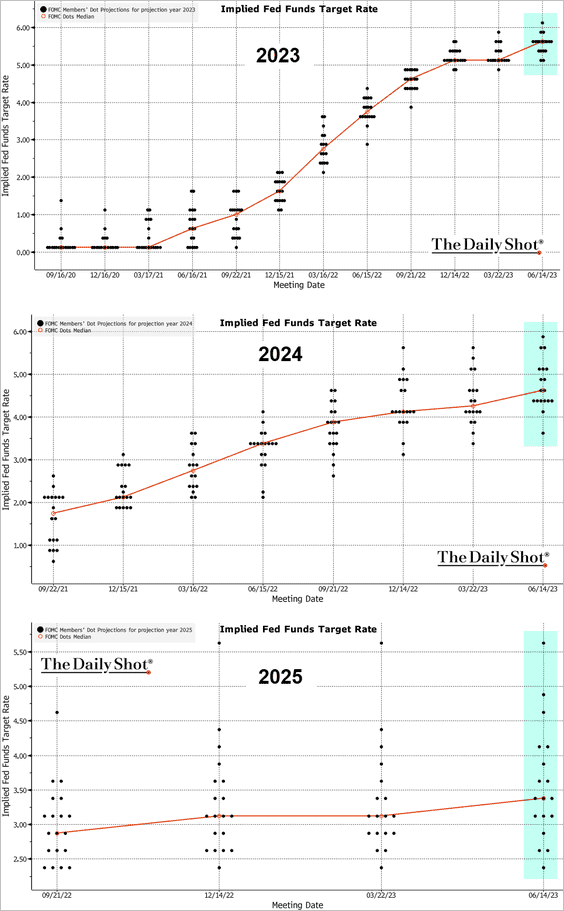
1. The Fed delivered a “hawkish pause” this month, with the dot-plot signaling another 50 bps of rate hikes this year.
 Source: @TheTerminal, Bloomberg Finance L.P.
• The FOMC’s rate projections were also moved higher for 2024 and 2025.
 Source: @TheTerminal, Bloomberg Finance L.P.
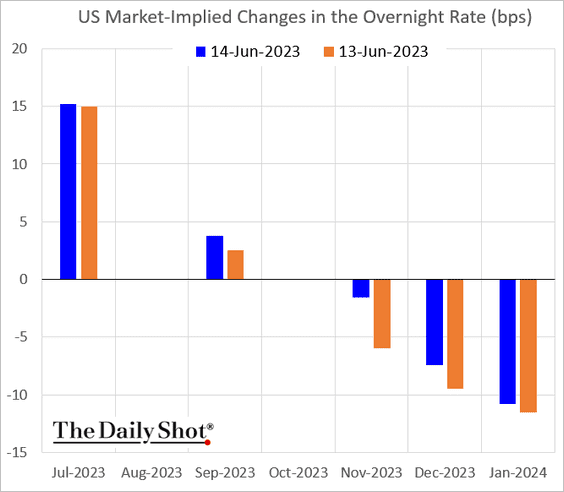
• However, at his press conference, Chair Powell stressed the need for more time to assess the impact of “long and variable lags” of the Fed’s massive tightening cycle. Consequently, some analysts opted to disregard the 50 bps of new hikes. The market faded the hawkish dot-plot, but it still sees a 60% chance of a rate hike in July.
– Nomura expects the Fed to start cutting rates next year as inflation slows sharply in Q4.
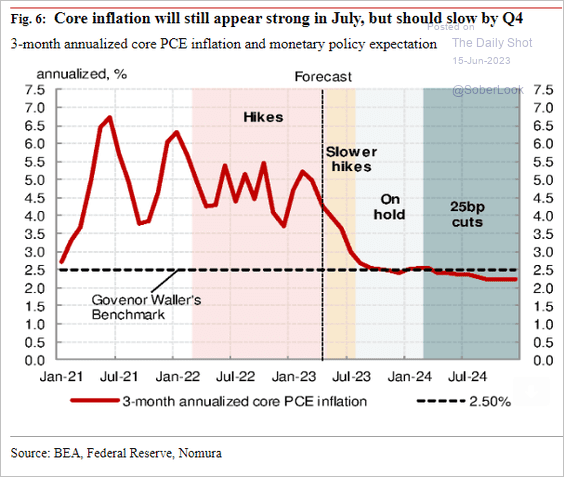 Source: Nomura Securities
• The FOMC lowered its projections for unemployment while boosting core inflation forecasts.
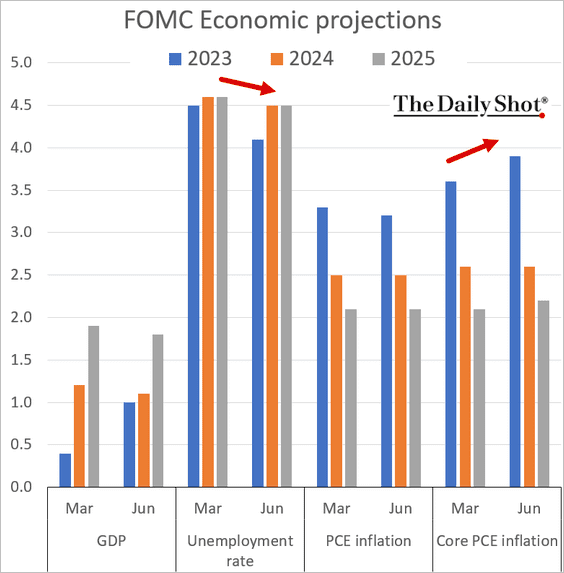
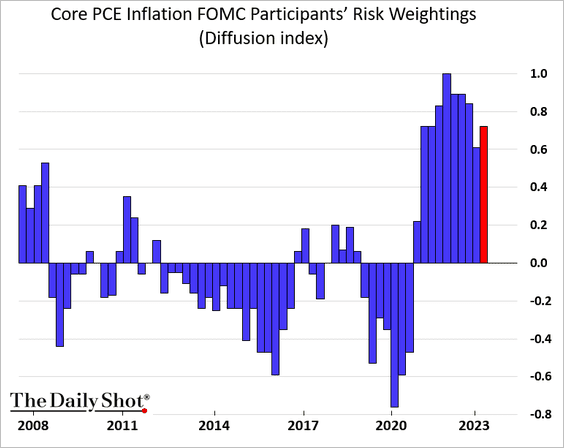
• Most FOMC members still see inflation risks skewed to the upside.
——————–
2. Next, let’s take a look at market reaction to the FOMC projections and press conference.
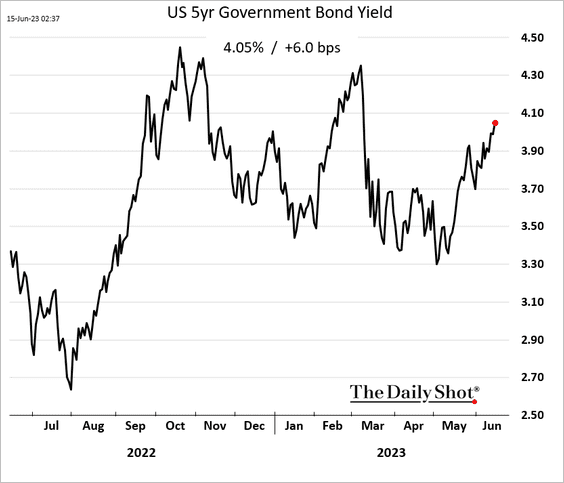
• Treasury yields moved up slightly on “higher for longer” expectations.
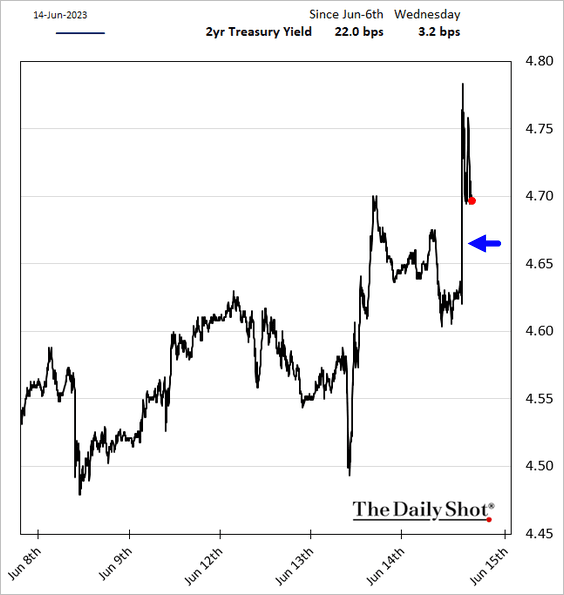
Yields continued to climb this morning.
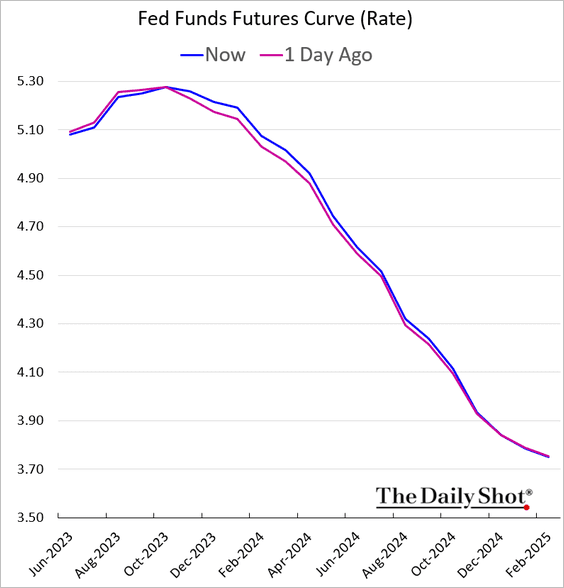
• Here is the change in the futures-implied fed funds rate trajectory.
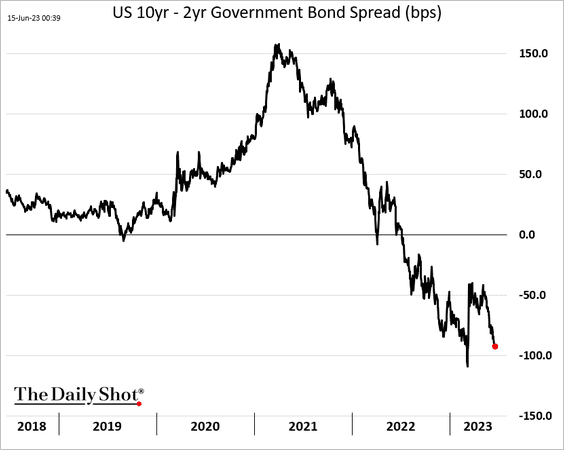
• The Treasury curve inversion deepened.
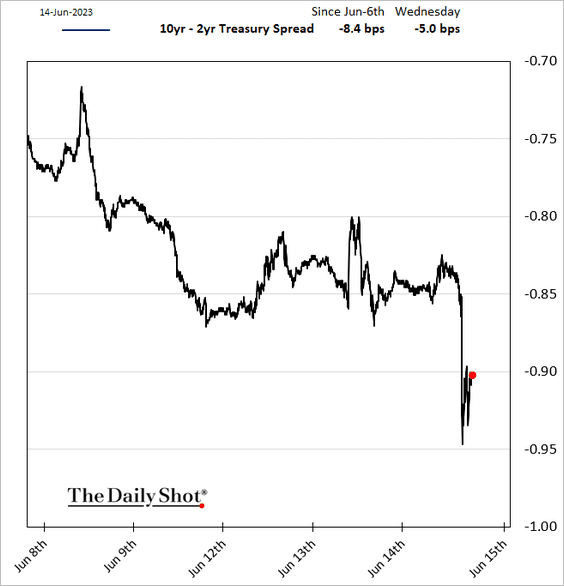
The curve’s steepening move after the banking turmoil is getting reversed.
• The stock market mostly faded the Fed’s hawkish stance.

——————–
3. Now, let’s take a look at some inflation data.
• The headline PPI surprised to the downside, with producer prices declining in May.
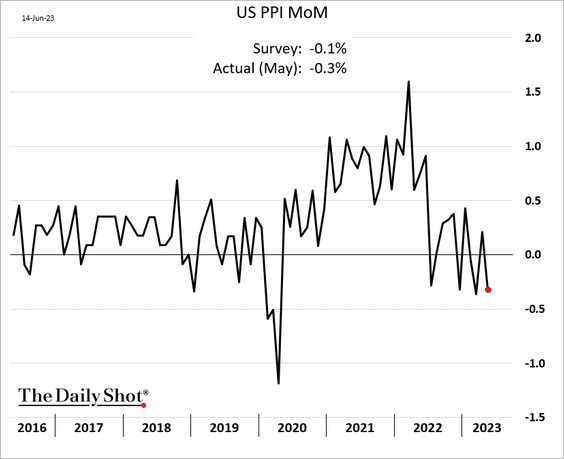
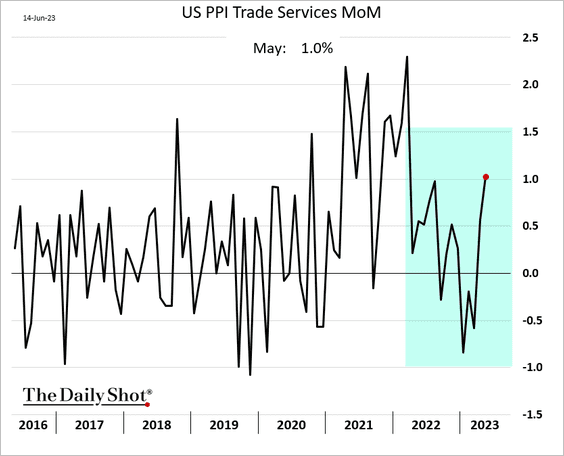
– The core PPI climbed by 0.2%, …
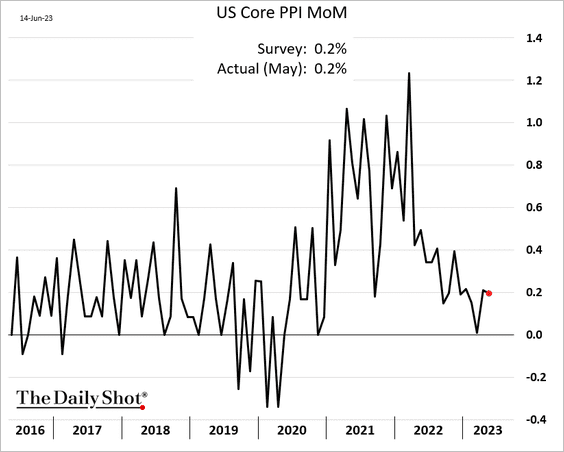
… with the gain driven by trade services (business markups). Companies have managed to boost their margins again.
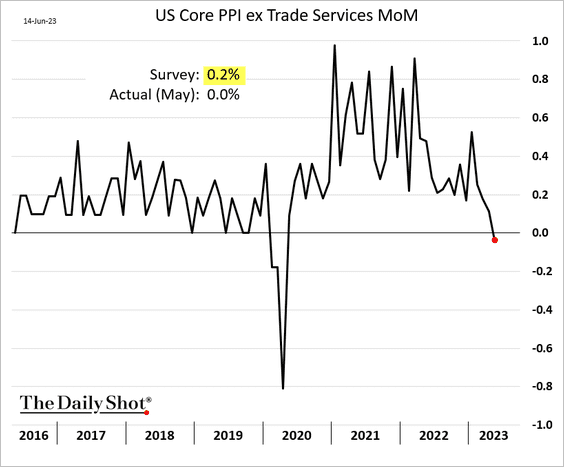
– Excluding trade services, the core PPI saw its first (very slight) monthly decline since the COVID shock.
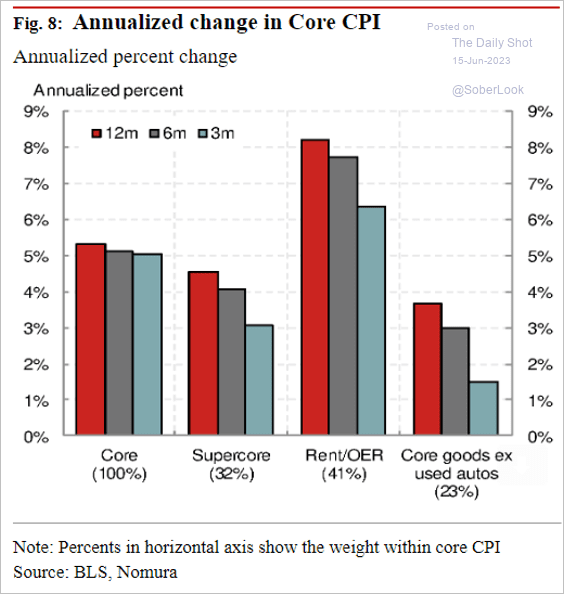
• Next, let’s take a look at consumer inflation using 3-month changes (annualized). Some of these trends point to substantial progress in the Fed’s inflation battle.
– 3-month changes vs. 12-month changes:
 Source: Nomura Securities
– Various core inflation components:
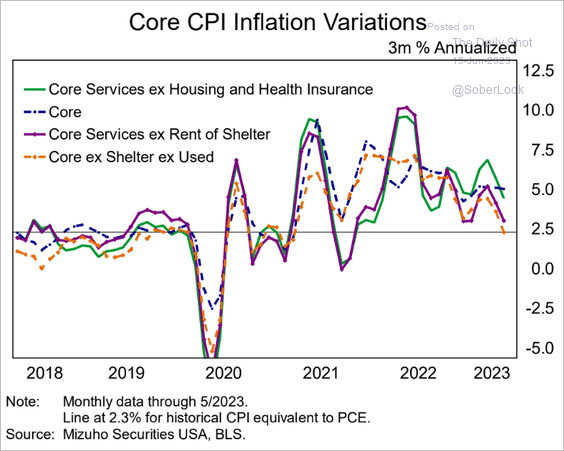 Source: Mizuho Securities USA
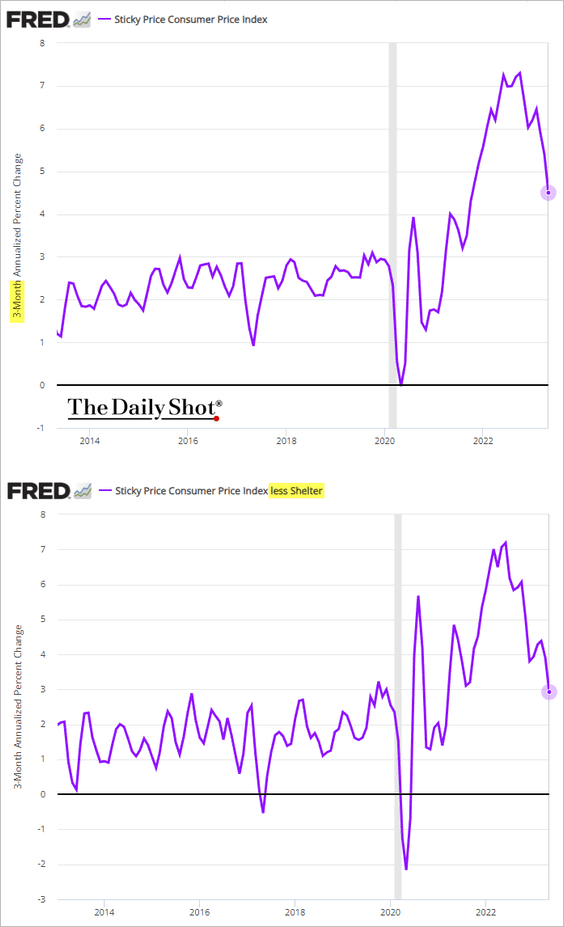
– Sticky inflation:
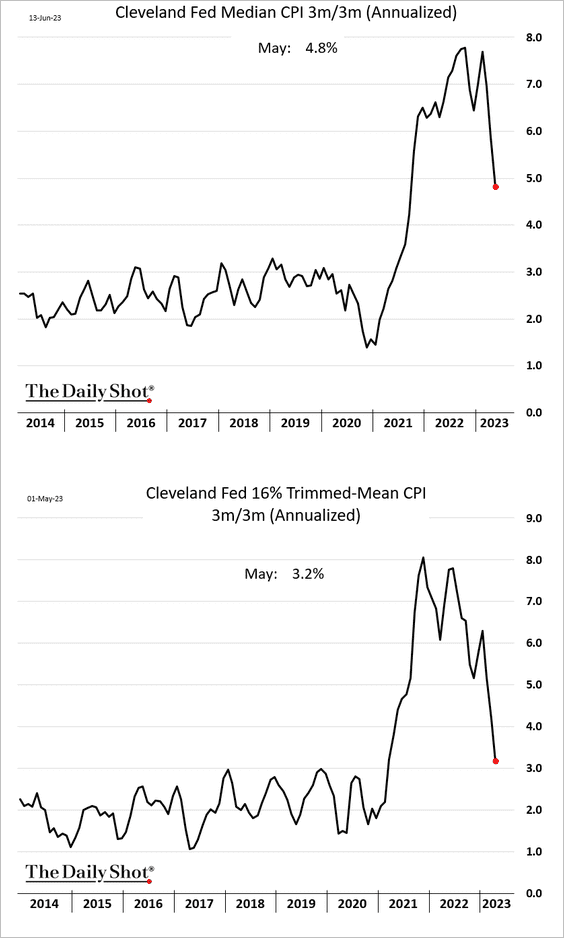
– Median and trimmed-mean CPI:
• Inflation breadth remains elevated.
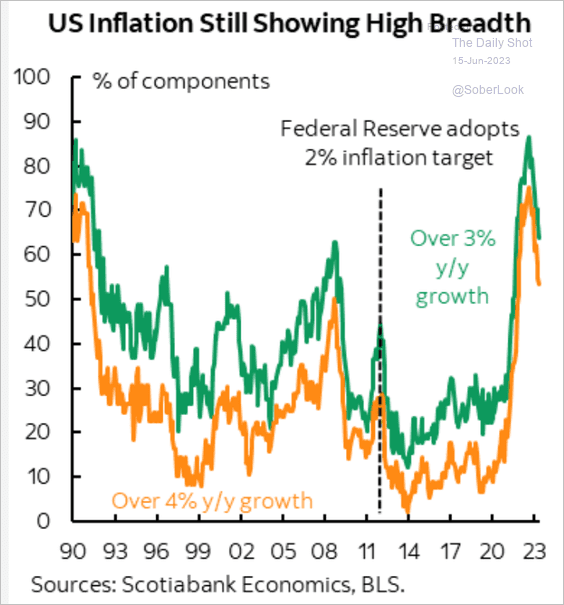 Source: Scotiabank Economics
• Medical services have been a drag on CPI.
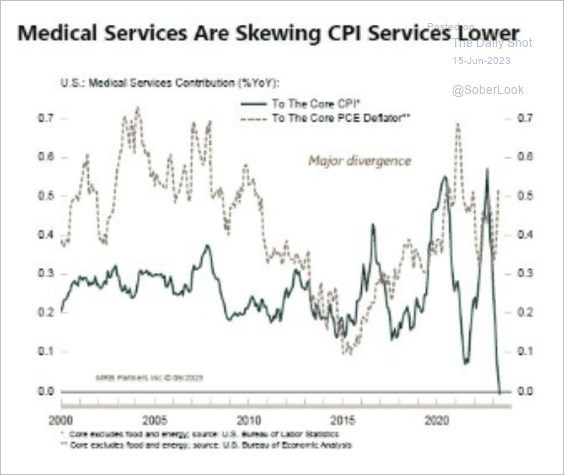 Source: MRB Partners
• A new paper by Ben Bernanke and Olivier Blanchard suggests that labor market imbalances had a limited contribution to the COVID-era inflation shock. “V/U” refers to the ratio of vacancies to unemployment (see chart). Nevertheless, the authors suggest that the impact of overheated labor markets on both nominal wage growth and inflation tends to persist more than the effects of shocks in the product market.
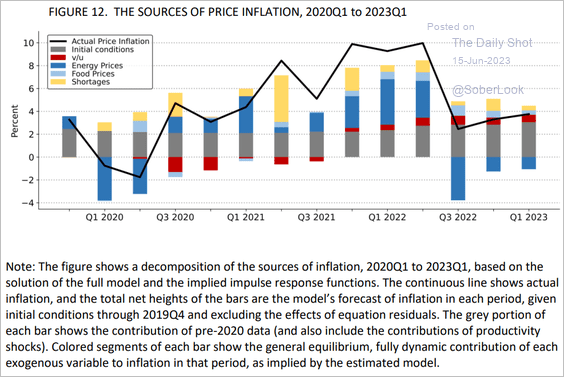 Source: Ben Bernanke and Olivier Blanchard Read full article
We will have more updates on inflation in the days ahead.
——————–
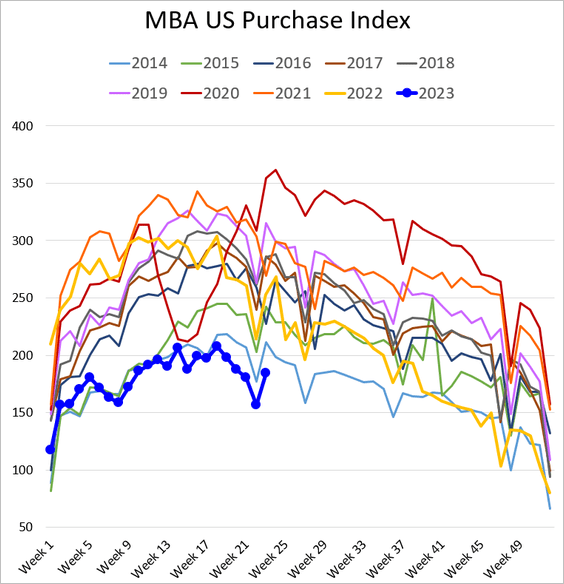
4. Mortgage applications continue to run well below 2014 levels.
Here is the rate-lock count.
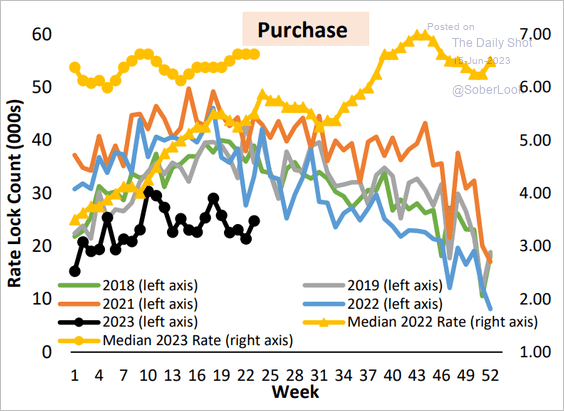 Source: AEI Housing Center
Back to Index
The United Kingdom
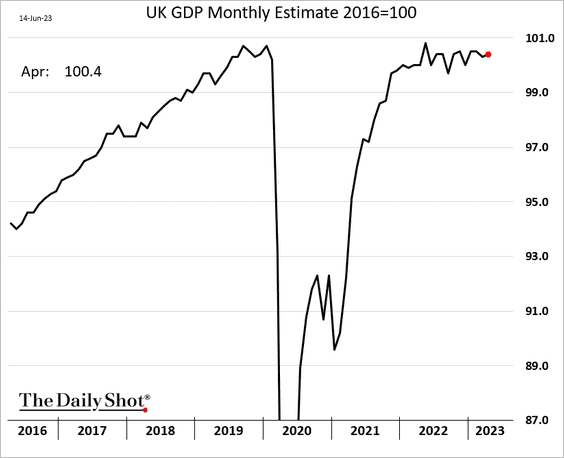
1. The GDP edged higher in April. Economic output has remained (roughly) stagnant for over a year.
But the private sector GDP has been rising.
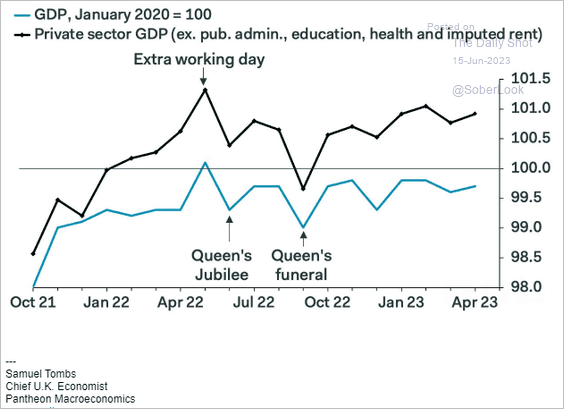 Source: Pantheon Macroeconomics
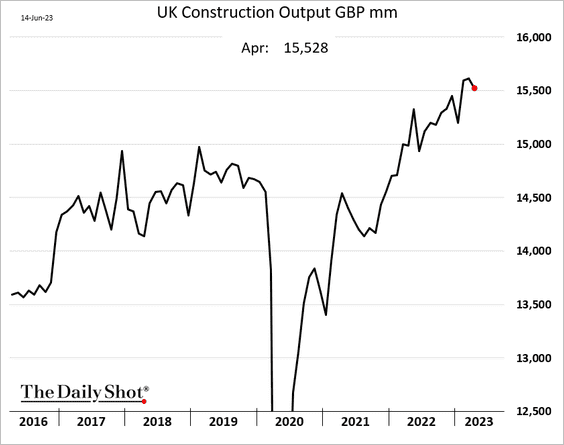
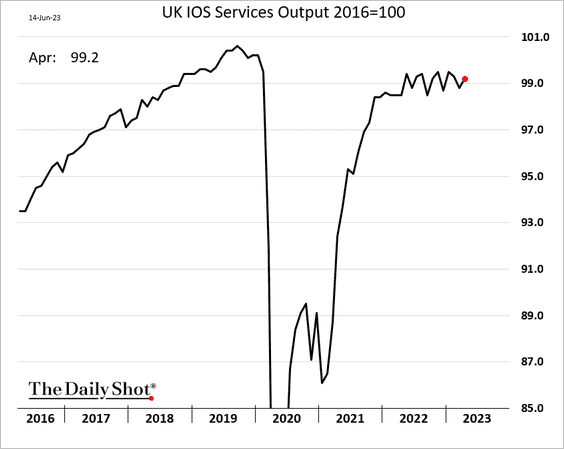
2. Industrial production and construction output declined.
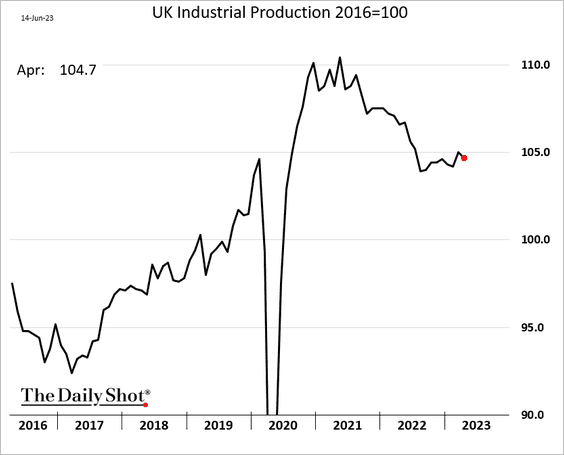
Services output improved slightly.
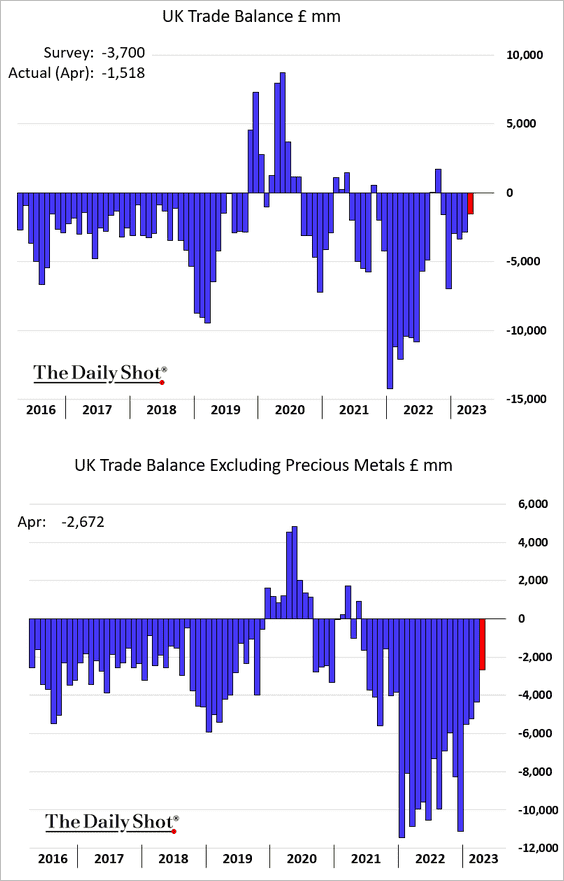
3. The trade deficit narrowed sharply in April.
Back to Index
The Eurozone
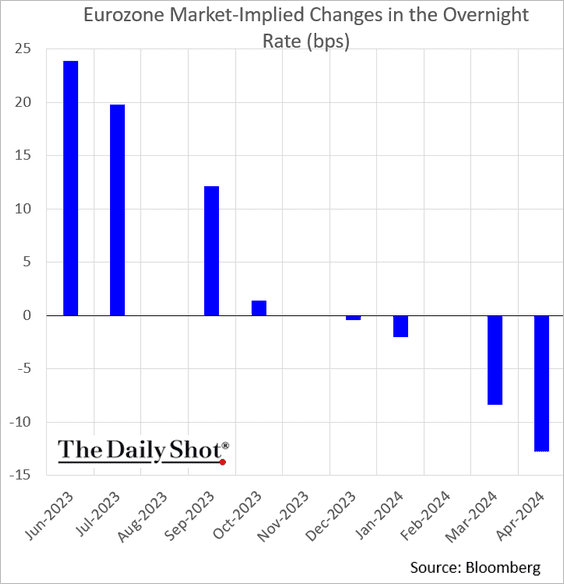
1. The market expects a 25 bps rate hike from the ECB.
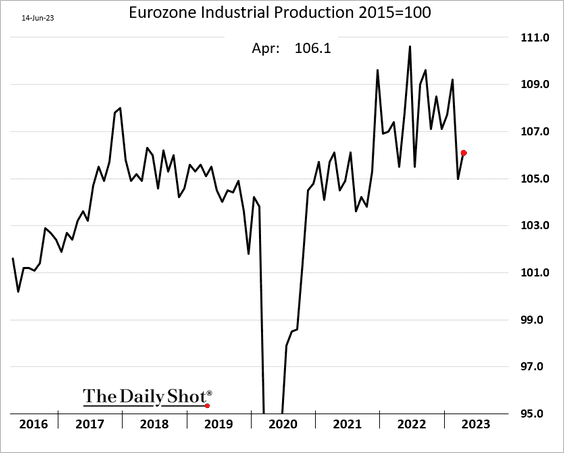
2. Euro-area industrial production improved in April.
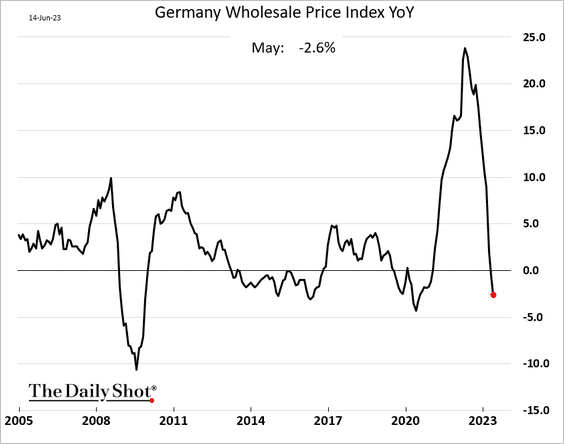
3. Germany’s wholesale price declines accelerated in May.
Separately, Germany’s solar power output hit a record high.
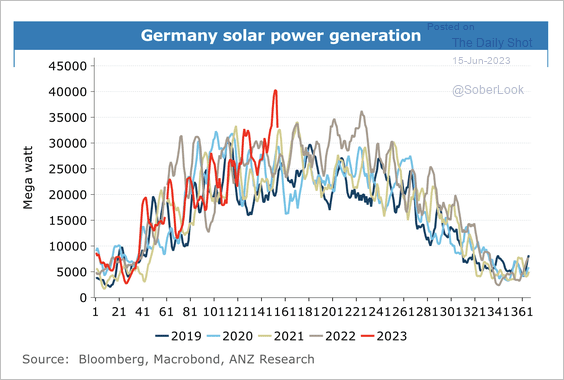 Source: @ANZ_Research
Back to Index
Europe
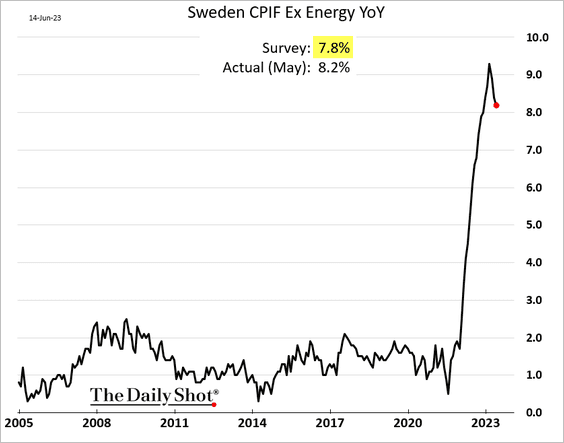
1. Sweden’s core inflation remains stubbornly high, with the May print coming in well above forecasts.
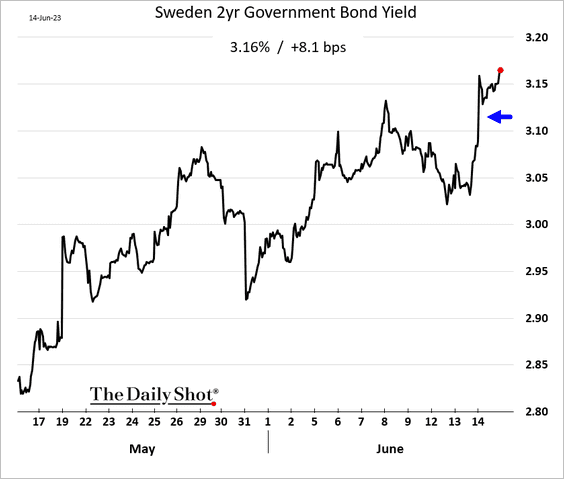
Bond yields climbed.
——————–
2. Next, we have some data on the EU’s trade with Russia.
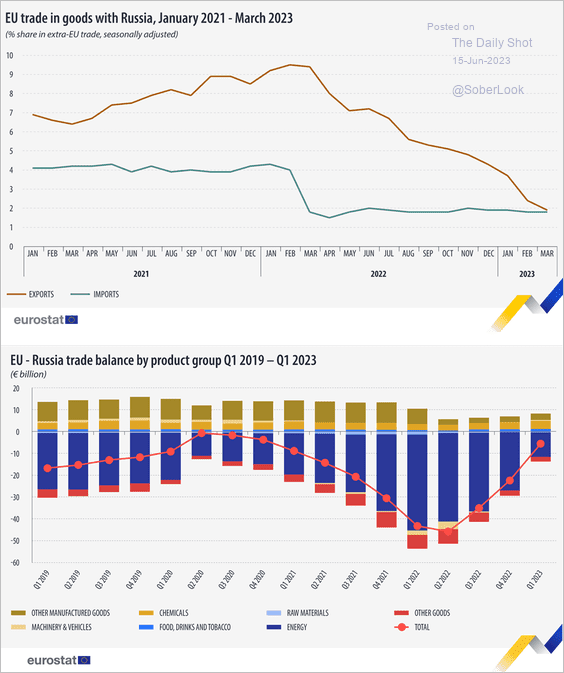 Source: Eurostat Read full article
Back to Index
Japan
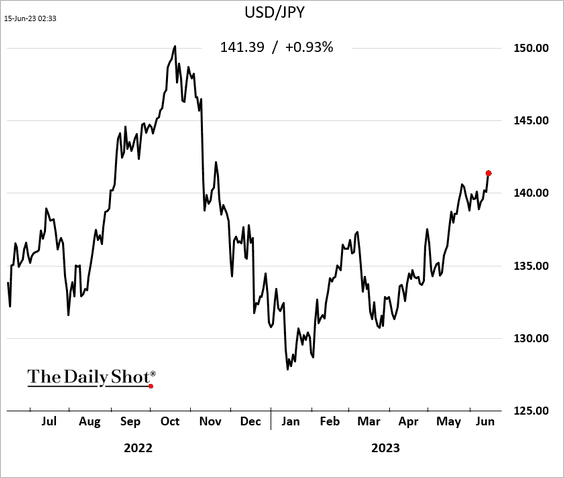
1. The yen is under pressure again.
2. Will the BoJ relax its yield curve control as inflation runs hot?
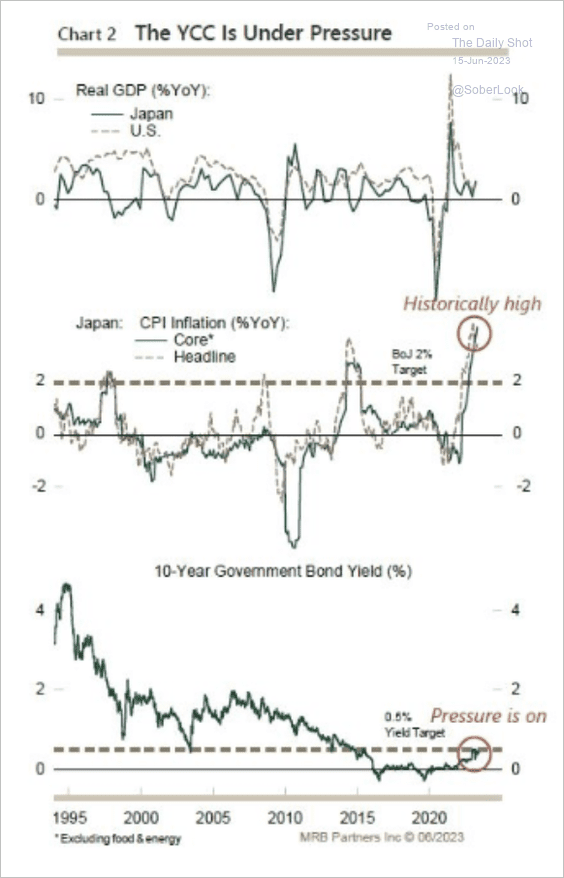 Source: MRB Partners
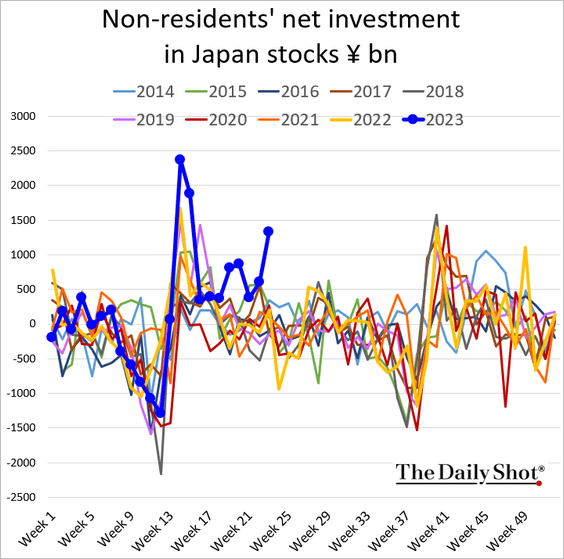
3. Foreign investors’ purchases of Japanese shares surged last week.
4. The trade deficit is narrowing (2 charts).
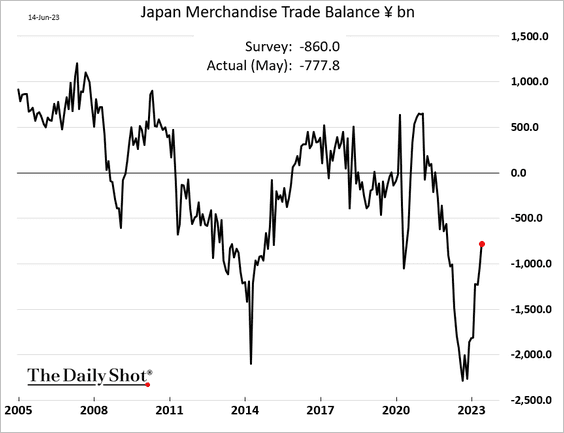
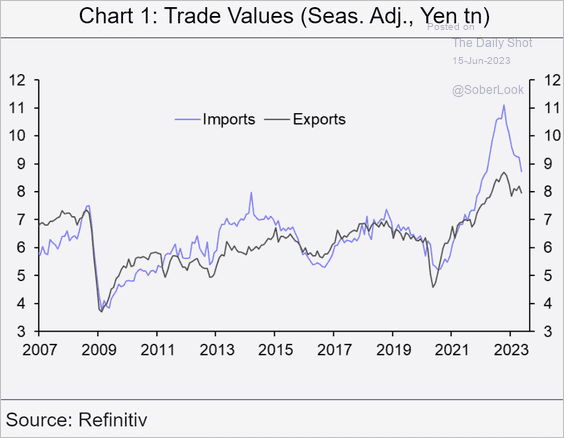 Source: Capital Economics
——————–
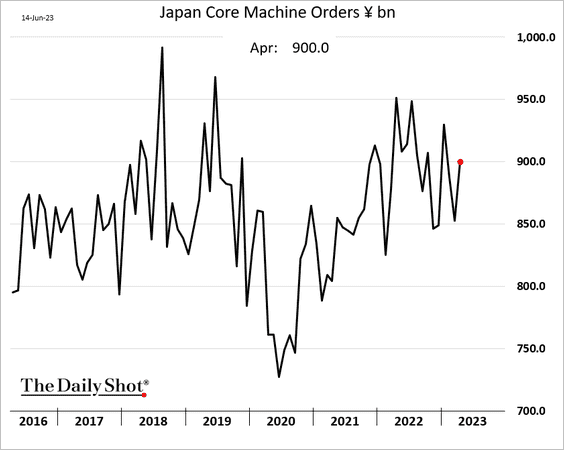
5. Machinery orders bounced in April.
6. Japan’s birth rate hit a record low.
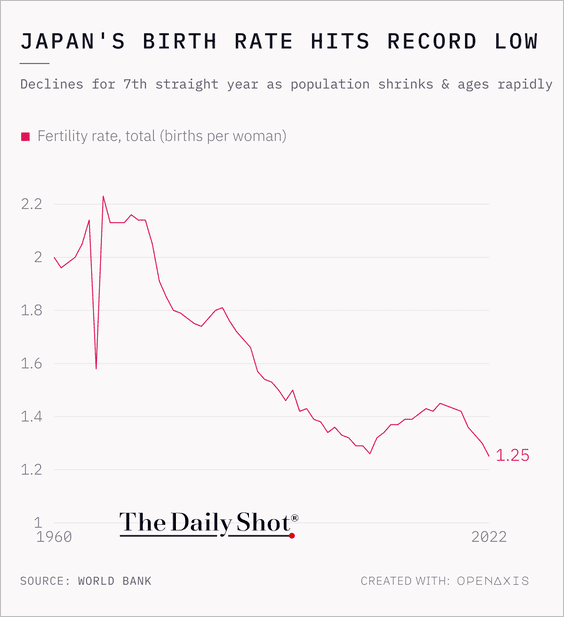 Source: @TheDailyShot
Back to Index
Asia-Pacific
1. South Korean stocks have been outperforming their EM peers as global industrials recover.
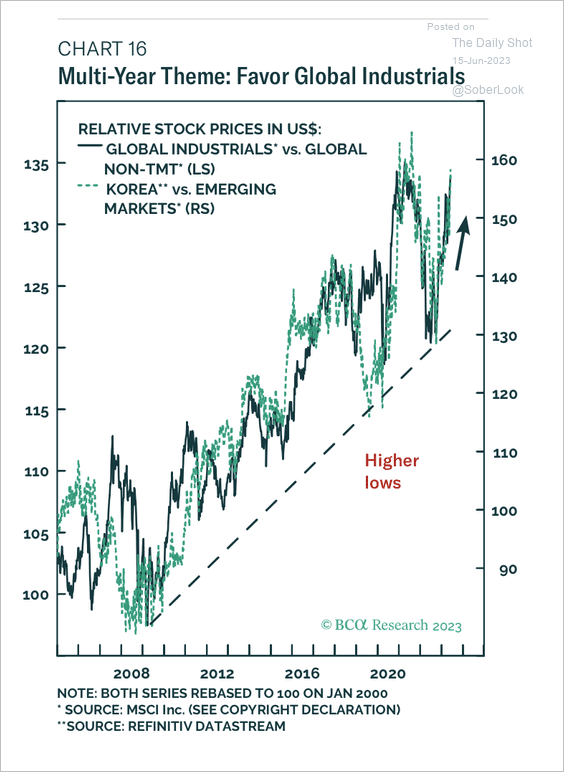 Source: BCA Research
2. New Zealand entered a technical recession in Q1.
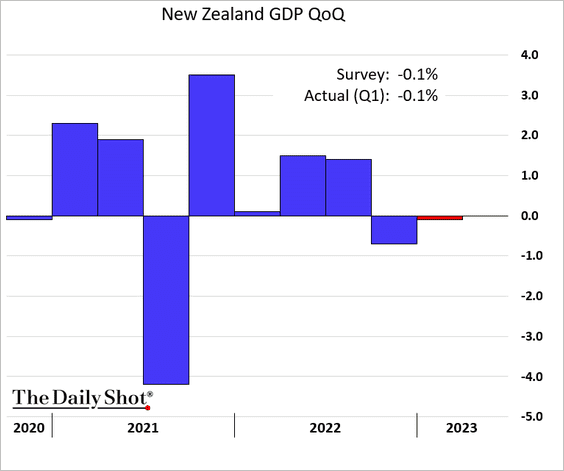
 Source: Reuters Read full article
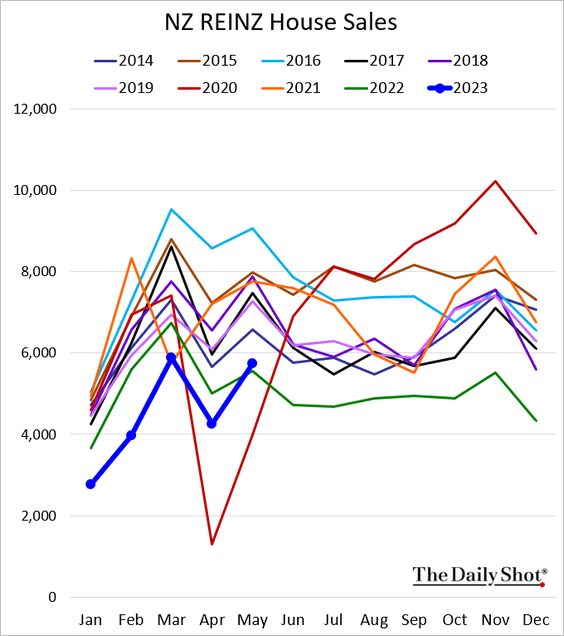
Separately, the nation’s home sales climbed above last year’s levels in May.
——————–
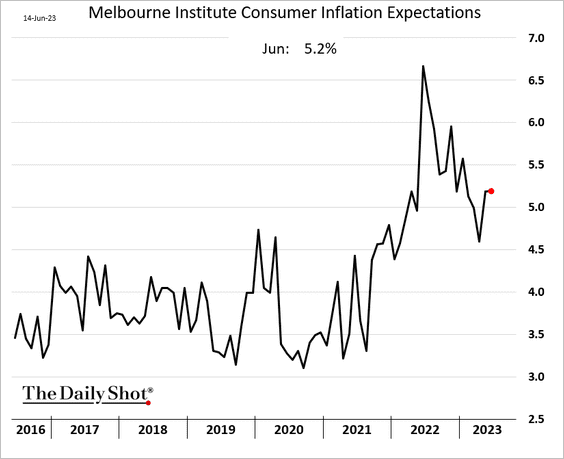
3. Australian consumer inflation expectations remain elevated.
Consumer spending is well below last year’s levels.
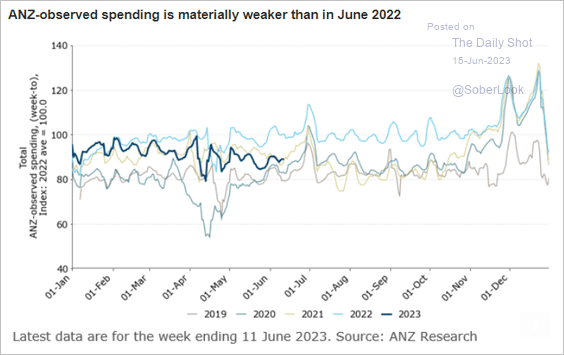 Source: @ANZ_Research
Back to Index
China
1. After cutting its short-term benchmark, the PBoC reduced the 1-year rate, as Beijing embraces stimulus.
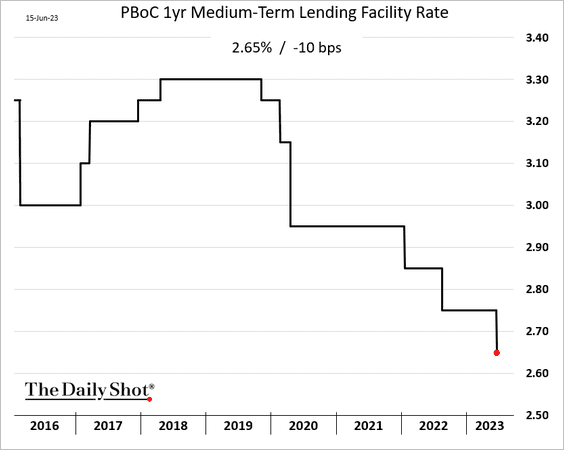
 Source: Reuters Read full article
——————–
2. Investor optimism is fading.
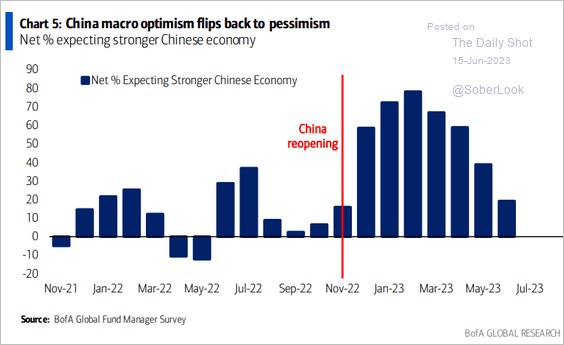 Source: BofA Global Research
3. Spending on grid infrastructure has risen over the past year.
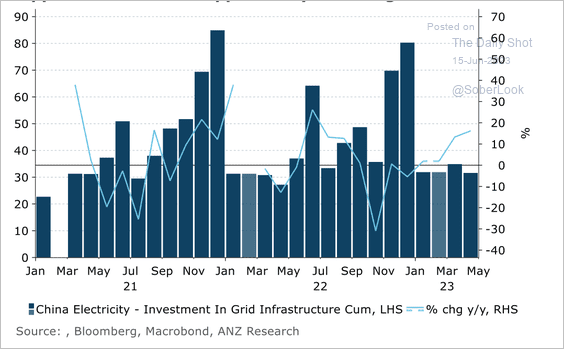 Source: @ANZ_Research
But overall infrastructure investment has slowed.
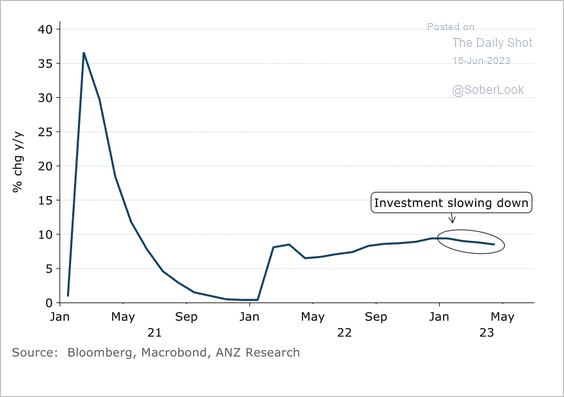 Source: @ANZ_Research
Back to Index
Emerging Markets
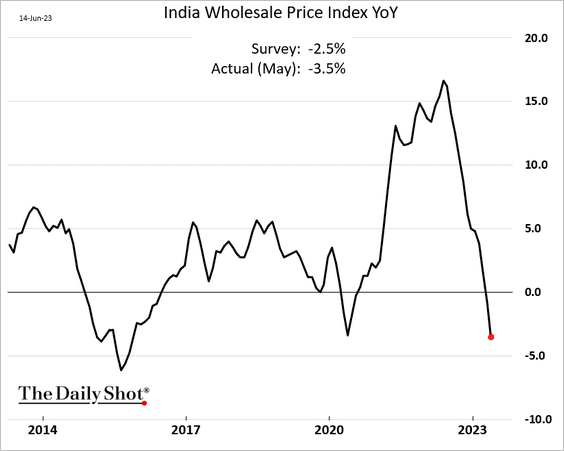
1. India’s wholesale price declines accelerated in May.
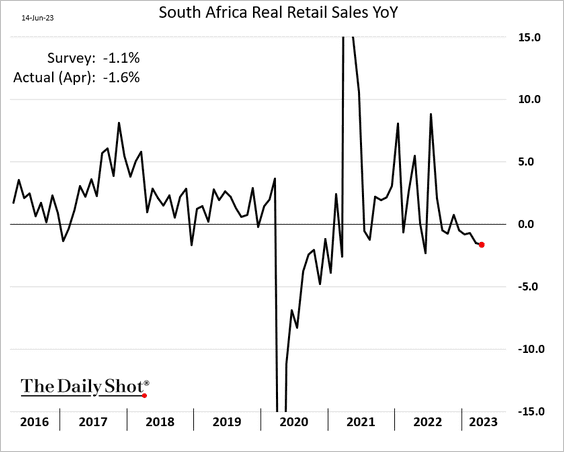
2. South Africa’s retail sales have been weakening.
3. Brazil’s asset prices (stocks, bonds, currency) are rallying.
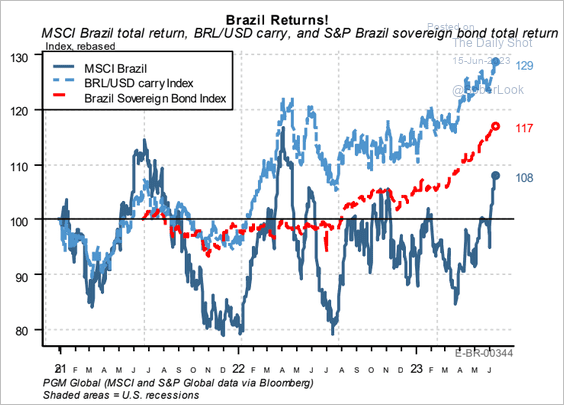 Source: PGM Global
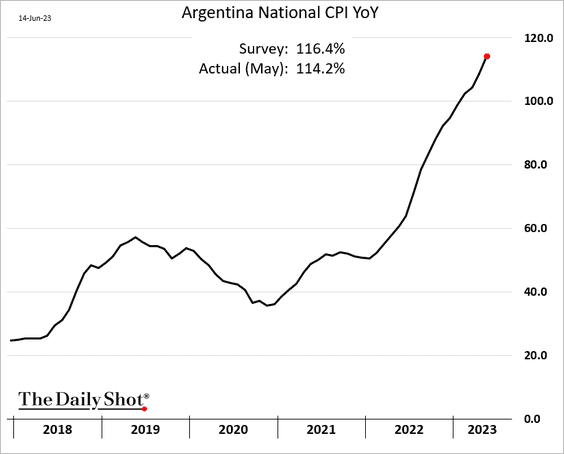
4. Aregentina’s CPI continues to climb, although the latest print was lower than expected.
5. Will EM currencies weaken by the year’s end? Here are the changes implied by the year-end forecasts from Capital Economics.
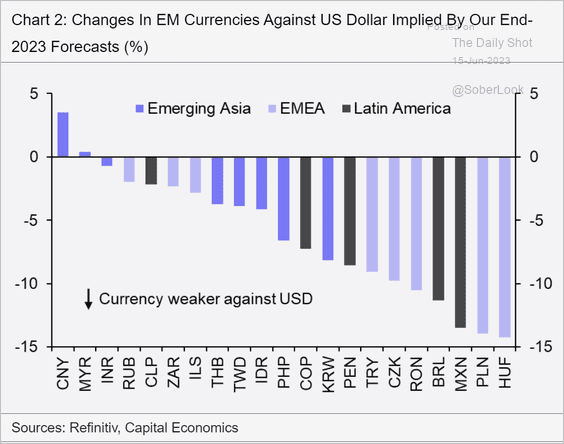 Source: Capital Economics
Back to Index
Cryptocurrency
1. So far, it has been a tough week for cryptos, with bitcoin cash outperforming and ether underperforming.
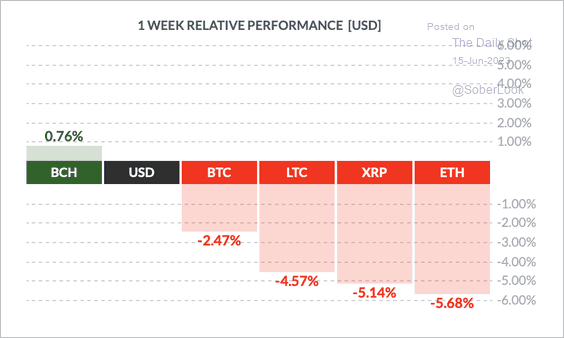 Source: FinViz
• Bitcoin is testing support at $25k, …
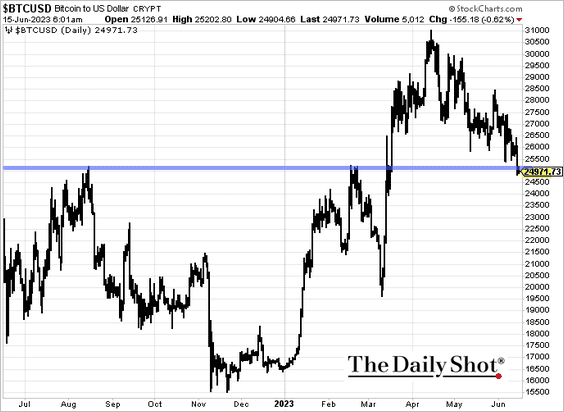
… amid some troubling headlines.
 Source: @sangmi_cha, @Suvajourno
——————–
2. The amount of staked ether surged in May.
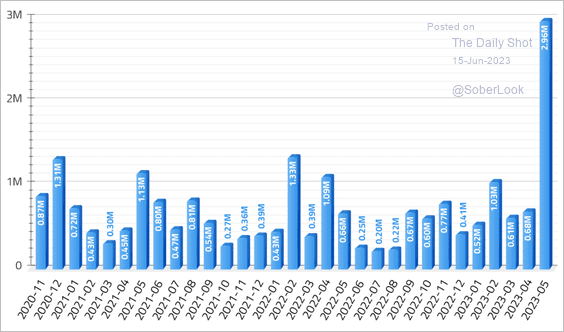 Source: Tradingpedia
3. Crypto liquidity is well off its peak in 2021.
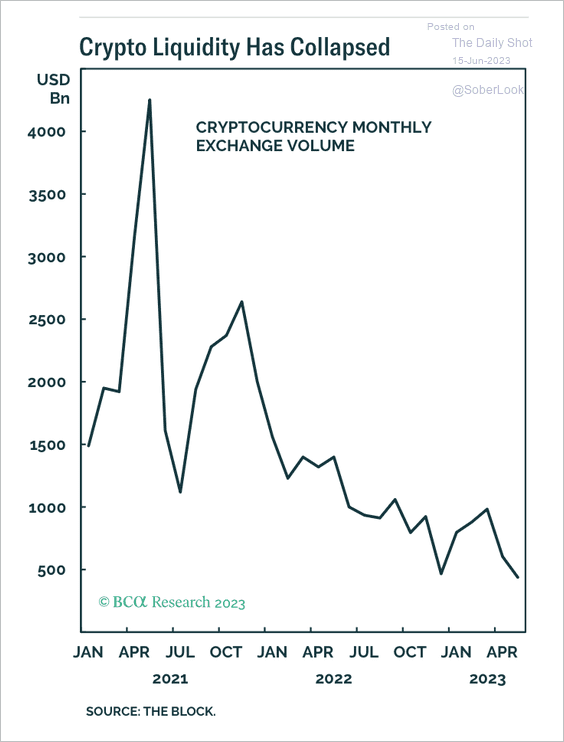 Source: BCA Research
4. The SEC has stepped up its enforcement actions on crypto.
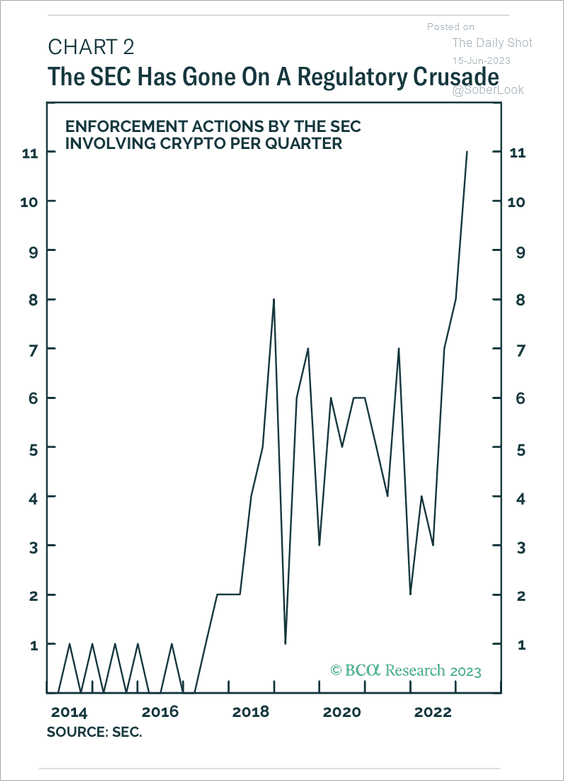 Source: BCA Research
Back to Index
Commodities
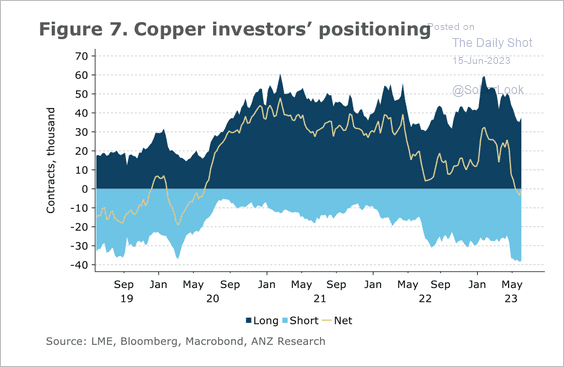
1. Copper prices could stabilize if Chinese demand improves.
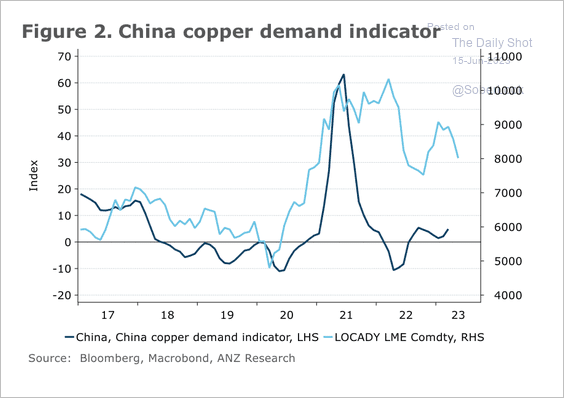 Source: @ANZ_Research
• Speculators are net bearish copper for the first time since early 2020.
 Source: @ANZ_Research
——————–
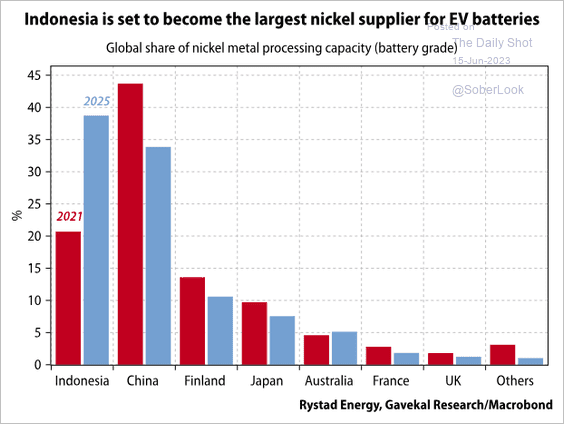
2. Indonesia is set to become the largest nickel supplier.
 Source: Gavekal Research
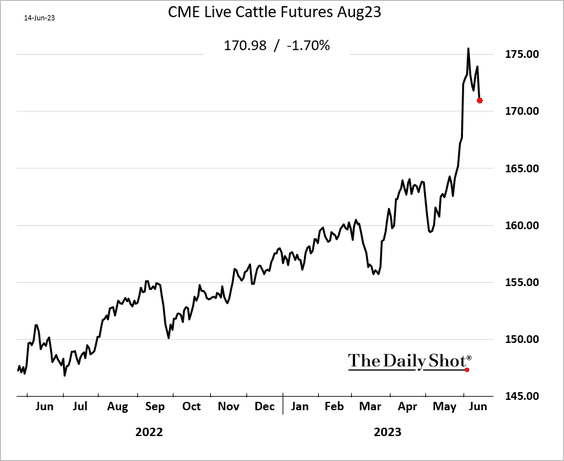
3. Have US cattle futures finally peaked?
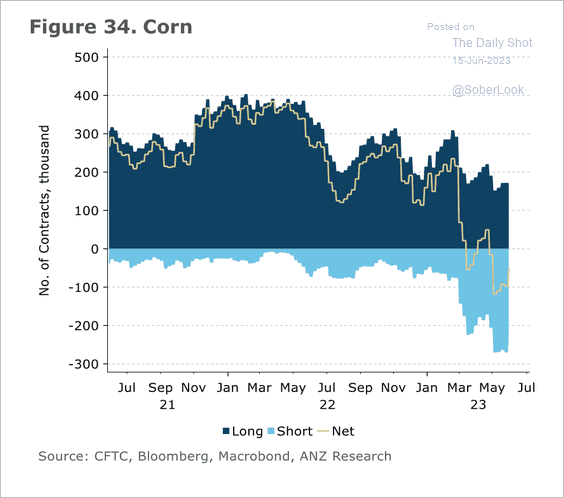
4. Speculators have started to trim their net short corn positions.
 Source: @ANZ_Research
Back to Index
Energy
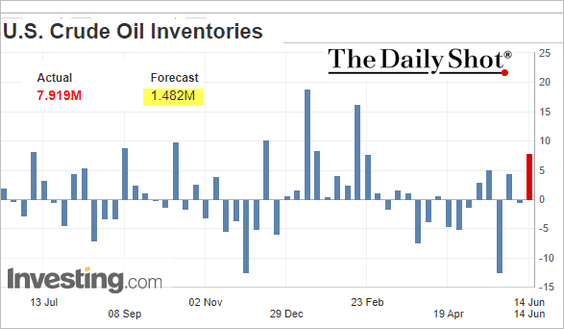
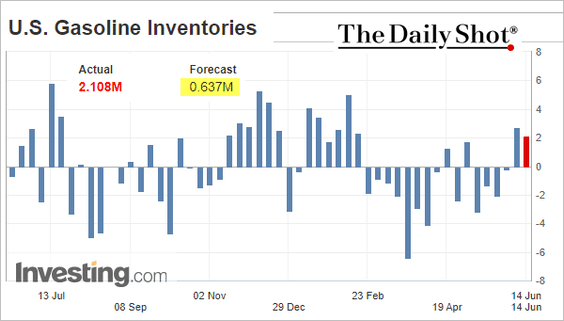
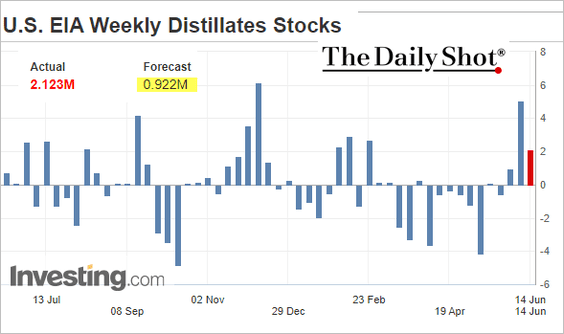
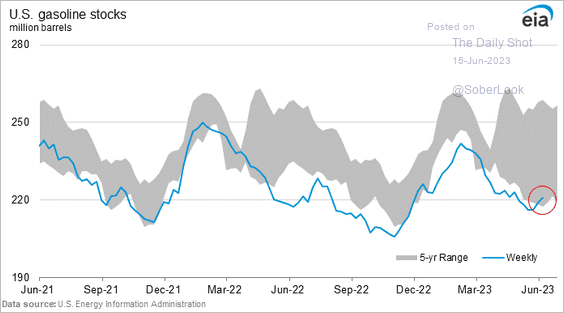
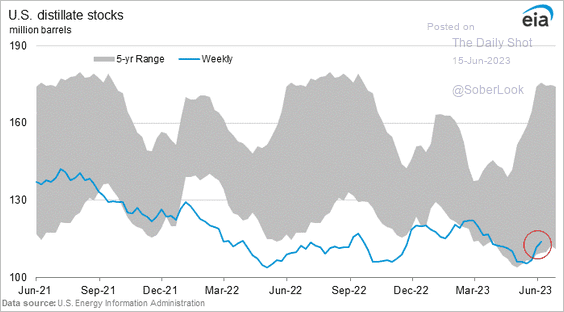
1. US crude oil and refined product inventories jumped more than expected last week.
 Source: Reuters Read full article
• Weekly changes (3 charts):
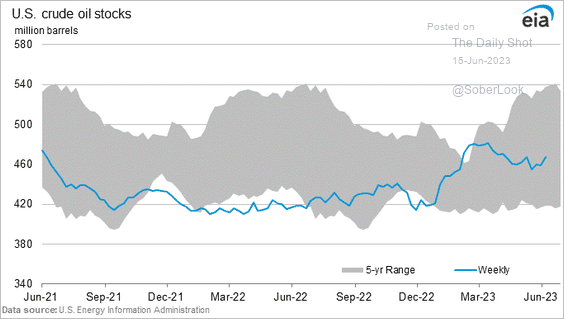
• Inventory levels (3 charts):
——————–
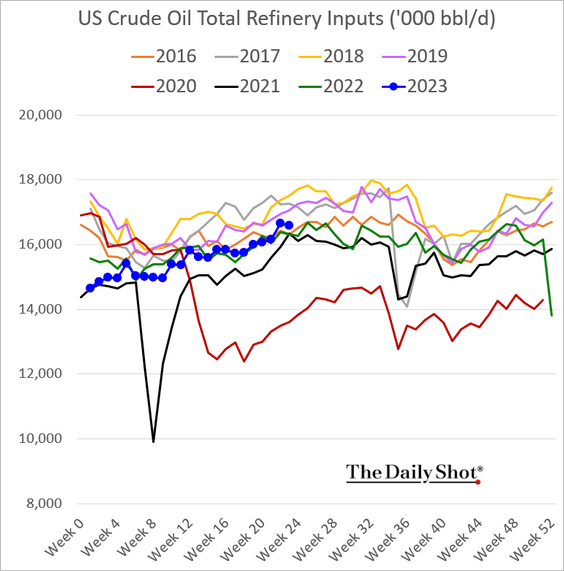
2. Refinery runs remain above last year’s levels.
3. US oil production is holding at the highest level since the COVID shock.
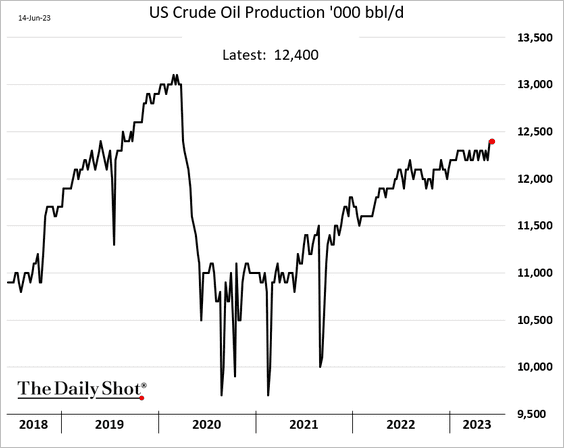
• US oil exports have outpaced rig counts. Production is also ahead of Saudi Arabia and Russia.
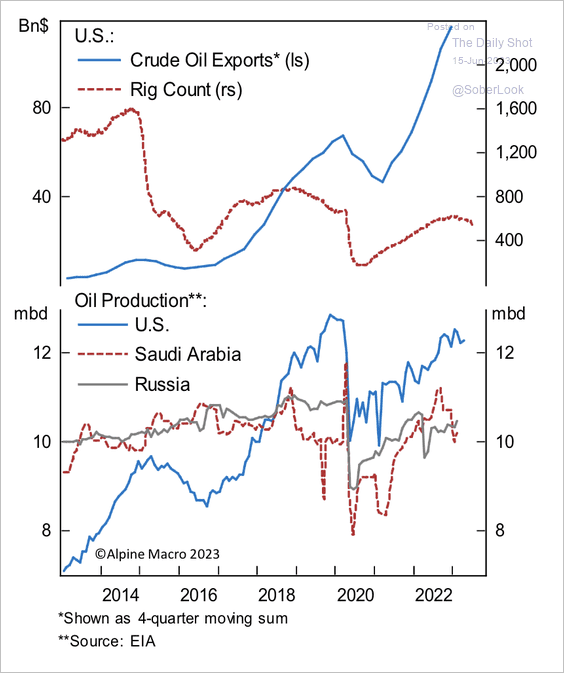 Source: Alpine Macro
——————–
4. Growth in global oil demand is expected to slow.
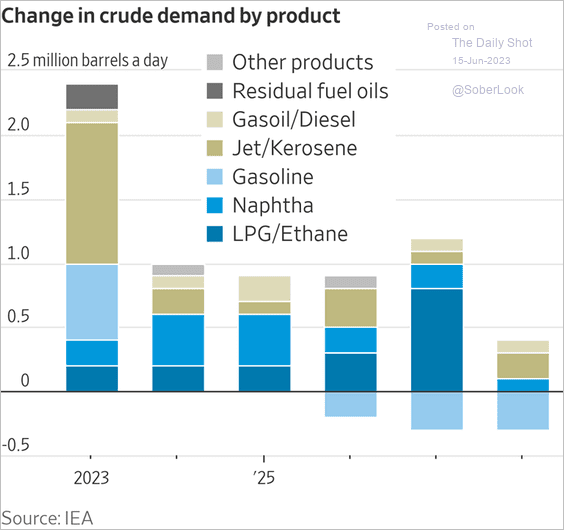 Source: @WSJ Read full article
Back to Index
Equities
1. Small caps appear to be cheap and oversold.
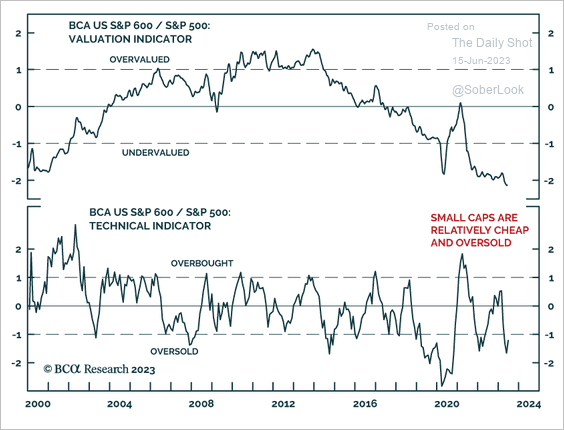 Source: BCA Research
2. Margin debt has been declining as a percentage of the S&P 500 market cap.
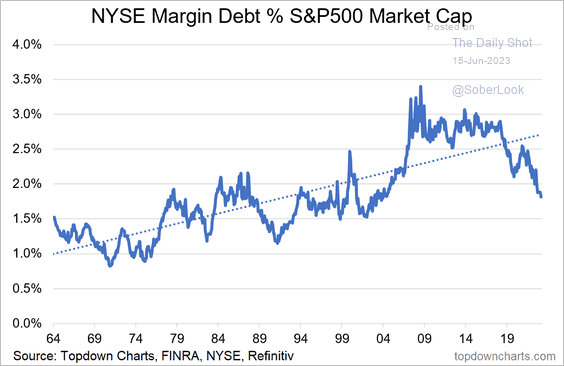 Source: @Callum_Thomas, @topdowncharts
3. The Investment Manager Index from S&P Global indicates thawing sentiment.
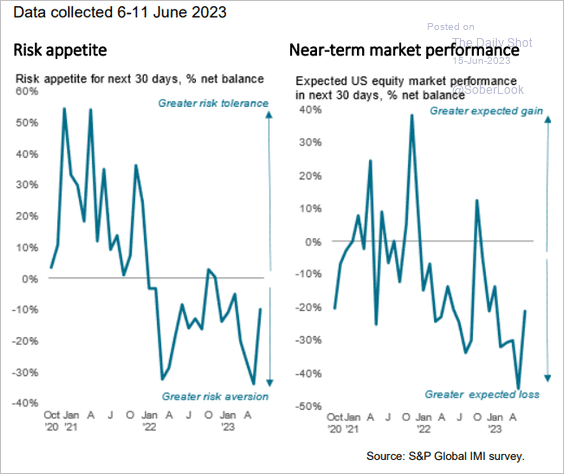 Source: S&P Global Market Intelligence
Here is sentiment by sector.
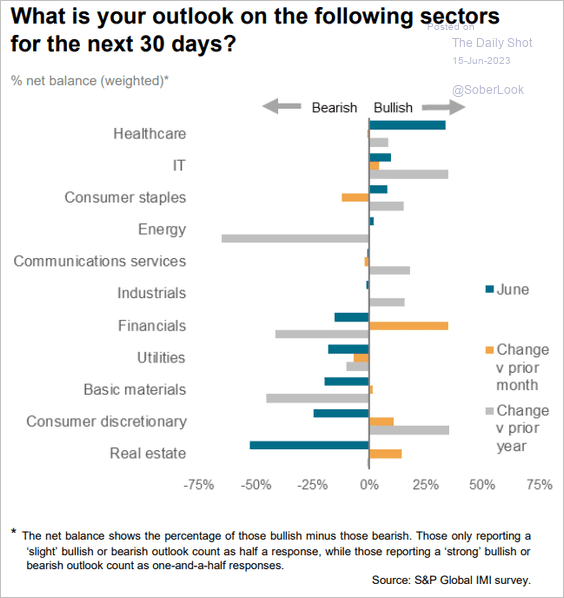 Source: S&P Global Market Intelligence
——————–
4. Households’ allocations to stocks remain elevated.
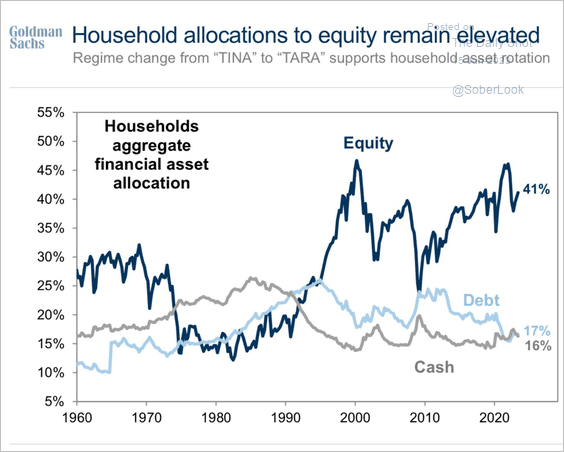 Source: Goldman Sachs
5. Fund managers remain uneasy about real estate.
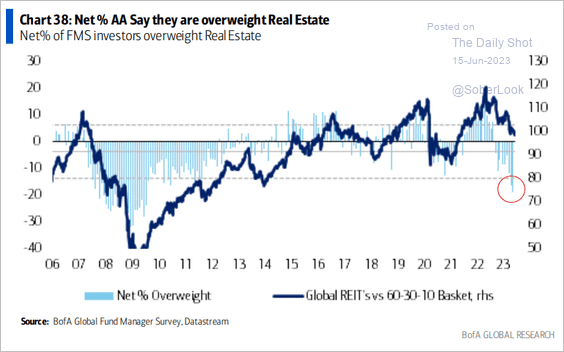 Source: BofA Global Research
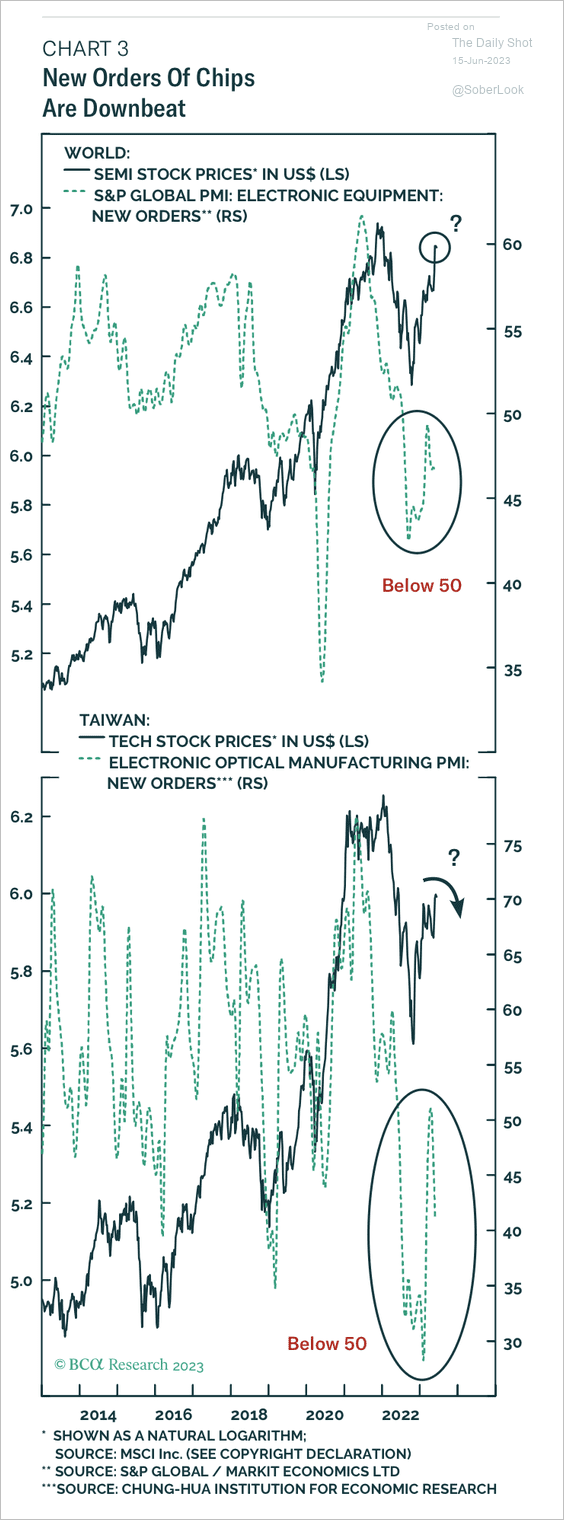
6. Semiconductor stocks have rallied despite the deep drop in global sales. (2 charts)
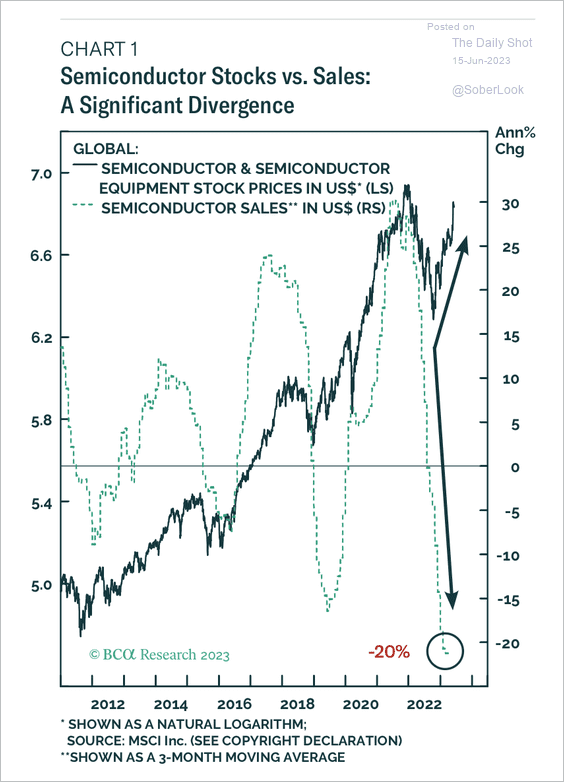 Source: BCA Research
 Source: BCA Research
• A similar divergence is seen in the memory market.
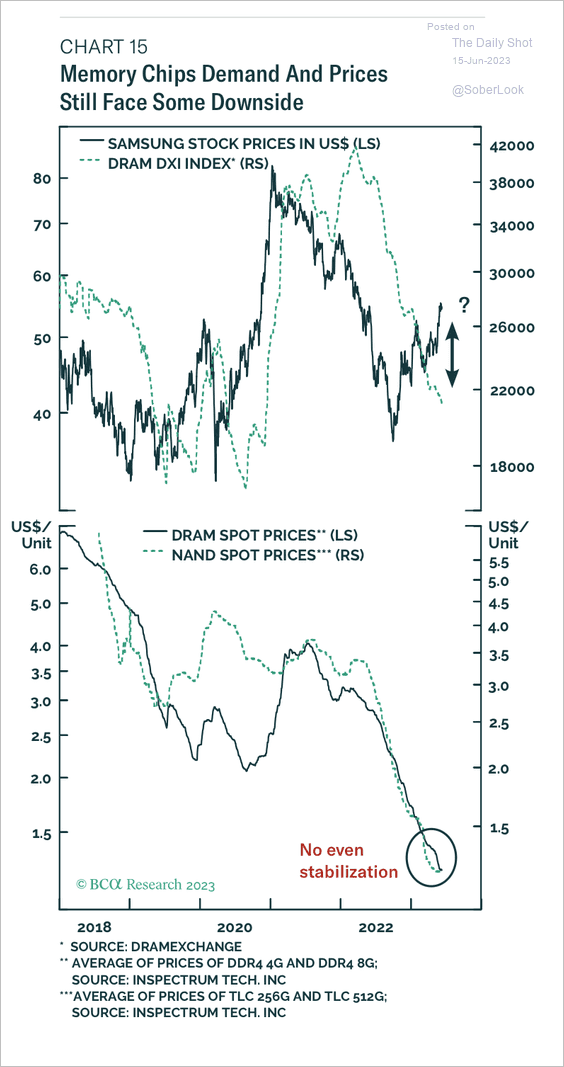 Source: BCA Research
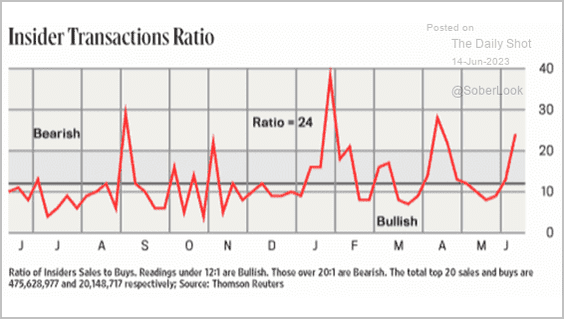
7. Correction: Yesterday’s comment on this chart should say, “Insiders have been selling.”
Back to Index
Credit
1. Bank insiders have been buying shares.
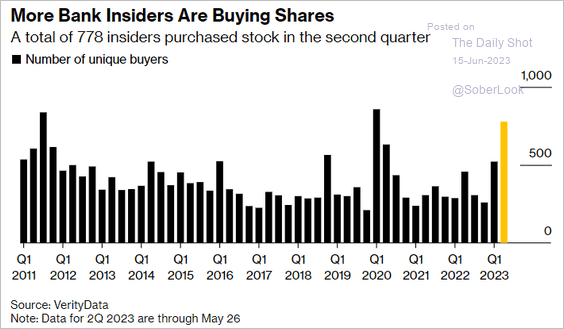 Source: @tanaz115, @business Read full article
2. Leveraged loan defaults have been rising in 2023.
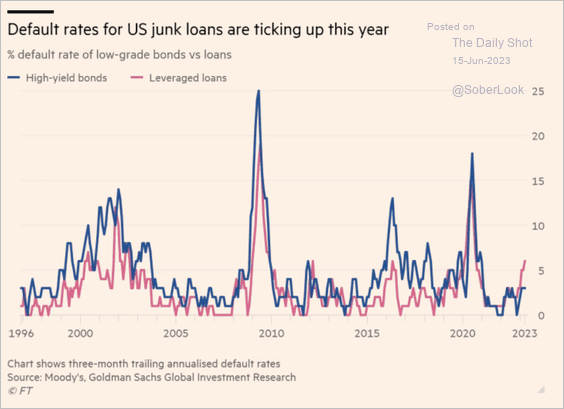 Source: @financialtimes Read full article
• Deutsche Bank predicts substantial credit downgrades in CLO collateral this year.
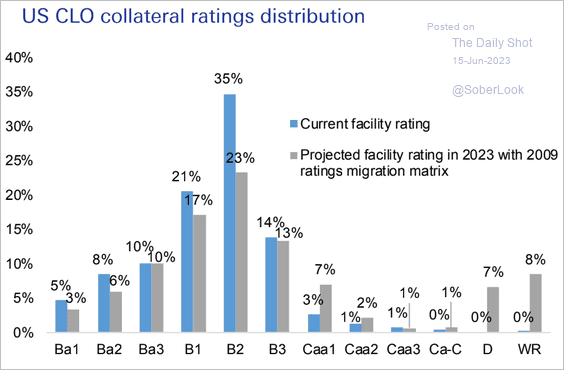 Source: Deutsche Bank Research
——————–
3. Middle market loan issuance surged this year amidst more stringent conditions in other funding sources.
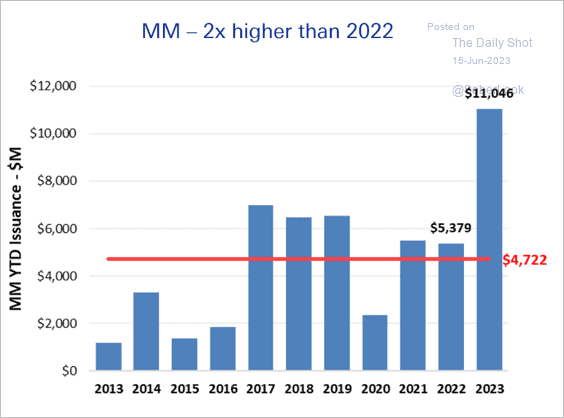 Source: Deutsche Bank Research
Back to Index
Global Developments
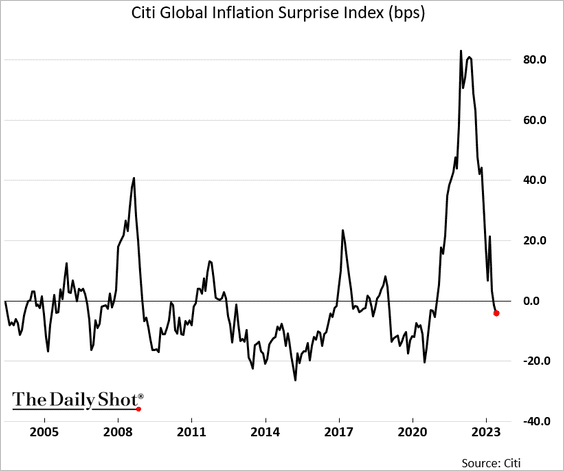
1. In a number of countries, the reported inflation has been below expectations.
2. Here is a look at wage growth based on job ads for select economies.
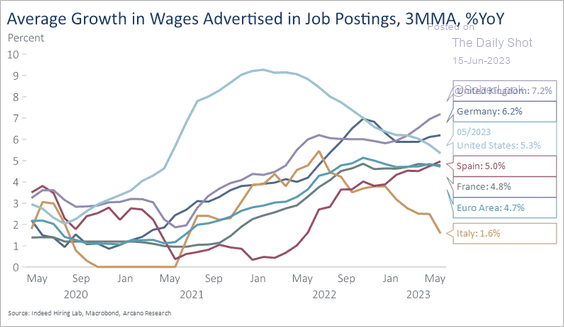 Source: Arcano Economics
——————–
Food for Thought
1. Fewer “super commuters”:
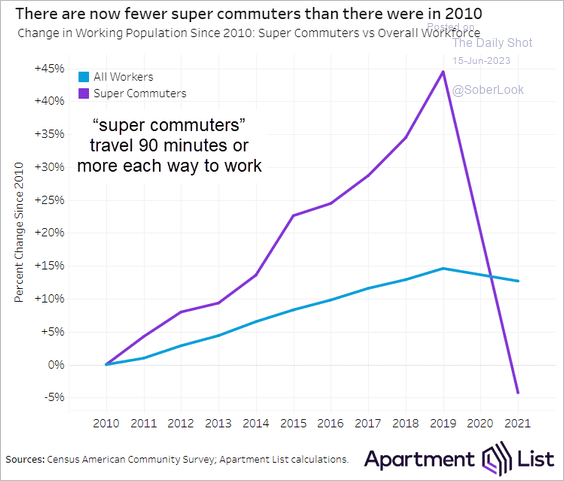 Source: Apartment List Read full article
2. The Conference Board’s job satisfaction survey:
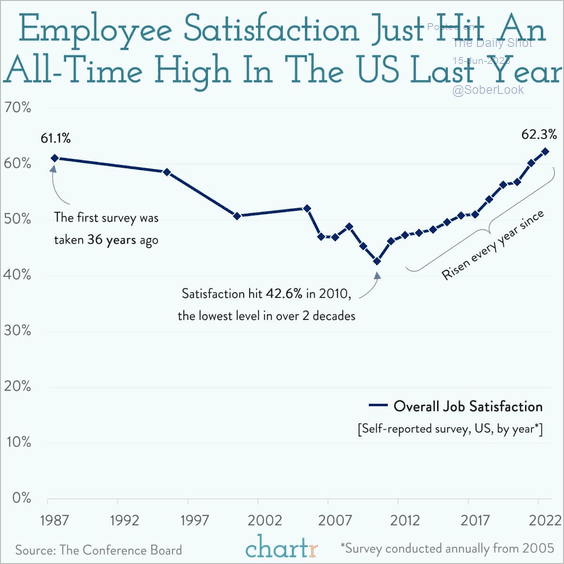 Source: @chartrdaily
3. Views on artificial intelligence:
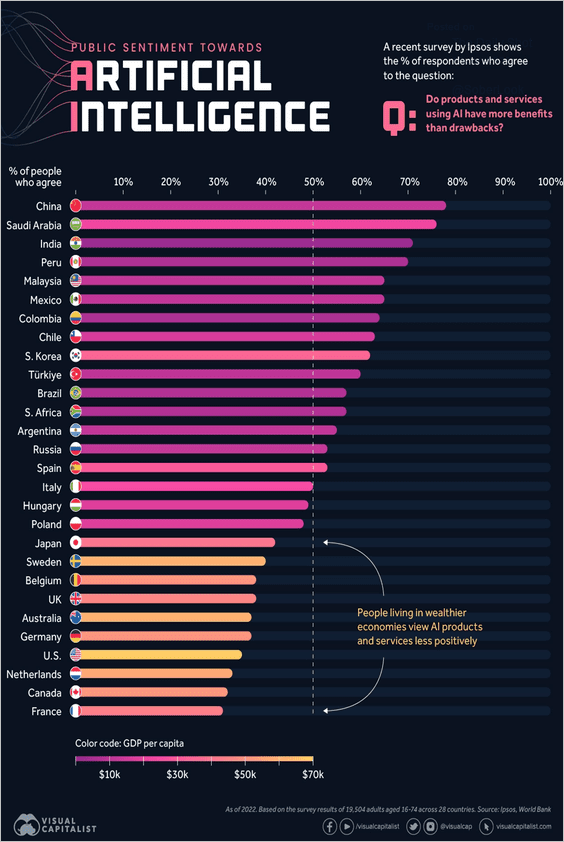 Source: Visual Capitalist Read full article
4. Semiconductor node size:
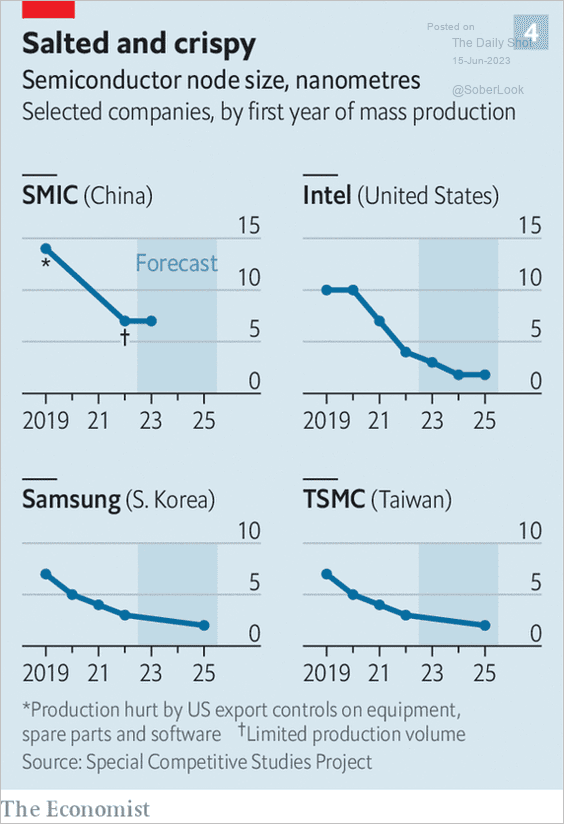 Source: The Economist Read full article
5. How much time do Americans spend online?
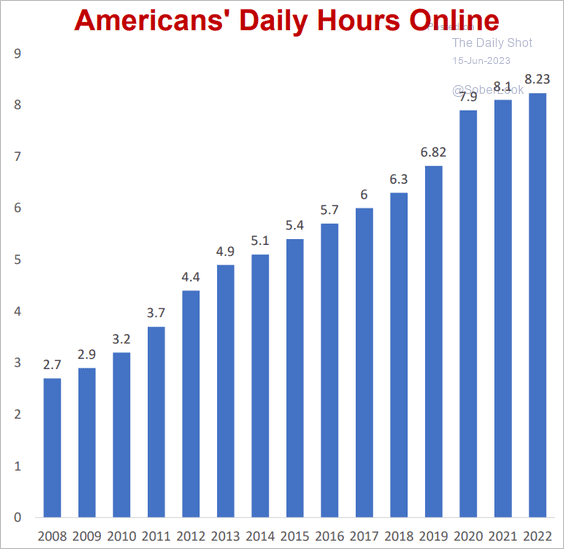 Source: Bruce Mehlman
6. Wealth held by each generation:
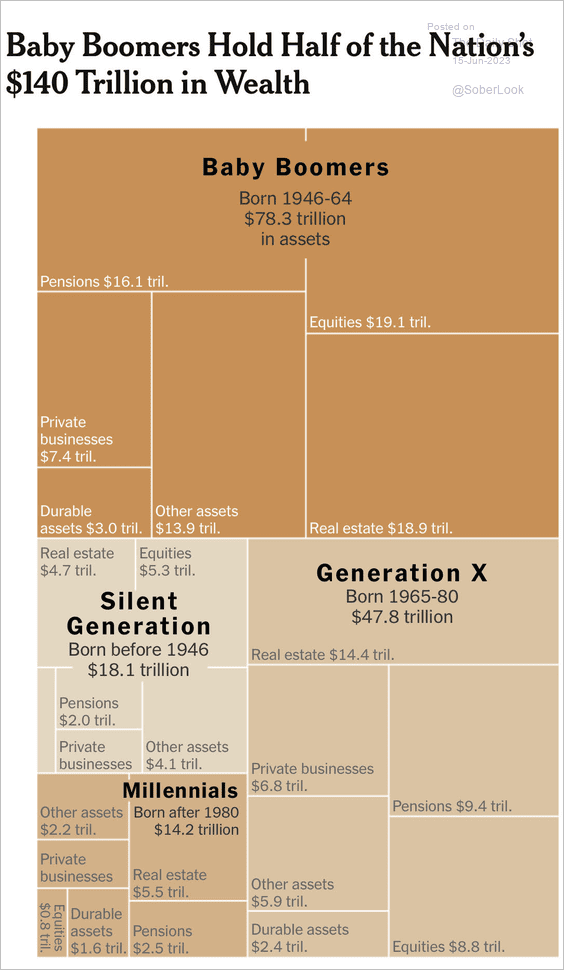 Source: The New York Times Read full article
7. What has been fueling hostility towards Asian Americans?
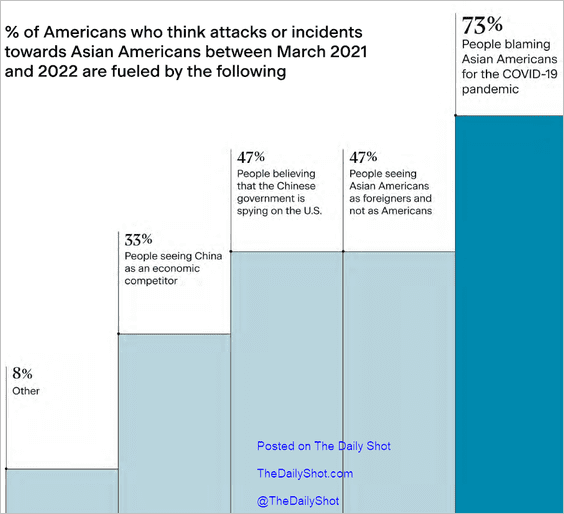 Source: STAATUS Index
8. Medicaid disenrollment:
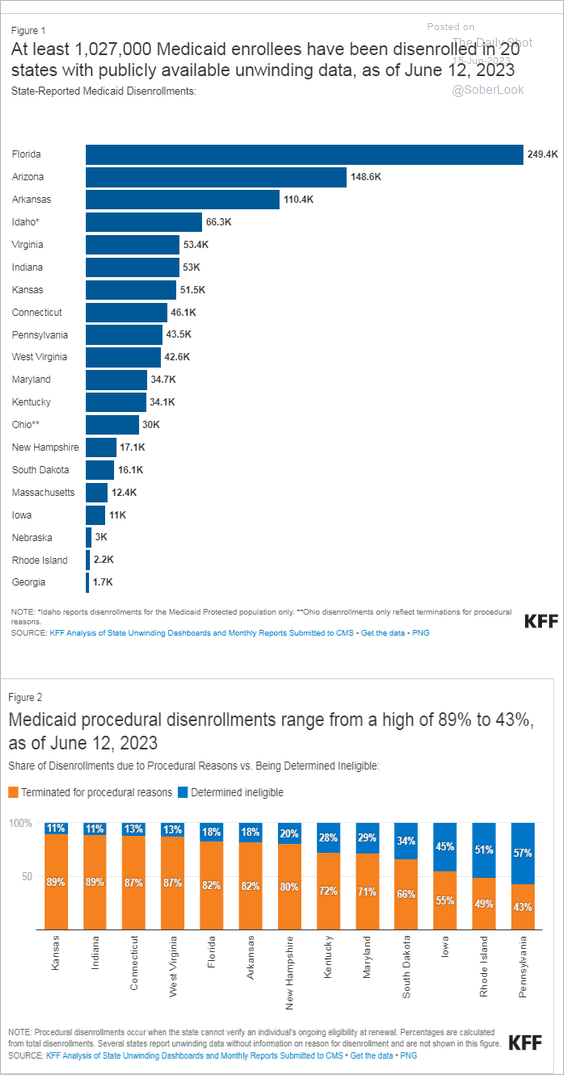 Source: KFF Read full article
9. Deporting migrants without a court hearing:
 Source: @YouGovAmerica
10. Ukraine’s grain shipments:
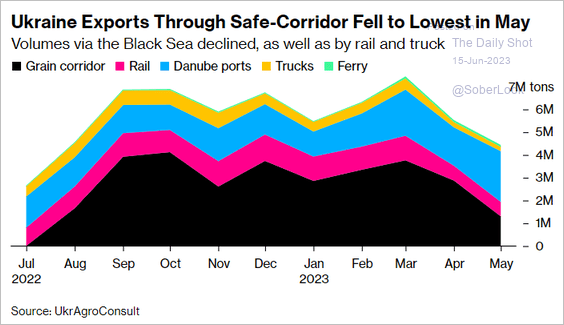 Source: @markets Read full article
11. US flag history:

——————–
Back to Index