
The Daily Shot: 16-Jun-23
• The United States
• Canada
• The Eurozone
• Japan
• Asia-Pacific
• China
• Emerging Markets
• Cryptocurrency
• Commodities
• Energy
• Equities
• Credit
• Rates
• Food for Thought
The United States
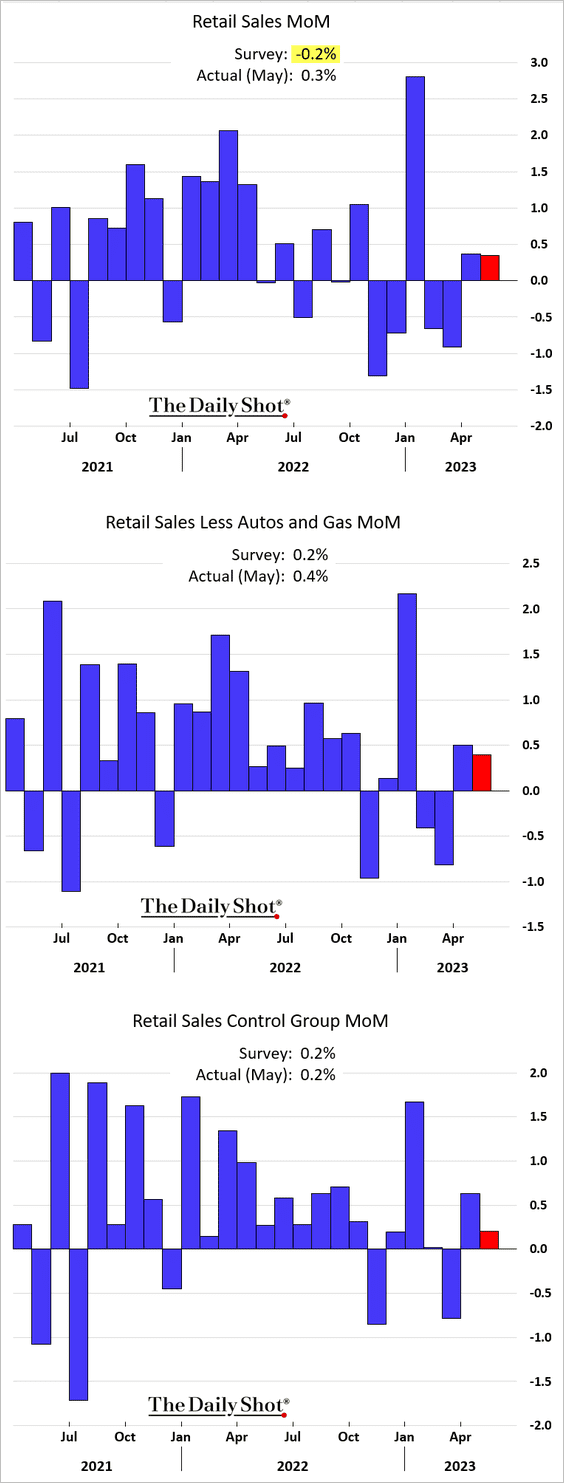
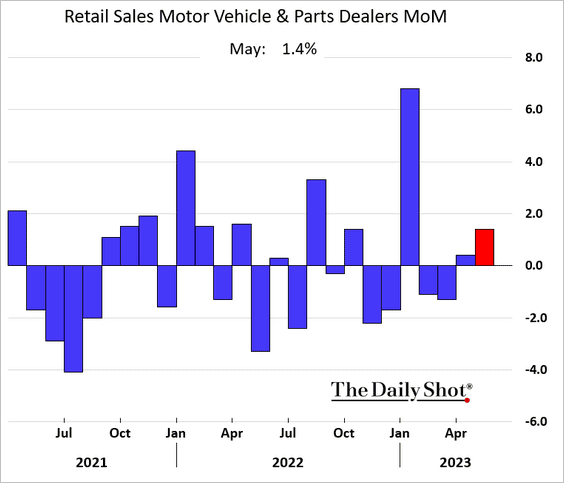
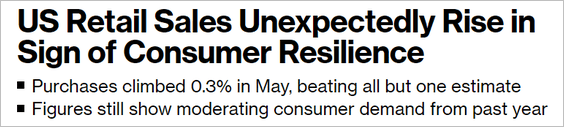
1. Retail sales unexpectedly increased in May.
Car sales climbed.
 Source: @gutavsaraiva, @economics Read full article
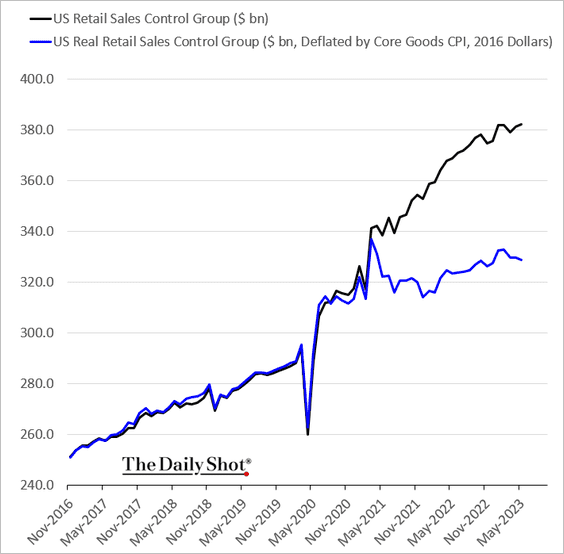
• When adjusted for inflation, total retail sales also showed an increase.
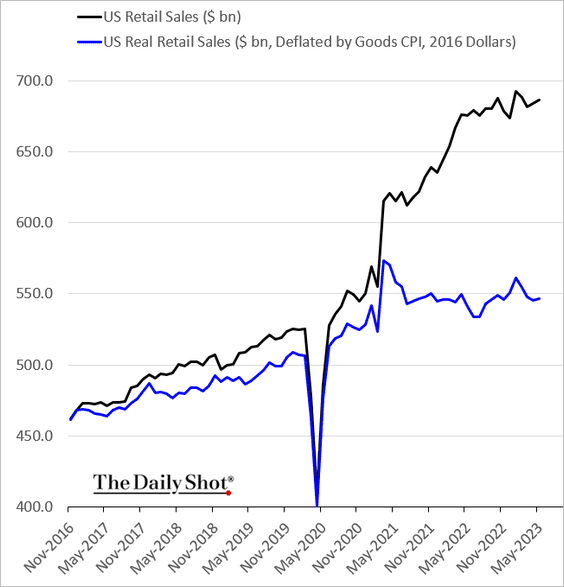
But real retail sales “control group” (core retail sales) continue to fall.
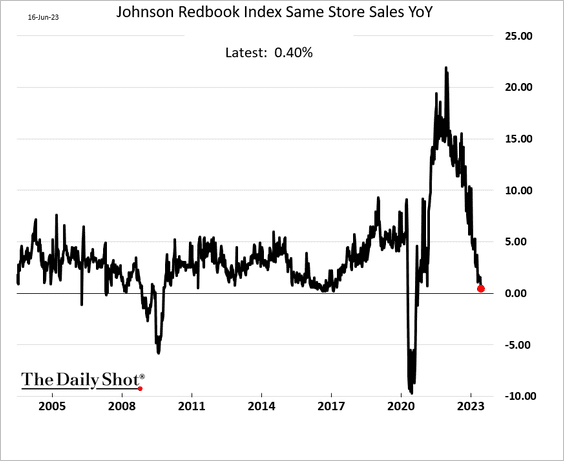
• Separately, the Johnson Redbook same-store sales index is now almost flat vs. 2022.
• Tighter credit conditions will be a headwind for retail sales going forward.
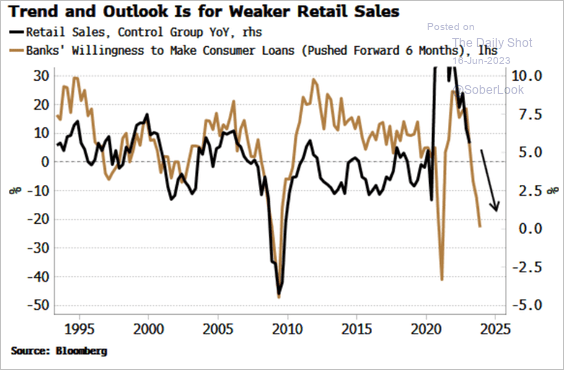 Source: Simon White, Bloomberg Markets Live Blog
——————–
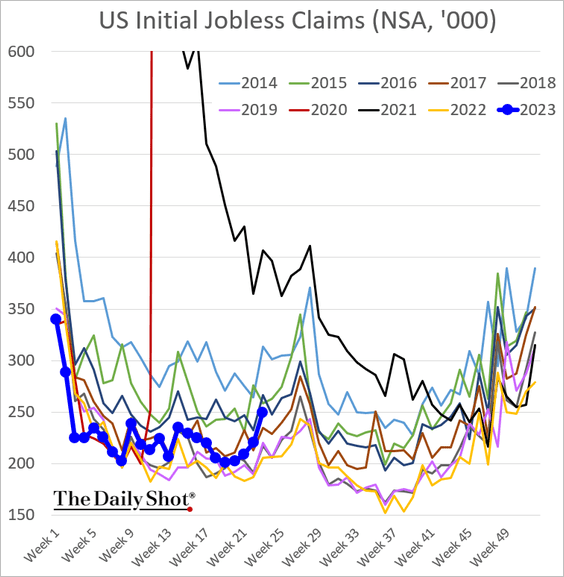
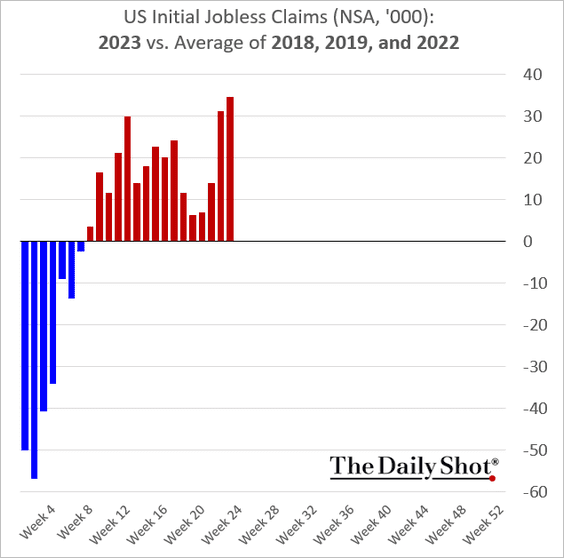
2. Jobless claims remain elevated relative to last year.
 Source: AP News Read full article
Here are the year-over-year changes.
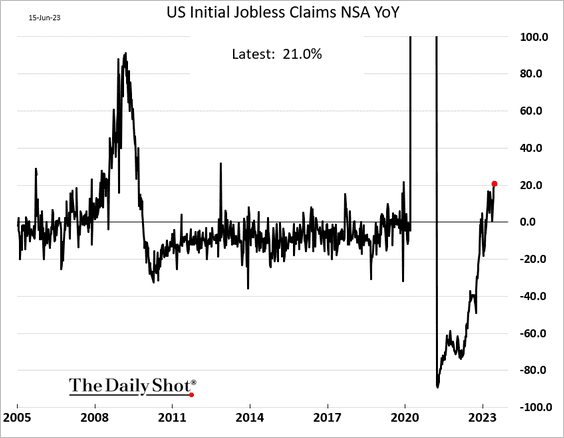
While we’ve had some noise in these reports, this is starting to look like a signal.
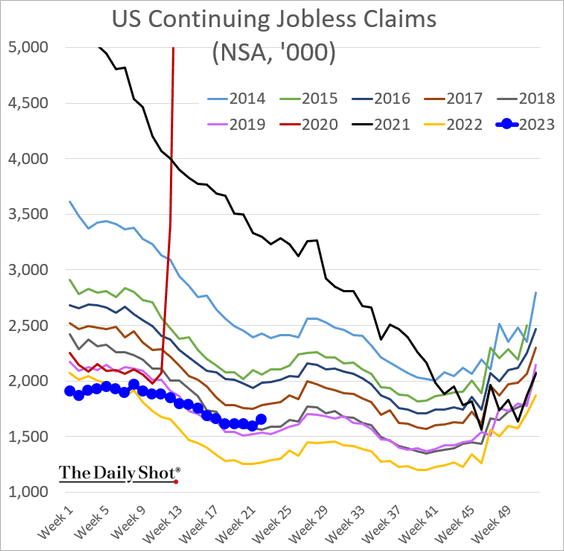
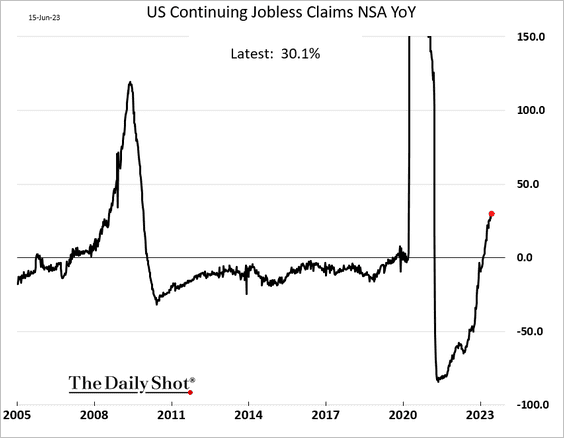
• Continuing claims are now 30% above last year’s levels.
• The NY Fed’s consumer survey shows Americans are not too concerned about job loss – for now.
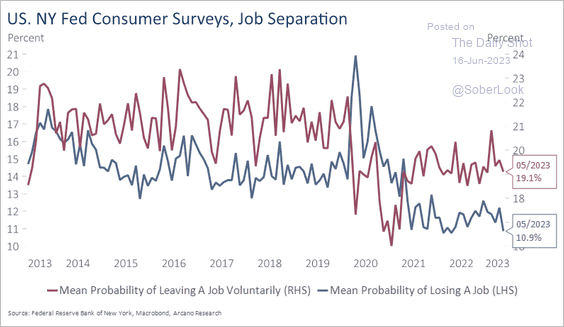 Source: Arcano Economics
——————–
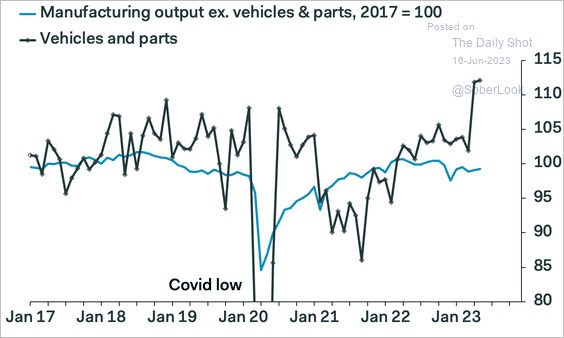
3. Industrial production declined last month due to slower activity at utilities and mines.
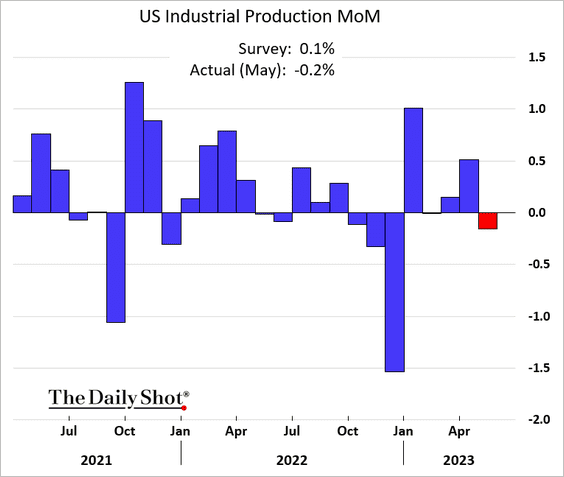
But manufacturing output edged higher, …
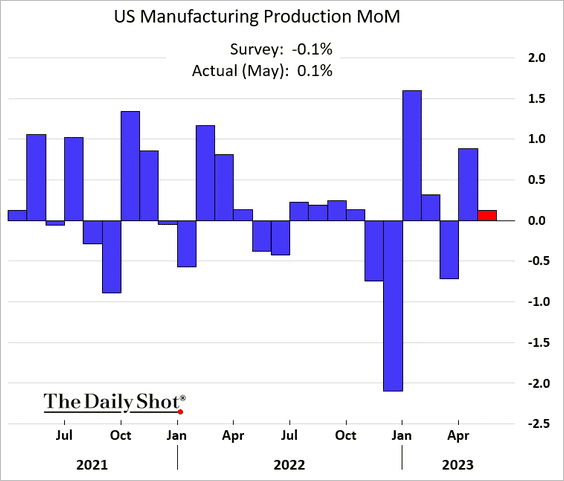
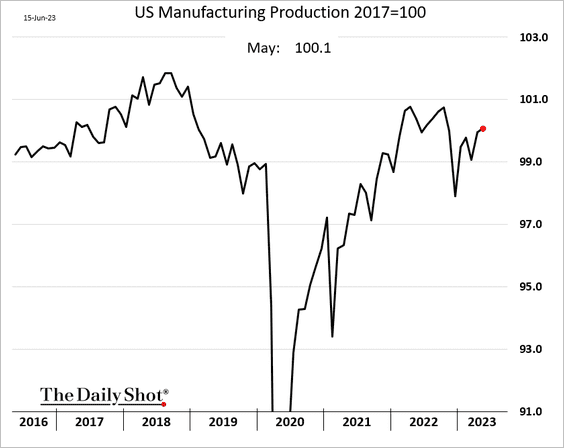
… boosted by vehicle production.
 Source: Pantheon Macroeconomics
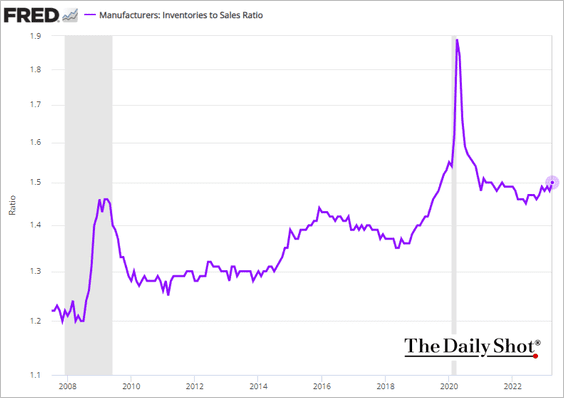
• Manufacturers’ inventories-to-sales ratio continues to grind higher.
——————–
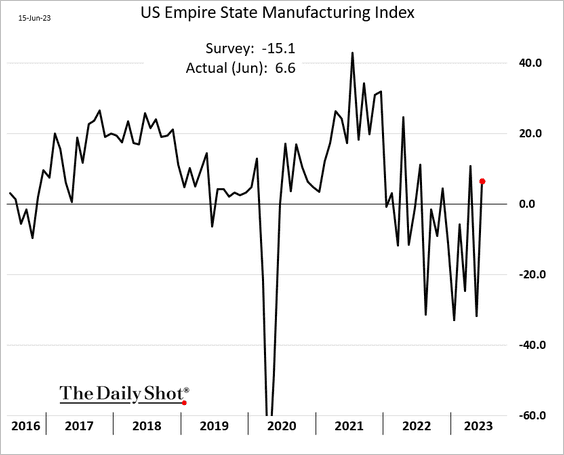
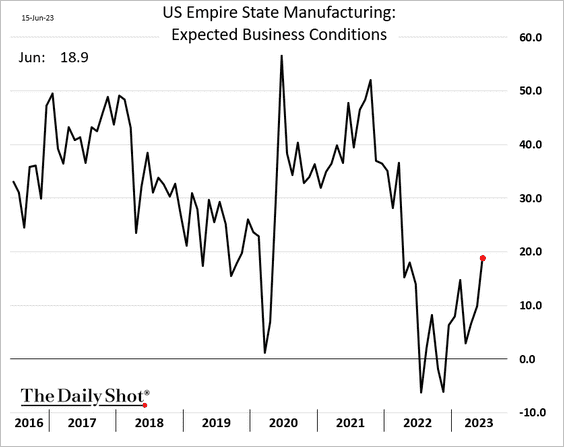
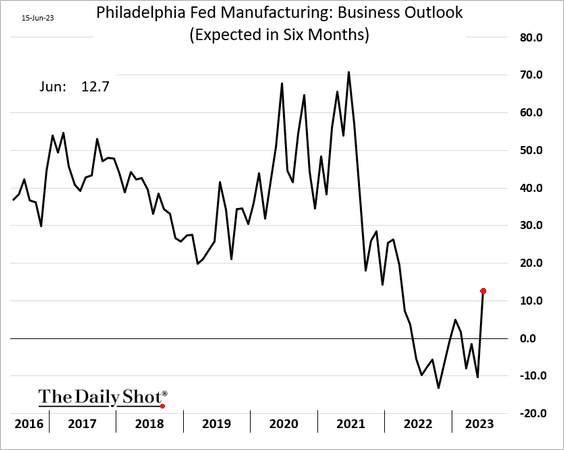
4. This month’s NY Fed and Philly Fed regional manufacturing reports showed some encouraging signs.
 Source: MarketWatch Read full article
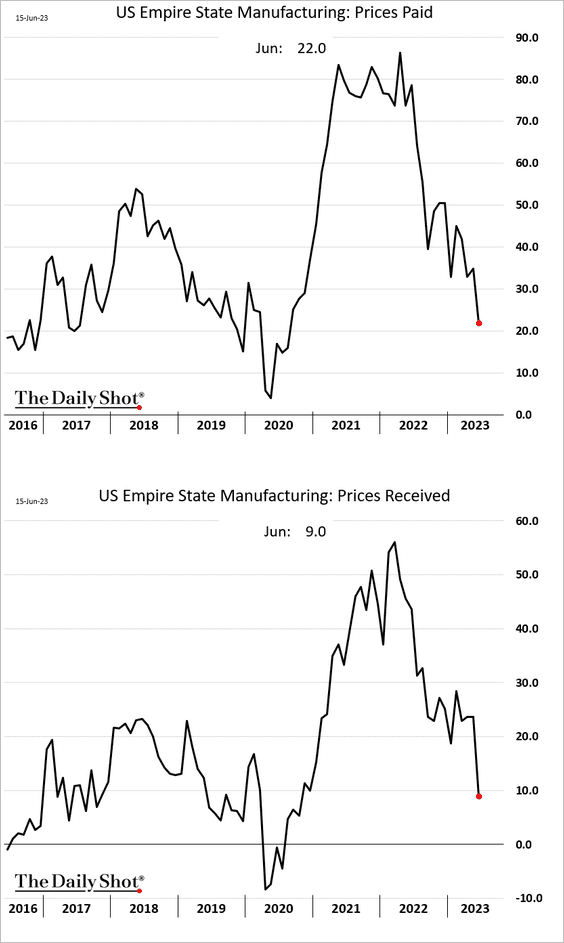
• NY Fed’s index (above consensus):
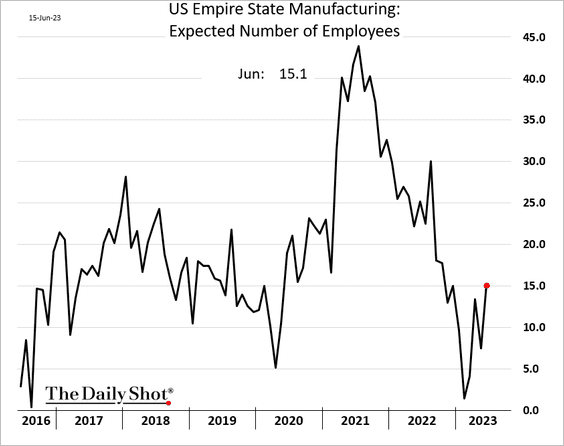
– Expected employment and business conditions:
– Price indicators:
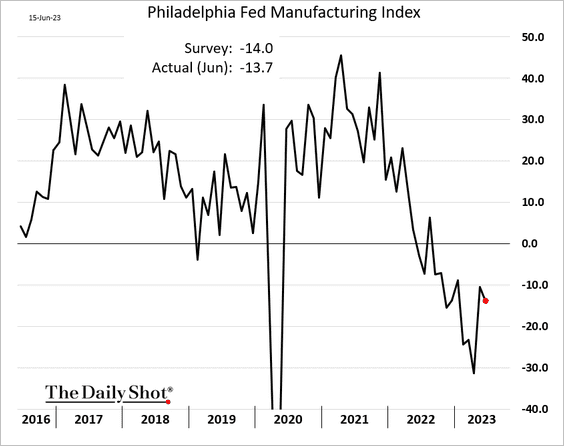
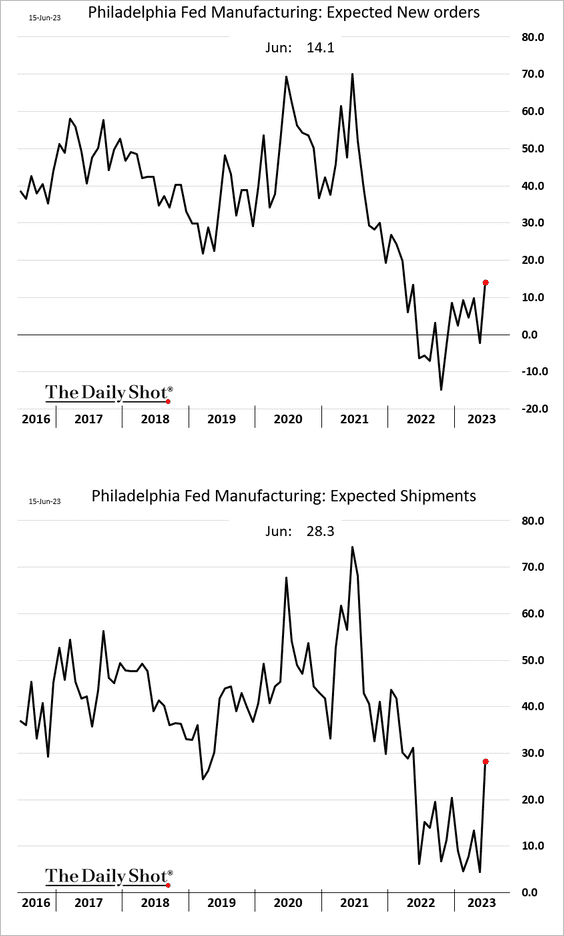
• Philly Fed’s index (still very weak):
– Expected orders and shipments:
– Outlook:
——————–
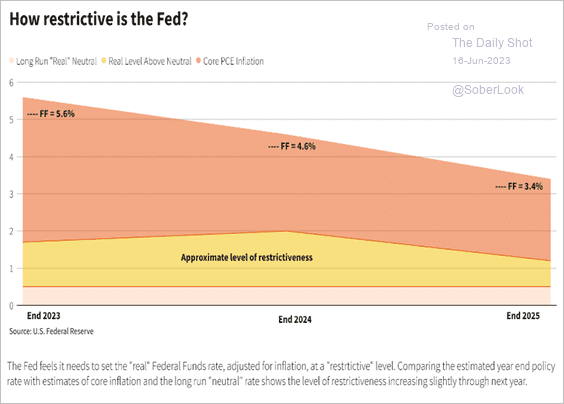
5. Without the expected Fed rate cuts, the monetary policy will get progressively restrictive as lower inflation pushes up real rates.
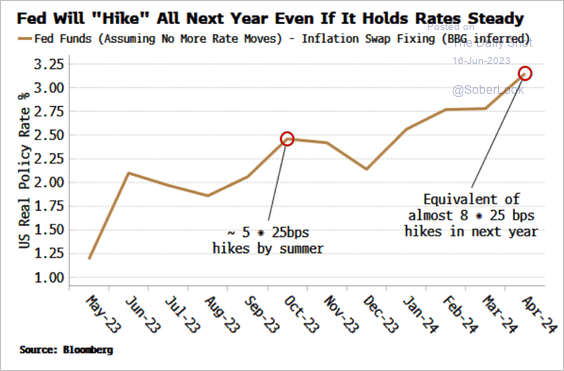 Source: Simon White, Bloomberg Markets Live Blog
Even with the rate cuts projected by the dot-plot, the policy will be more restrictive next year.
 Source: Reuters Read full article
Back to Index
Canada
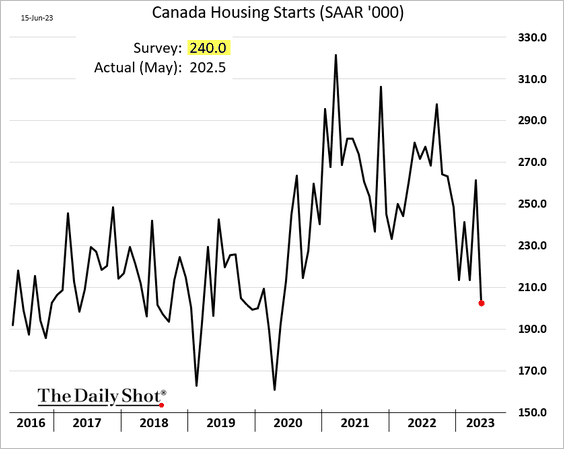
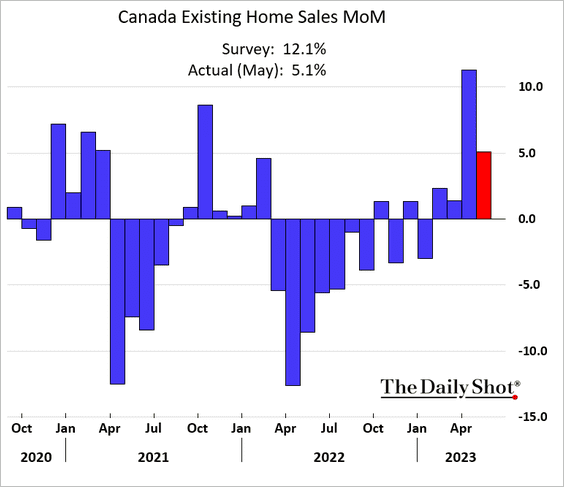
1. Let’s begin with the housing market.
• Housing starts surprised to the downside.
• The increase in existing home sales last month was below forecasts.
• House sales volumes have been climbing, especially in relation to new listings. Prices are starting to rebound. High immigration could be stimulating demand, which may delay rate cuts.
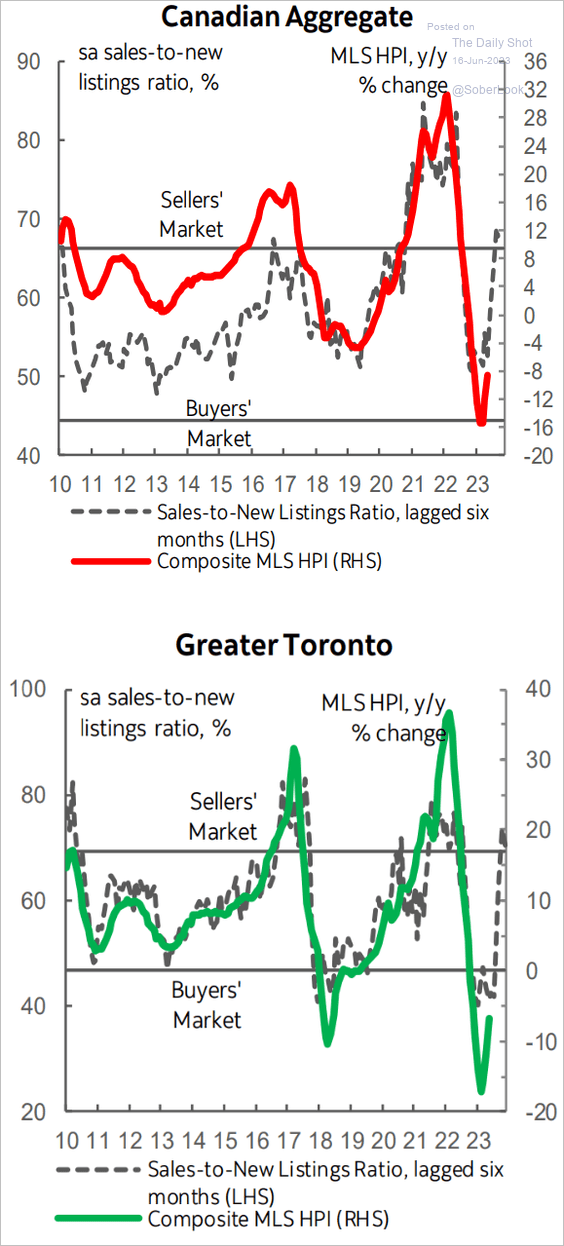 Source: Scotiabank Economics
 Source: Reuters Read full article
——————–
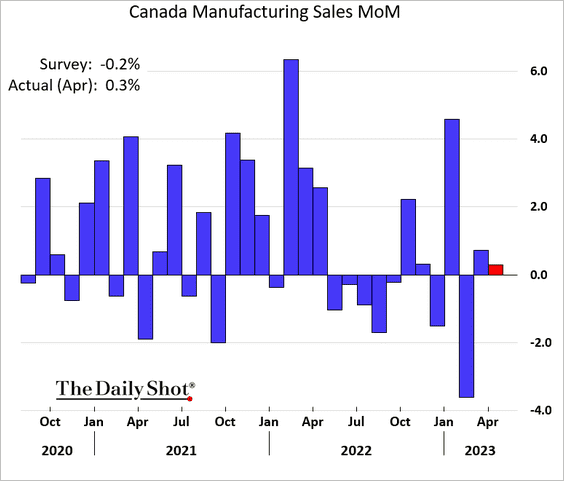
2. Manufacturing sales held up better than expected in April.
3. Self-employment numbers took a hit in May.
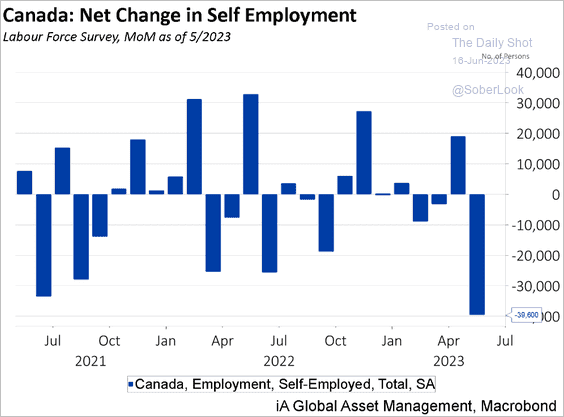 Source: iA Global Asset Management
Back to Index
The Eurozone
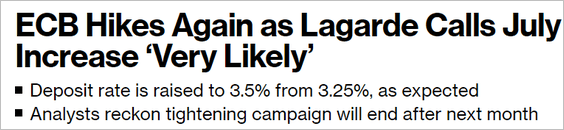
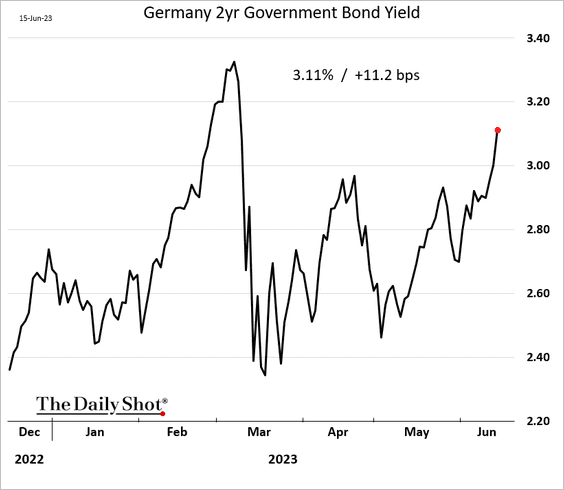
1. The ECB hiked rates as expected and signaled more to come.
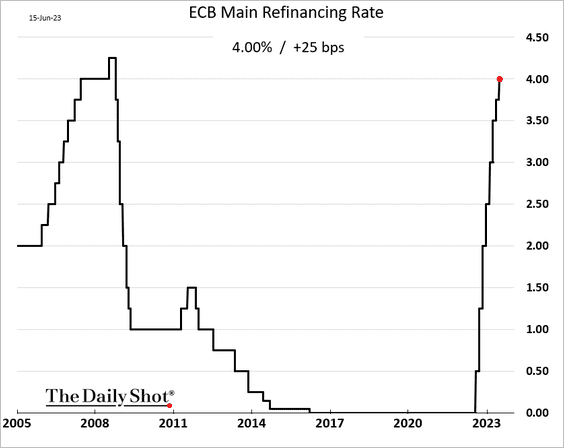
 Source: @WeberAlexander, @jrandow, @economics Read full article
• According to the swaps market, a July increase is fully baked, and September is also a possibility.
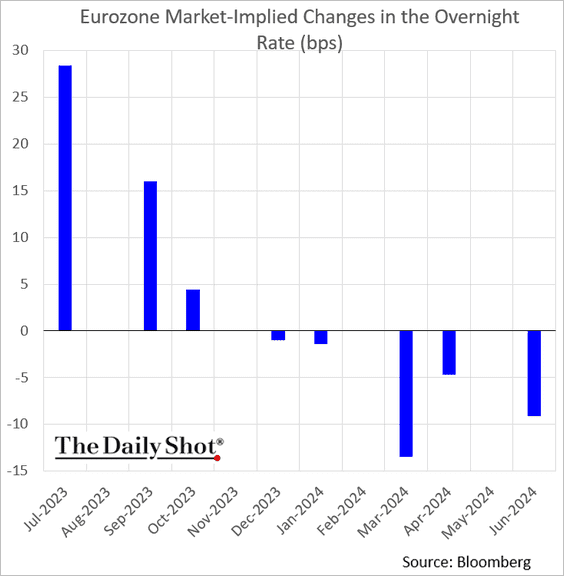
Here is the expected overnight rate in October.
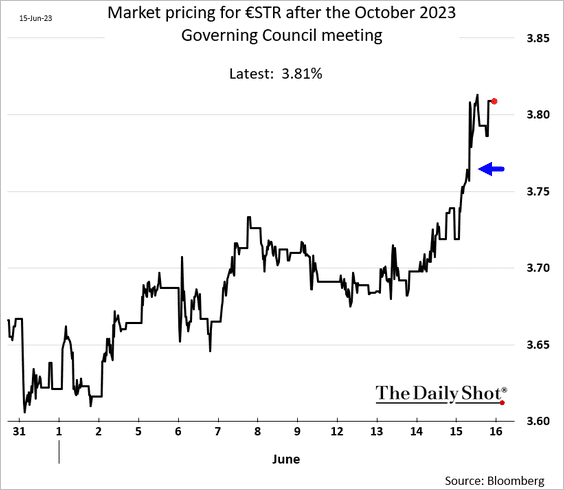
• The euro surged on hawkish comments from the ECB.
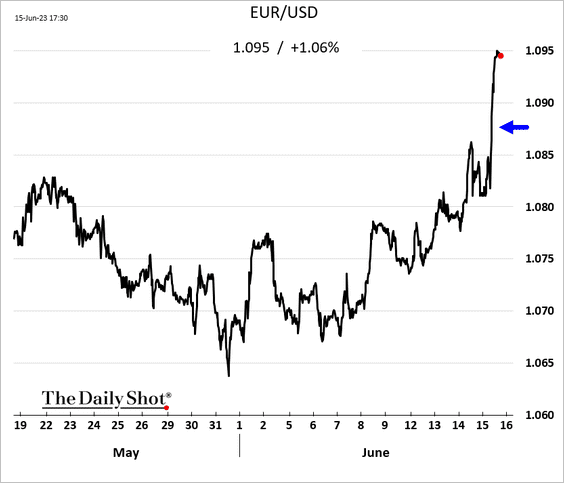
Bond yields were also higher.
——————–
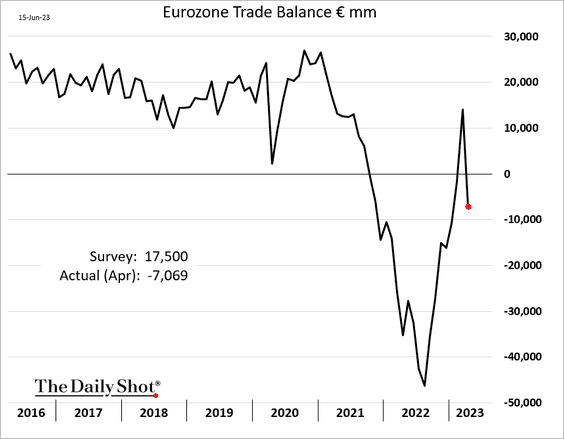
2. The Euro-area trade balance swung back into deficit in April.
 Source: Sharecast.com Read full article
——————–
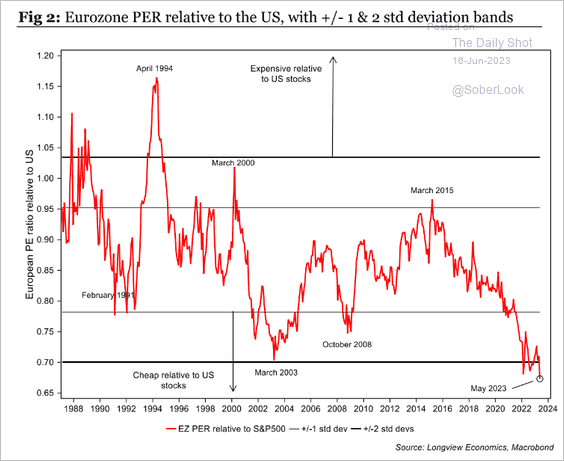
3. Eurozone shares’ discount to the US is hitting new extremes.
 Source: Longview Economics
Back to Index
Japan
1. The BoJ left policy unchanged, which will keep pressuring the yen.
 Source: Reuters Read full article
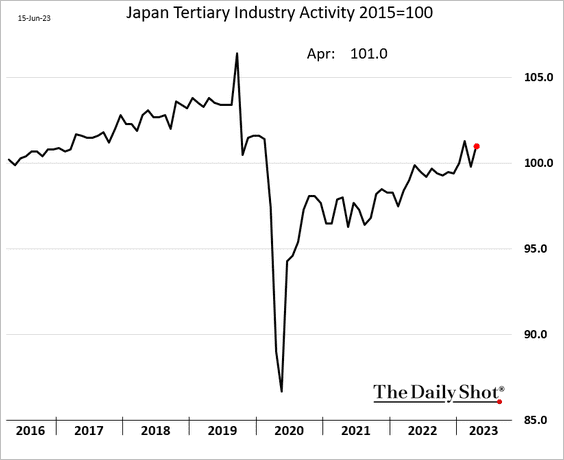
2. Services activity improved in April.
3. Japan-focused equity funds are seeing strong inflows.
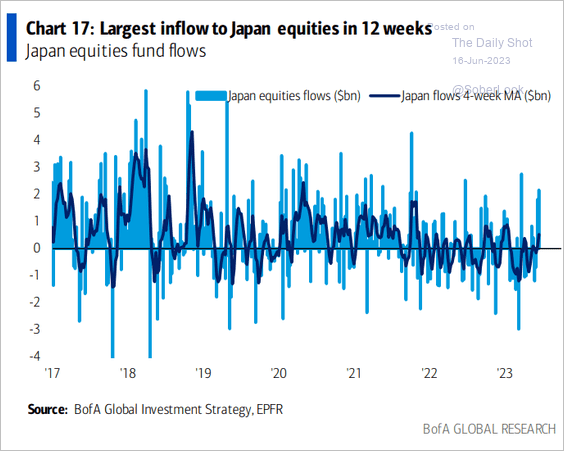 Source: BofA Global Research
Back to Index
Asia-Pacific
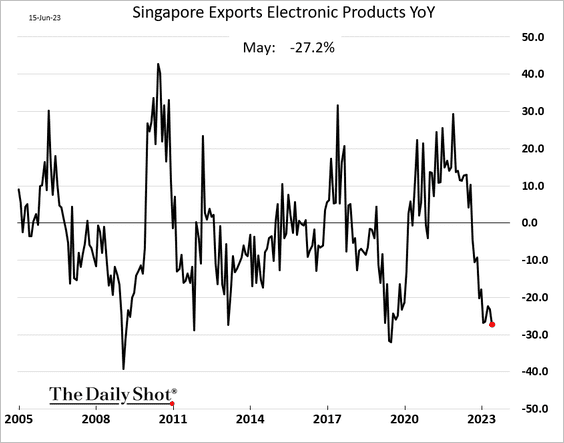
1. Singapore’s electronics exports have deteriorated relative to last year.
2. Relative growth has been a drag on AUD/USD, …
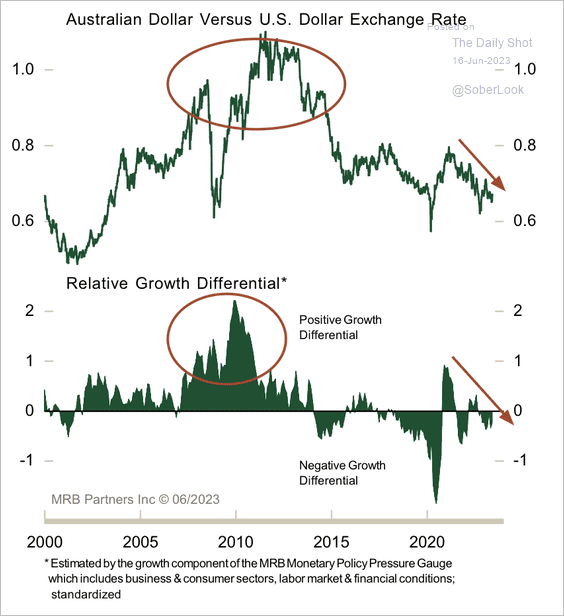 Source: MRB Partners
… although bearish speculative positioning could support a bounce.
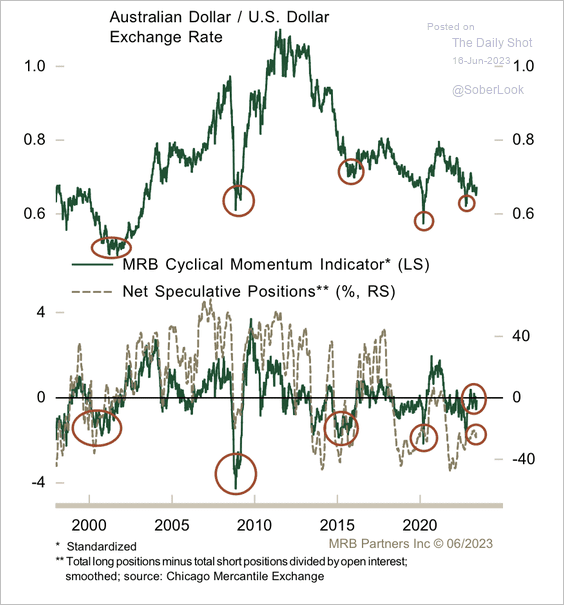 Source: MRB Partners
Back to Index
China
1. Key indicators of economic activity eased in May (2 charts).
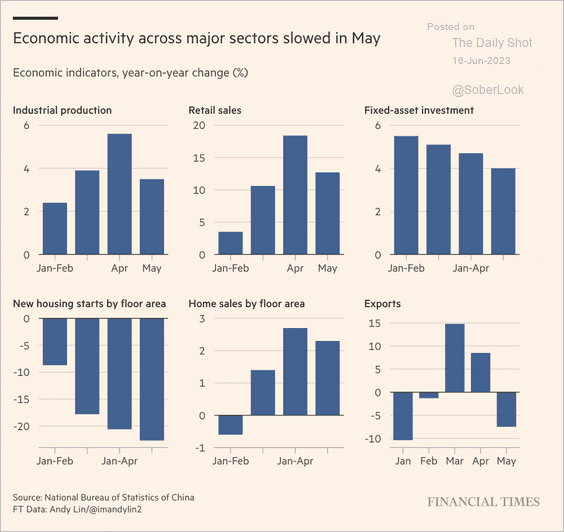 Source: @financialtimes Read full article
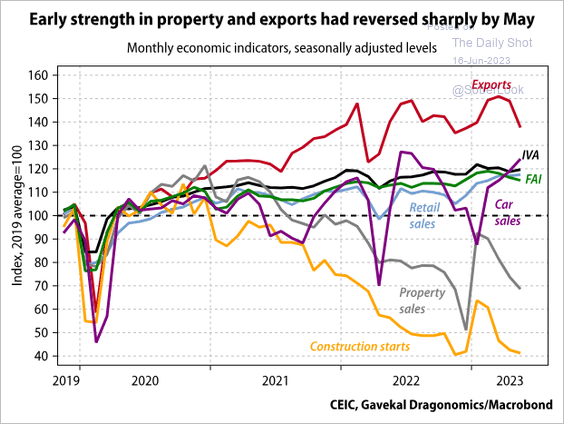 Source: Gavekal Research
Here comes the the fiscal stimulus.
 Source: @WSJ Read full article
——————–
2. Youth unemployment remains elevated, dampening consumer confidence.
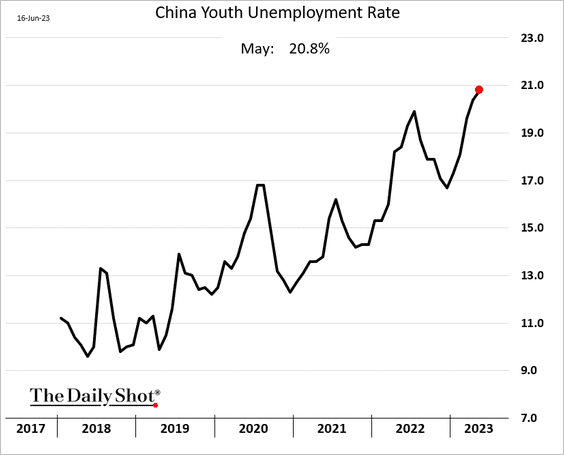
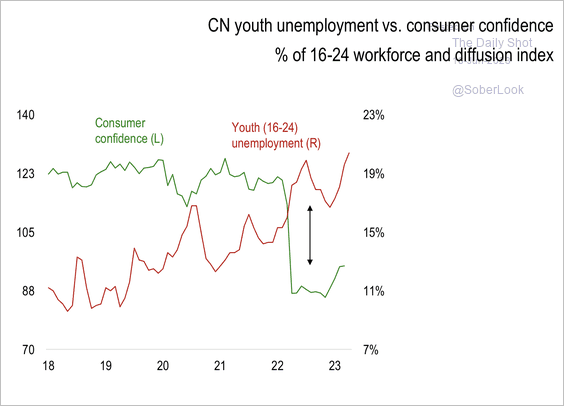 Source: MRB Partners
 Source: SCMP Read full article
——————–
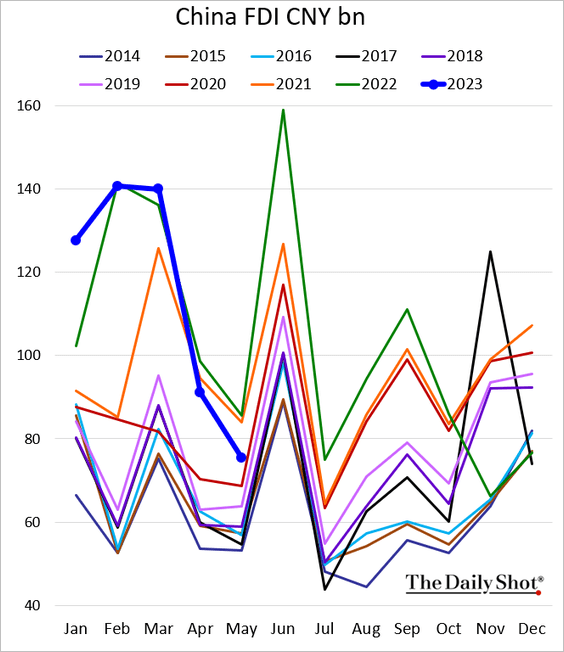
3. Foreign direct investment is down sharply,
4. Potential economic growth has weakened this past decade.
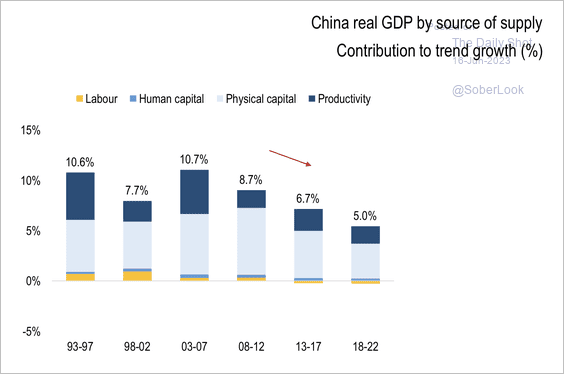 Source: Numera Analytics (@NumeraAnalytics)
Real GDP growth is expected to exceed the 5% target this year.
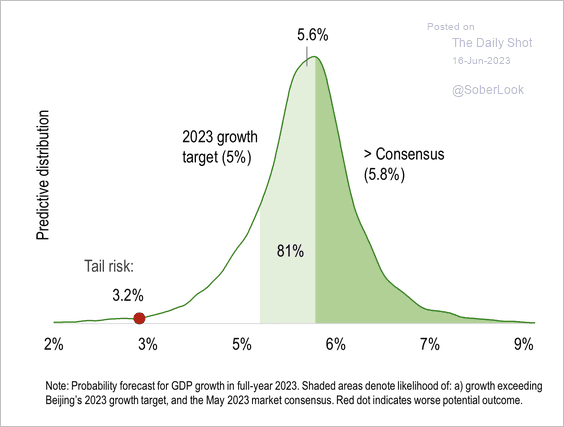 Source: Numera Analytics (@NumeraAnalytics)
——————–
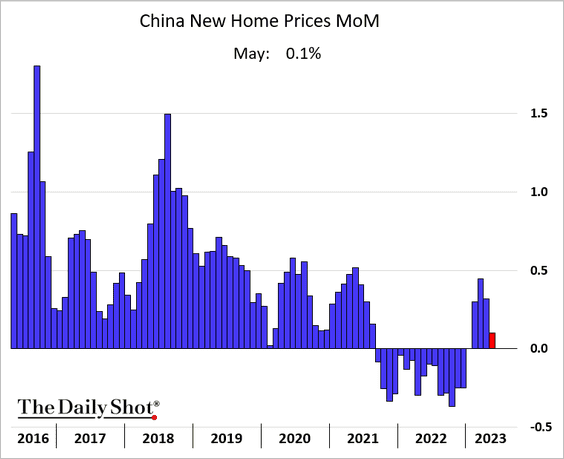
5. Here is a look at the housing market.
• New home prices:
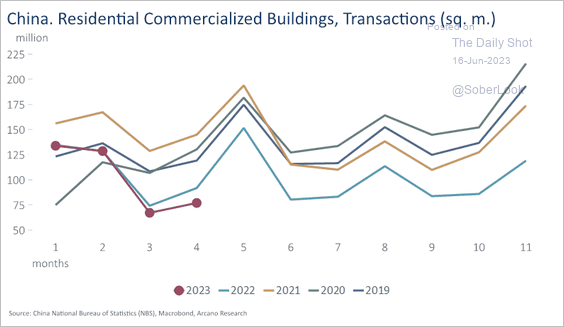
• Residential transactions (2 charts):
![]() Source: Arcano Economics
Source: Arcano Economics
 Source: Arcano Economics
• Housing starts:
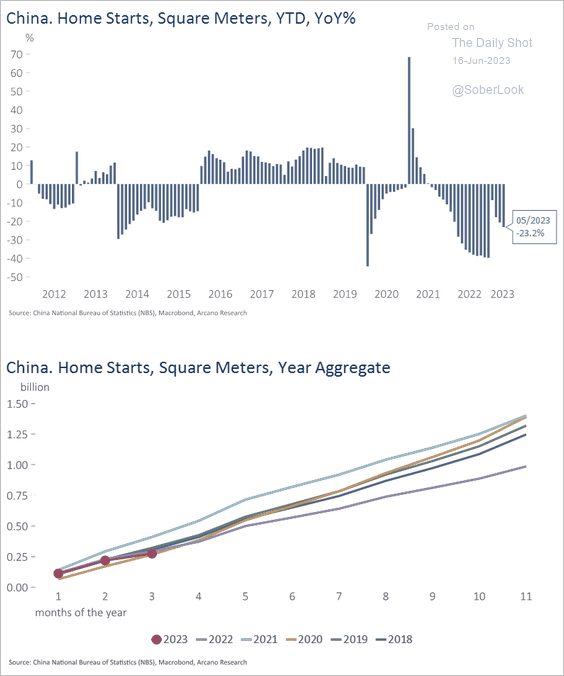 Source: Arcano Economics
——————–
6. The iShares MSCI China Large-Cap ETF likely made a cycle low last year.
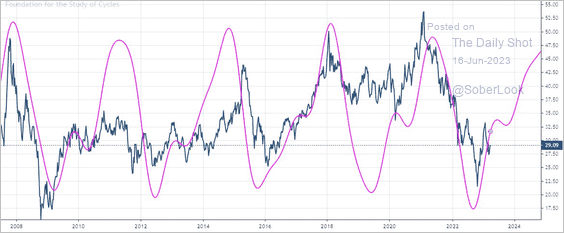 Source: @MarkNewtonCMT
Back to Index
Emerging Markets
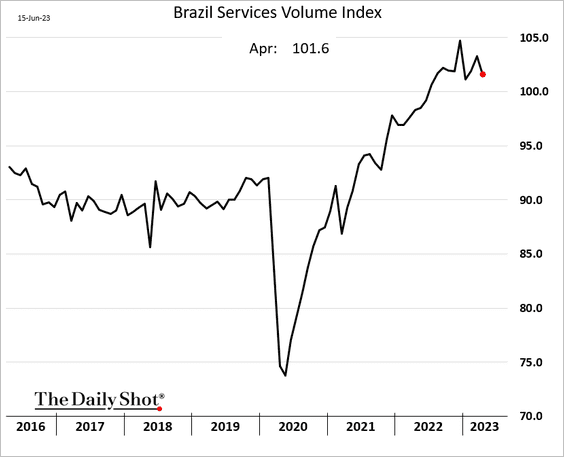
1. Brazil’s services output appears to have peaked.
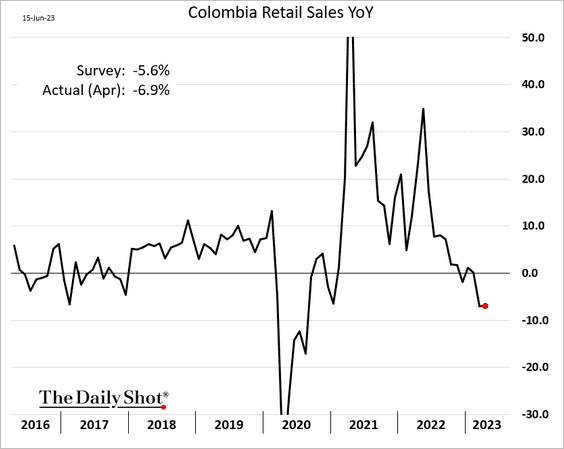
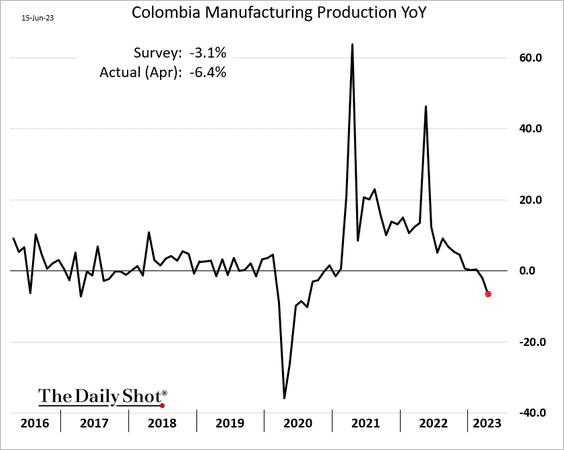
2. Colombia’s economic activity is slowing.
• Retail sales:
• Industrial production:
——————–
3. India’s trade deficit widened in May as imports jumped.
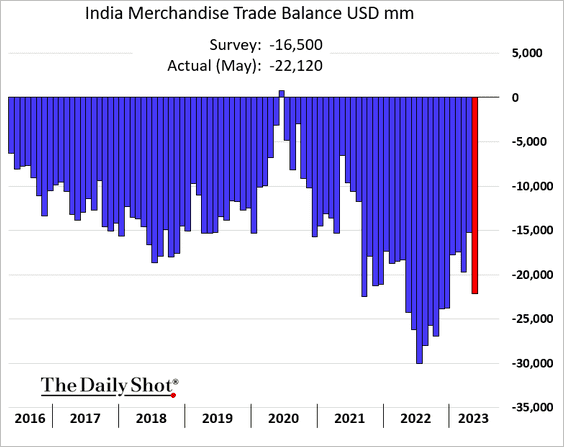
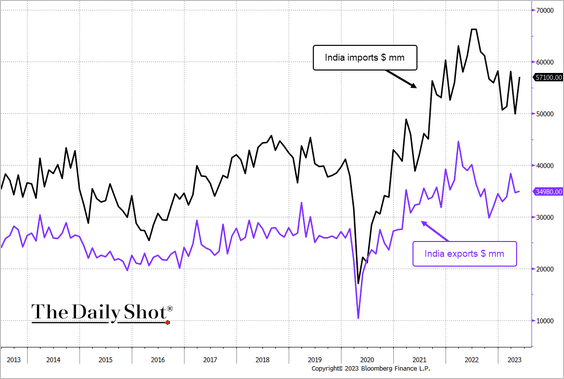 Source: @TheTerminal, Bloomberg Finance L.P.
——————–
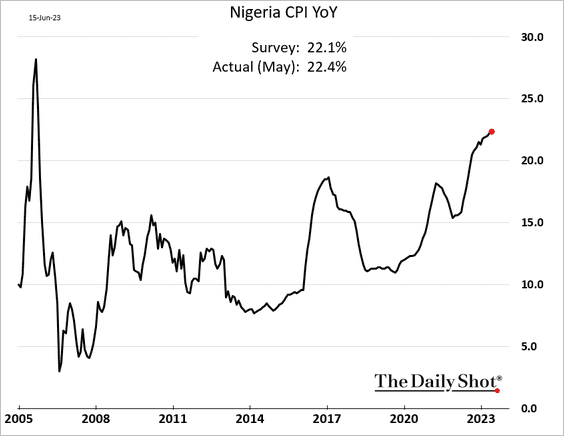
4. Nigeria’s CPI continues to surge.
5. China’s policy easing should help EM stocks outperform.
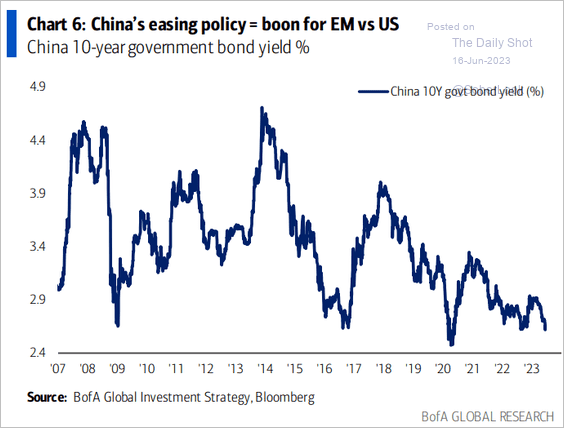 Source: BofA Global Research
Back to Index
Cryptocurrency
1. BlackRock filed paperwork to form a spot-bitcoin ETF.
 Source: CoinDesk Read full article
2. BTC and ETH balances on Binance’s exchange significantly declined since SEC charges were announced.
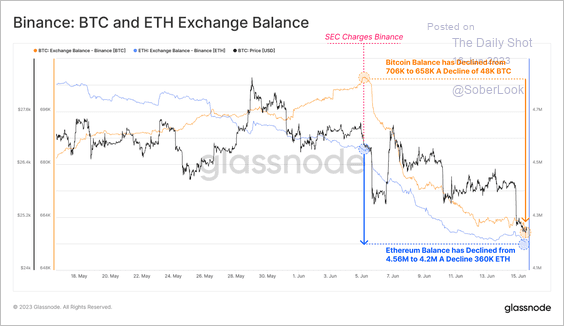 Source: @glassnode
3. The ETH/BTC price ratio remains in a downtrend, capped by its 200-day moving average.
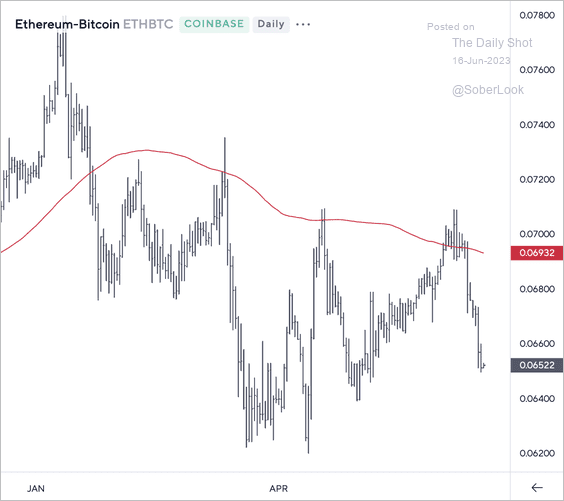 Source: Symbolik
4. Few BTC flowing into exchanges are locking in profits or losses relative to their average cost basis. This suggests trading activity has been concentrated in new holders acquiring BTC close to the current spot price.
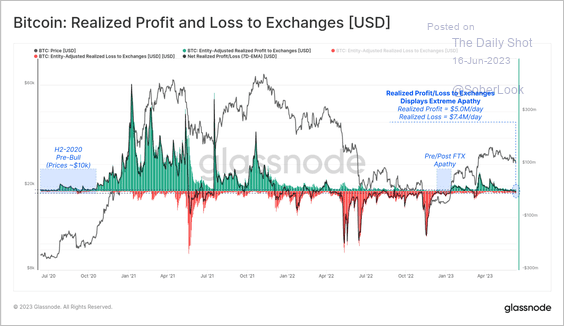 Source: @glassnode
5. Crypto exchange volumes continue to trend lower.
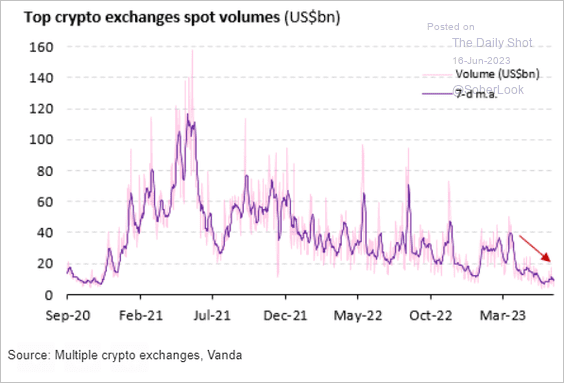 Source: Vanda Research
6. Why do investors own crypto (or not)?
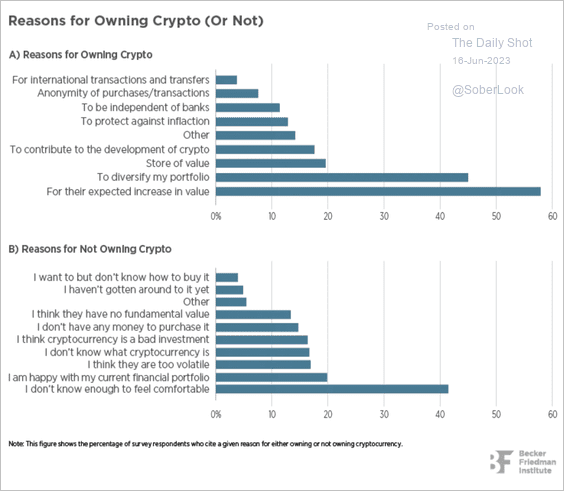 Source: Friedman Institute for Economics Read full article
Back to Index
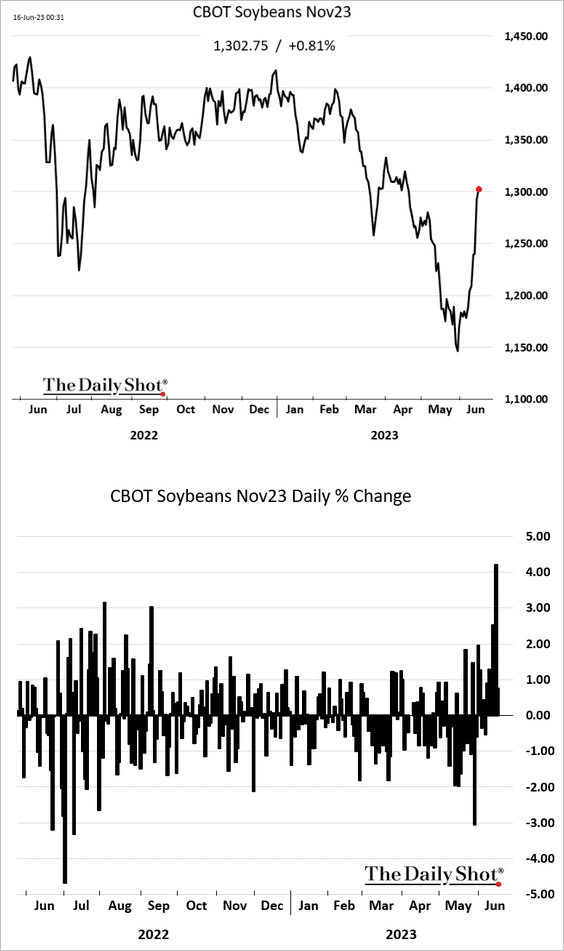
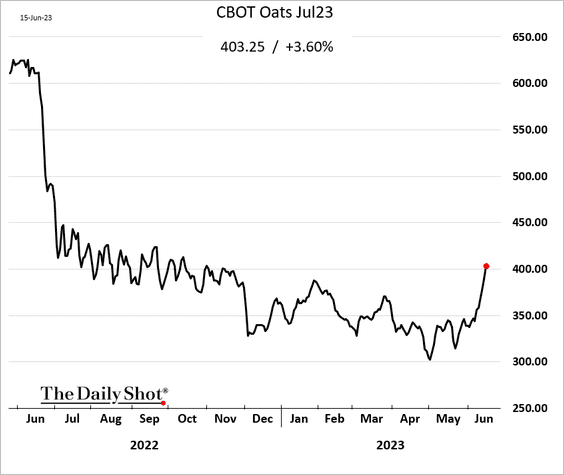
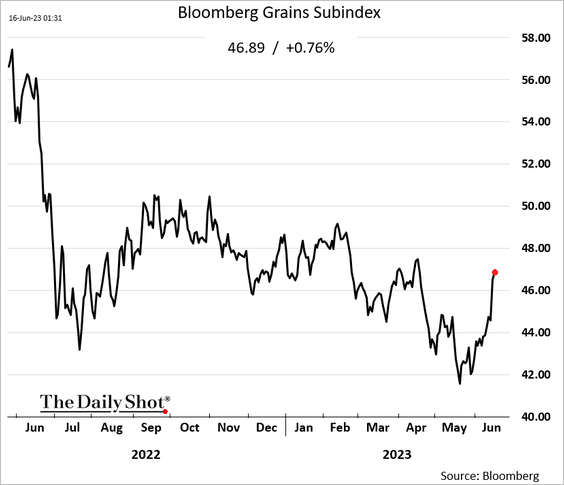
Commodities
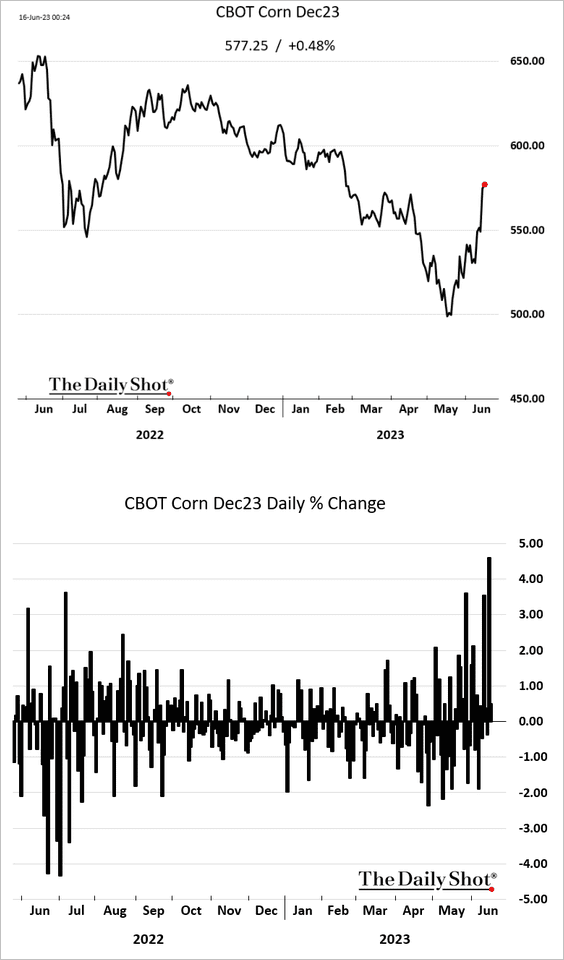
US grain futures are surging.
 Source: Reuters Read full article
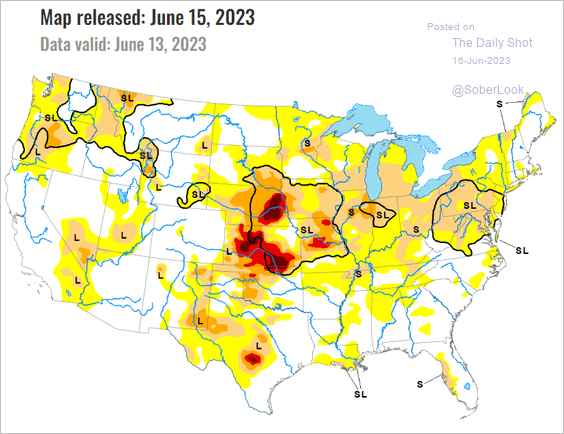 Source: Drought Monitor
• Corn:
• Soybeans:
• Oats:
• Bloomberg’s grains index:
The Invesco Agriculture ETF (DBA) has diverged from global food prices, which is not sustainable.
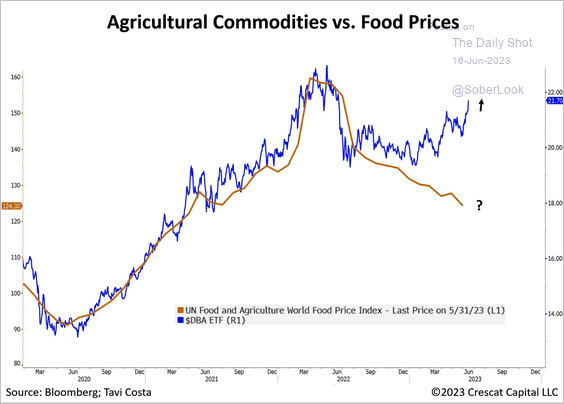 Source: @TaviCosta
Back to Index
Energy
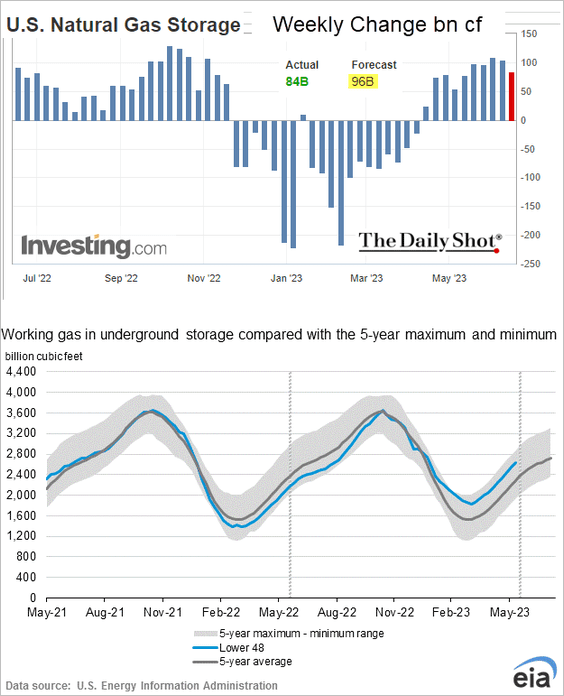
1. US natural gas prices jumped this week.
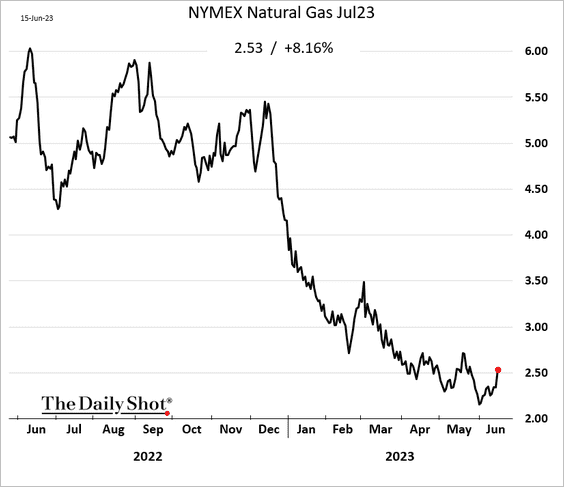
 Source: NGI Read full article
——————–
2. US distillate demand is starting to recover, although falling industrial activity could limit upside.
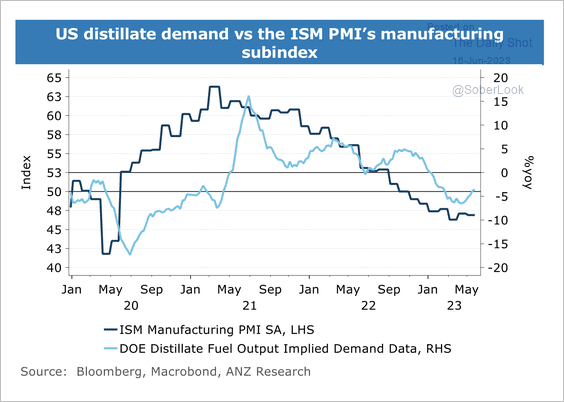 Source: @ANZ_Research
3. Uranium is getting more love.
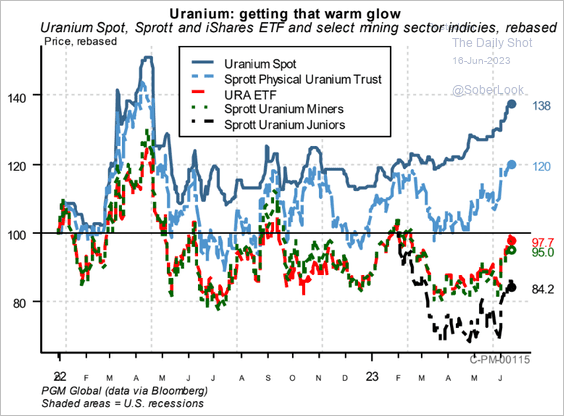 Source: PGM Global
Back to Index
Equities
1. The S&P 500 has recovered all the losses since the first Fed rate hike.
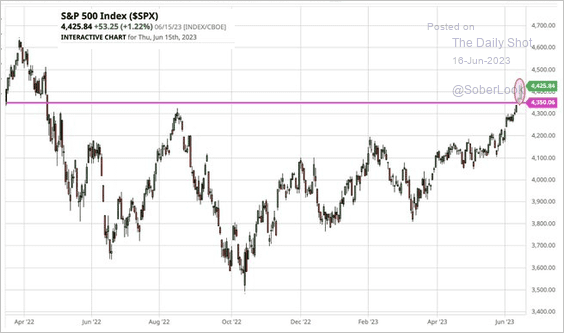 Source: @Barchart
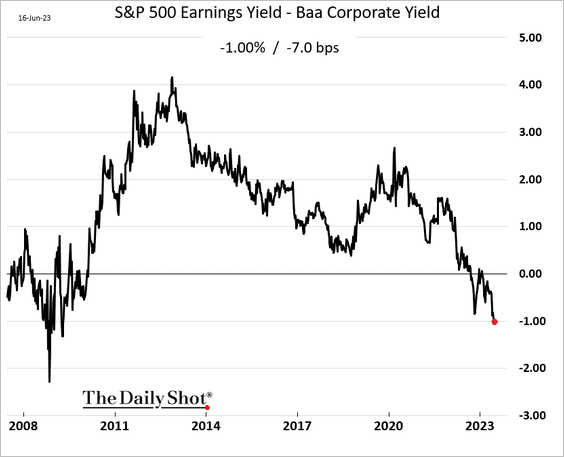
2. The S&P 500 earnings yield is now 100 bps below the average BBB-rated corporate bond yield.
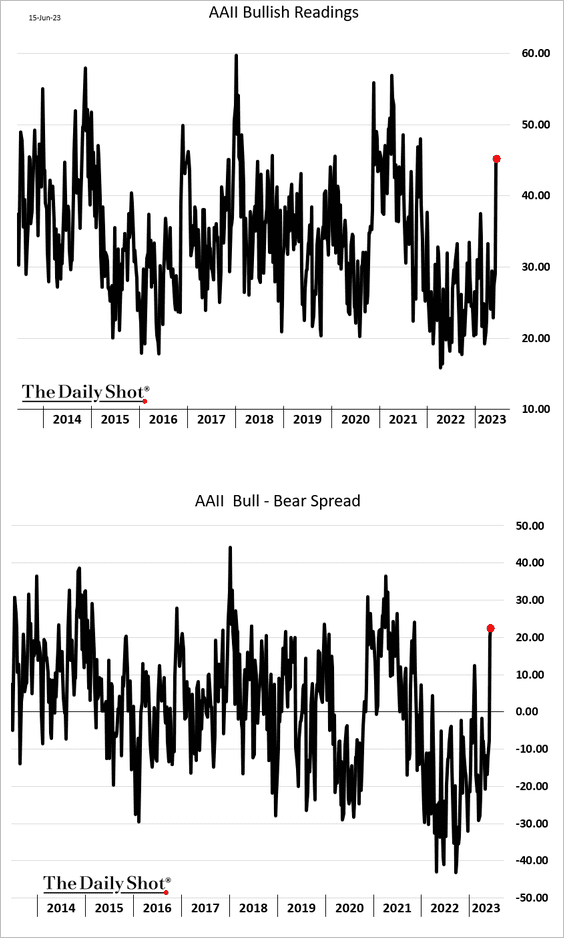
3. Retail sentiment is becoming increasingly bullish, …
… diverging from fund managers.
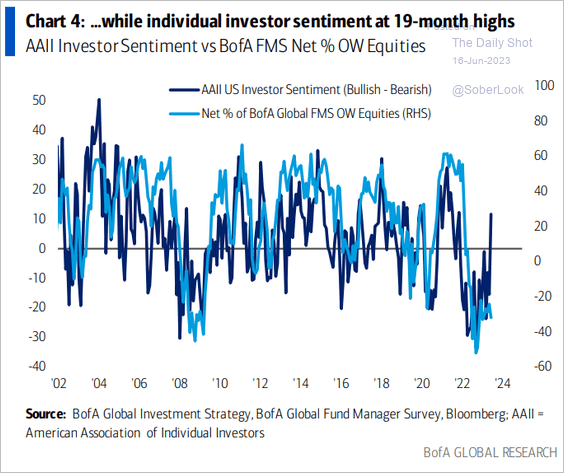 Source: BofA Global Research
• Retail investor purchases appear to have peaked for now.
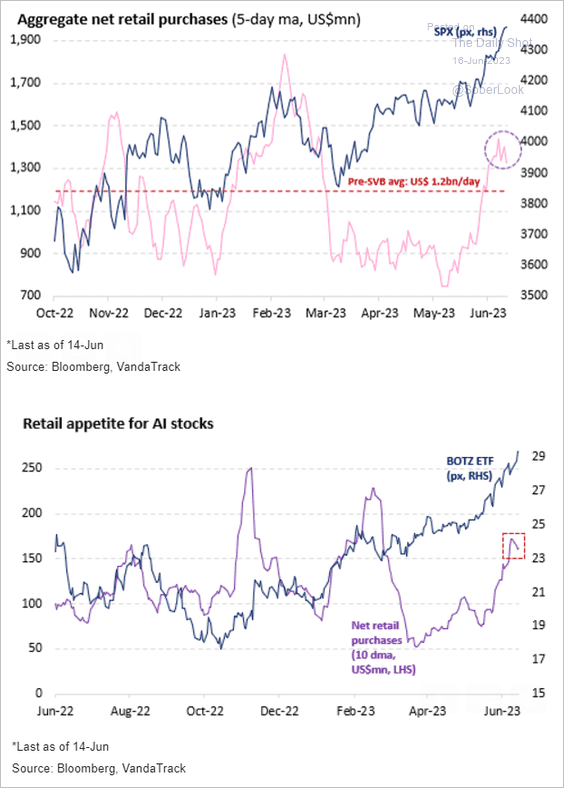 Source: Vanda Research
• Investment managers have been bullish.
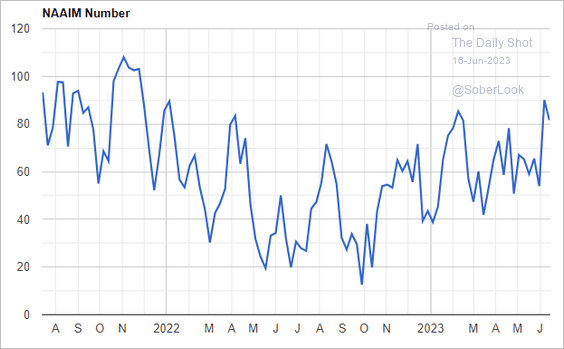 Source: National Association of Active Investment Managers
——————–
4. US equities are seeing some inflows.
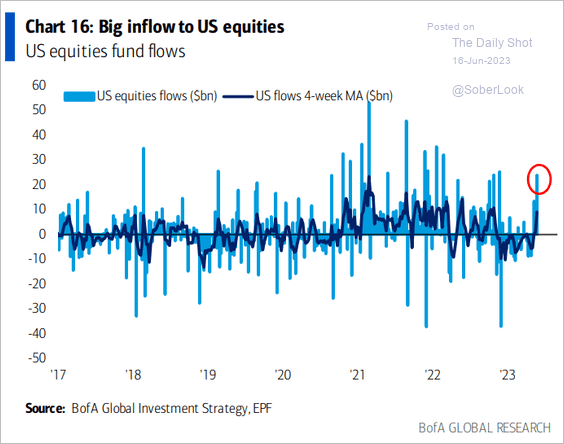 Source: BofA Global Research
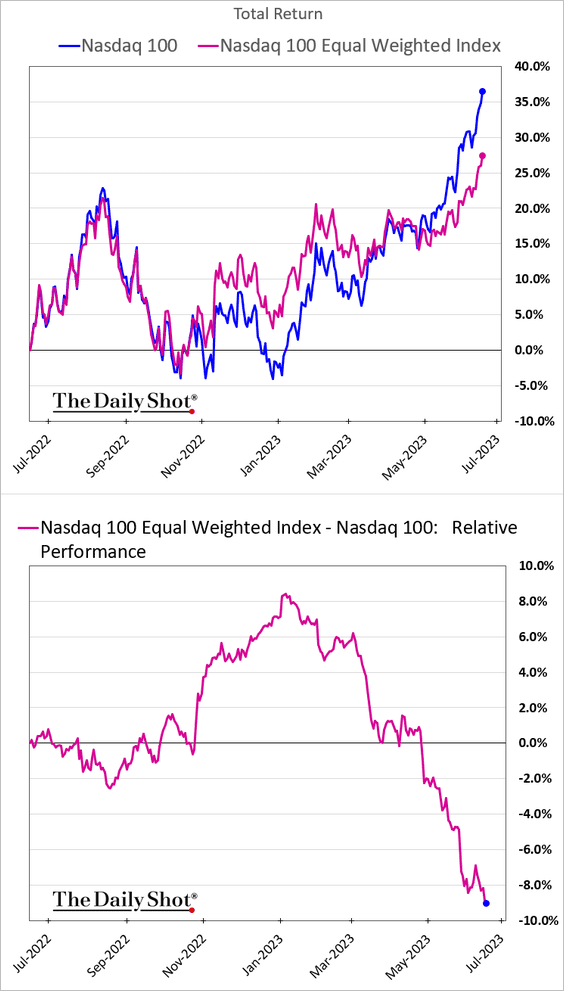
5. Megacaps still dominate the rally, as the Nasdaq 100 Equal-Weighted Index widens its underperformance.
6. The S&P 500 is rising as extreme pessimism fades. (2 charts)
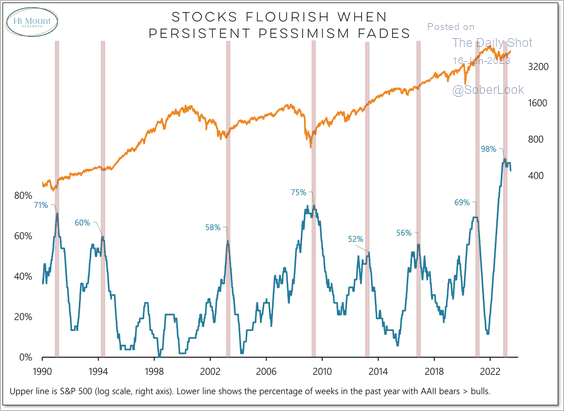 Source: @WillieDelwiche
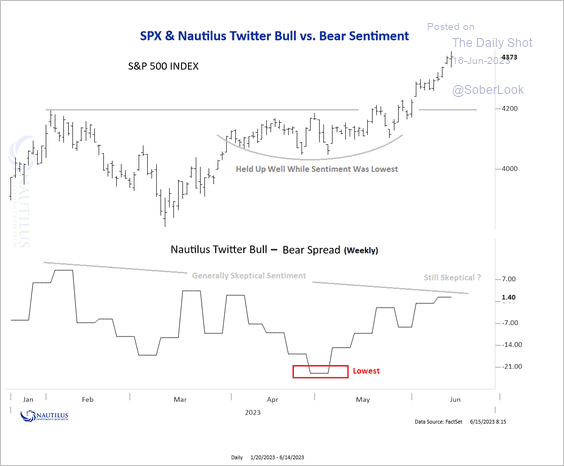 Source: @NautilusCap
——————–
7. Based on seasonal patterns, VIX is near the bottom.
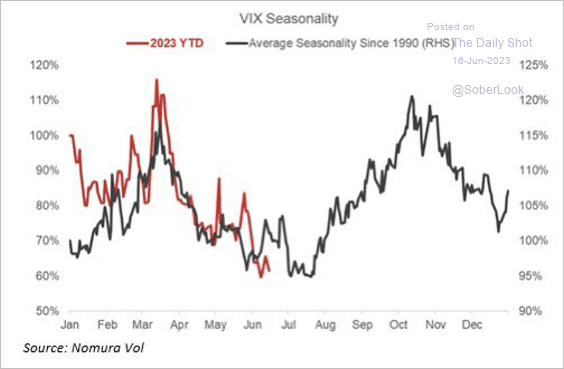 Source: Nomura Securities; @Marlin_Capital
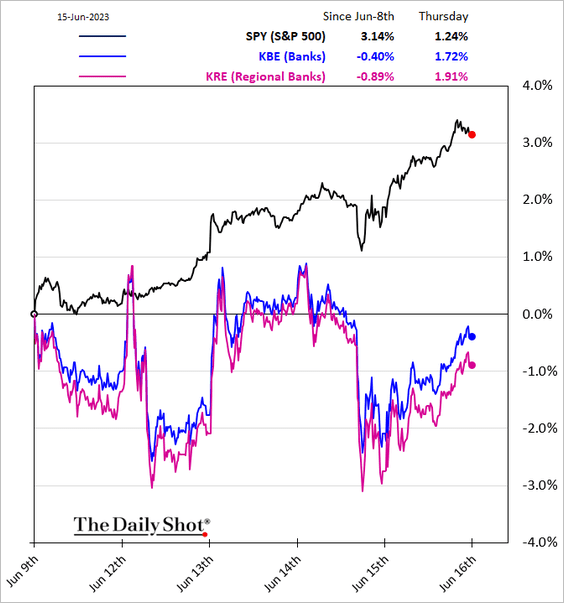
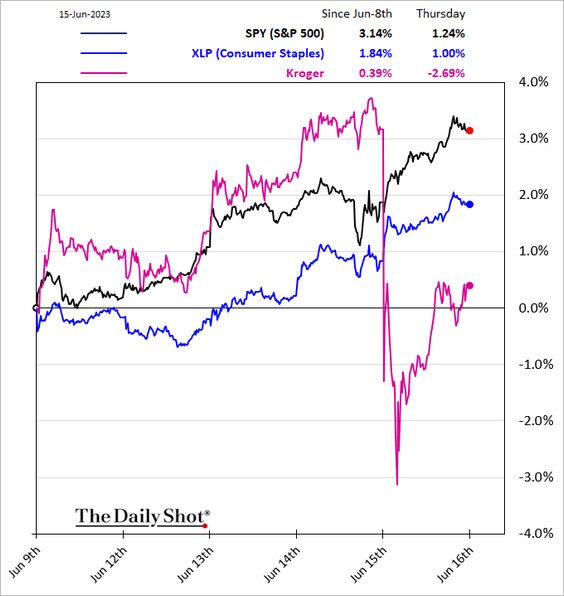
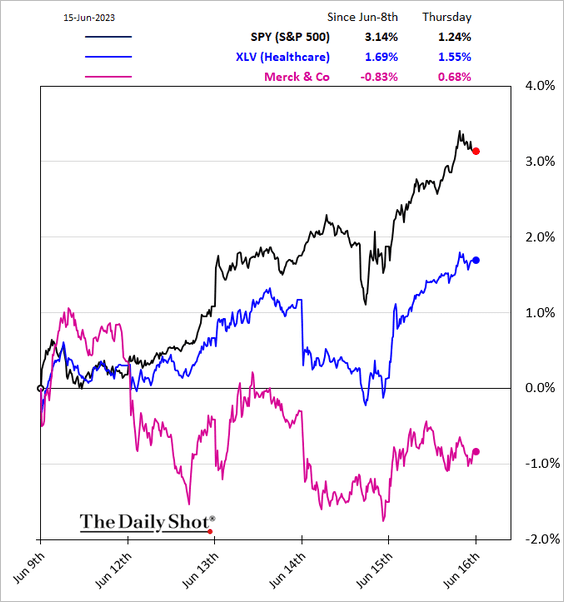
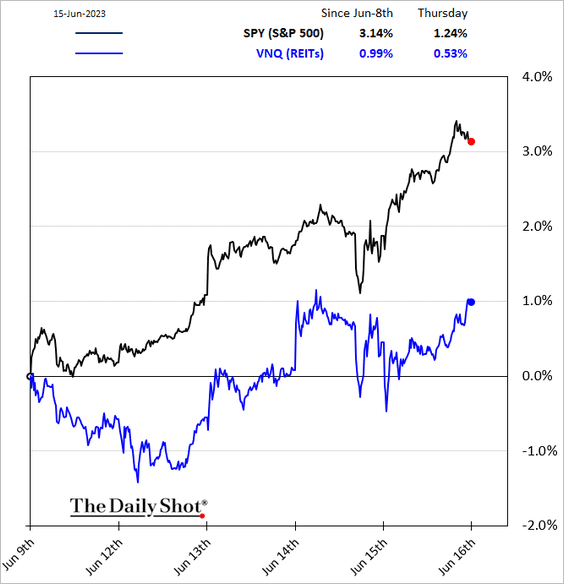
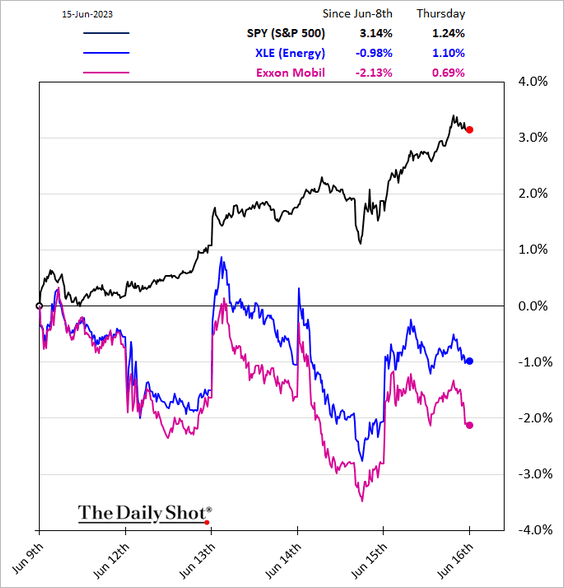
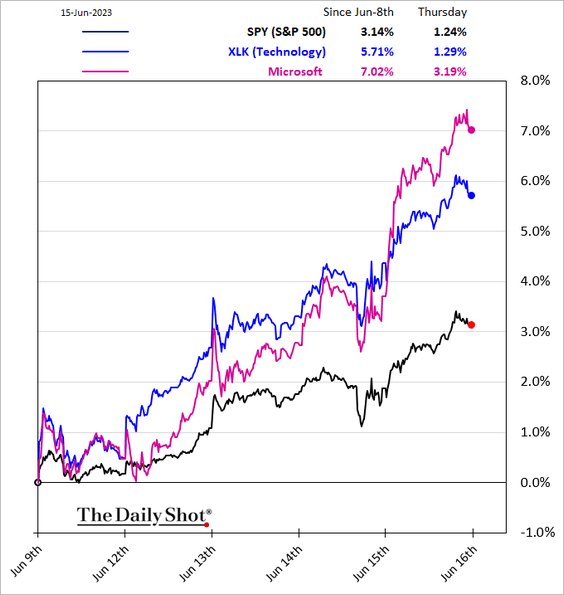
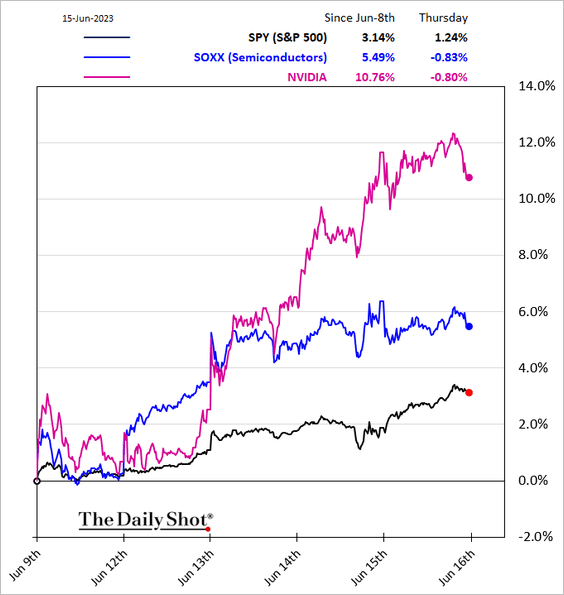
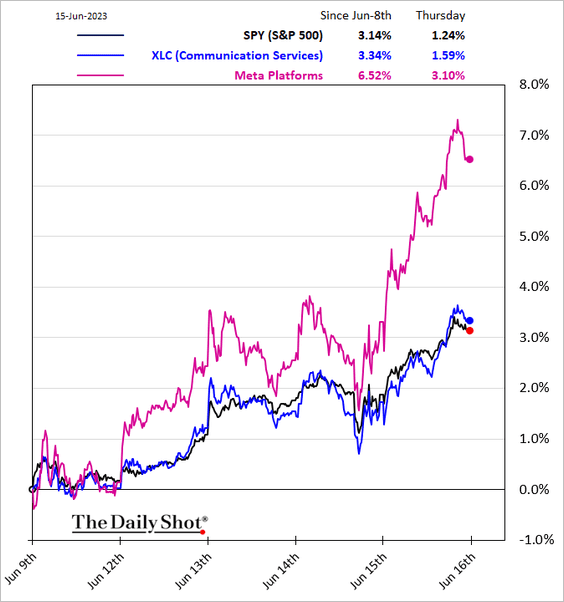
8. Finally, here is a look at some sector performance trends over the past five business days.
• Banks:
• Consumer Staples:
• Healthcare:
• REITs:
• Transportation:
![]()
• Energy:
• Tech:
• Semiconductors:
• Communication Services:
Back to Index
Credit
1. Regional bank spreads are drifting lower but still elevated.
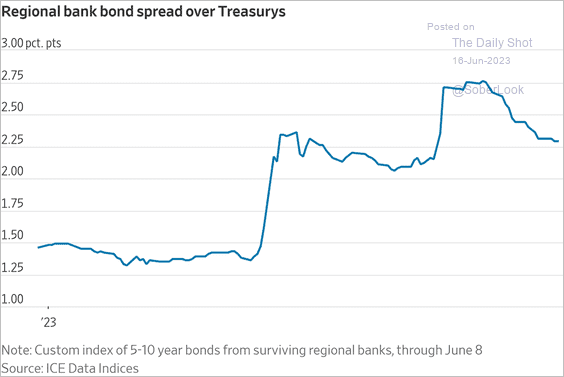 Source: @WSJ Read full article
2. Here is a look at uninsured deposits at US banks.
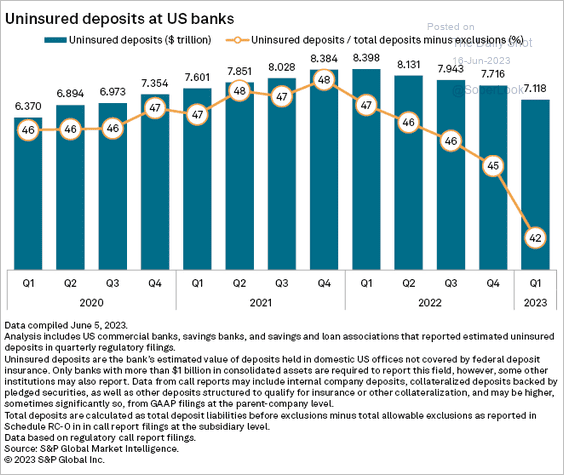 Source: S&P Global Market Intelligence
3. BofA’s private clients have been dumping leveraged loans.
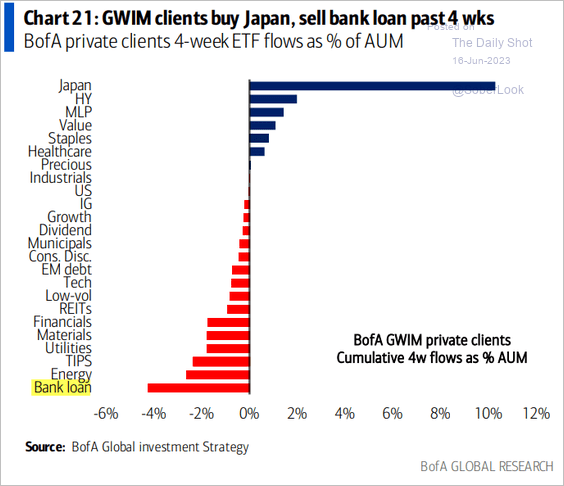 Source: BofA Global Research
4. The yield gap between Treasuries and munis remains elevated.
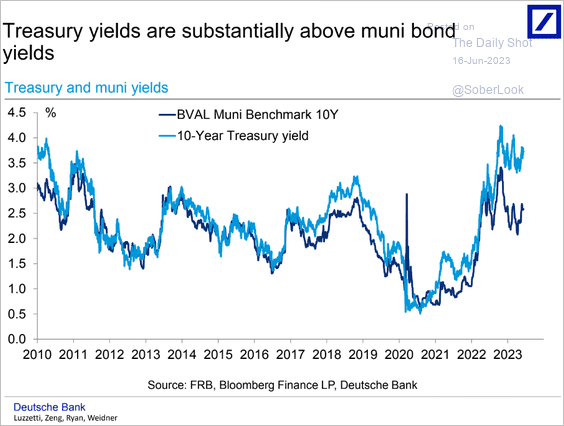 Source: Deutsche Bank Research
Back to Index
Rates
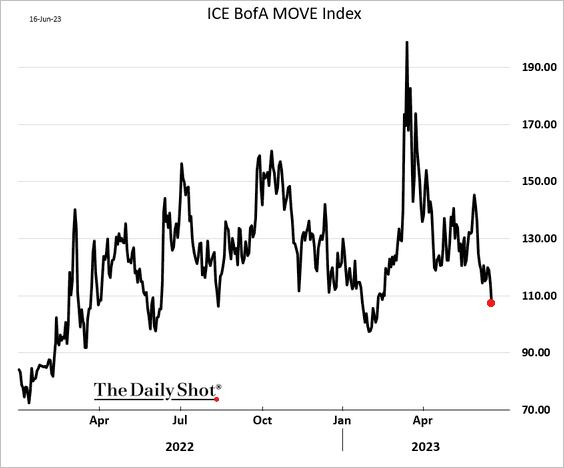
1. Treasury market implied volatility declined sharply this week.
2. This chart shows Treasuries as a share of the US fixed-income market.
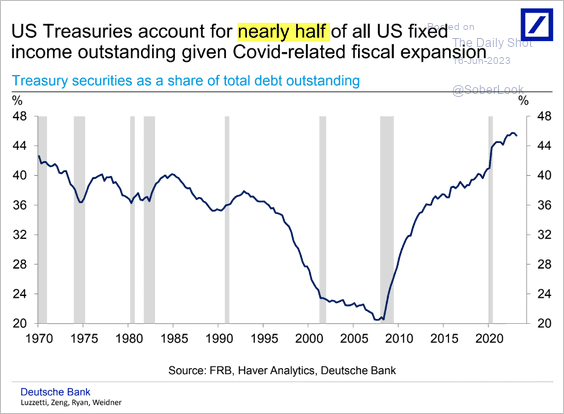 Source: Deutsche Bank Research
——————–
Food for Thought
1. Number of banks adjusted for population:
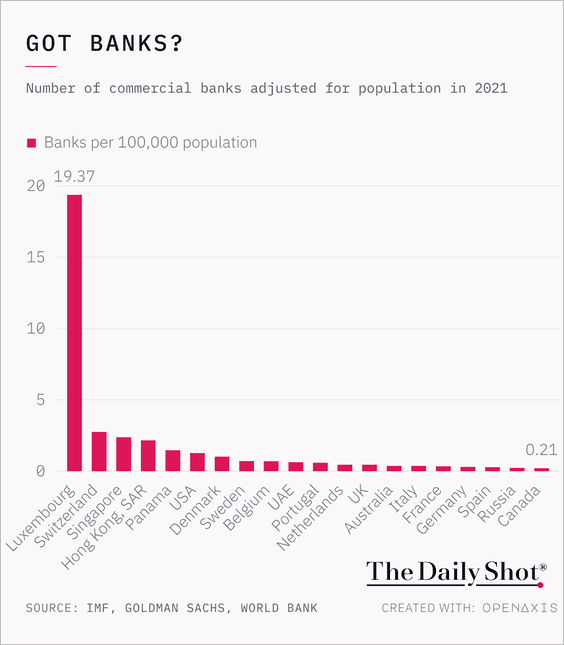 Source: @TheDailyShot
2. Office visits by day of the week:
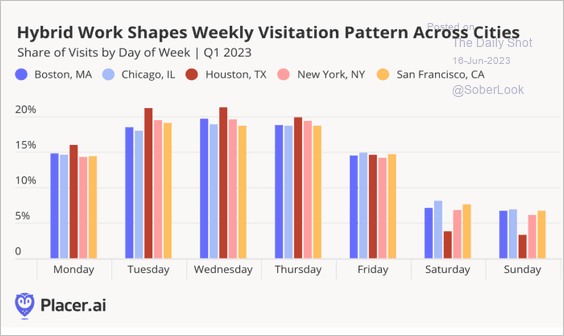 Source: Placer.ai
3. Average age of US vehicles:
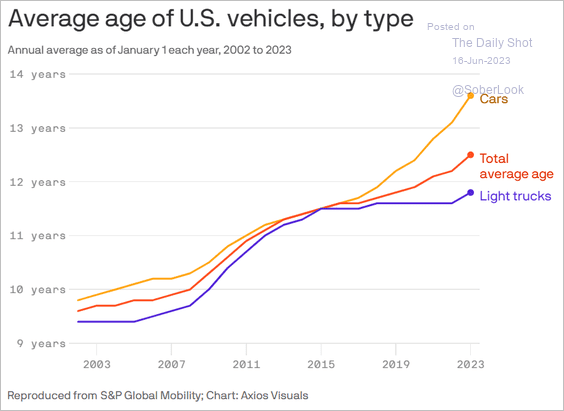 Source: @axios Read full article
4. Perceptions of best long-term investment:
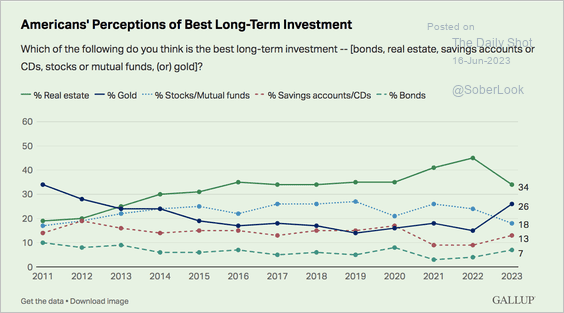 Source: Gallup Read full article
5. Recently IPO’d tech companies’ net profit margins:
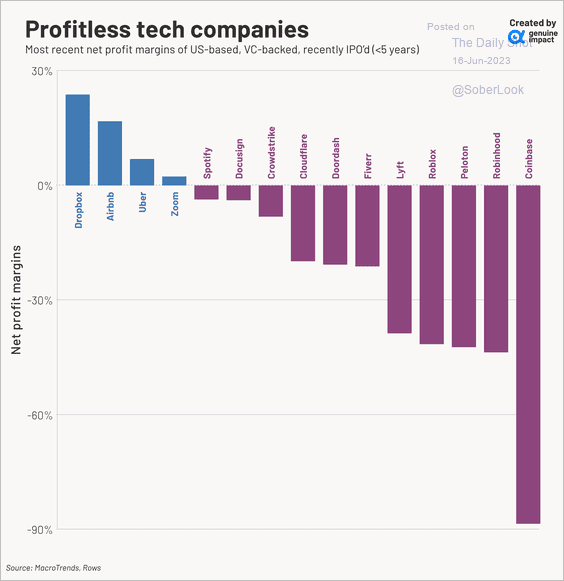 Source: @genuine_impact
6. Electric school buses by state:
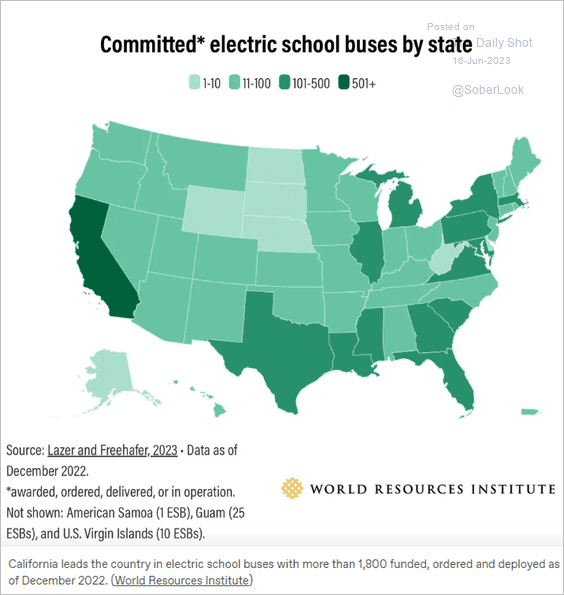 Source: Canary Media Read full article
7. Sentences issued in Russia’s censorship and protest prosecutions:
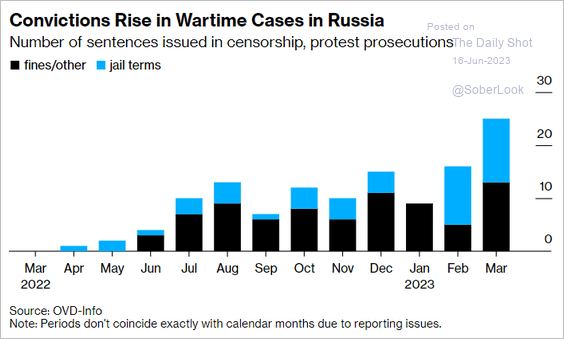 Source: @bpolitics Read full article
8. US state prison conviction breakdown:
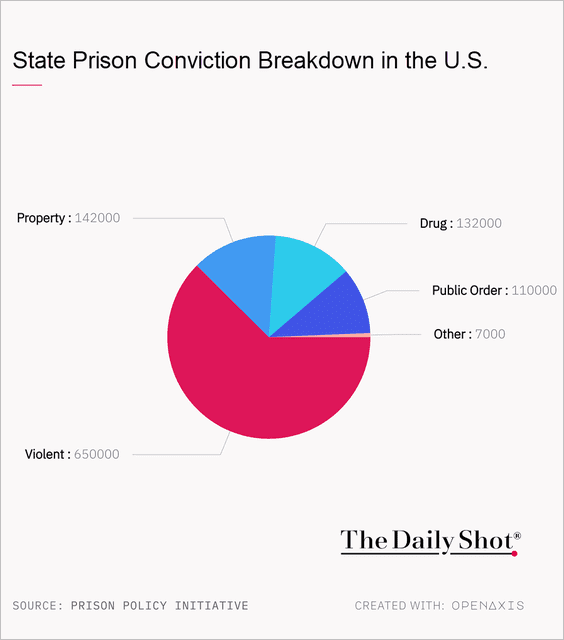 Source: @TheDailyShot
• US local jail lockup breakdown:
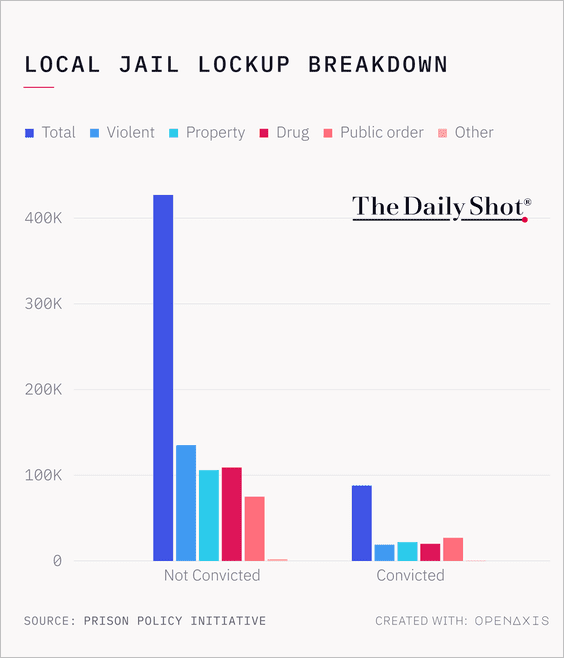 Source: @TheDailyShot
——————–
9. Father’s Day top gift categories:
 Source: MNTN Research Read full article
• Considerations when buying Father’s Day gifts:
 Source: MNTN Research Read full article
——————–
Have a great weekend!
Back to Index