
The Daily Shot: 20-Jun-23
• The United States
• Canada
• The United Kingdom
• The Eurozone
• Europe
• Japan
• China
• Emerging Markets
• Cryptocurrency
• Commodities
• Energy
• Equities
• Credit
• Rates
• Global Developments
• Food for Thought
The United States
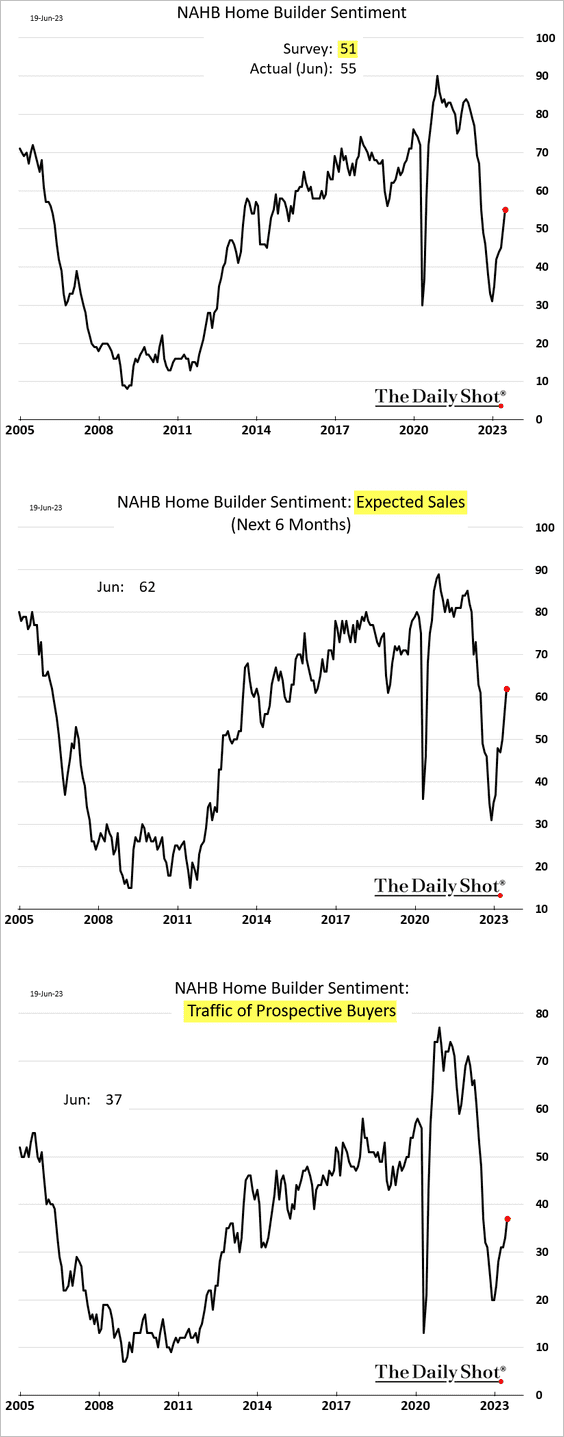
1. Homebuilder sentiment improved again this month as sales expectations climbed.
• However, weak mortgage applications point to downside risks, …
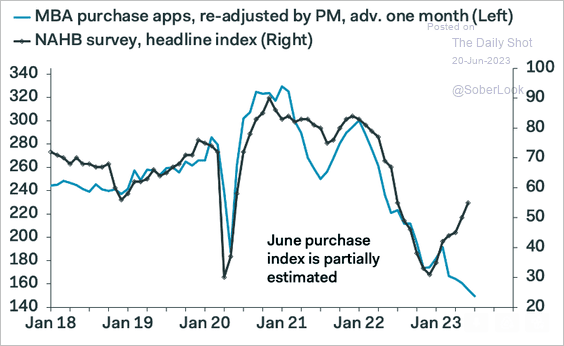 Source: Pantheon Macroeconomics
… with mortgage rates hovering near 7%.
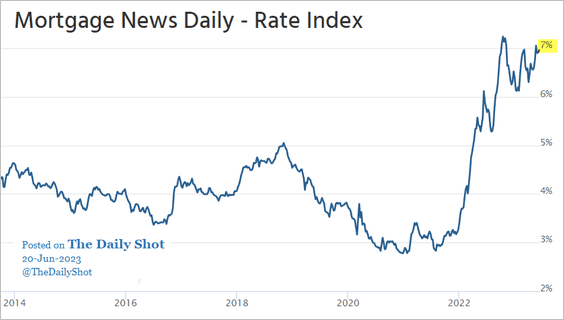 Source: Mortgage News Daily
• Separately, this chart shows new home sales recoveries after housing market busts.
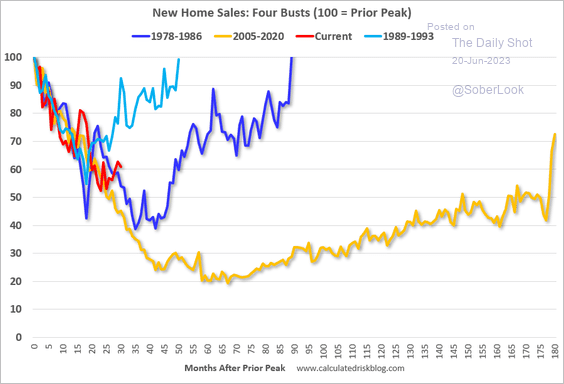 Source: Calculated Risk
——————–
2. Wholesale used car prices declined again.
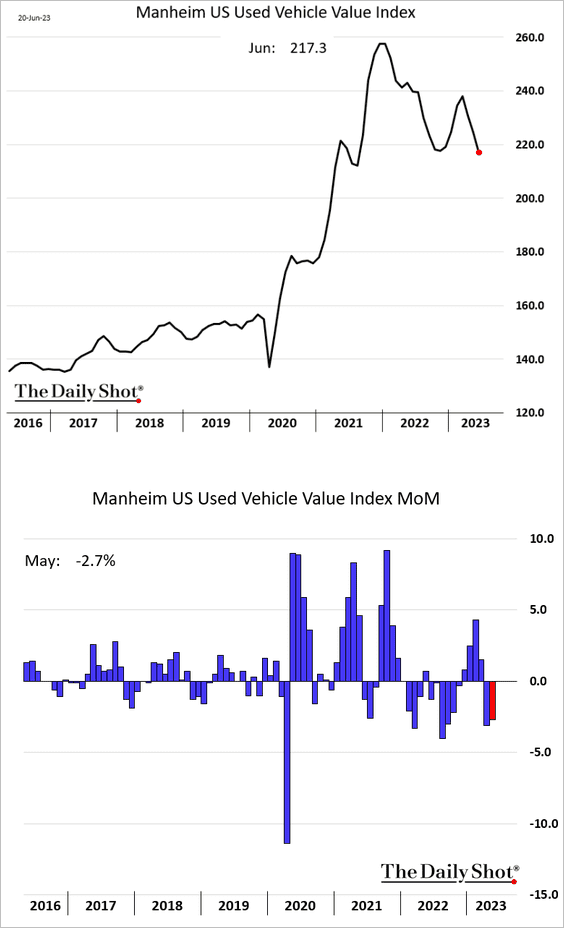
 Source: Cox Automotive Read full article
Used vehicle CPI should be turning negative.
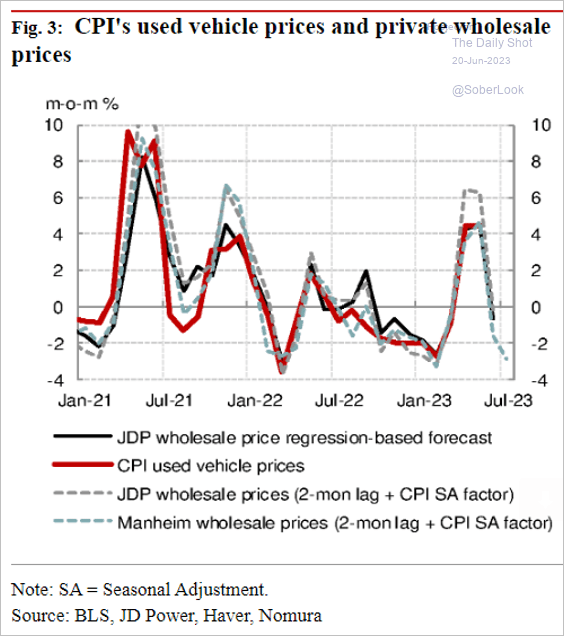 Source: Nomura Securities
——————–
3. Next, we have some updates on the labor market.
• Labor market imbalances persist. This scatterplot shows wage growth vs. the ratio of job openings to unemployment.
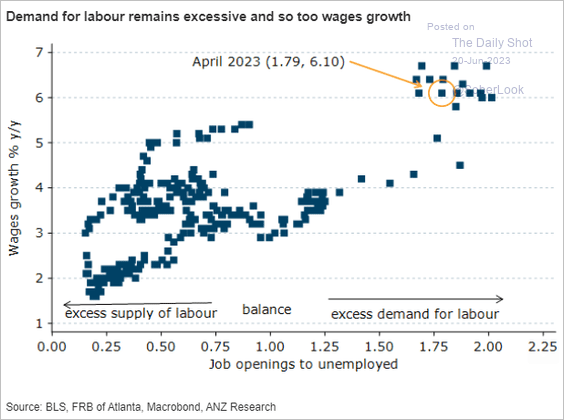 Source: @ANZ_Research
• But there are signs that the labor market is gradually cooling.
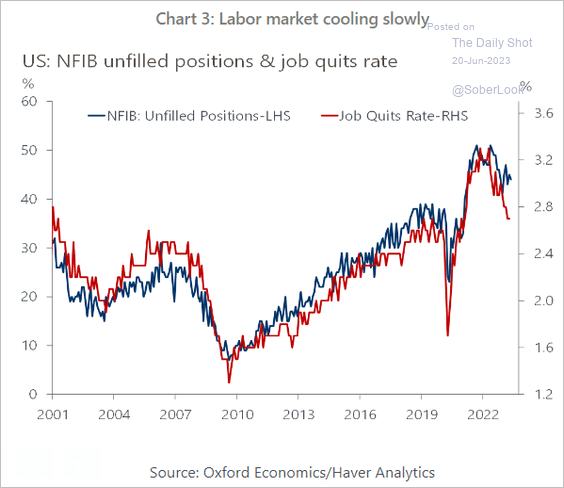 Source: Oxford Economics
• Here is a look at weekly hours worked by sector.
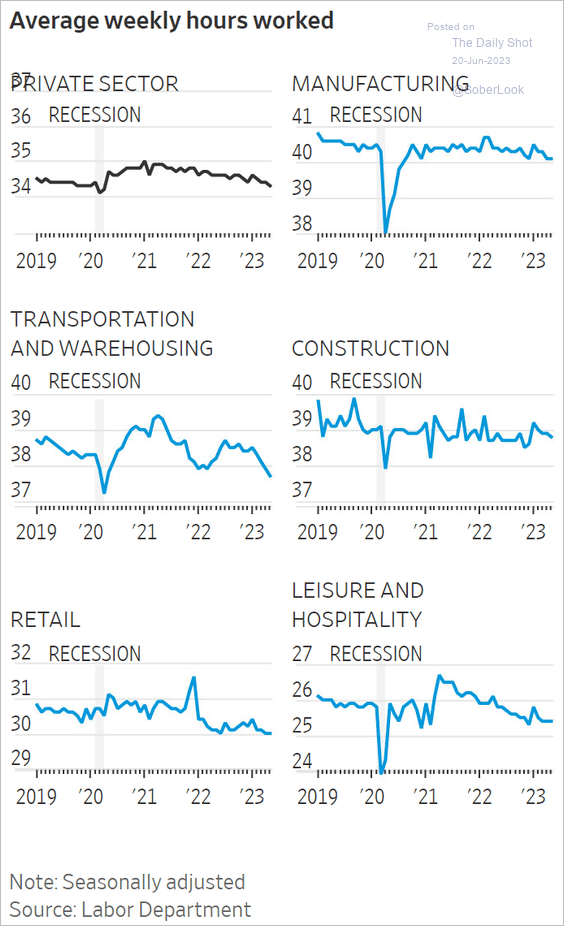 Source: @WSJ Read full article
——————–
4. In contrast to the trends observed in Europe, Americans prefer to spend their excess cash, creating a tailwind for economic growth.
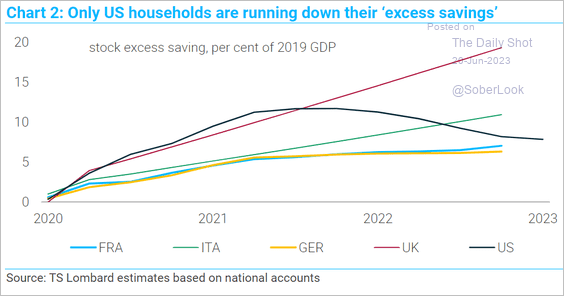 Source: TS Lombard
5. Inventories have been rising at US firms.
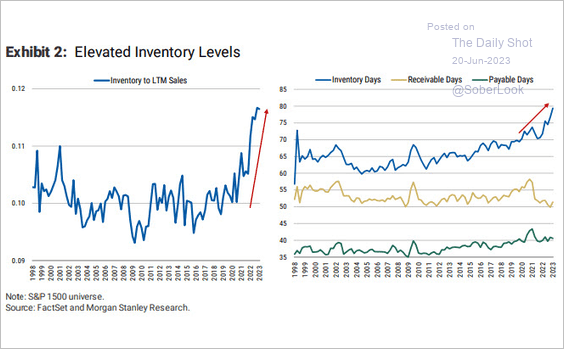 Source: Morgan Stanley Research
Back to Index
Canada
1. Industrial producer price declines have accelerated, …
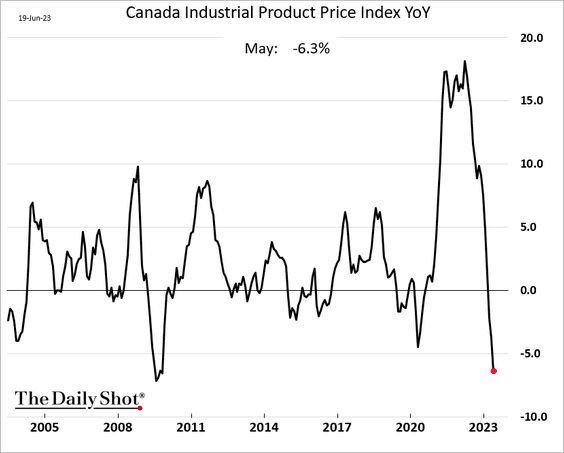
… which should pull consumer inflation lower.
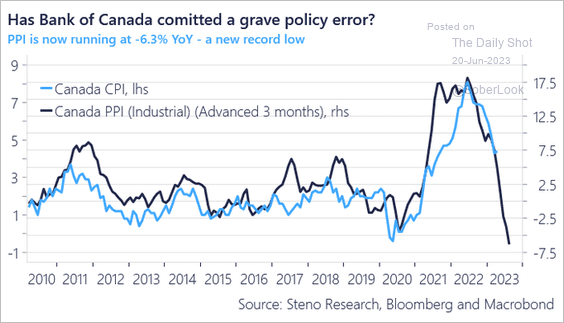 Source: @AndreasSteno
——————–
2. Home prices are rebounding.
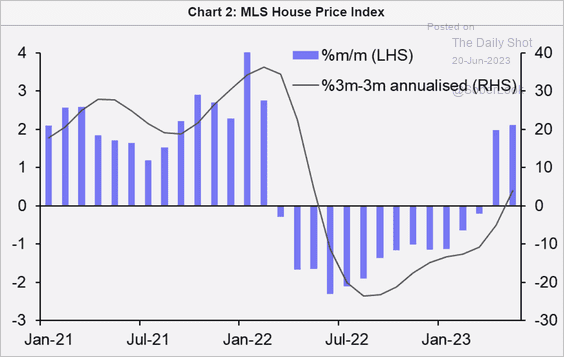 Source: Capital Economics
Back to Index
The United Kingdom
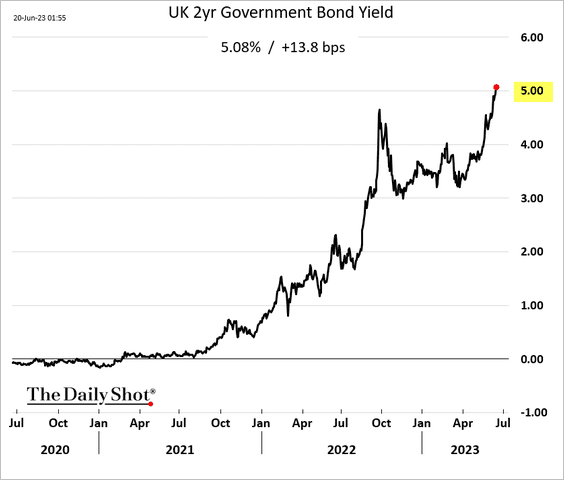
1. The 2-year gilt yield climbed above 5%.
2. How much of the GBP/USD gain is due to the recent USD dollar weakness?
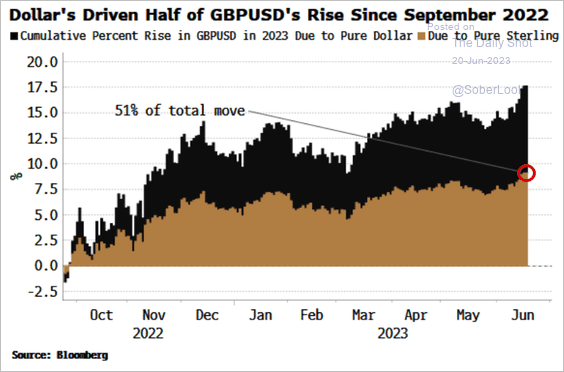 Source: Simon White, Bloomberg Markets Live Blog
3. UK stock valuations are at extreme lows relative to the US.
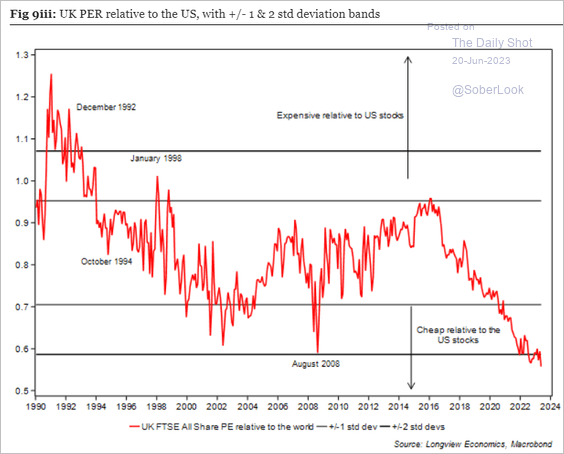 Source: Longview Economics
Back to Index
The Eurozone
1. The bounce in EUR/USD in recent weeks has not been matched by interest rate differentials.
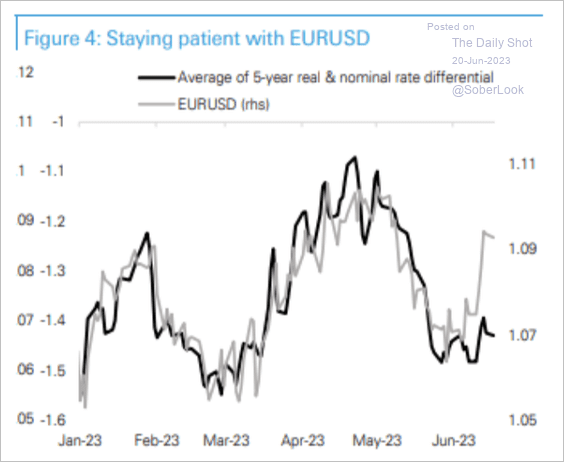 Source: Deutsche Bank Research
2. Based on the options market, inflation risks are tilted to the upside
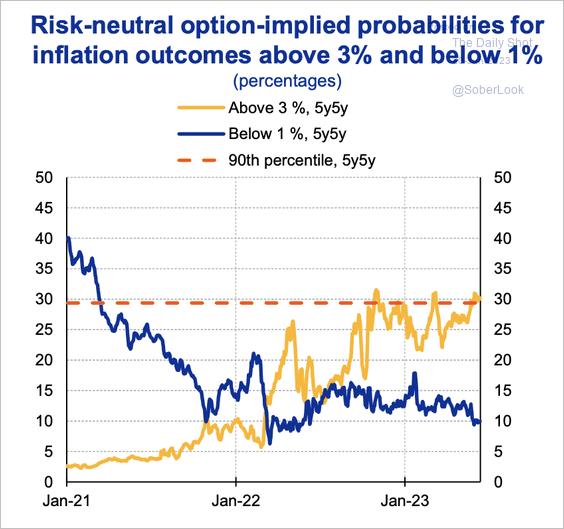 Source: ECB Read full article
Here is an illustration of the euro-area CPI breadth.
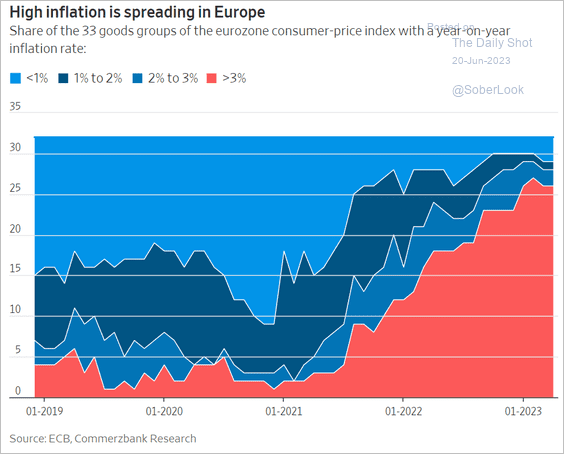 Source: @WSJ Read full article
——————–
3. Rhine water levels are already well below the 10-year average, …
 Source: @JWittels, @business Read full article
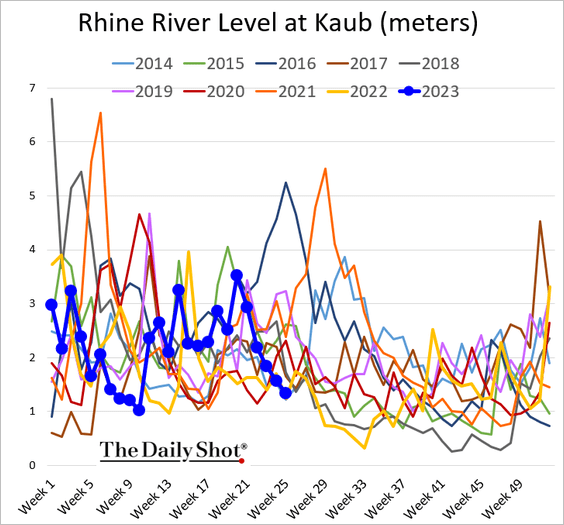
… which could result in higher transport costs.
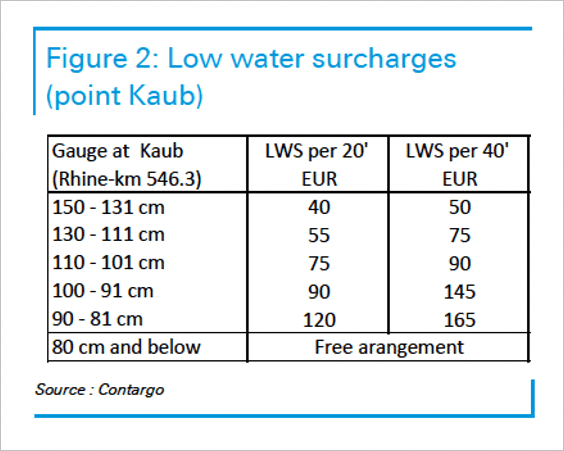 Source: Deutsche Bank Research
Back to Index
Europe
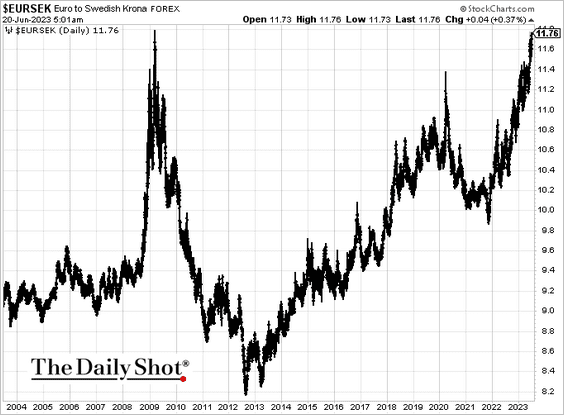
1. The Swedish krona is nearing record lows vs. EUR (chart shows EUR gaining vs. SEK).
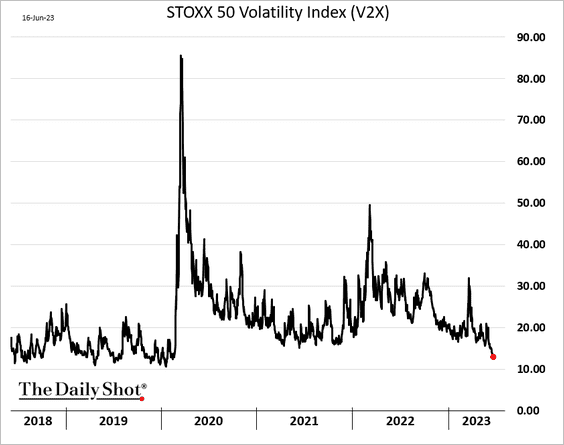
2. The STOXX 50 volatility index is at its lowest level since the initial COVID shock.
3. Here is the EU population percentage at risk of poverty.
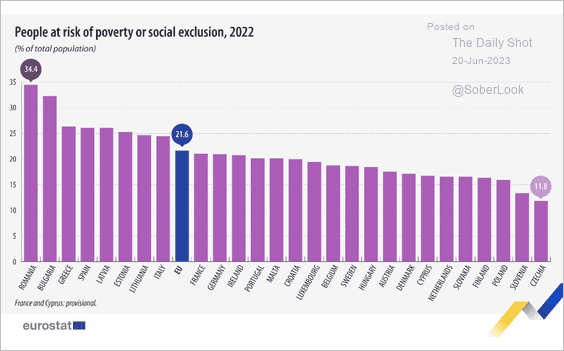 Source: Eurostat Read full article
4. Electricity production from wind and solar is outpacing fossil fuels in the EU.
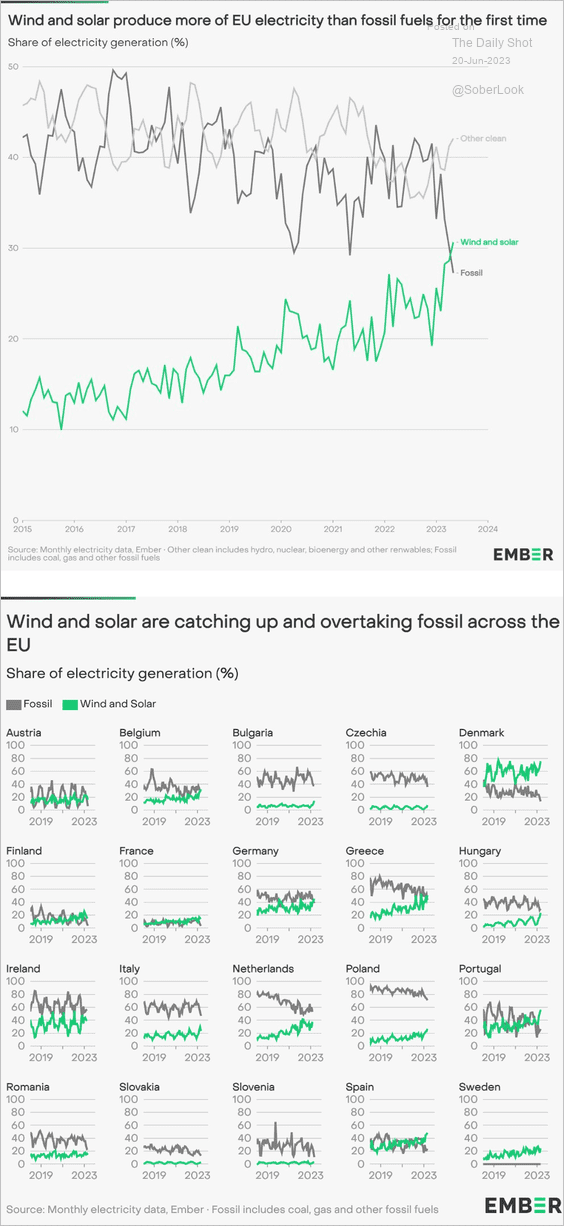 Source: @EmberClimate
Back to Index
Japan
1. The yen typically appreciates during recessions.
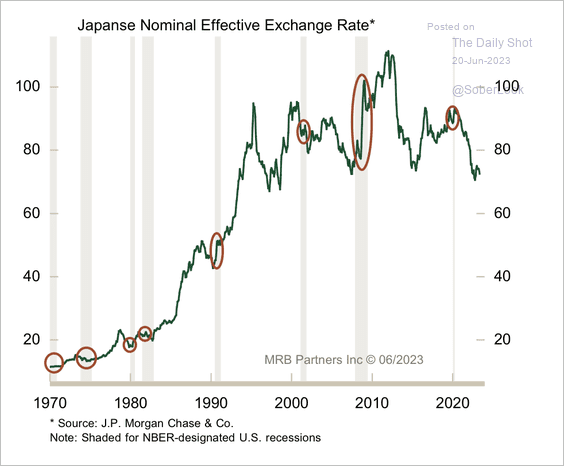 Source: MRB Partners
2. Inflation expectations are high.
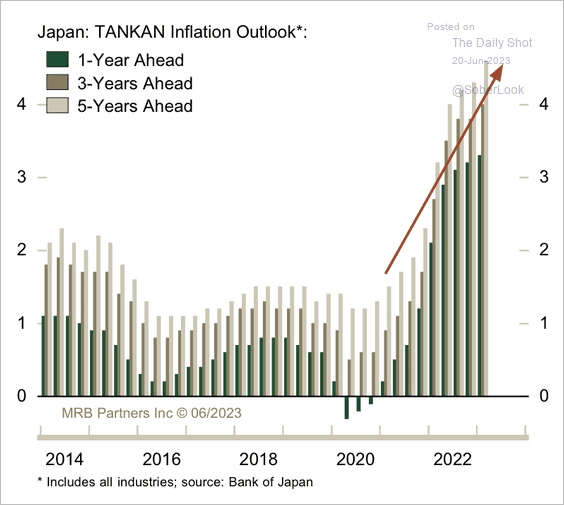 Source: MRB Partners
3. Japan’s major trading houses locked in record profits from rising commodity prices. Two months ago, Berkshire Hathaway increased its stake in these firms.
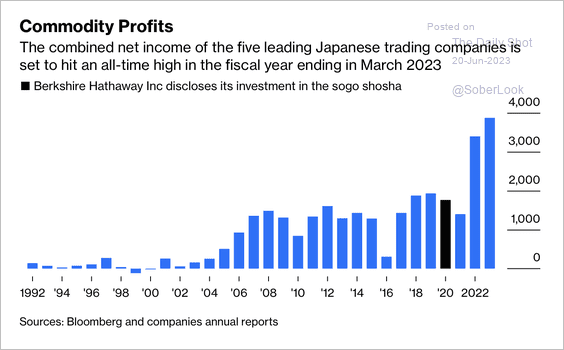 Source: @JavierBlas, @opinion Read full article
Back to Index
China
1. China cut two additional key rates. The 5-year rate reduction is targeting mortgage lending.
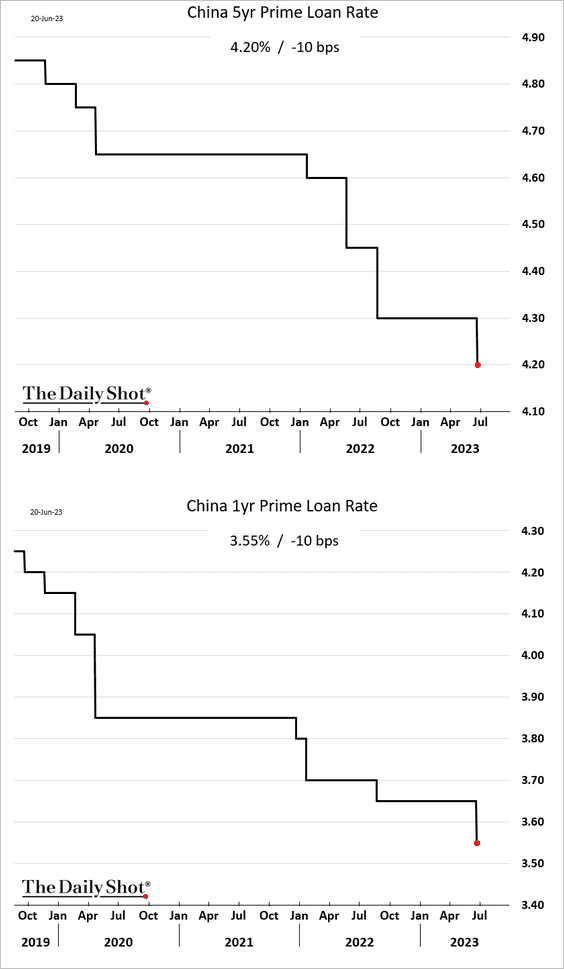
 Source: CNBC Read full article
——————–
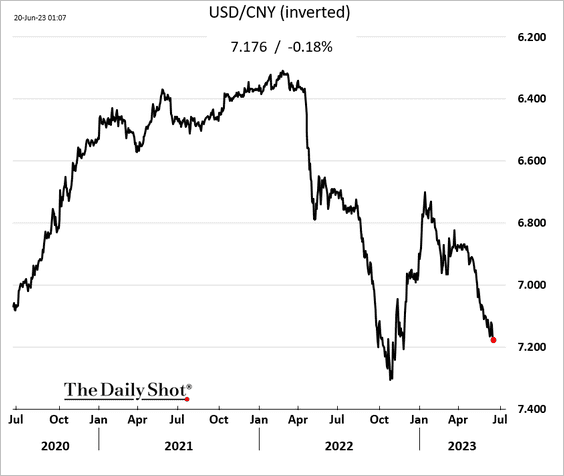
2. The renminbi continues to fall against USD.
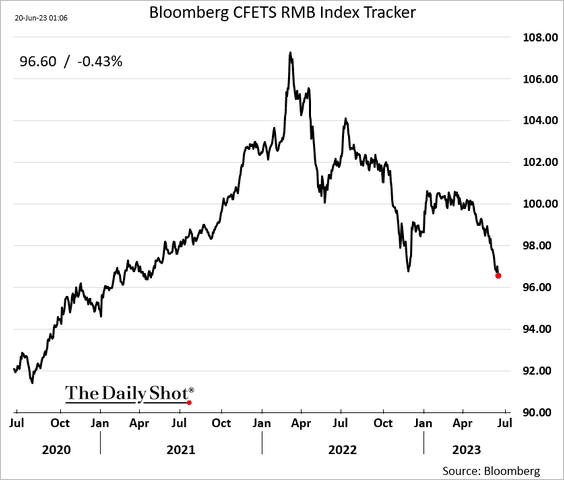
Relative to a basket of currencies, the renminbi hit a multi-year low.
——————–
3. Local government revenues from land sales remain well below last year’s levels.
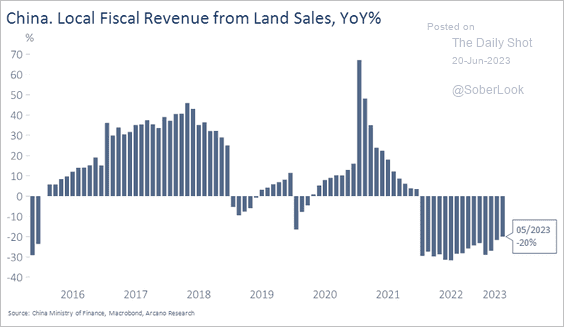 Source: Arcano Economics
4. Manufacturers are shedding jobs.
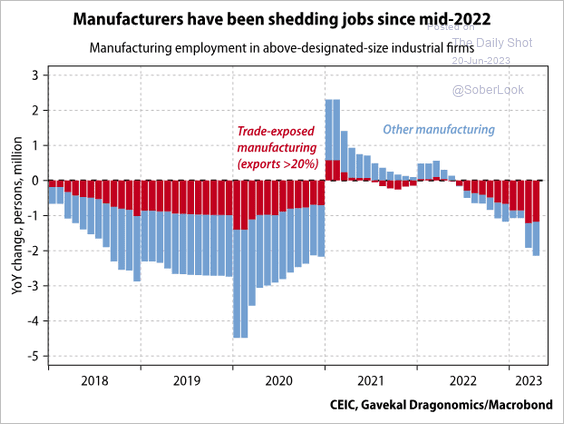 Source: Gavekal Research
5. This chart shows China’s trade in autos.
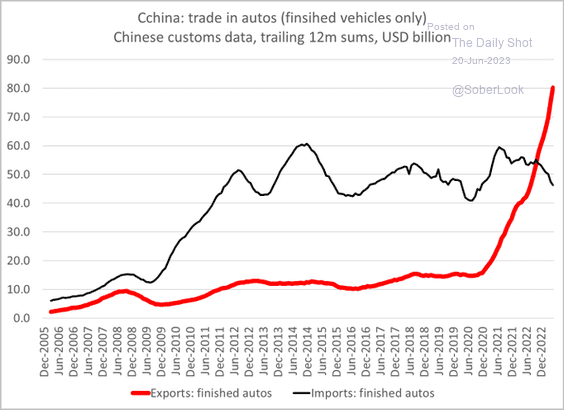 Source: @Brad_Setser
Back to Index
Emerging Markets
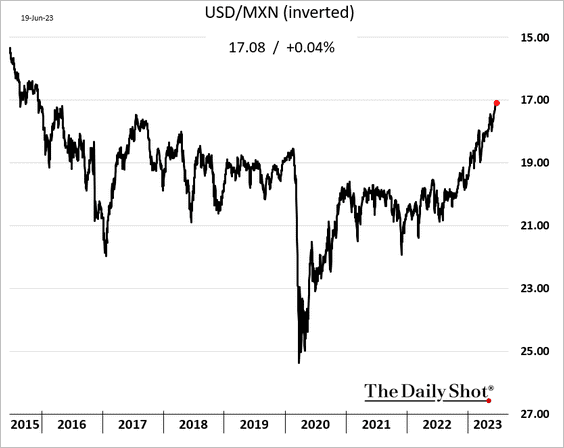
1. The Mexican peso keeps hitting multi-year highs vs. USD.
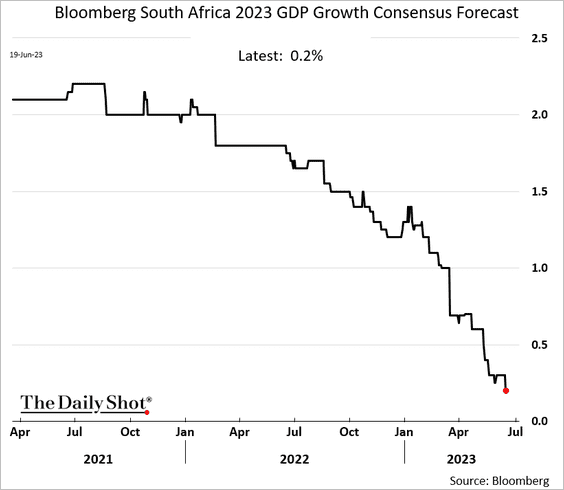
2. Economists continue to downgrade South Africa’s growth forecasts for 2023.
3. The iShares MSCI EM equity ETF (EEM) broke above the downtrend resistance.
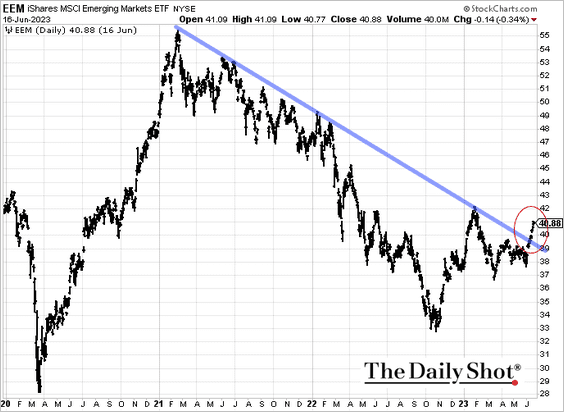 h/t @AkshayChinchal4
4. A common rule of thumb economists use to think about the trajectory for government debt is that it tends to rise when borrowing costs are higher than economic growth (so-called r > g).
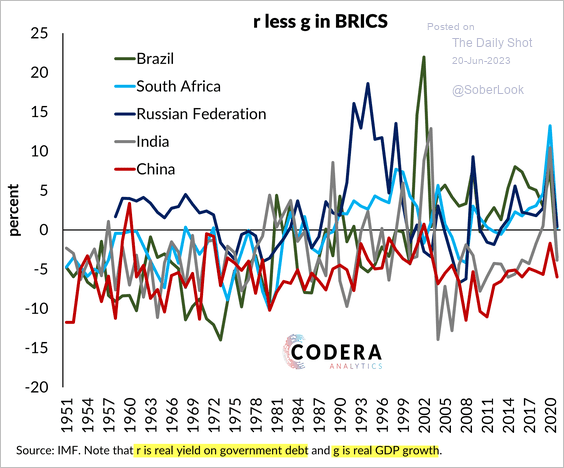 Source: Codera Analytics Read full article
Back to Index
Cryptocurrency
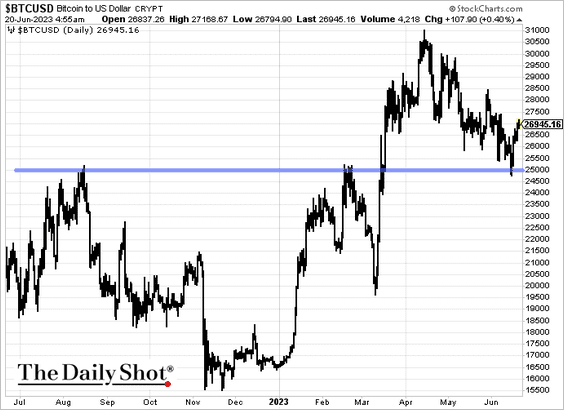
1. Bitcoin held support at $25k.
2. Decentralized finance (DeFi) tokens have underperformed large-cap tokens over the past year. Technicals indicate deeply oversold conditions, which could support a counter-trend bounce.
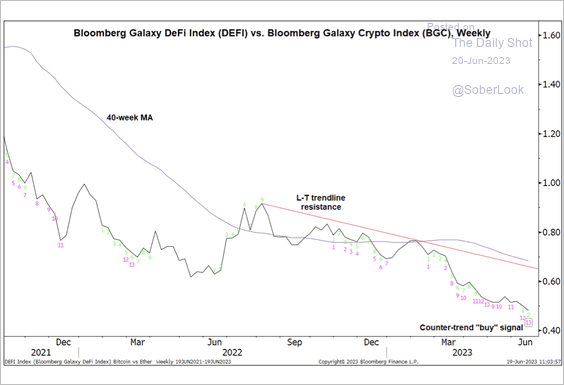 Source: @StocktonKatie
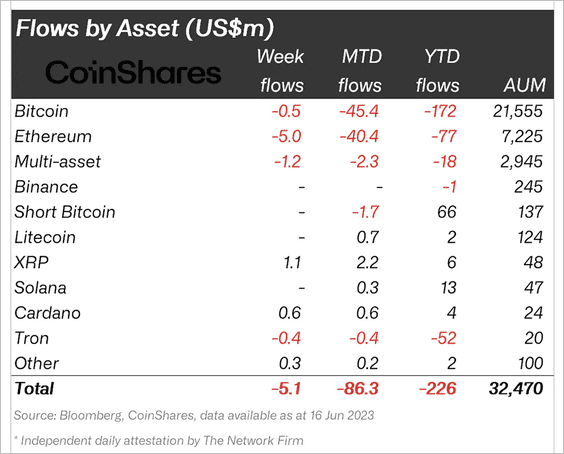
3. Crypto funds saw minor outflows last week driven by Ethereum-focused products. (2 charts)
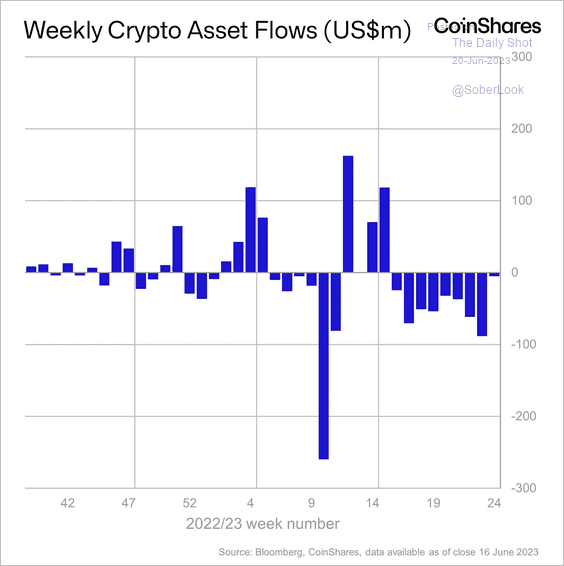 Source: CoinShares Read full article
 Source: CoinShares Read full article
Back to Index
Commodities
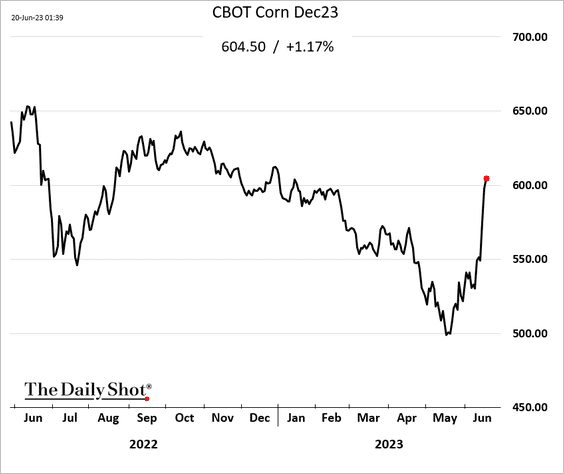
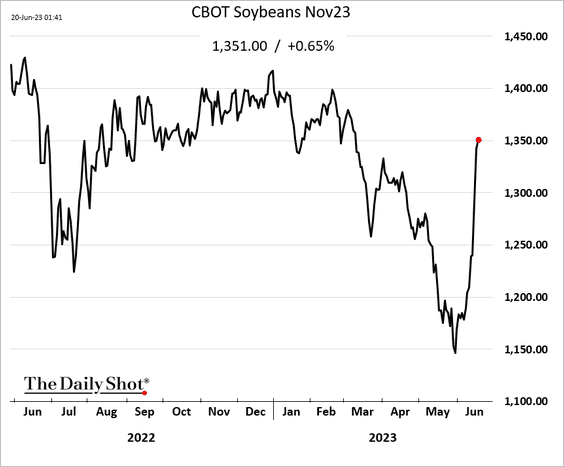
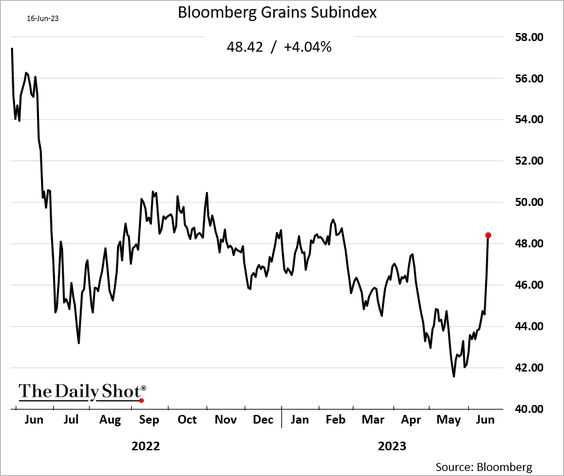
1. Grains continue to strengthen after last week’s surge.
• Corn:
• Soybeans:
• Bloomberg’s grains index:
——————–
2. How does El Niño impact grain crops?
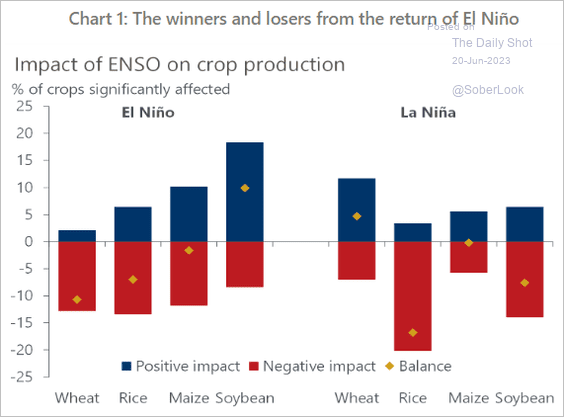 Source: Oxford Economics
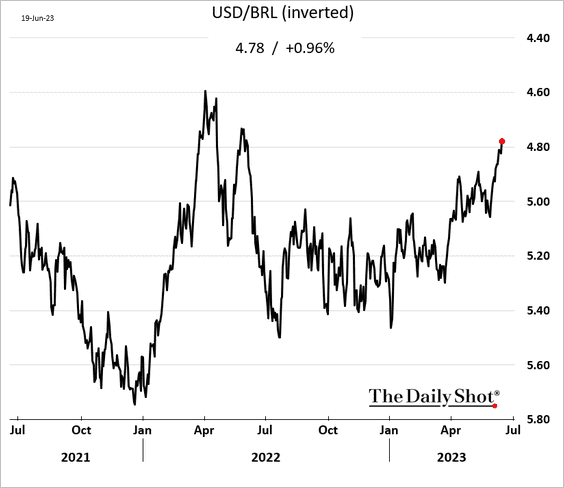
3. Coffee futures are surging in London, …
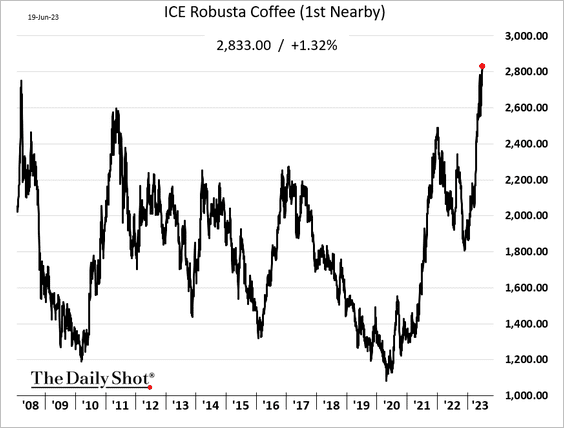
… boosted by a stronger Brazilian real.
——————–
4. Copper prices held the COVID-era uptrend support.
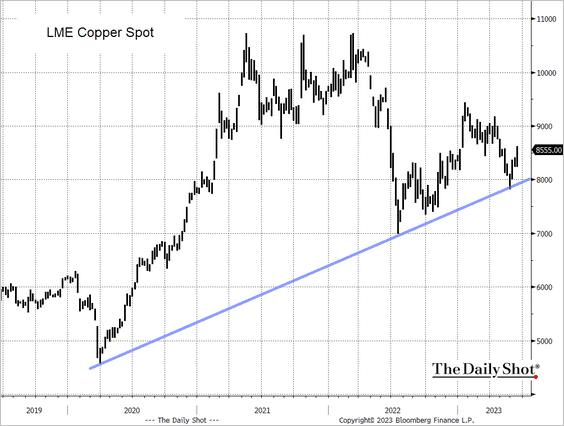 Source: @TheTerminal, Bloomberg Finance L.P.; h/t Alpine Macro
Back to Index
Energy
1. Here is the decomposition of the year-to-date real oil price declines.
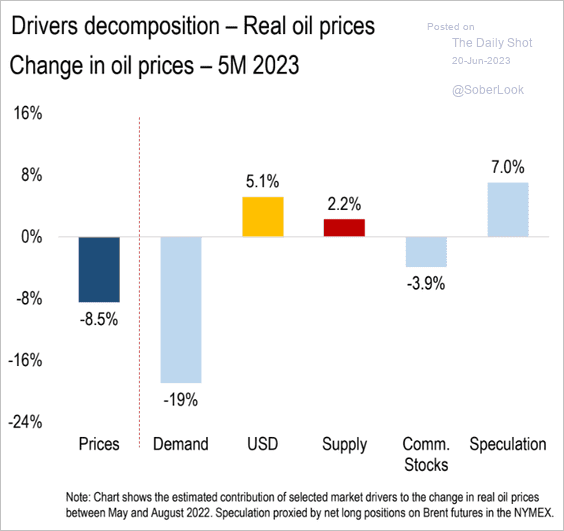 Source: Numera Analytics (@NumeraAnalytics)
2. Brent is still trading at a premium to fair value, according to Numera Analytics.
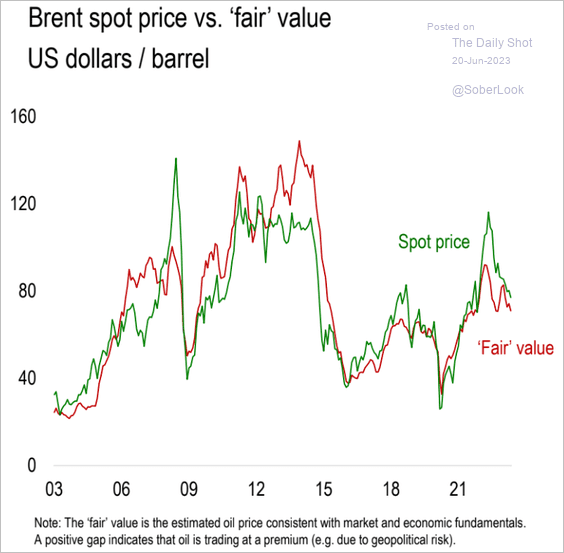 Source: Numera Analytics (@NumeraAnalytics)
3. Greek oil tankers keep moving Russian crude.
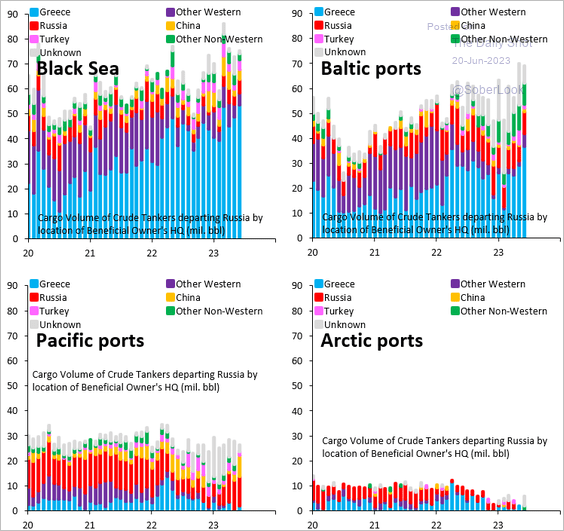 Source: @RobinBrooksIIF
4. Here is a look at OECD electricity production by fuel type (2023 vs. 2022).
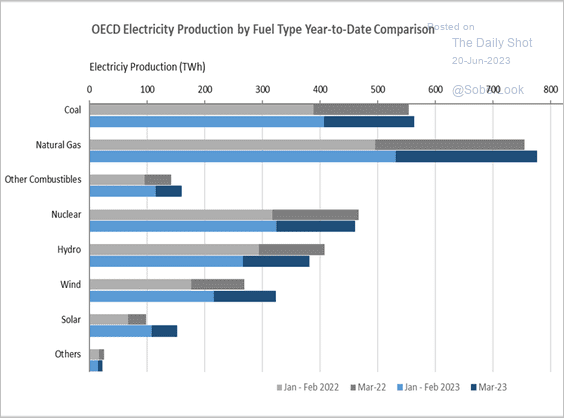 Source: IEA
Back to Index
Equities
1. The market rally has been uneven, led by AI and large-cap tech stocks. Will breadth improve during the next stage of the bull market? (2 charts)
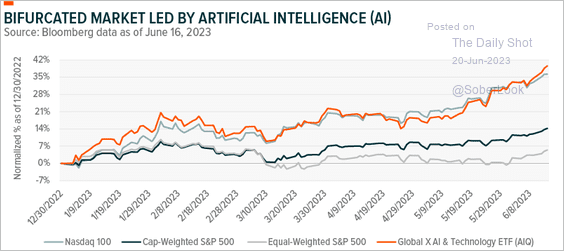 Source: Global X ETFs Read full article
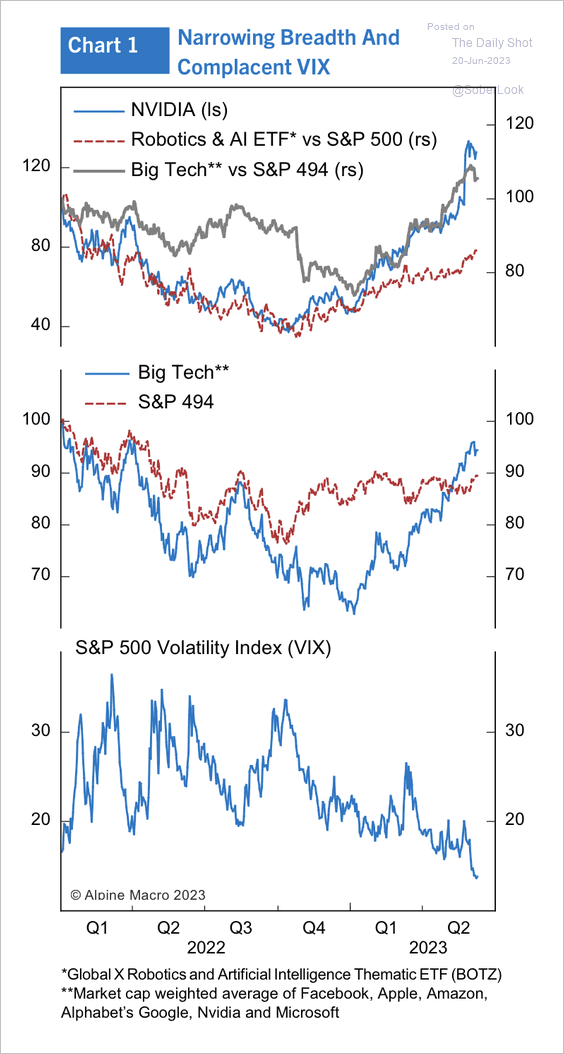 Source: Alpine Macro
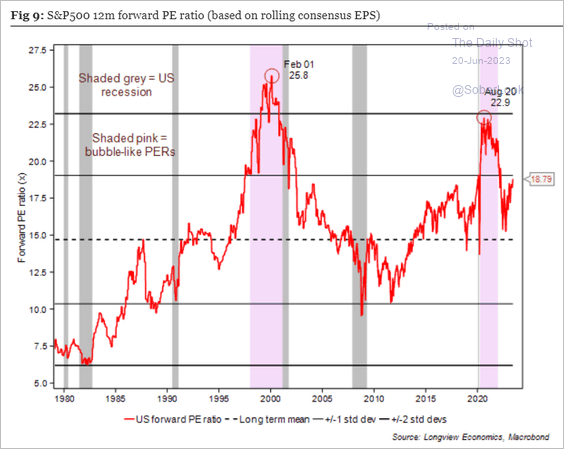
2. According to Longview Economics,
The S&P500 is currently trading on an 18.8x forward P/E ratio, a level which has only been surpassed over the past 40 years during major ‘bubble-like’ events (e.g., the 2000/01 tech bubble & 2020/21 pandemic bubble, see fig 9 below). In that respect, valuation in the US remains rich and towards the top of its historical range.
 Source: Longview Economics
The S&P 500 valuations are bifurcated between the top 10 stocks and the rest of the index.
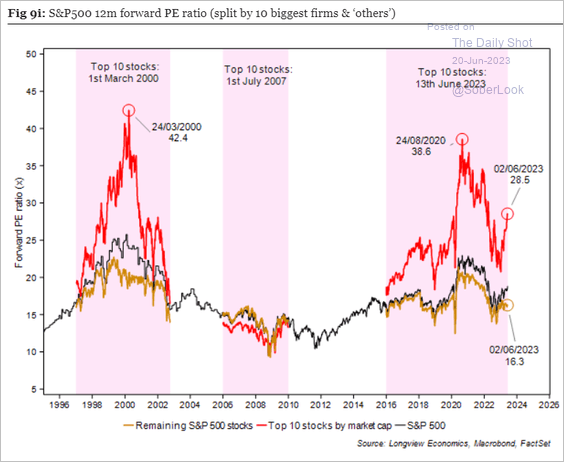 Source: Longview Economics
——————–
3. Here is the percentage of S&P 500 companies with year-over-year price gains.
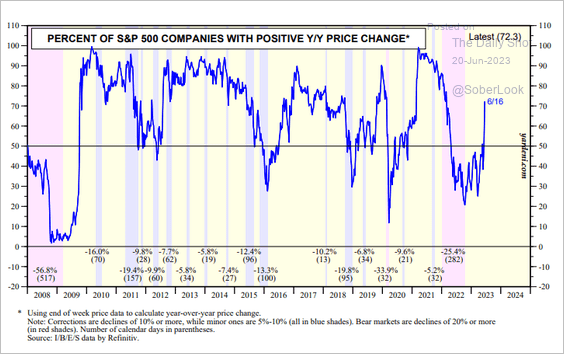 Source: Yardeni Research
And this chart shows the percentage of S&P 500 companies with forward earnings upgrades over the past three months.
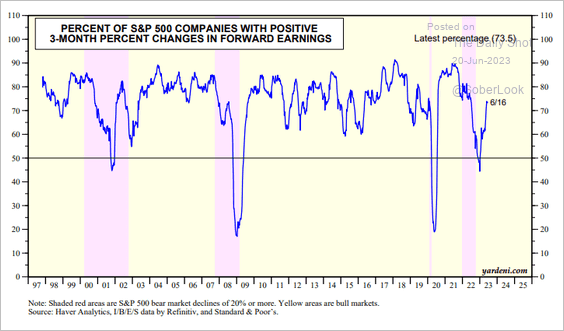 Source: Yardeni Research
——————–
4. The Nasdaq tends to rise into the final Fed rate hike.
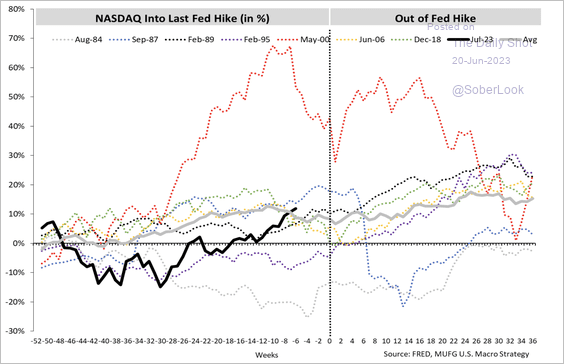 Source: MUFG Securities
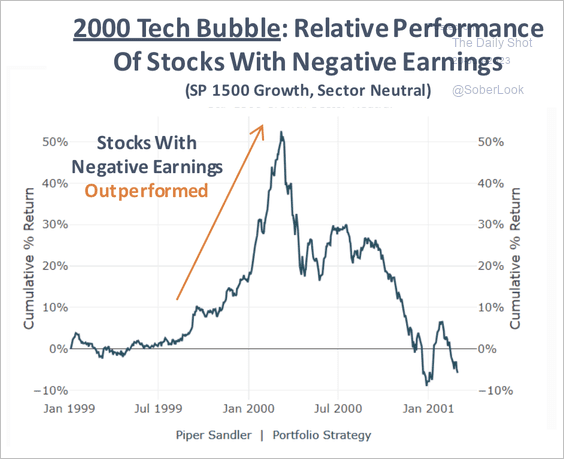
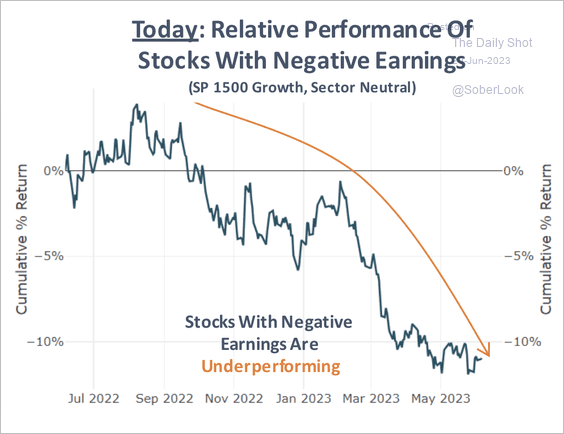
5. There are some differences between today and the 2000 Tech Bubble. (3 charts)
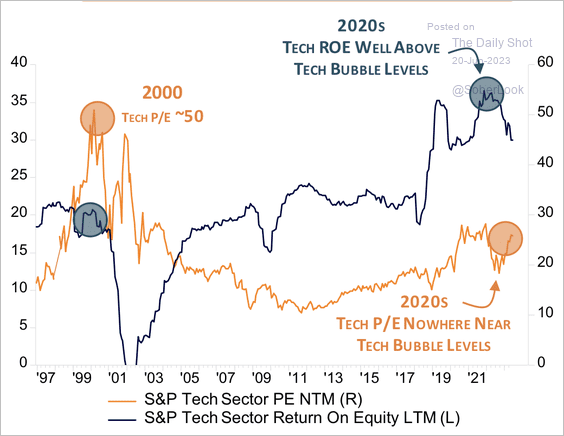 Source: Piper Sandler
 Source: Piper Sandler
 Source: Piper Sandler
——————–
6. Next, we have fund flows by sector, showing a remarkable divergence between energy and tech.
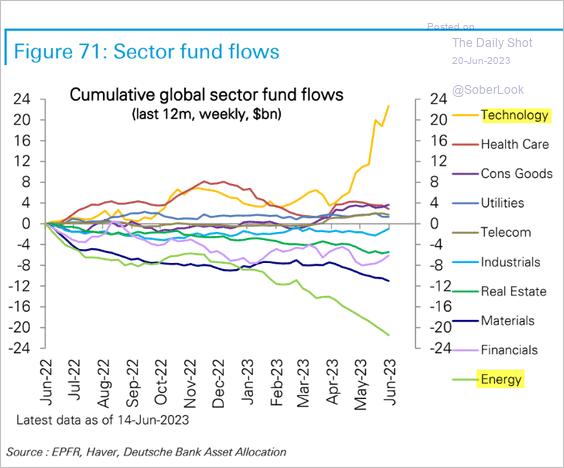 Source: Deutsche Bank Research
7. The growth/tech rally has sharply diverged from real yields.
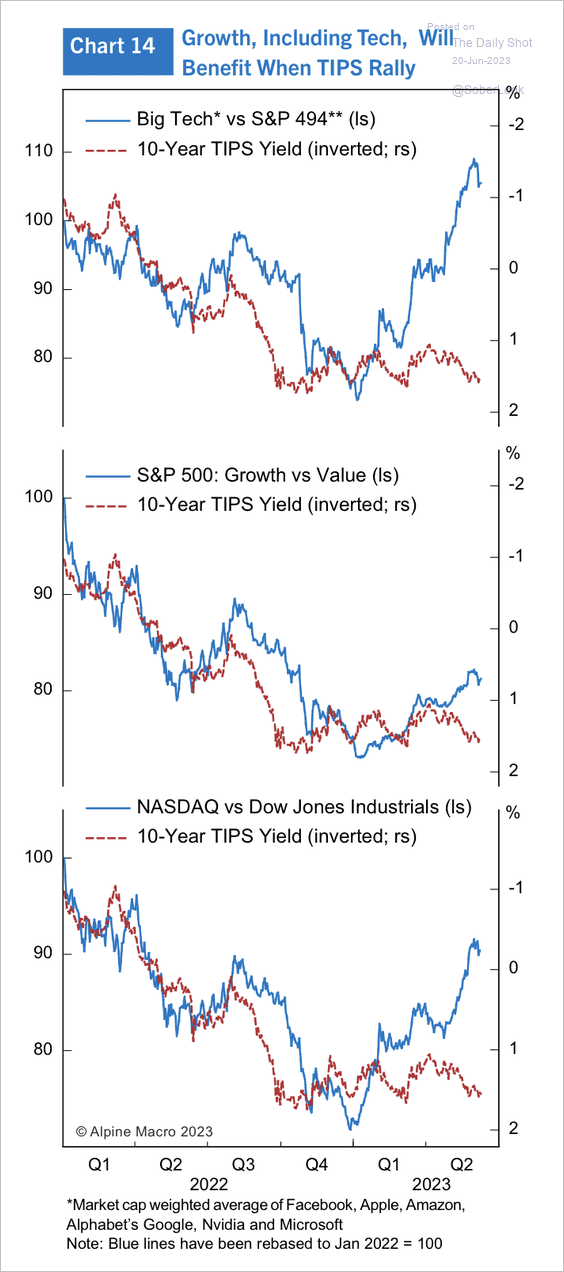 Source: Alpine Macro
8. Retail investors are moving back into call options.
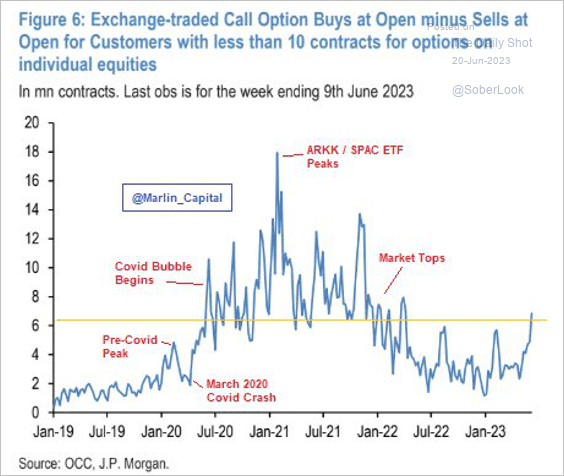 Source: @Marlin_Capital
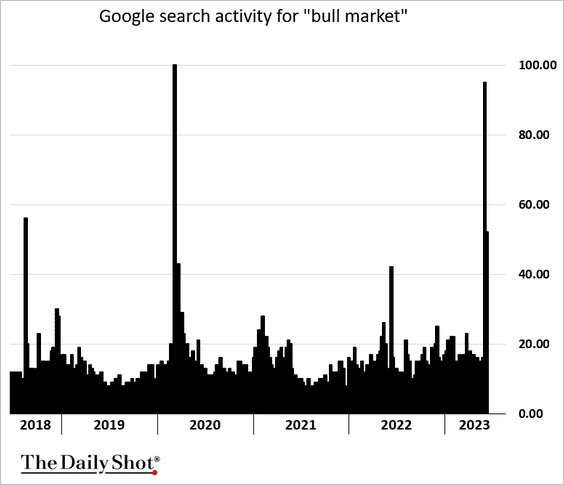
By the way, here is the Google search activity for “bull market.”
——————–
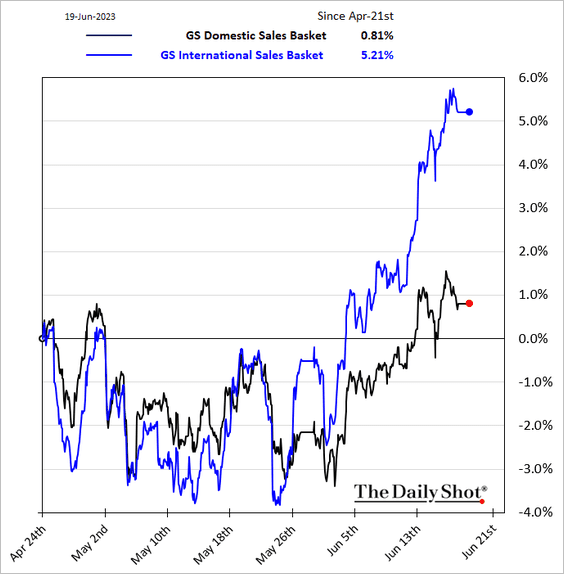
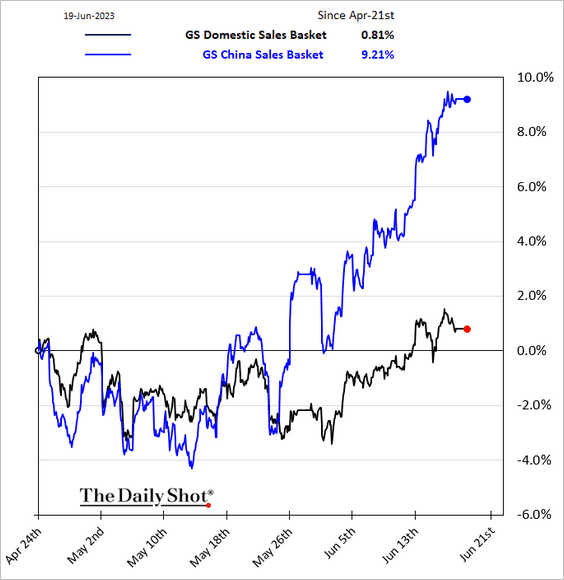
9. Companies with significant foreign sales, especially in China, have been outperforming those primarily reliant on domestic sales.
——————–
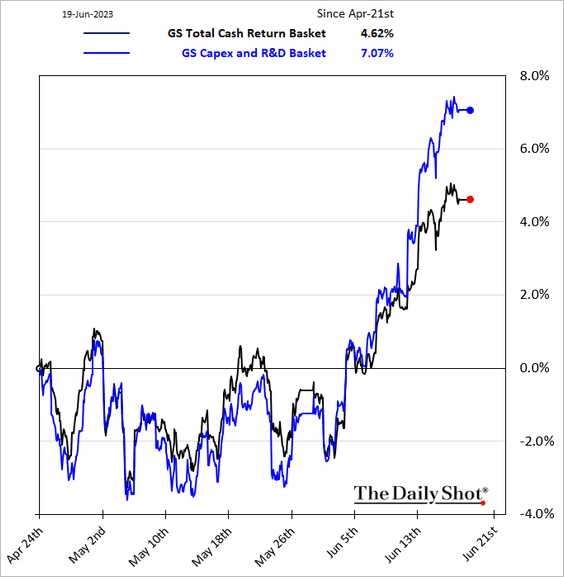
10. Last week, companies with strong CapEx and R&D spending outperformed those focused on dividends and share buybacks.
Back to Index
Credit
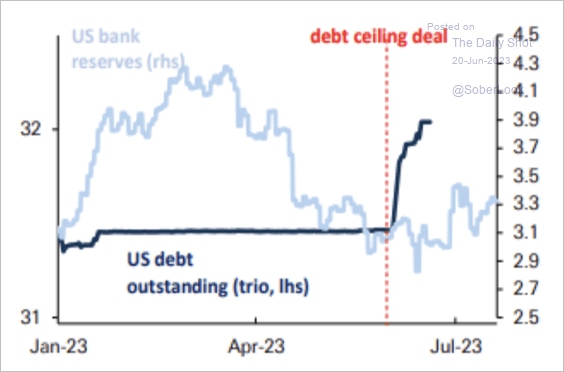
1. So far, there has been no liquidity drain since the debt ceiling deal. According to Deutsche Bank, the increase in T-Bill issuance has been (roughly) fully absorbed by a rotation of liquidity away from the Fed’s RRP facility.
 Source: Deutsche Bank Research
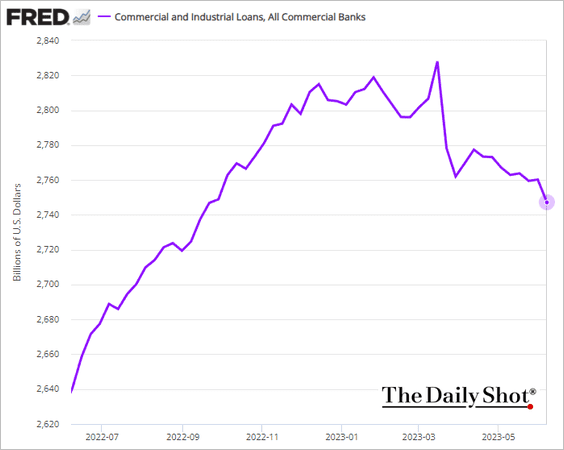
2. US business loan balances on banks’ balance sheets continue to decline.
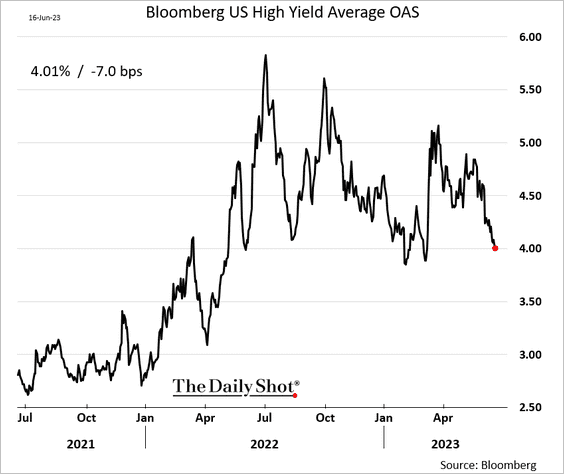
3. High-yield spreads are tightening as stocks rally.
4. Insurance companies and pension funds increased their allocations to corporate bonds, fueled by the search for yield.
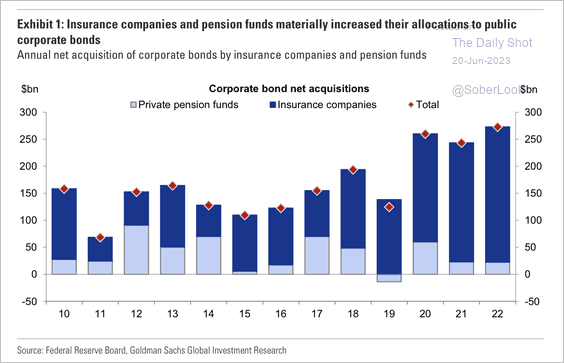 Source: Goldman Sachs
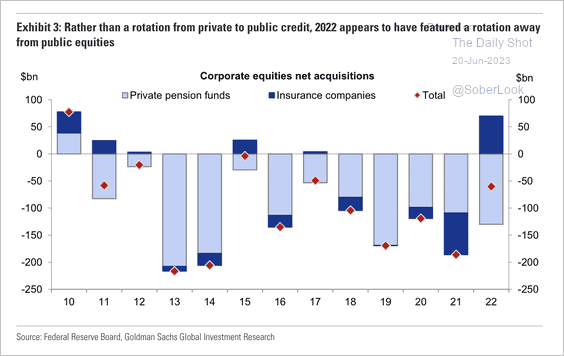
Net acquisitions of corporate equities from insurance companies and pension funds fell sharply in recent years, favoring credit.
 Source: Goldman Sachs
——————–
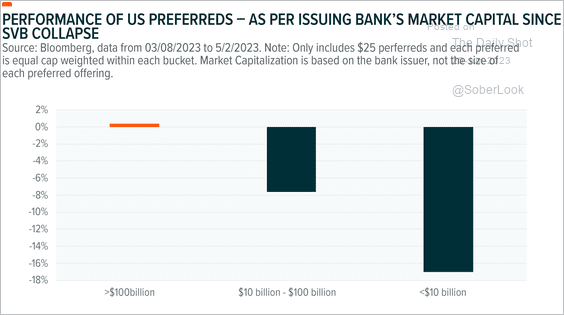
5. Preferred securities issued by larger US banks outperformed those issued by smaller banks since the Silicon Valley Bank collapse.
 Source: Global X ETFs Read full article
Back to Index
Rates
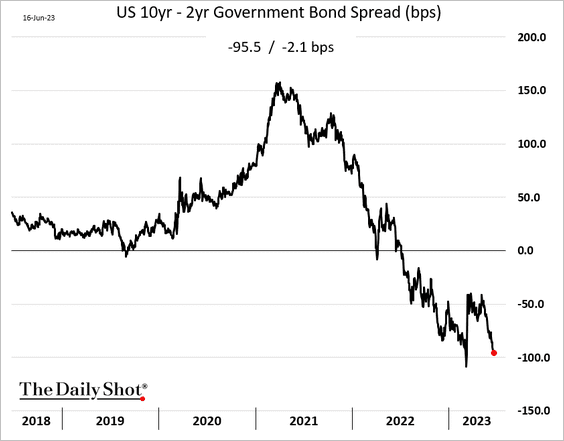
1. The 10-year/2-year Treasury curve inversion continues to deepen.
2. The 1998-2002 analog suggests 5s/30s Treasury curve steepening is ahead.
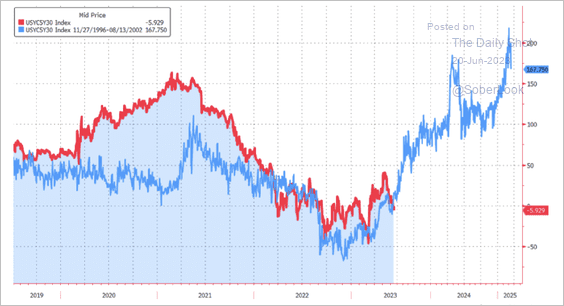 Source: MUFG Securities
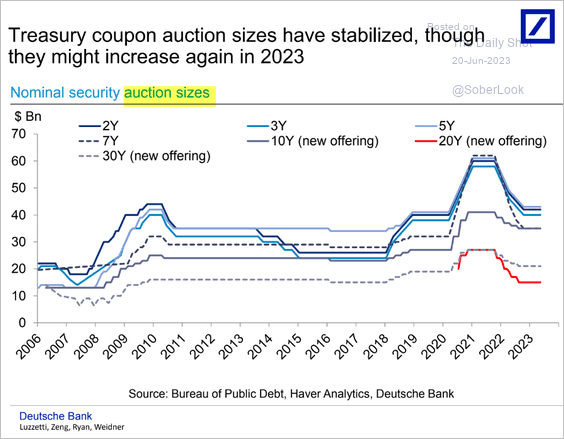
3. This chart shows Treasury auction sizes for notes and bonds.
 Source: Deutsche Bank Research
Back to Index
Global Developments
1. The global real policy rate is about to turn positive as inflation slows.
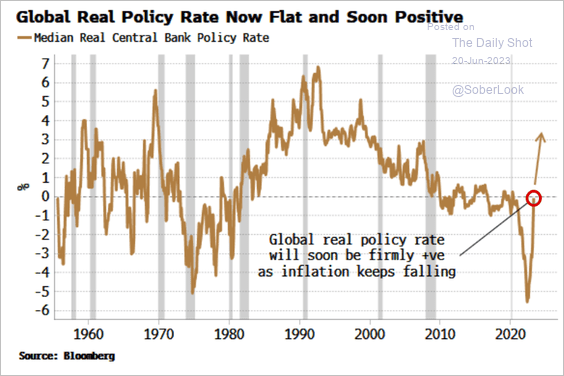 Source: Simon White, Bloomberg Markets Live Blog
2. The global stock/bond ratio made a new high reflecting risk-on conditions.
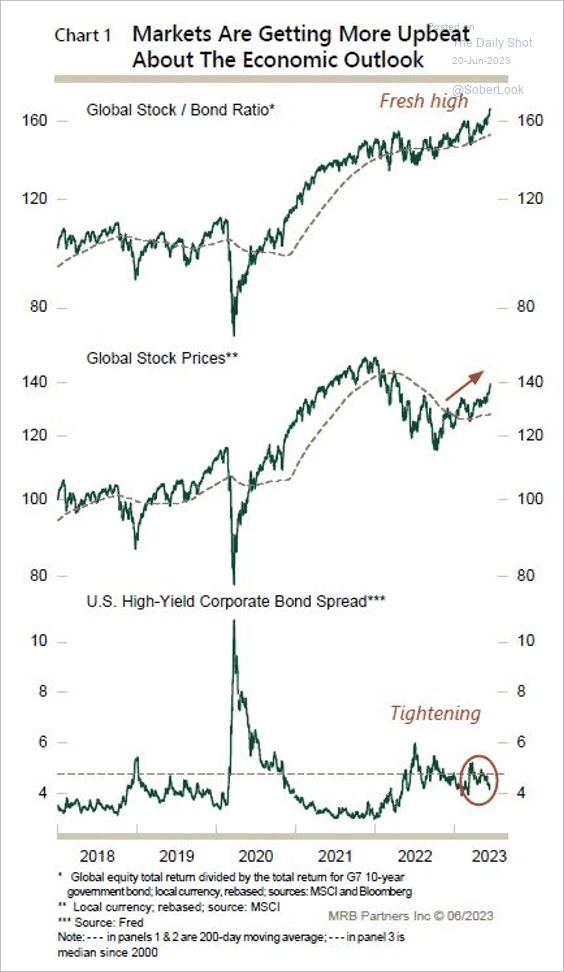 Source: MRB Partners
——————–
Food for Thought
1. Americans’ international in-person credit and debit card spending:
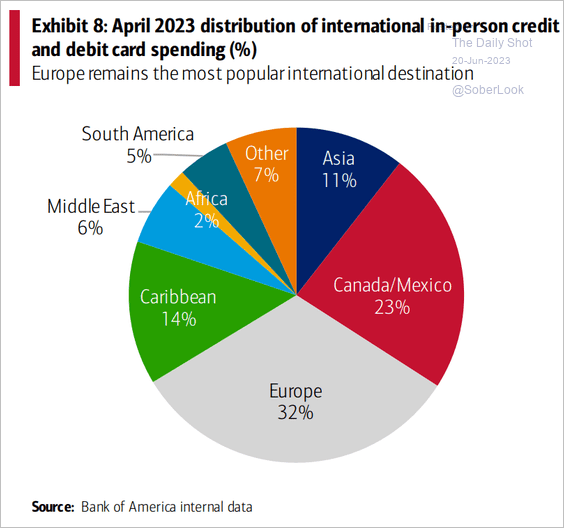 Source: BofA Global Research
2. The private jet market:
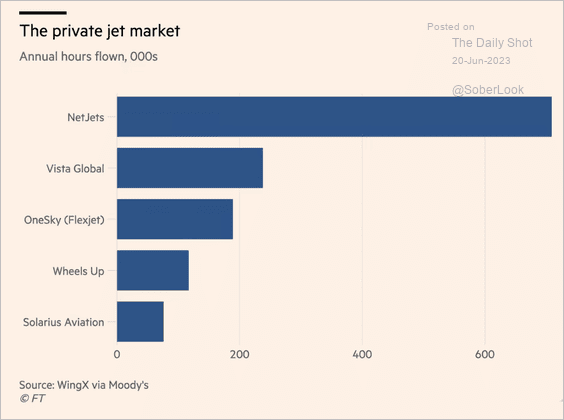 Source: @financialtimes Read full article
3. US train derailments by cause:
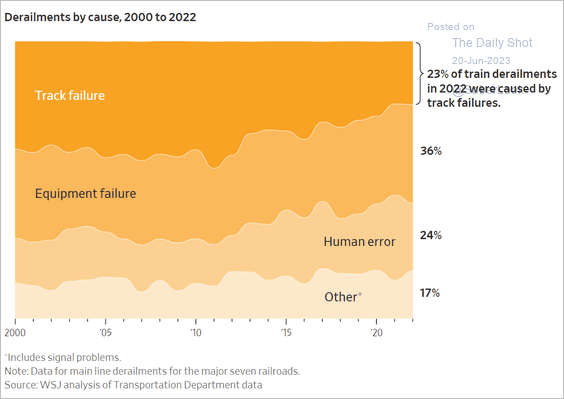 Source: @WSJ Read full article
4. Rental movers by reasons for moving:
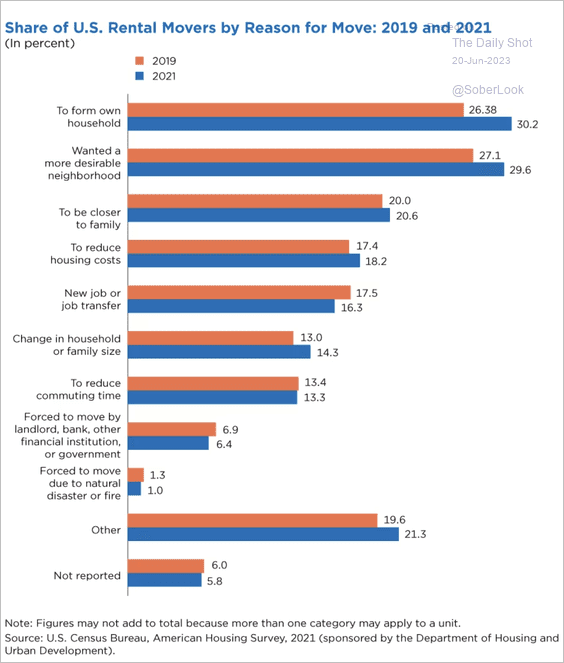 Source: U.S. Census Bureau Read full article
5. US federal spending by category:
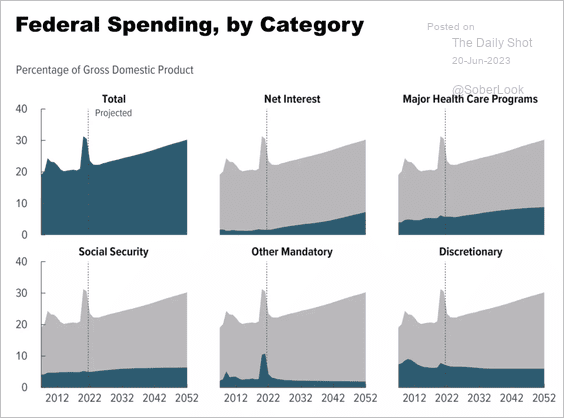 Source: CBO
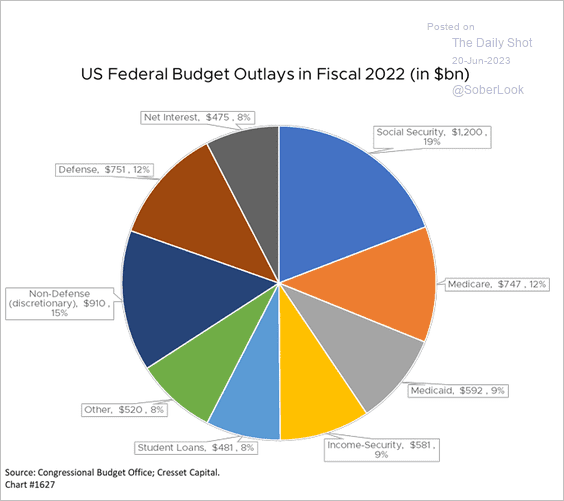 Source: Jack Ablin, Cresset Wealth Advisors
• Federal government debt and deficit projections:
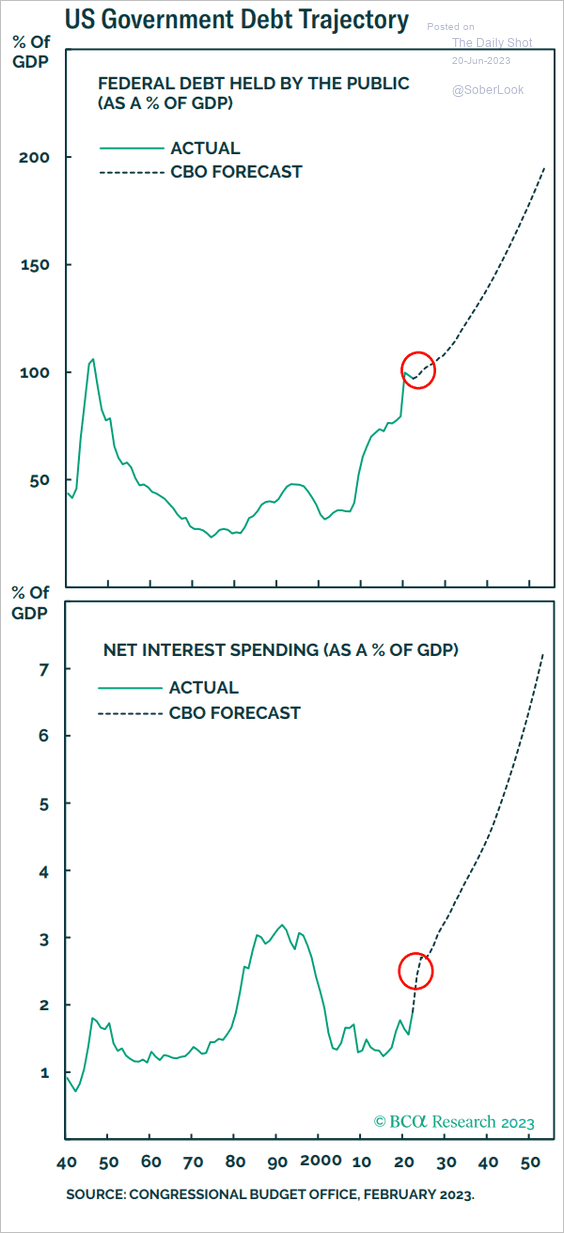 Source: BCA Research
——————–
6. International students in the US (top seven countries):
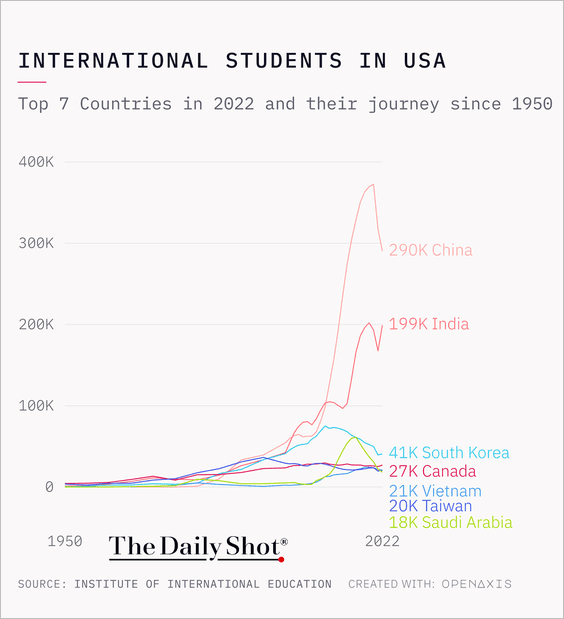 Source: @TheDailyShot
7. Global-average temperatures:
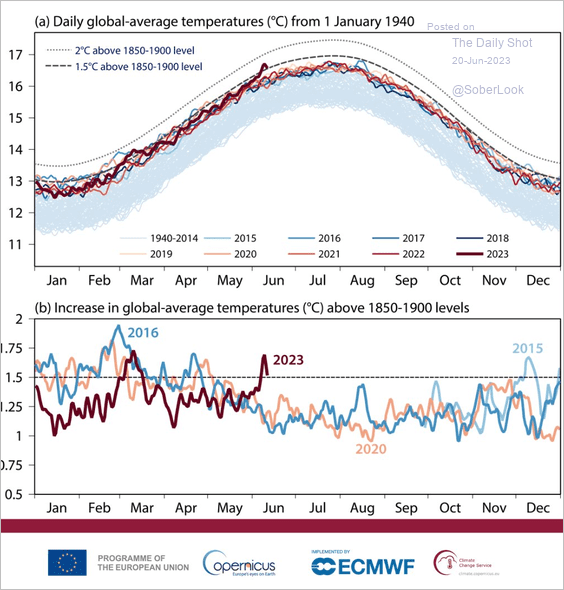 Source: Copernicus Read full article
8. Legality and practice of the death penalty:
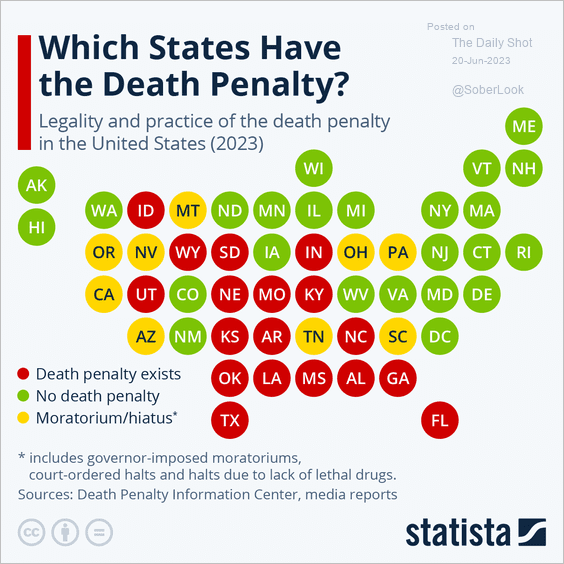 Source: Statista
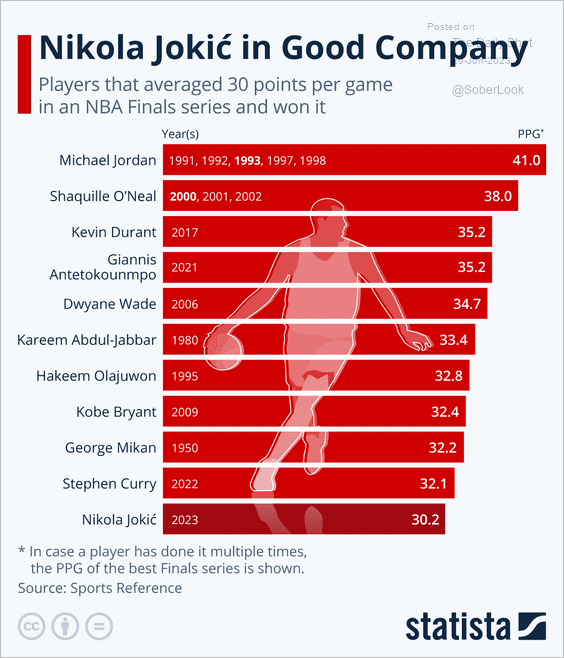
9. Players that averaged 30 points per game in NBA Finals and won it:
 Source: Statista
——————–
Back to Index