
The Daily Shot: 26-Jun-23
• The United States
• The United Kingdom
• The Eurozone
• Europe
• Japan
• Asia-Pacific
• China
• Emerging Markets
• Commodities
• Energy
• Equities
• Credit
• Rates
• Global Developments
• Food for Thought
The United States
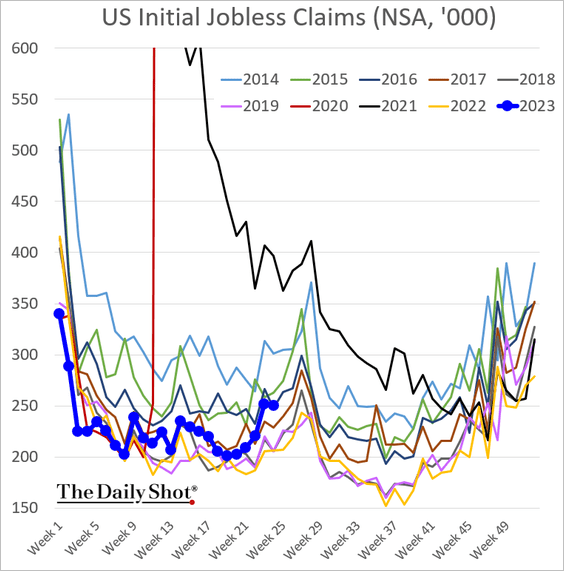
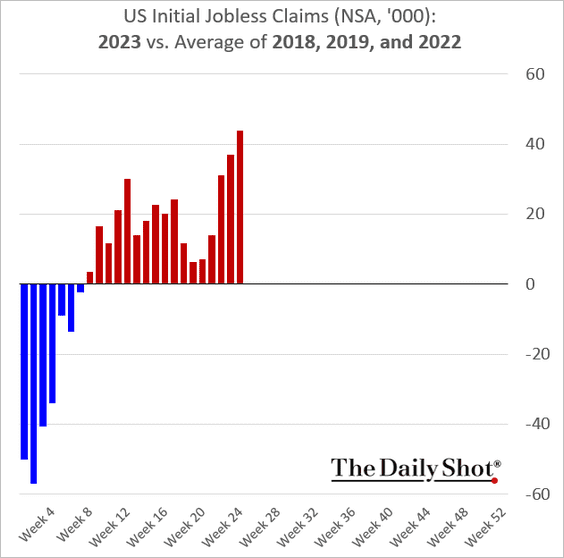
1. Initial jobless claims remain elevated compared to pre-COVID levels as well as 2022.
 Source: @economics Read full article
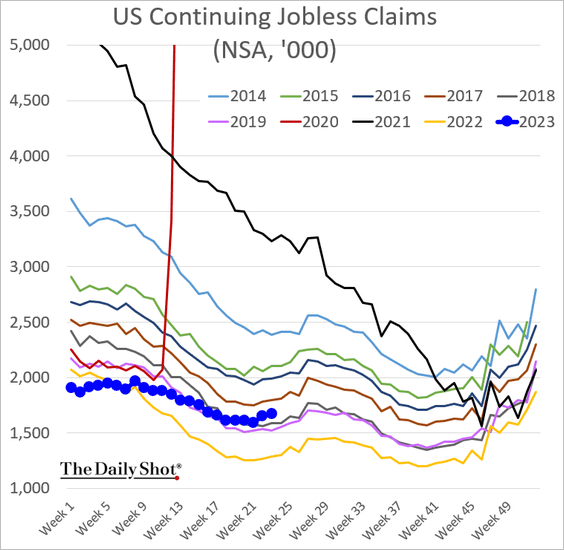
Here are the continuing jobless claims.
——————–
2. Existing home sales remain depressed but were slightly above forecasts last month.
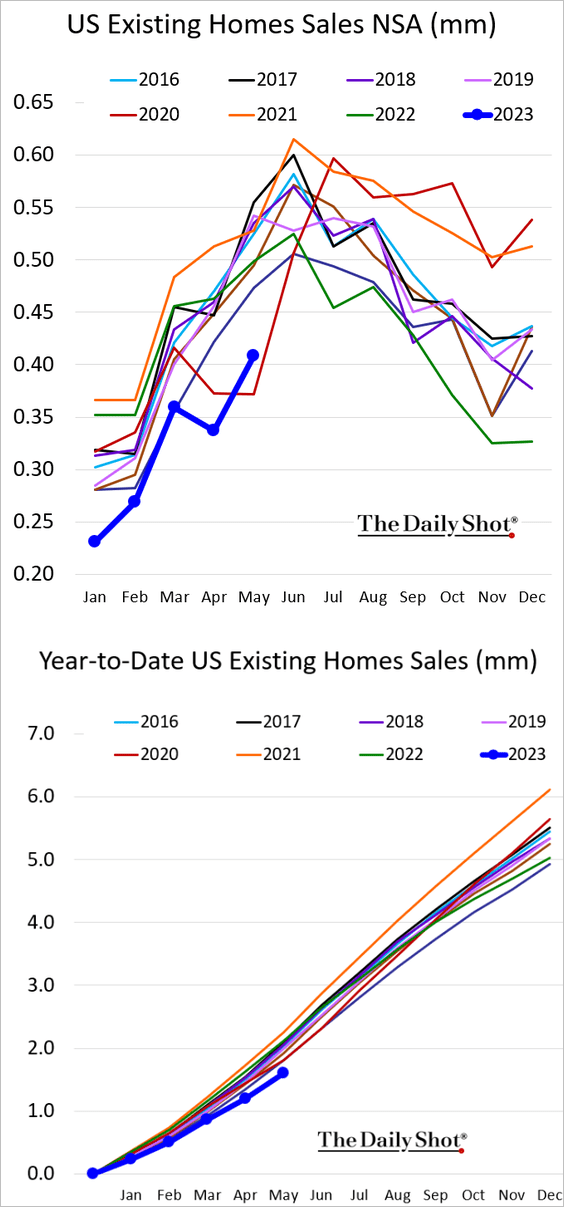
• Absolue inventories hit a multi-year low (first panel below). The second panel shows the months of supply, which remains above last year’s levels due to sluggish sales.
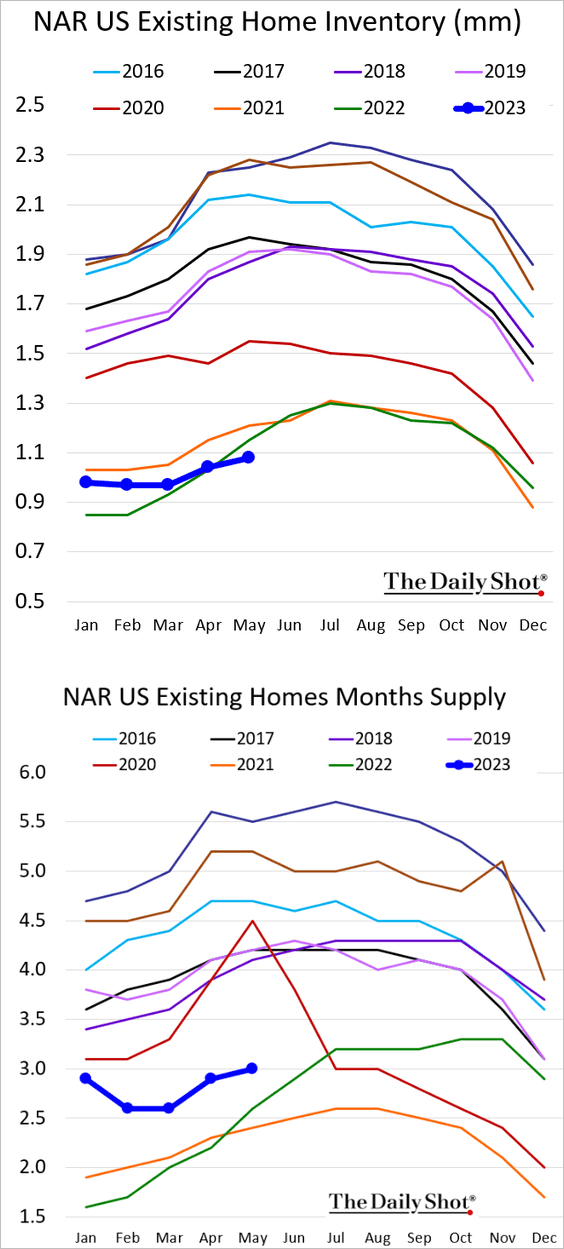
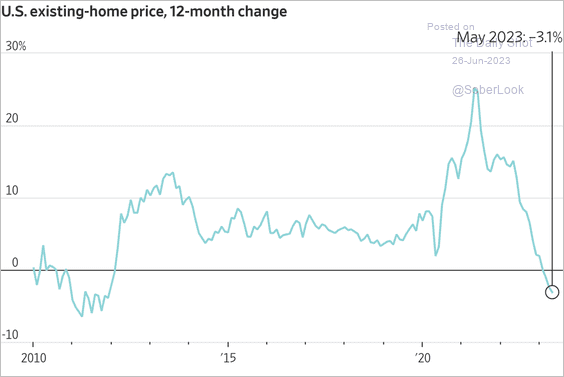
• Prices continue to ease.
 Source: @WSJ Read full article
 Source: Reuters Read full article
——————–
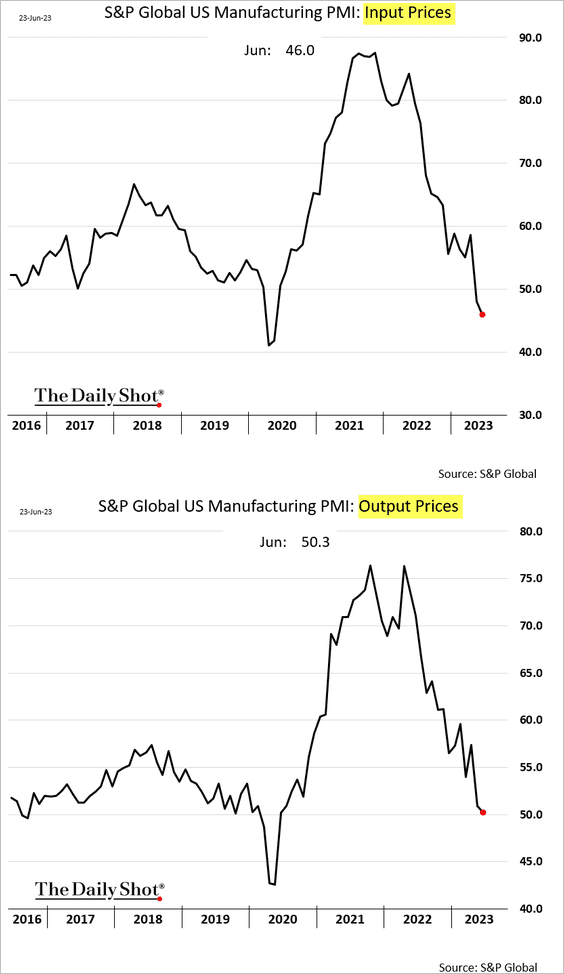
3. US manufacturing activity deteriorated this month, according to S&P Global PMI. Factories are reporting falling orders.
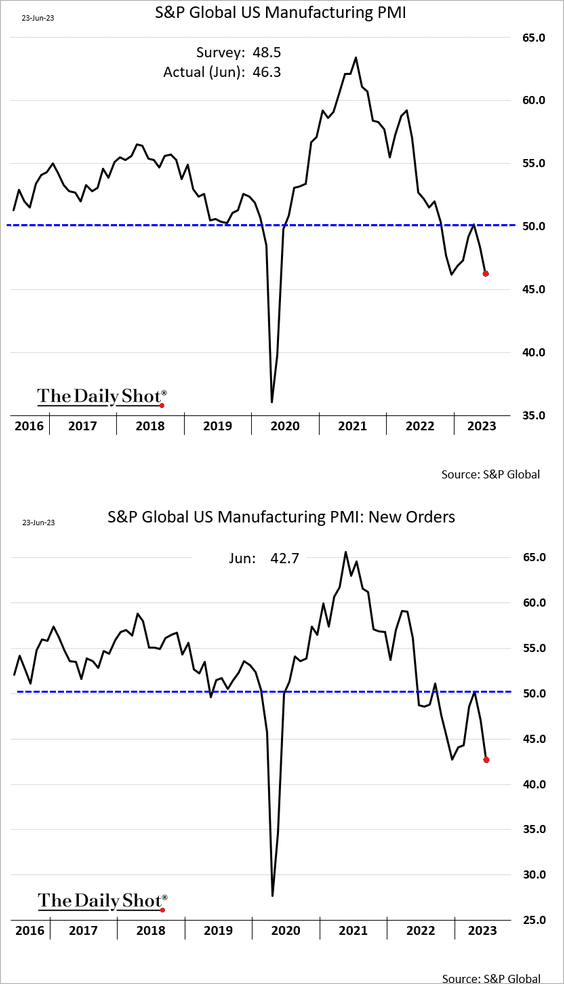
– Price pressures have been easing.
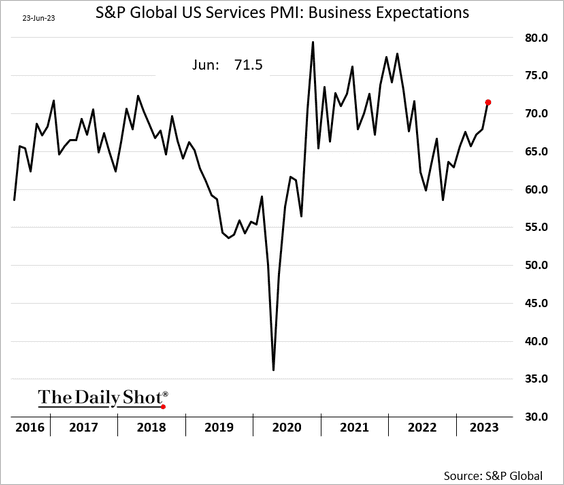
• Service firms continue to report expansion, …
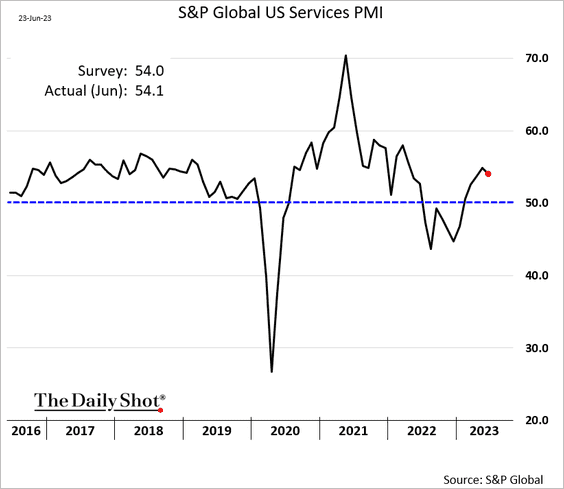
… with business expectations rebounding.
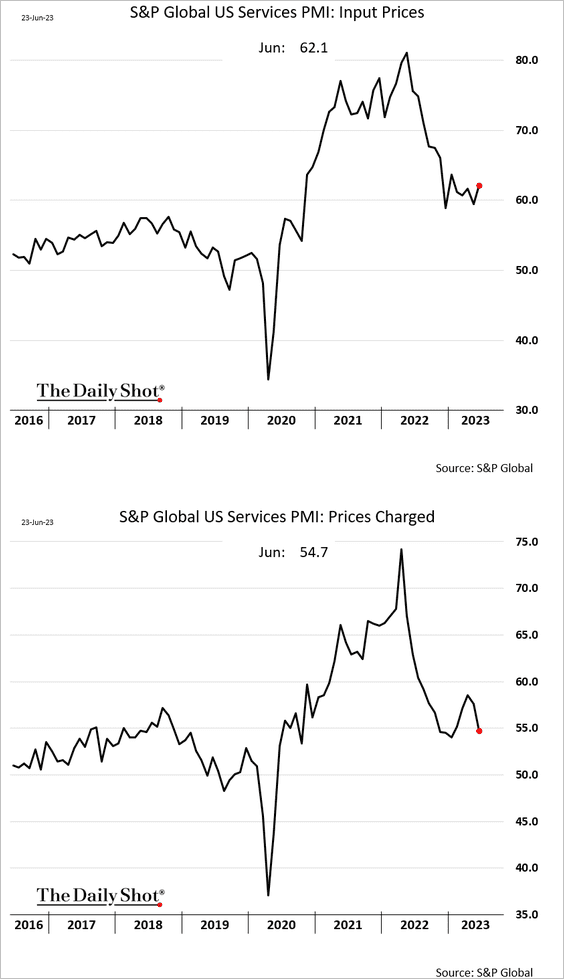
– Service companies still face strong inflationary pressures, but fewer firms boosted prices this month.
——————–
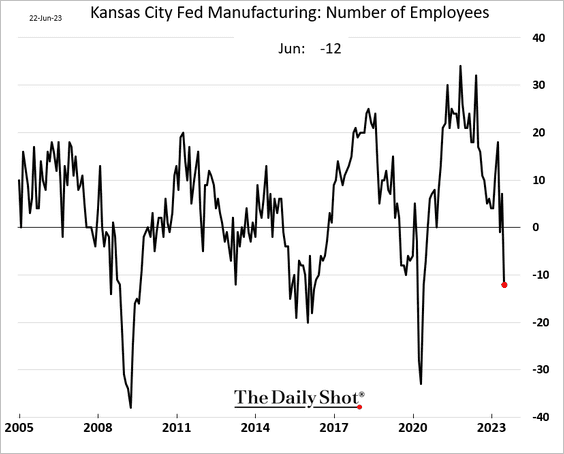
4. The Kansas City Fed’s regional manufacturing report was awful, …
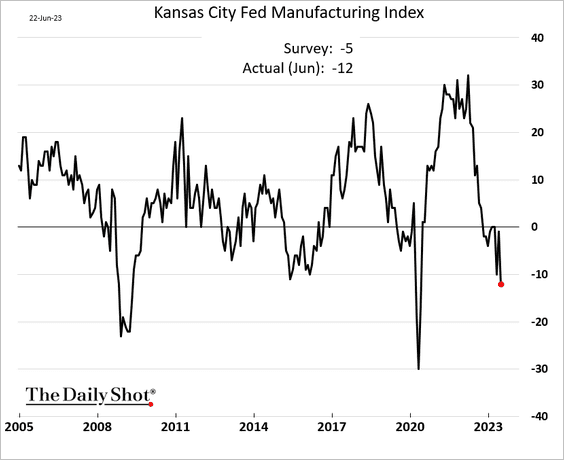
… with factories reducing their workforce.
• Outlook deteriorated.
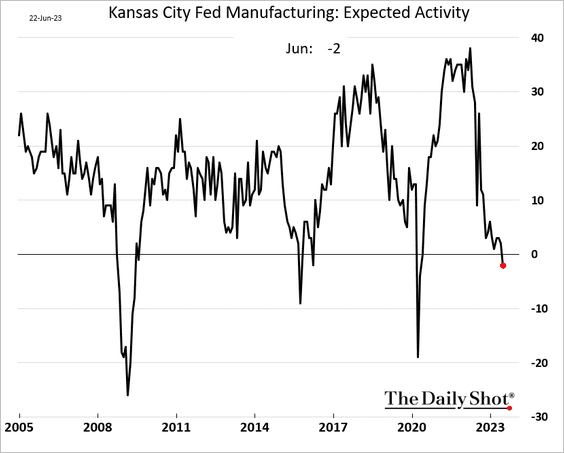
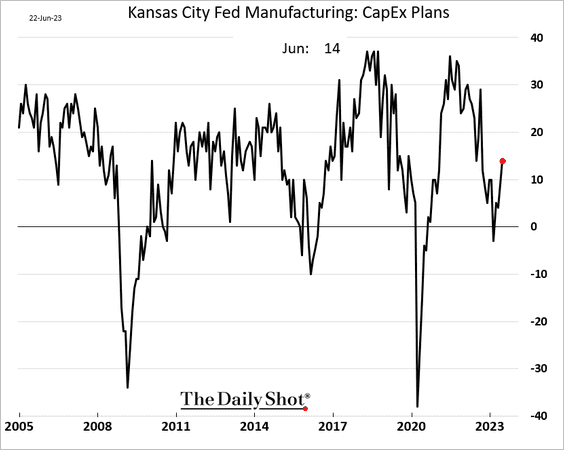
However, CapEx expectations improved.
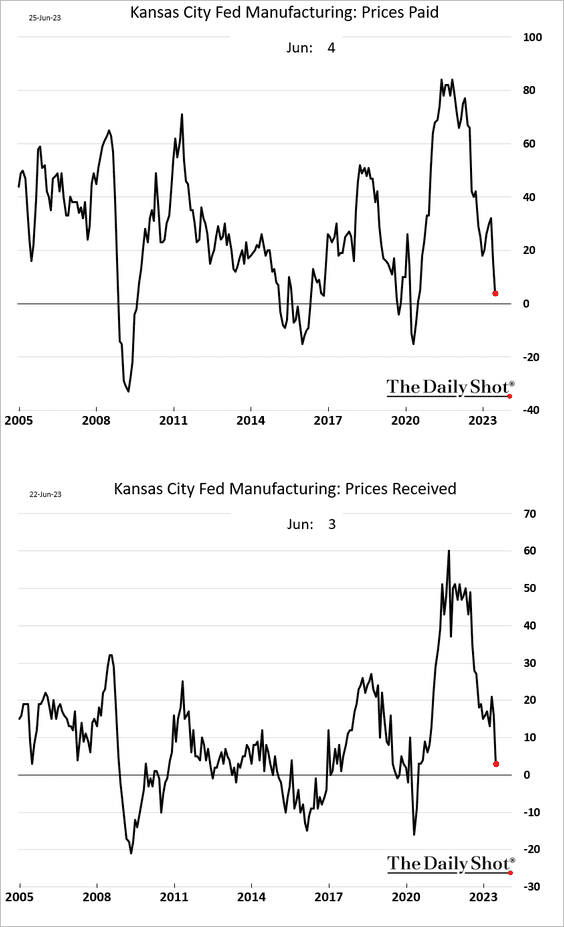
• Price indices tumbled this month.
——————–
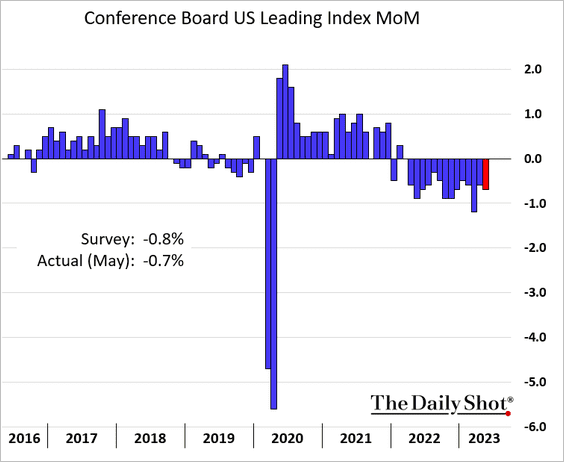
5. The Conference Board’s index of leading indicators declined again in May.
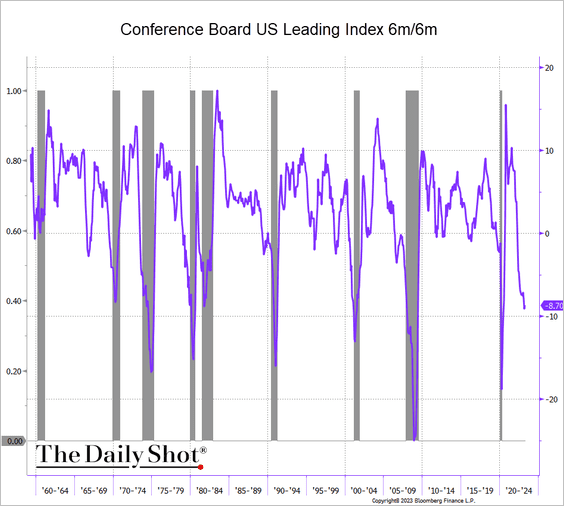
This chart depicts the six-month changes in the leading index.
 Source: @TheTerminal, Bloomberg Finance L.P.
——————–
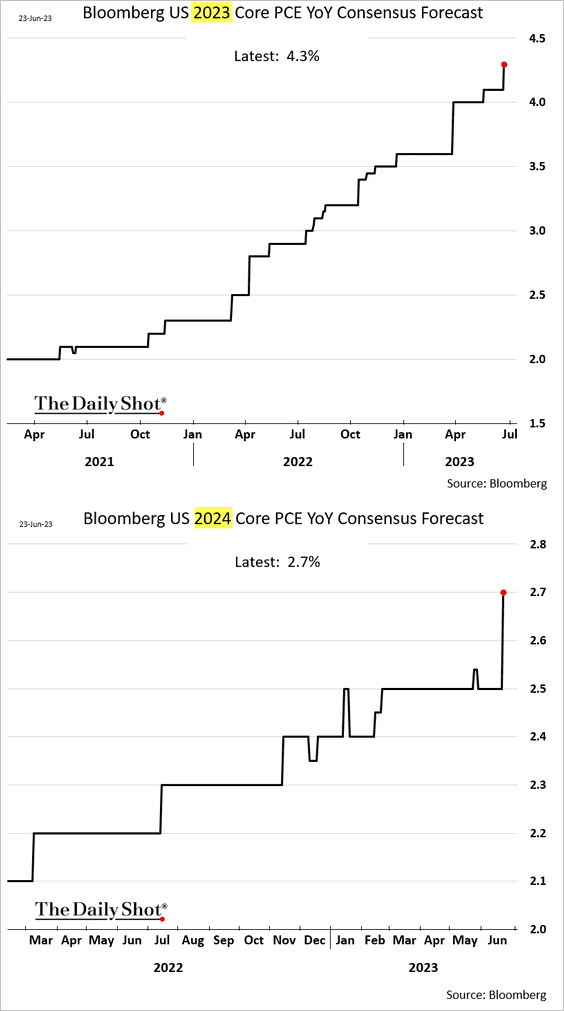
6. Economists continue to boost their forecasts for US core inflation.
Back to Index
The United Kingdom
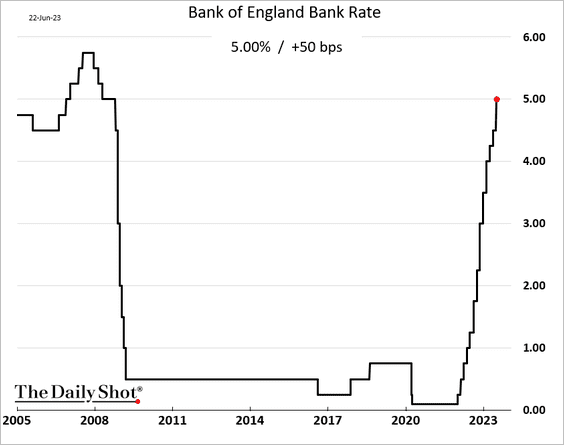
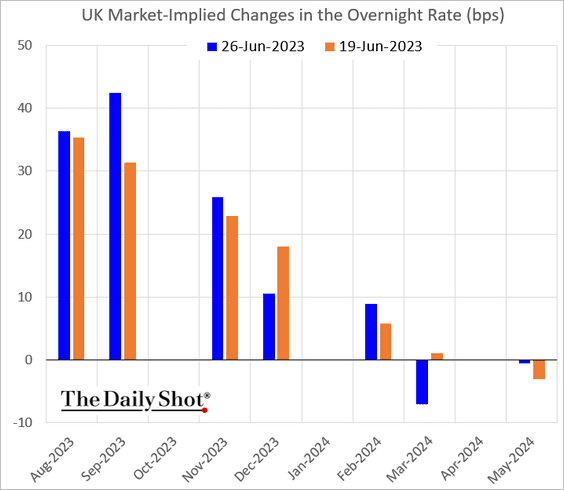
1. The BoE hiked rates by 50 bps last week as core inflation surges.
 Source: Reuters Read full article
• The market sees further rate increases ahead, with another 50 bps hike a possibility in August and/or September.
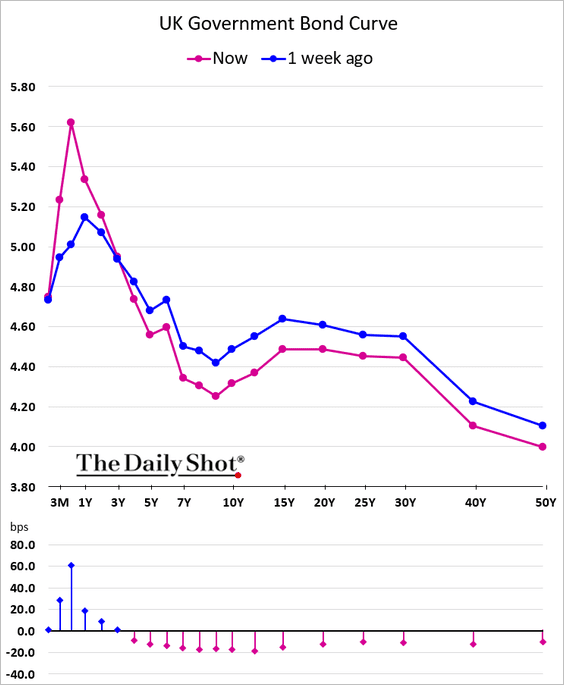
• Short-term gilt yields continue to surge …
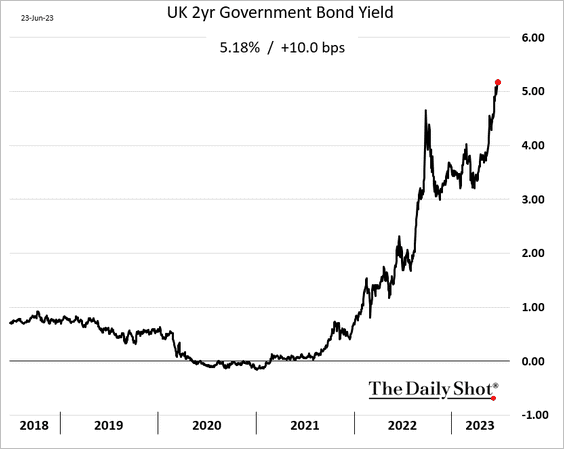
… as the yield curve inverts further.
• A policy error?
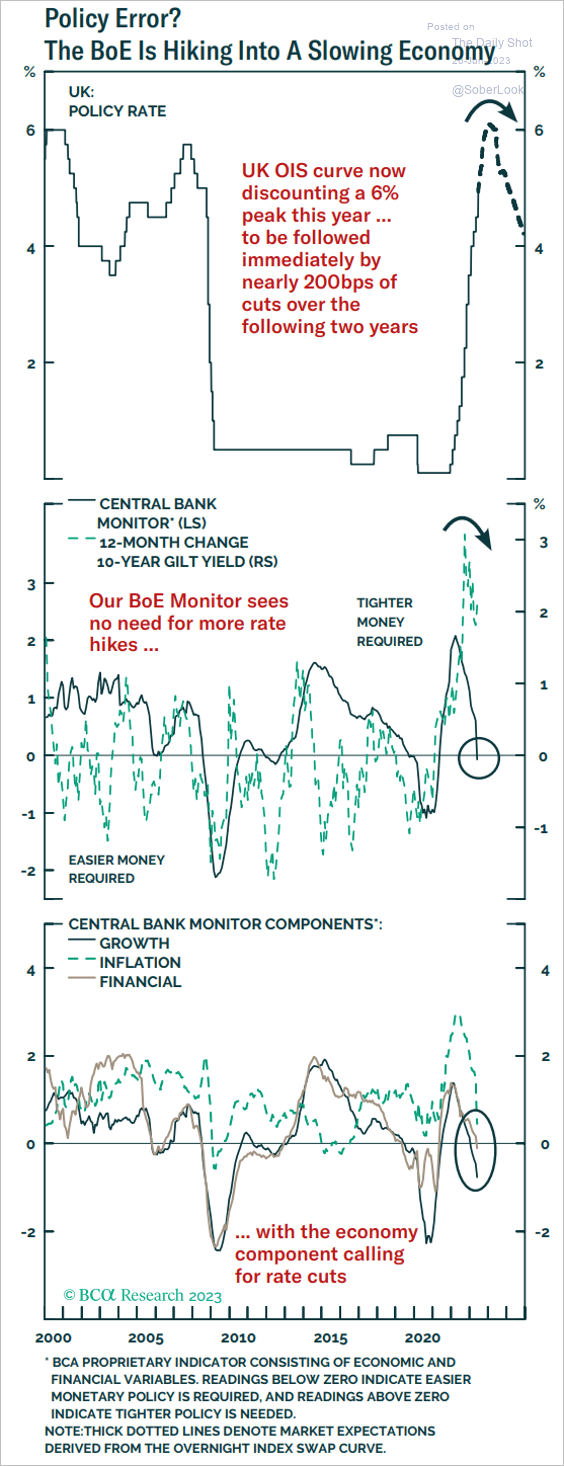 Source: BCA Research
——————–
2. Manufacturing activity sagged this month.
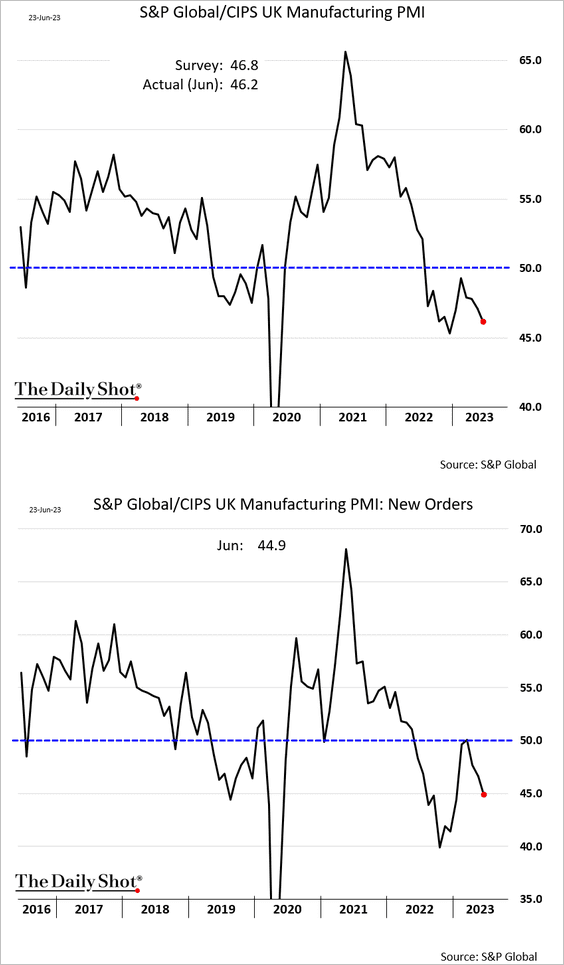
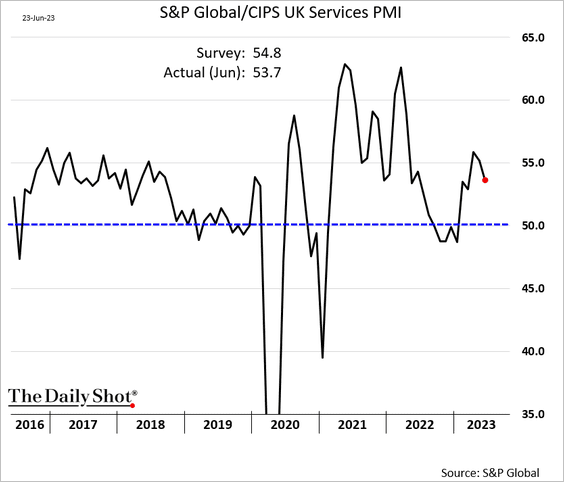
But service-sector growth is holding up (similar to the US).
• Both input and output manufacturing prices are now falling.
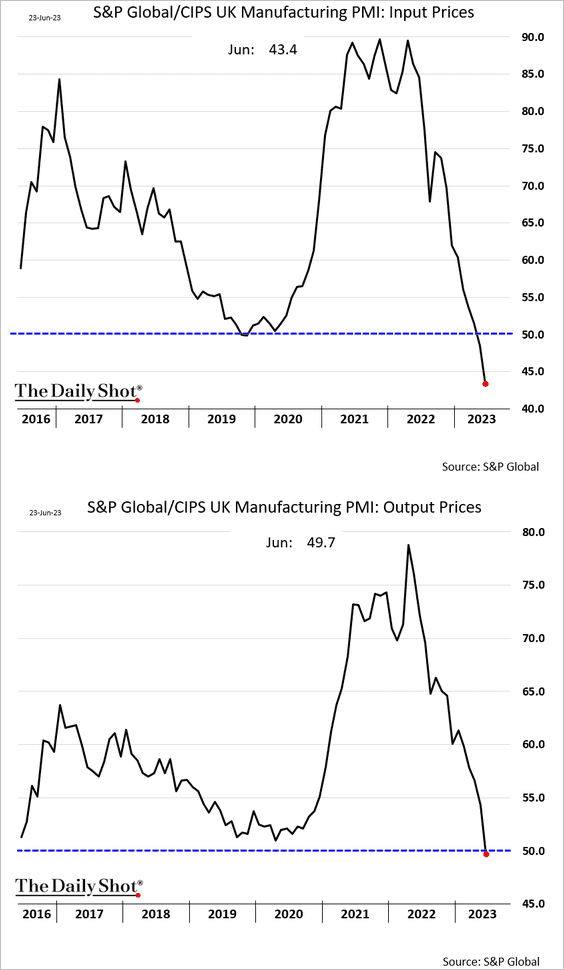
But service-sector price indices remain elevated.
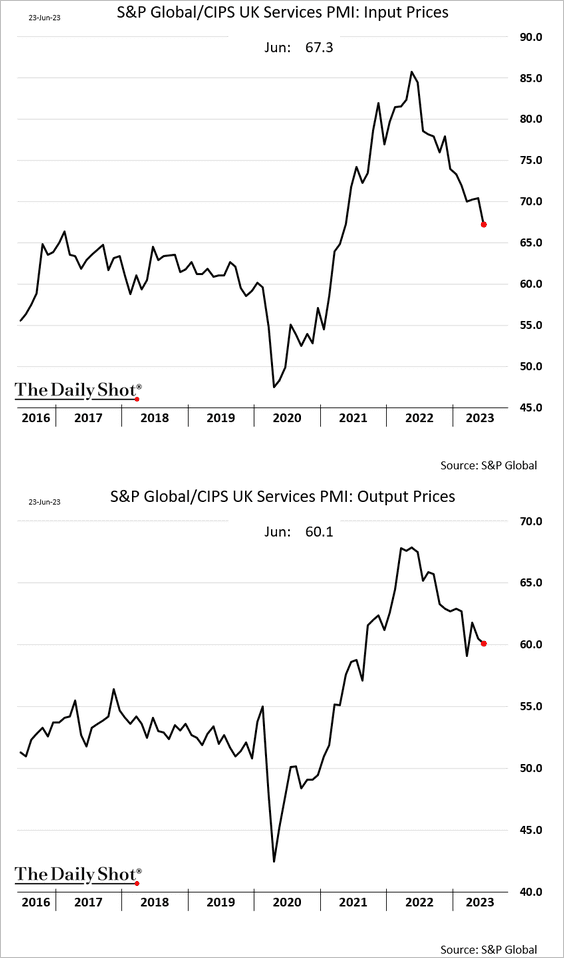
Nonetheless, the “prices charged” index signals slower services CPI.
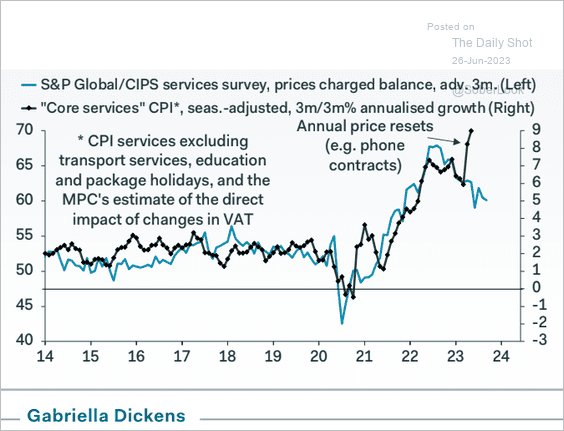 Source: Pantheon Macroeconomics
——————–
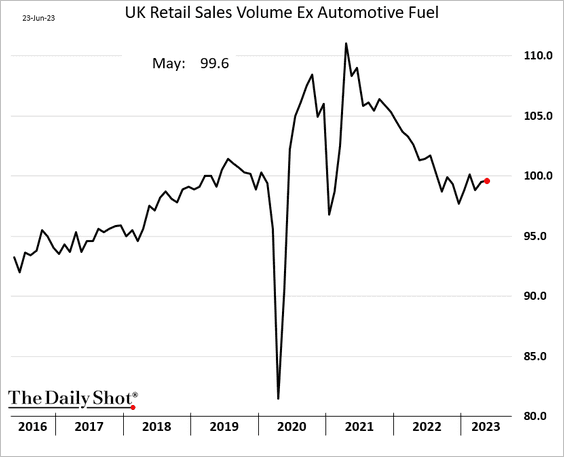
3. Retail sales unexpectedly increased in May.
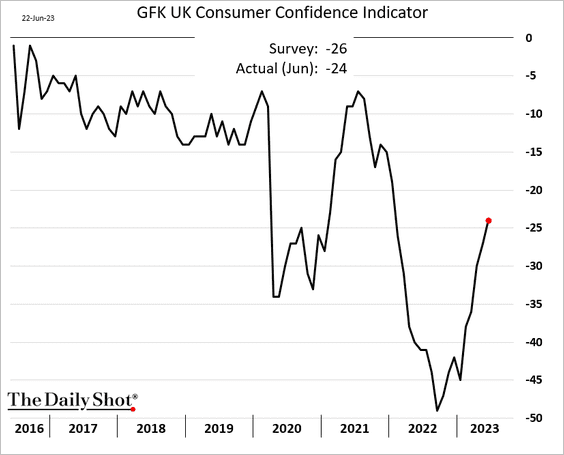
4. Consumer sentiment is improving.
5. On average, GBP/USD weakened around BoE policy meetings during the current hiking cycle.
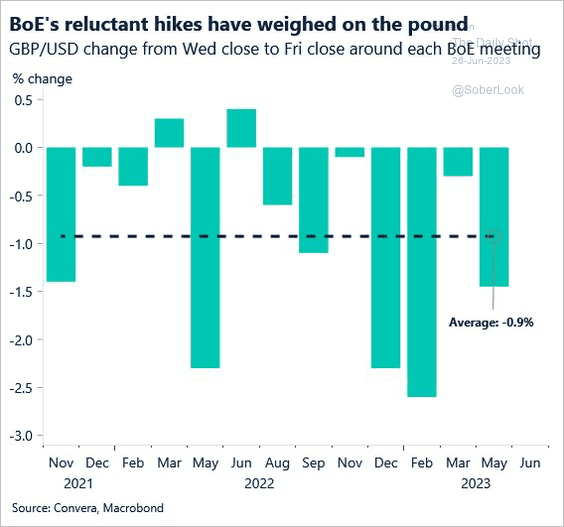 Source: Convera
Back to Index
The Eurozone
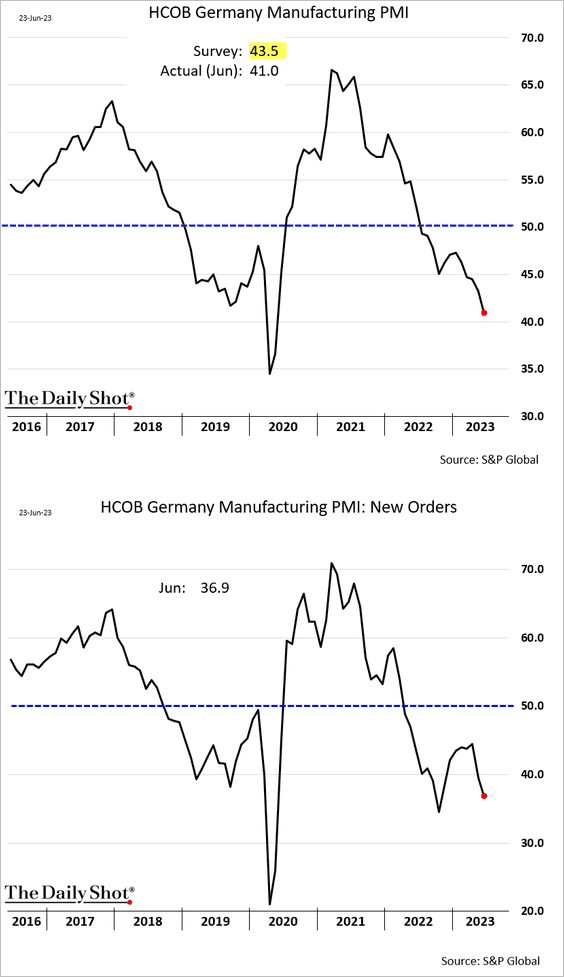
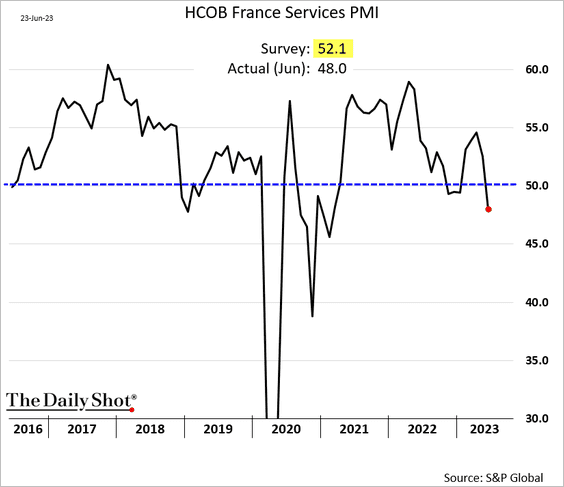
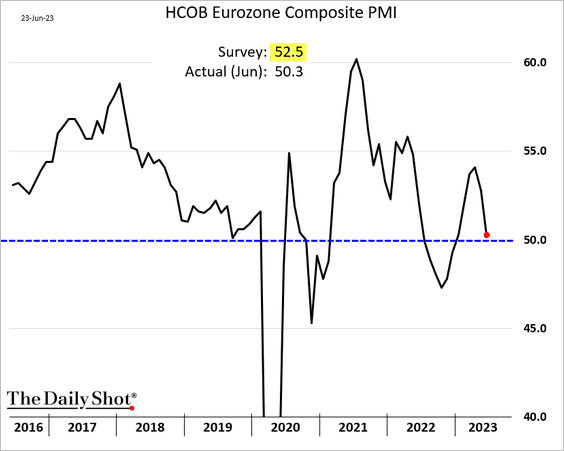
1. The June flash PMI report looks recessionary, with activity indicators surprising to the downside.
• Germany manufacturing PMI:
• France manufacturing PMI:
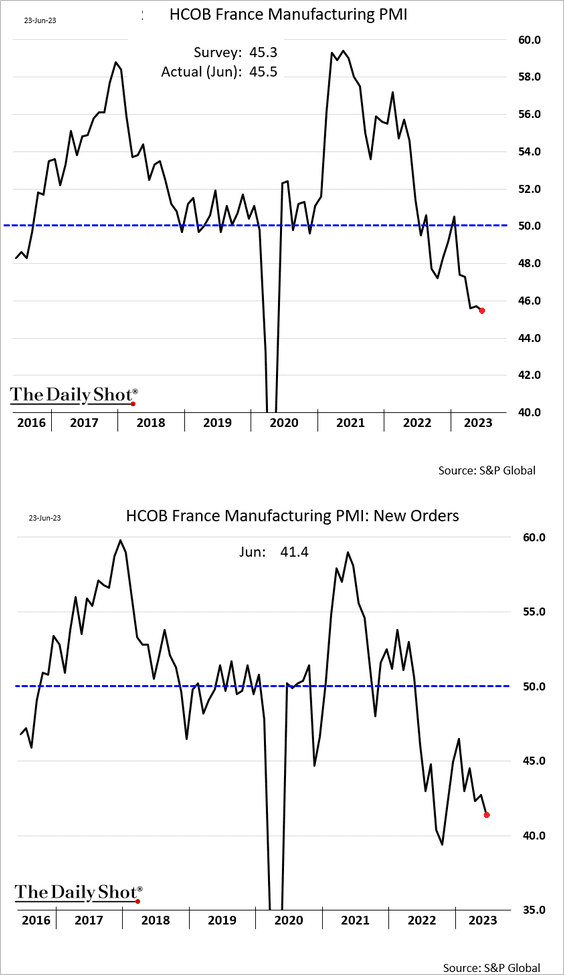
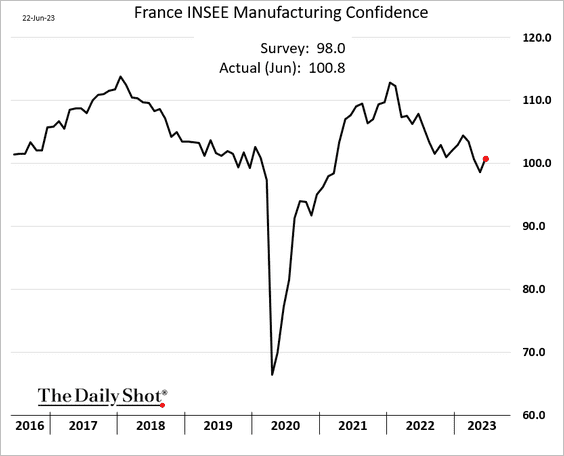
By the way, the INSEE indicator of French manufacturing sentiment improved this month.
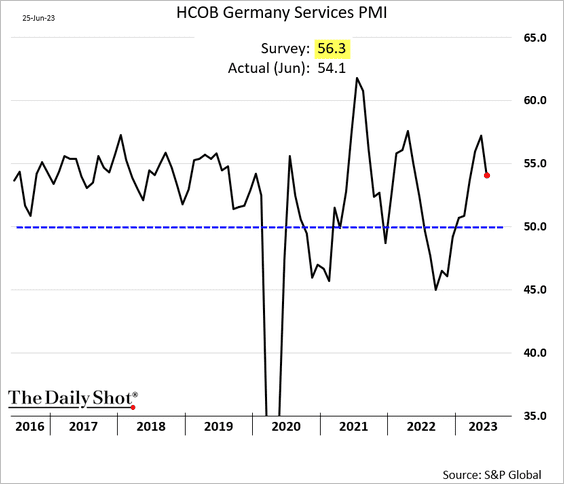
• Germany services PMI (still in growth mode but below forecasts):
• France services PMI (back in contraction territory):
• The composite PMI at the euro-area level (stalling growth).
– The money supply contraction signals further weakness ahead.
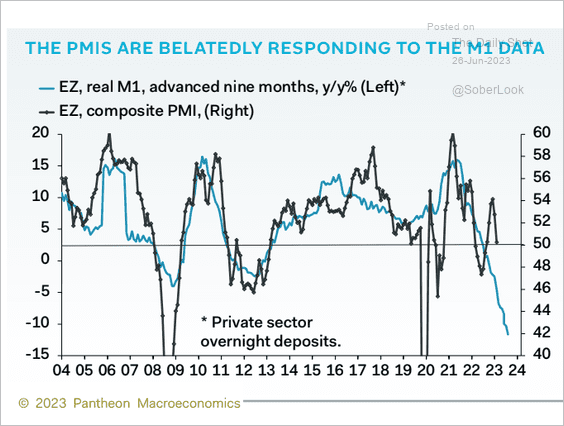 Source: Pantheon Macroeconomics
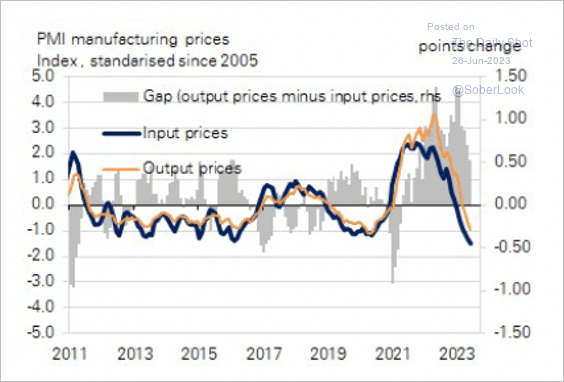
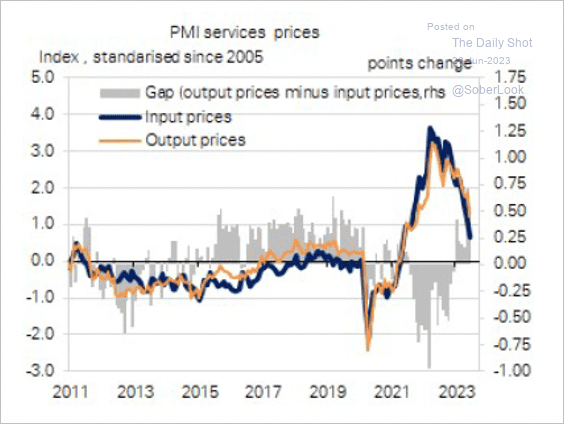
– Price pressures continue to ease.
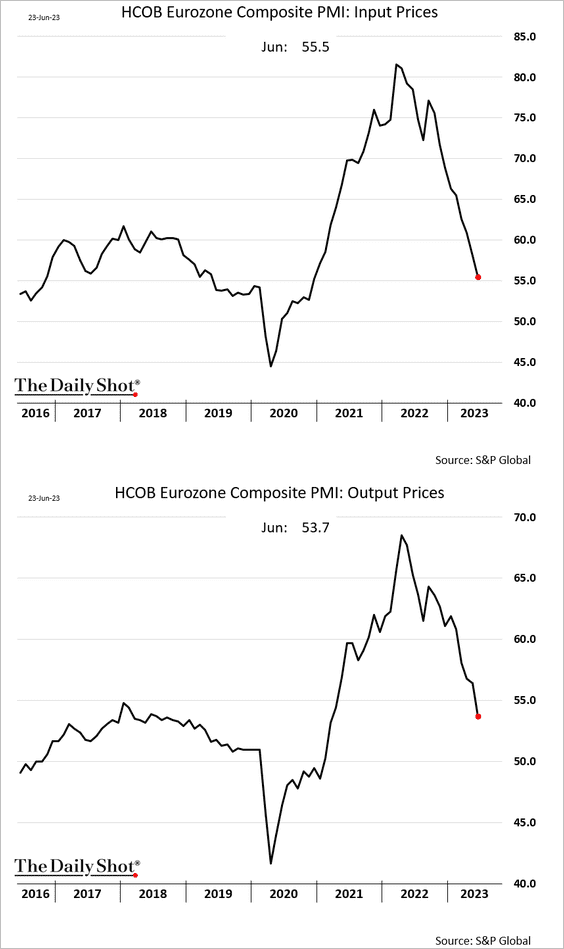
Manufacturers have been slow at passing on falling input costs, while services firms have increased their margins. (2 charts)
 Source: Deutsche Bank Research
 Source: Deutsche Bank Research
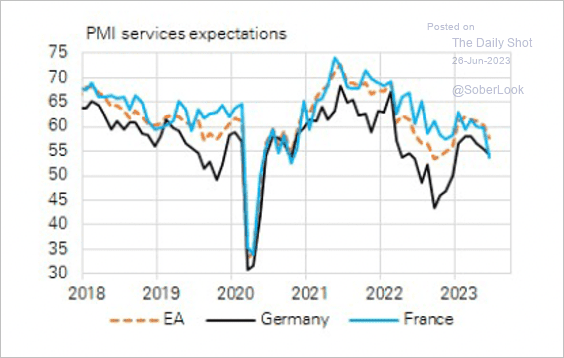
• Expectations among service firms have deteriorated, especially in France.
 Source: Deutsche Bank Research
——————–
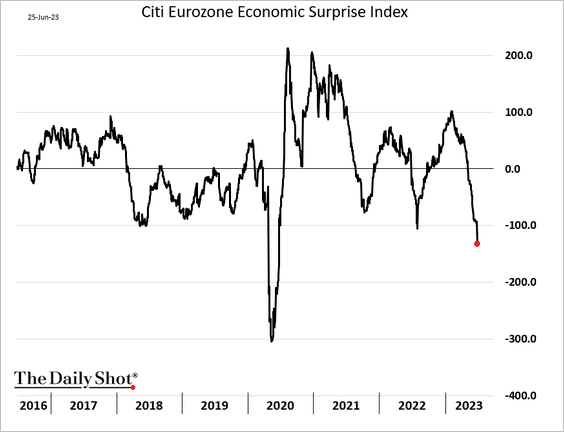
2. The weak PMI report sent the Citi Economic Surprise Index tumbling to the lowest level since the initial COVID shock.
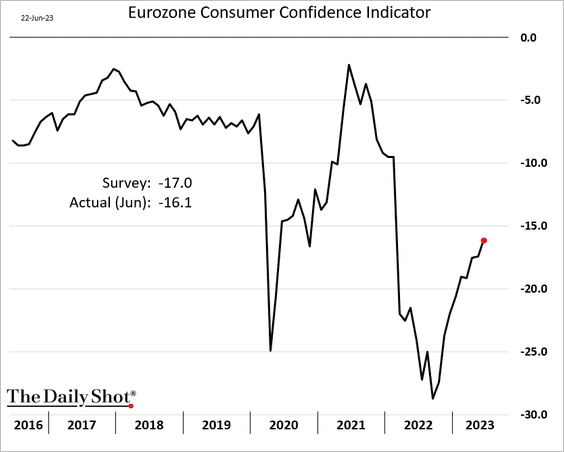
3. Consumer confidence is rebounding.
Back to Index
Europe
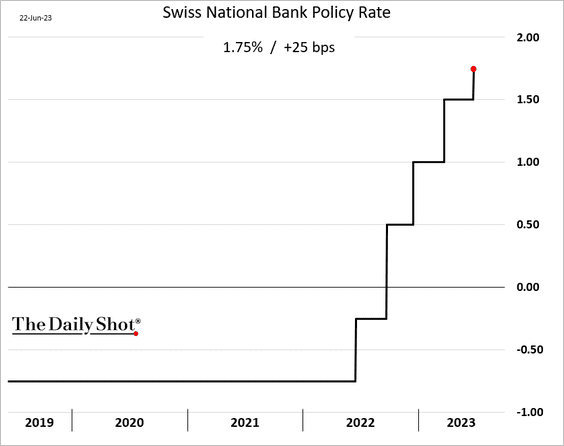
1. In addition to BoE, two other European central banks hiked rates.
• The SNB:
 Source: Reuters Read full article
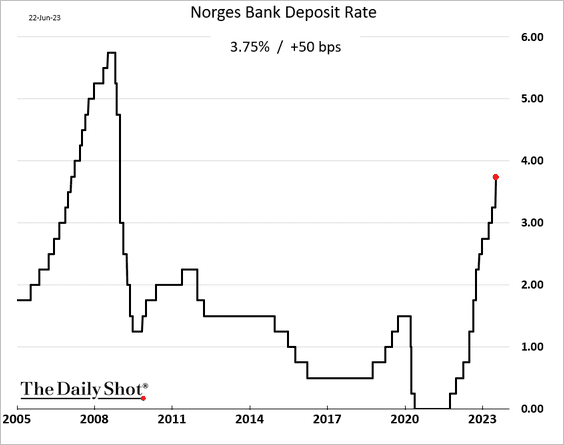
• Norway’s Norges Bank (the market expected 25 bps):
 Source: Reuters Read full article
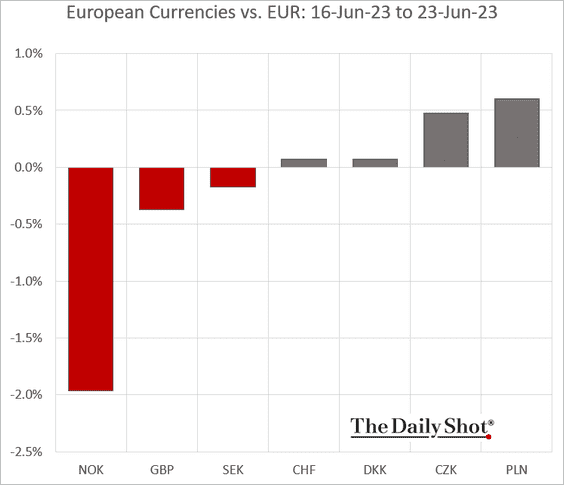
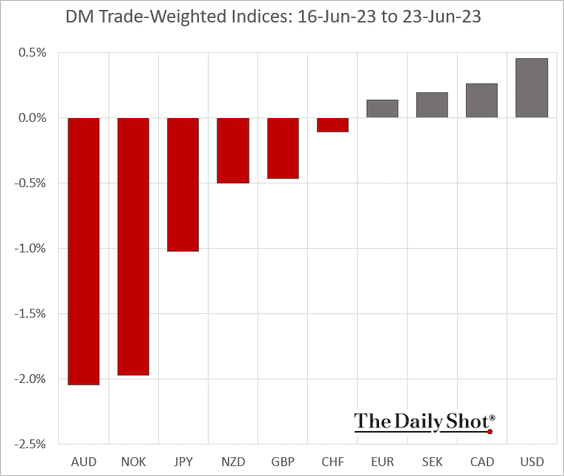
The Norwegian krone underperformed last week.
——————–
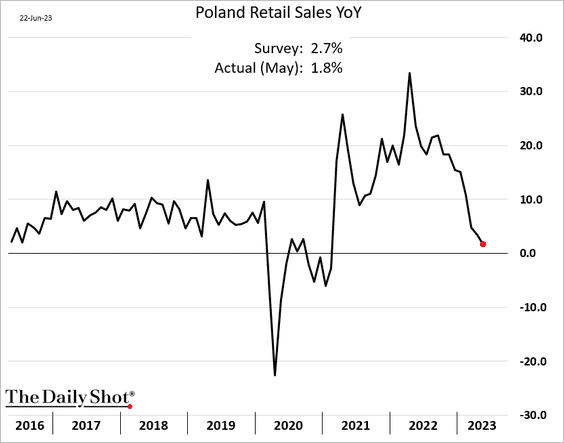
2. Poland’s retail sales have been softening.
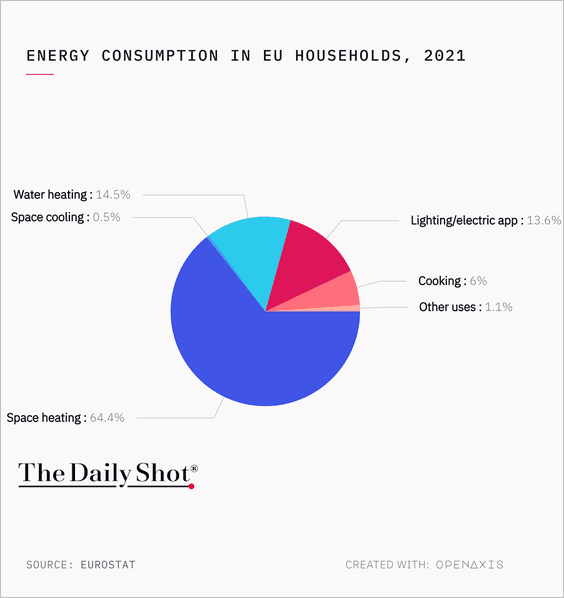
3. This chart shows the distribution of energy consumption by EU households.
 Source: @TheDailyShot
Back to Index
Japan
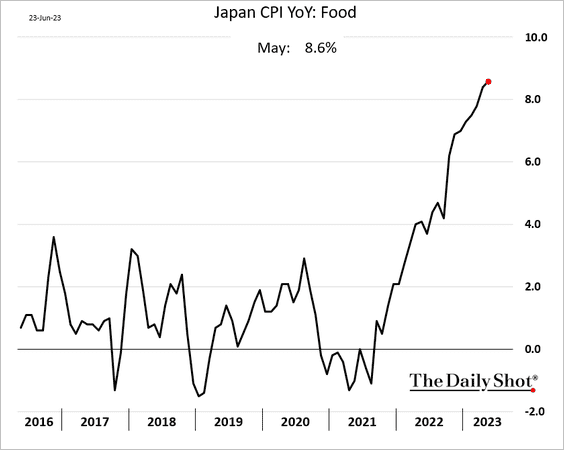
1. Inflation remains elevated, …
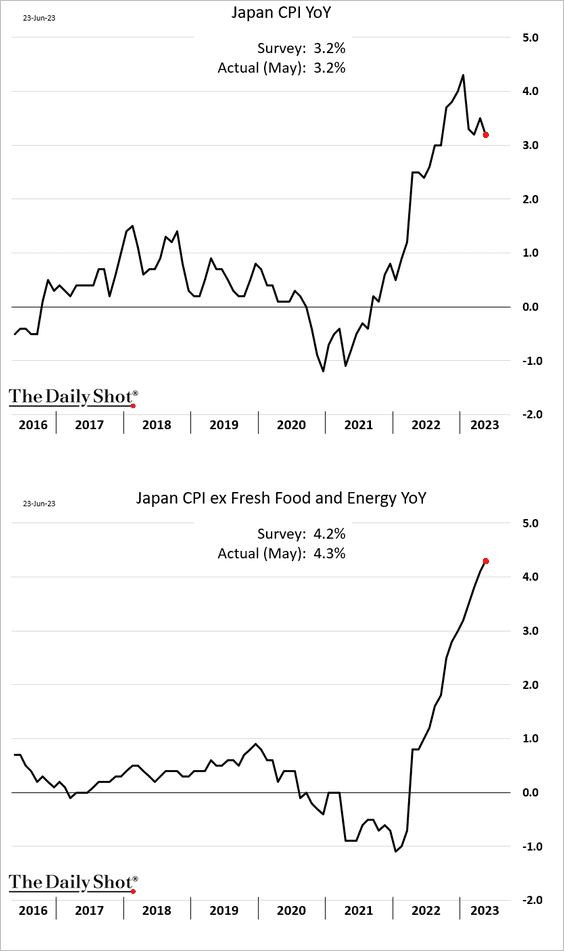
… as food price climb.
——————–
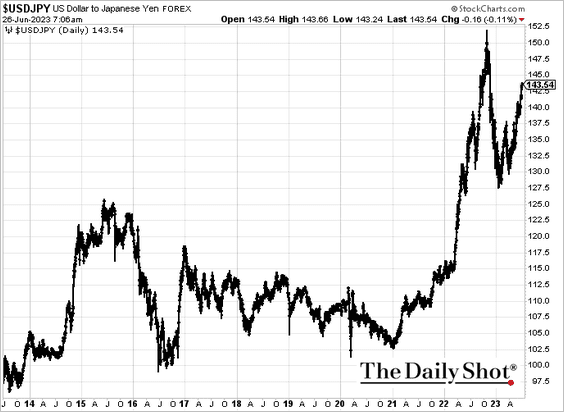
2. The yen has been under pressure.
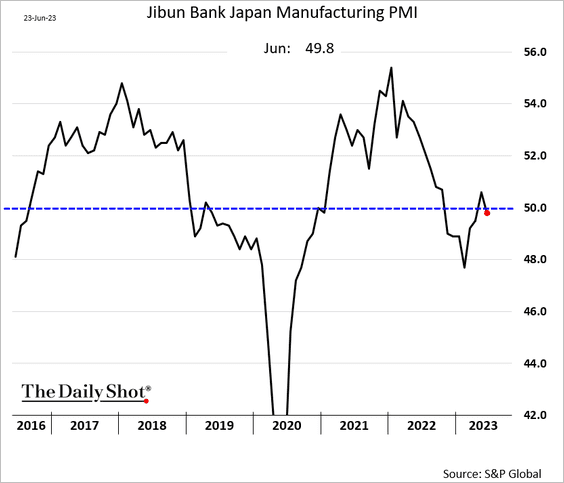
3. Manufacturing activity dipped back into contraction this month…
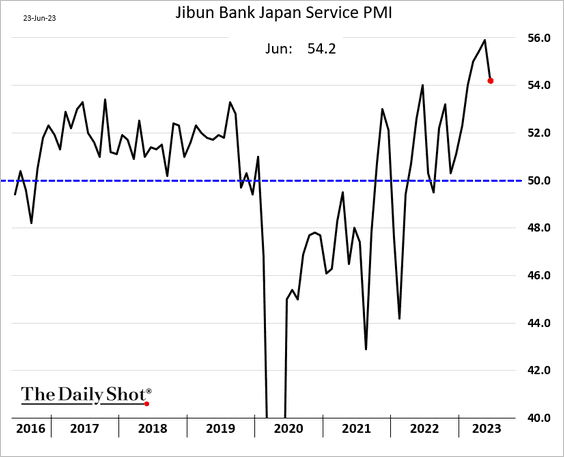
… while service firms continue to report growth.
Back to Index
Asia-Pacific
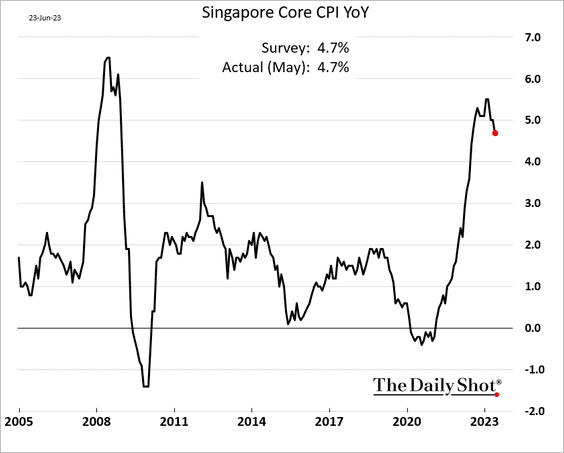
1. Singapore’s inflation is starting to moderate.
2. The S&P Global PMI report shows stalling growth in Australia’s business sector.
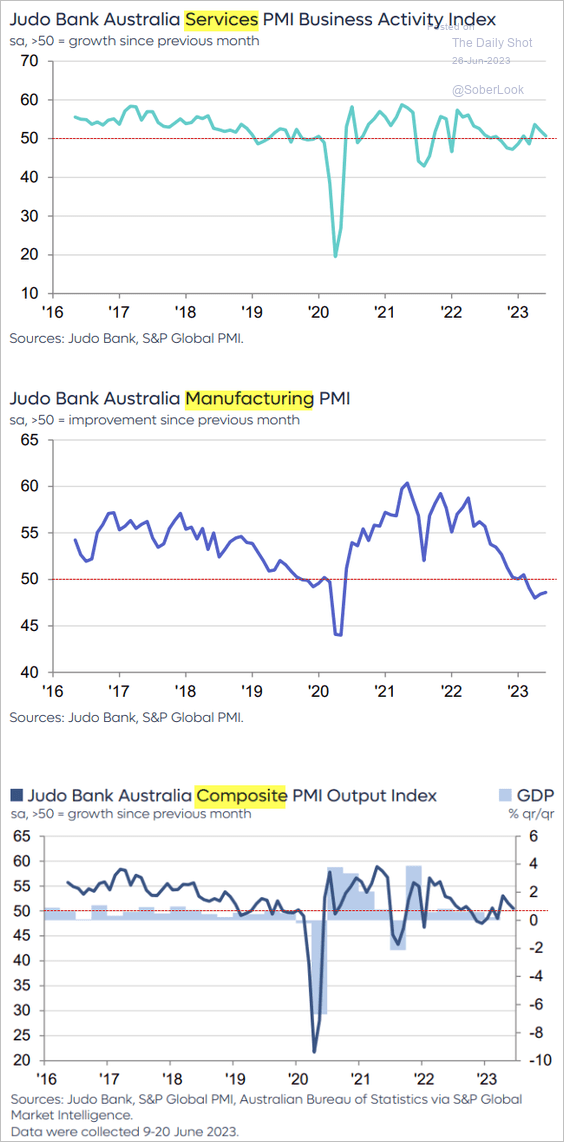 Source: S&P Global PMI
Back to Index
China
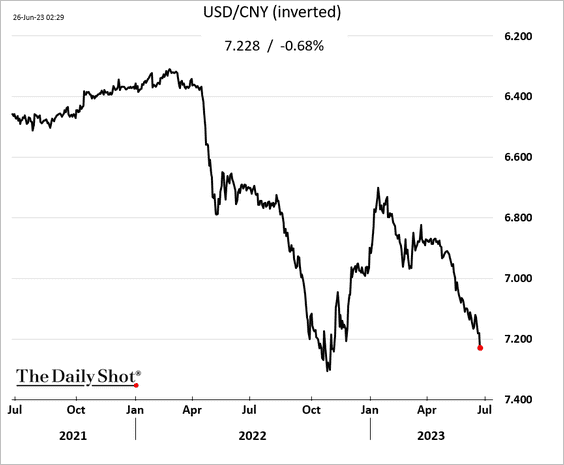
1. China’s currency and stocks are down as the market reopens after the holidays.

——————–
2. Households’ savings growth remains elevated (2 charts).
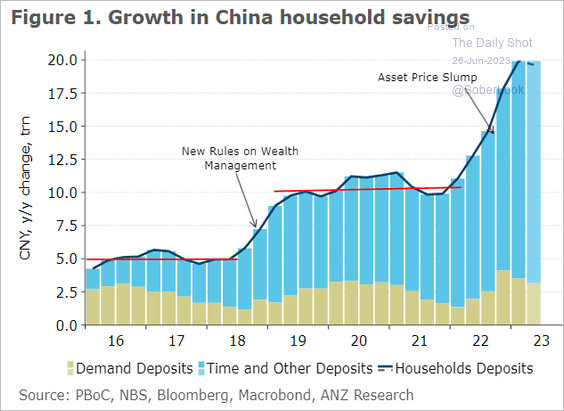 Source: @ANZ_Research
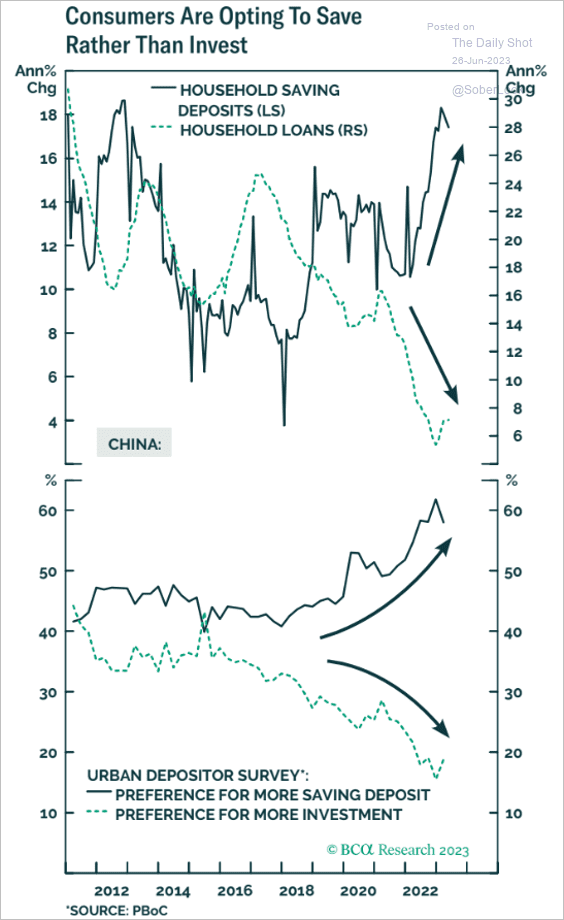 Source: BCA Research
——————–
3. Industrial-related capex growth slowed over the past two months.
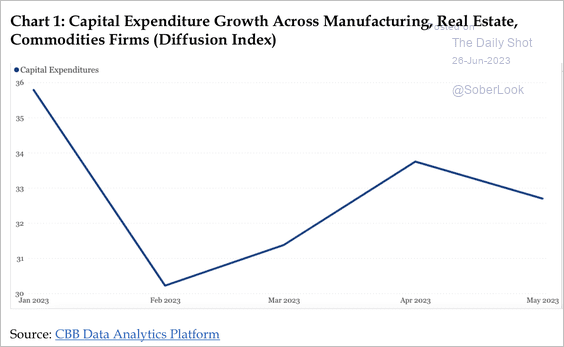 Source: China Beige Book
Back to Index
Emerging Markets
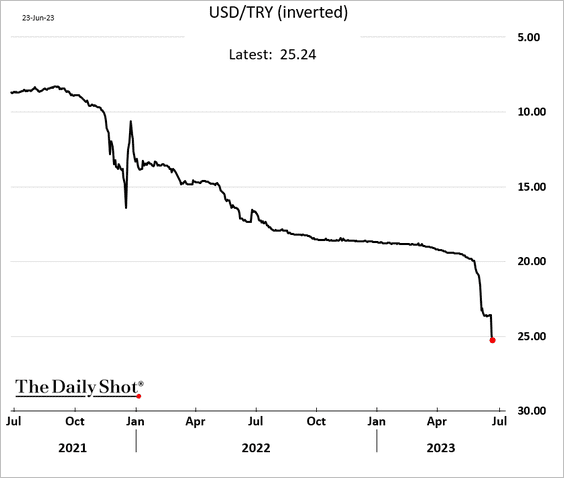
1. Under the new management, the Turkish central bank hiked rates to 15% (a 6.5% increase).
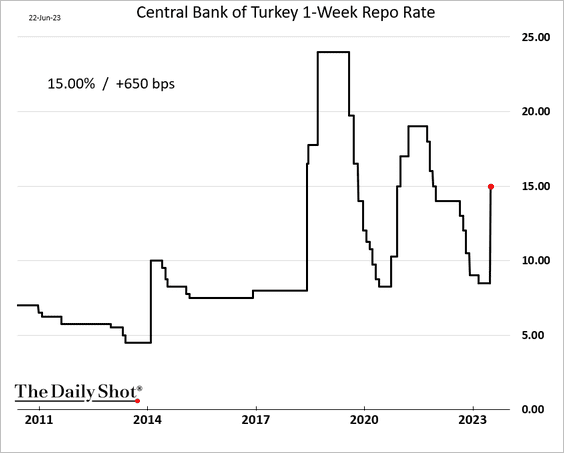
However, the market expected a bolder move from the central bank, with forecasts pointing to 20% (instead of 15%).
The lira plummeted.
 Source: Reuters Read full article
——————–
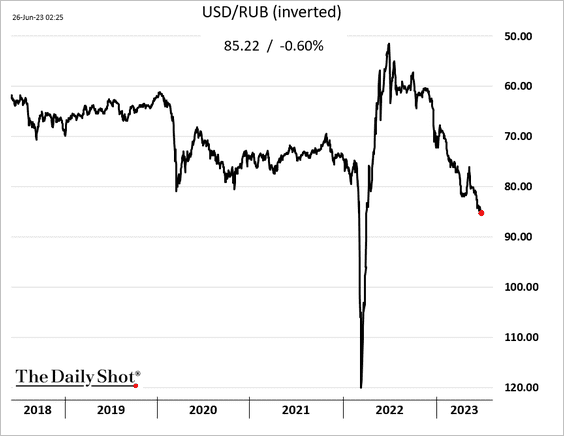
2. The Russian ruble continues to weaken and is now well below pre-war levels.
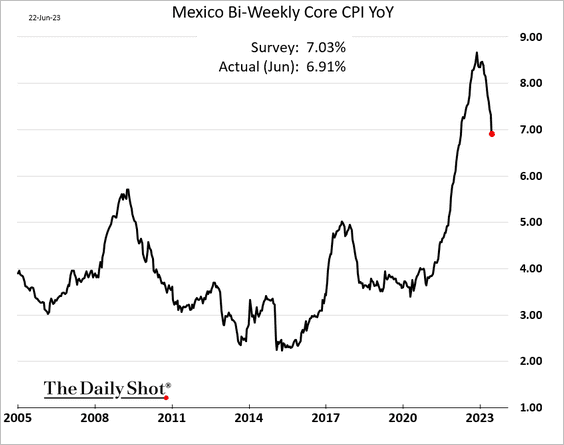
3. Mexico’s inflation continues to moderate.
4. EM central banks are pivoting to rate cuts.
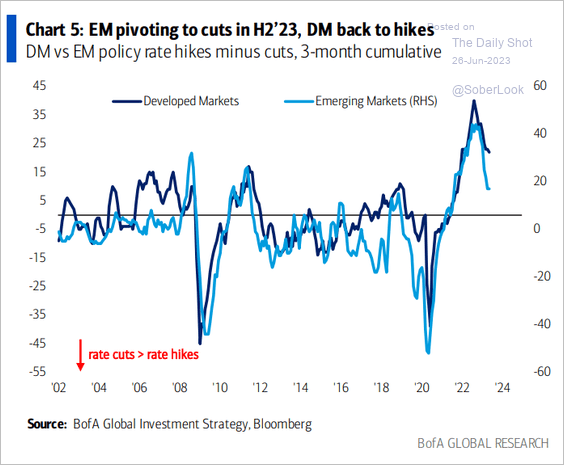 Source: BofA Global Research
5. EM stocks are already discounting an earnings recovery.
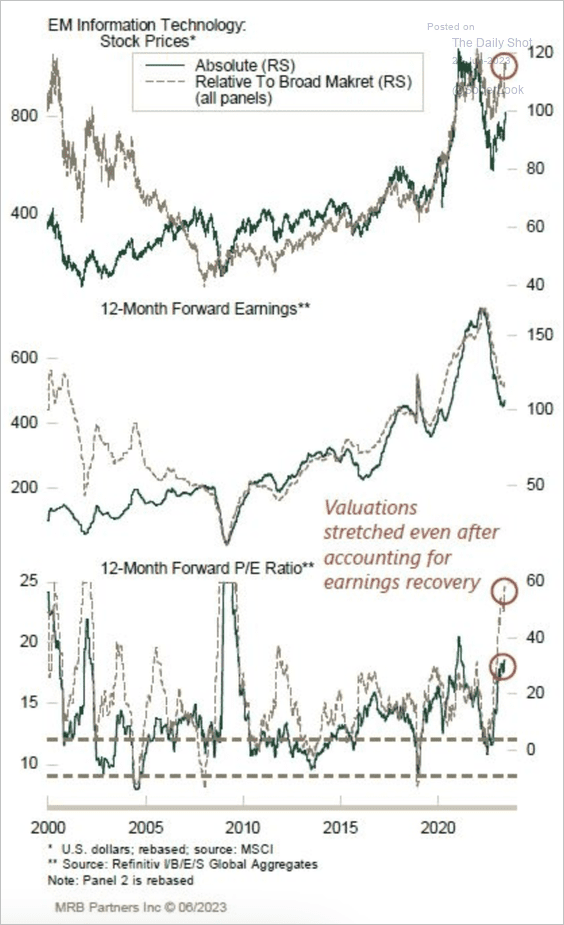 Source: MRB Partners
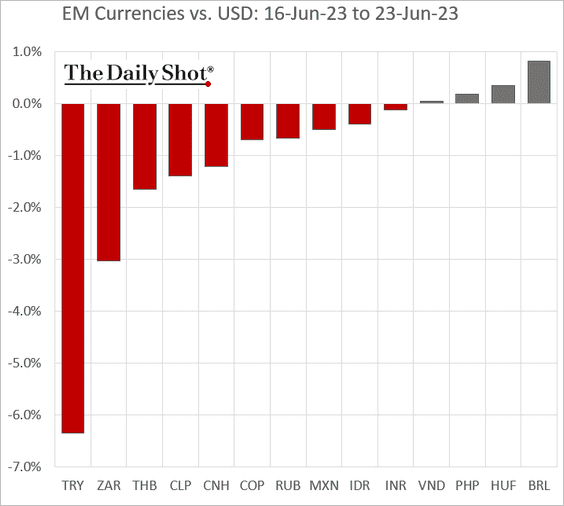
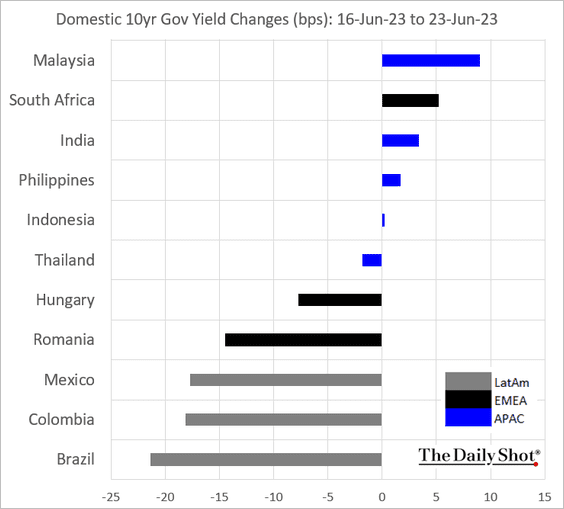
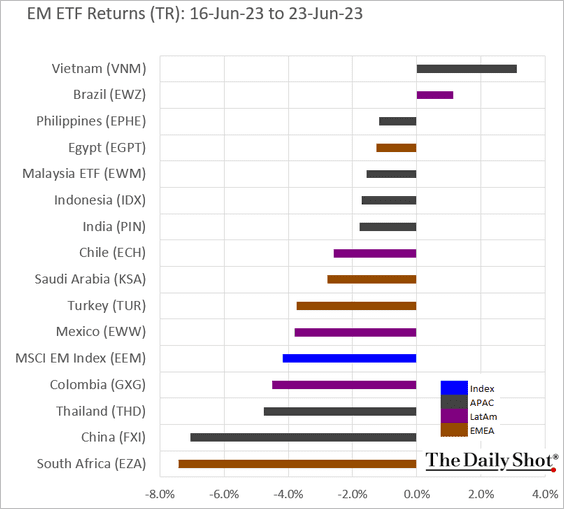
6. Finally, we have some performance data from last week.
• Currencies:
• Bond yields:
• Equity ETFs:
Back to Index
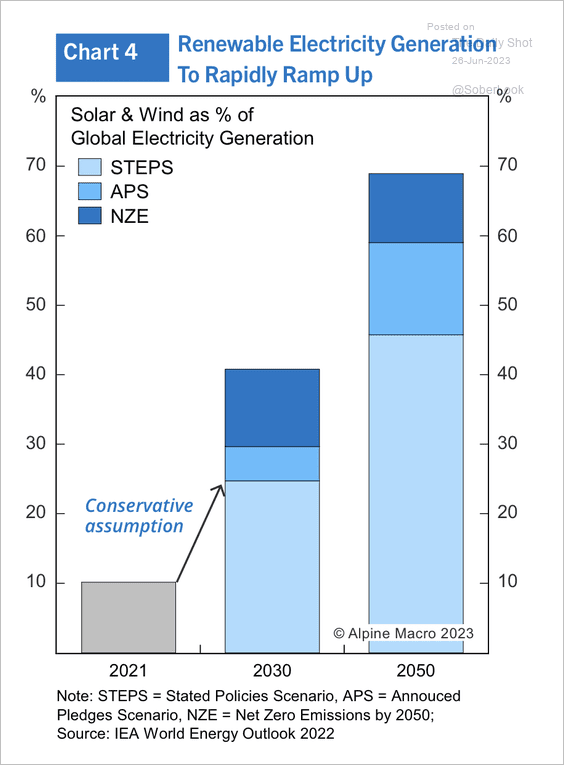
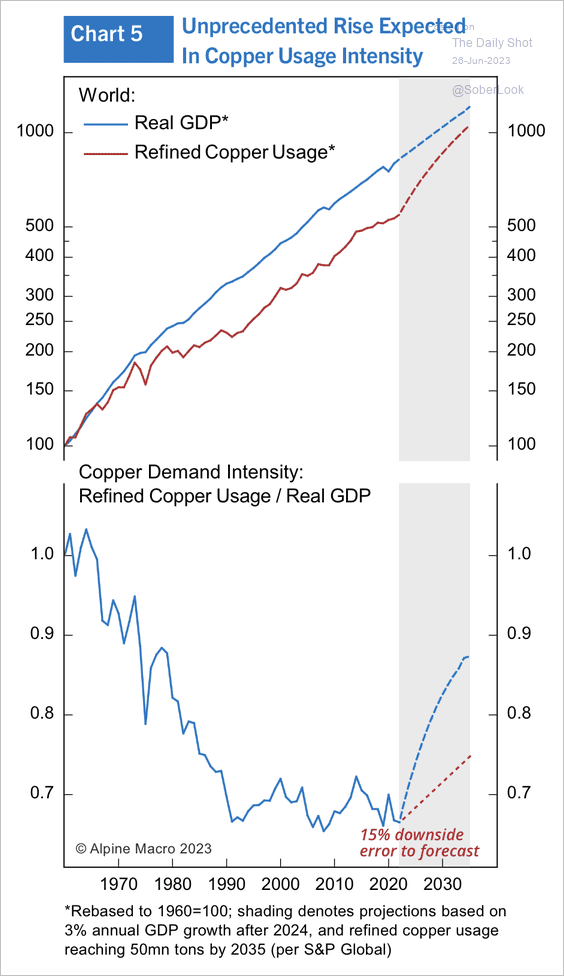
Commodities
1. The rise in renewable electricity generation could substantially boost demand for copper. (2 charts)
 Source: Alpine Macro
 Source: Alpine Macro
• Copper inventories are already very low.
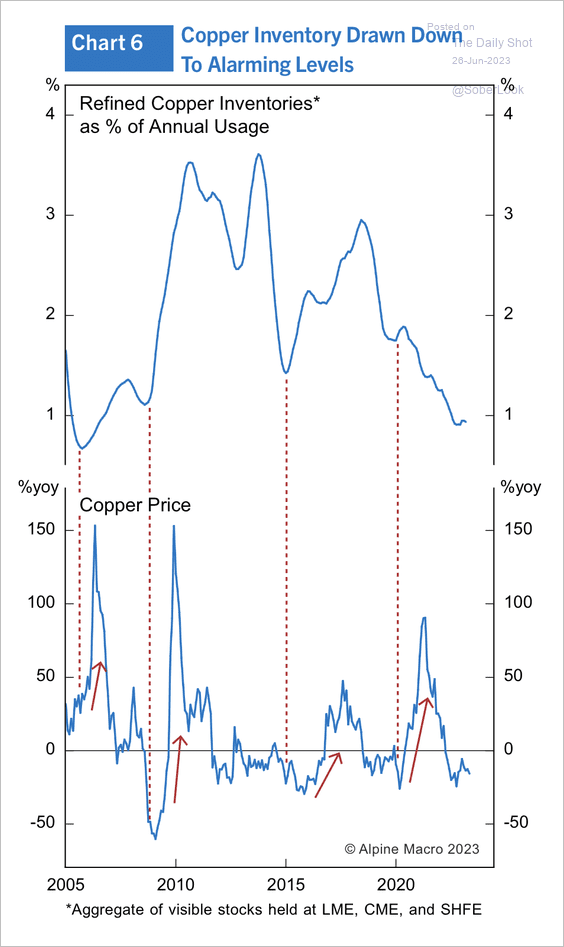 Source: Alpine Macro
• The front-month copper futures contract is holding support above its 40-week moving average, reacting to oversold conditions last month.
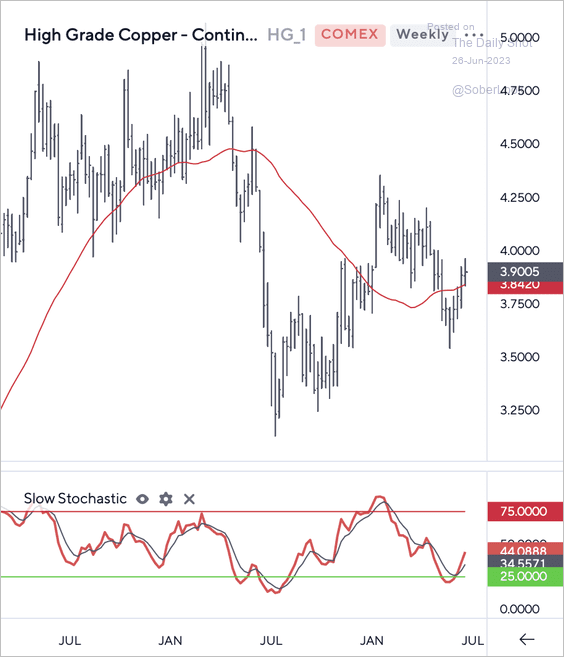 Source: Symbolik
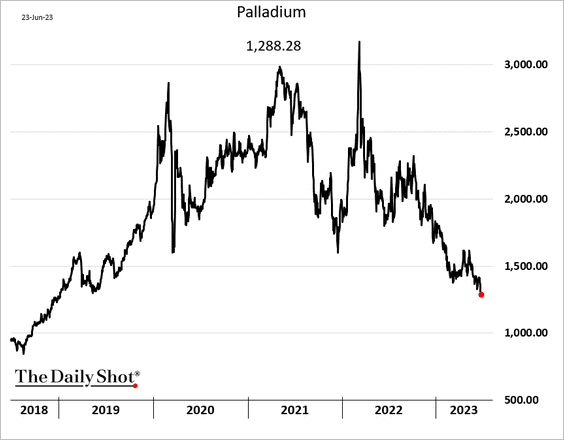
2. Palladium prices hit the lowest level since 2019.
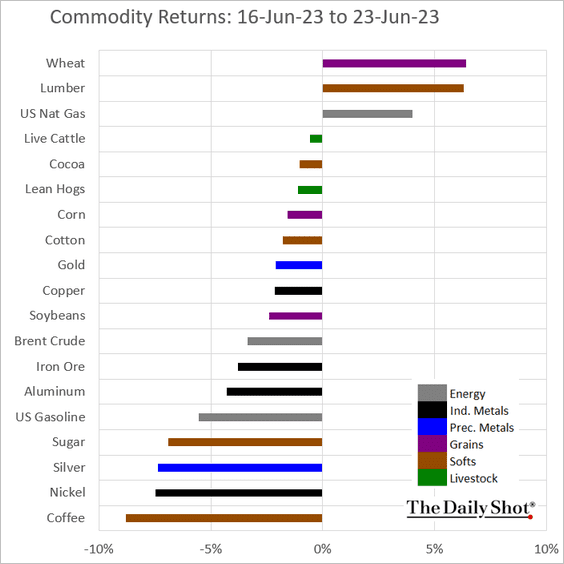
3. Here is last week’s performance across key commodity markets.
——————–
Energy
1. Brent crude remains in a trading range.
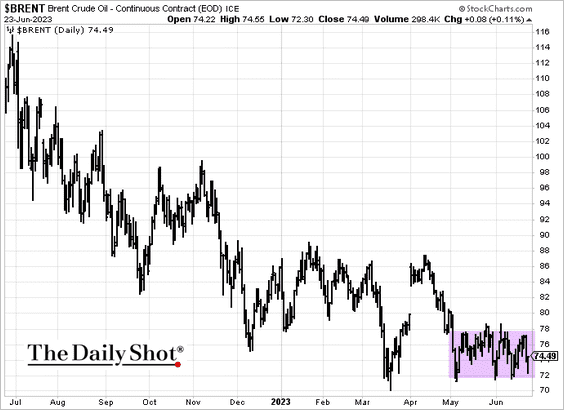
Stabilizing supplies point to firmer prices ahead.
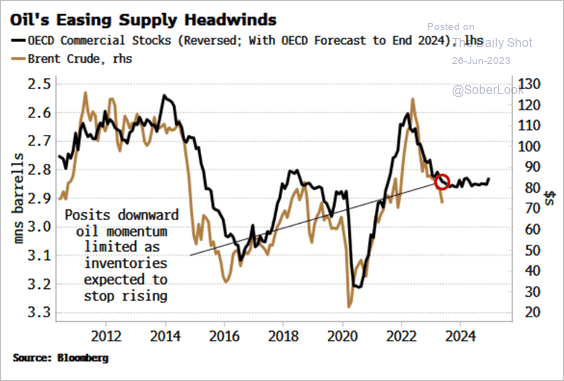 Source: Simon White, Bloomberg Markets Live Blog
——————–
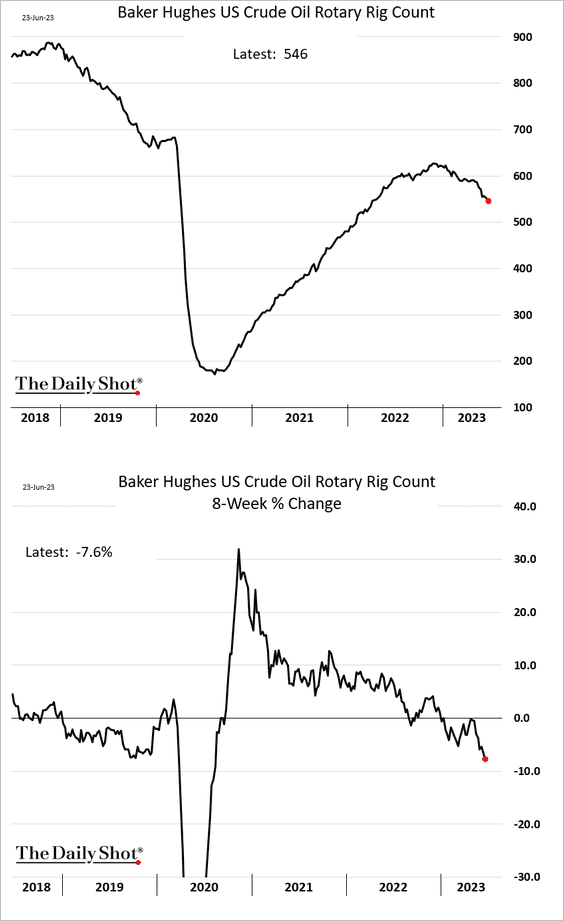
2. US oil rig count continues to fall.
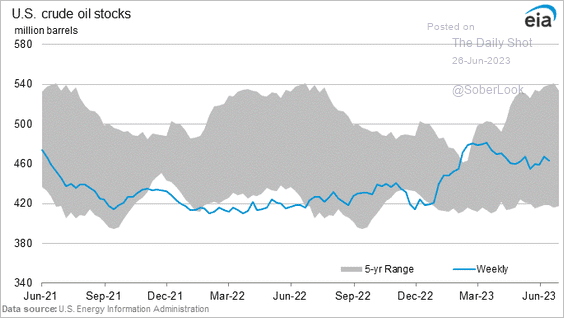
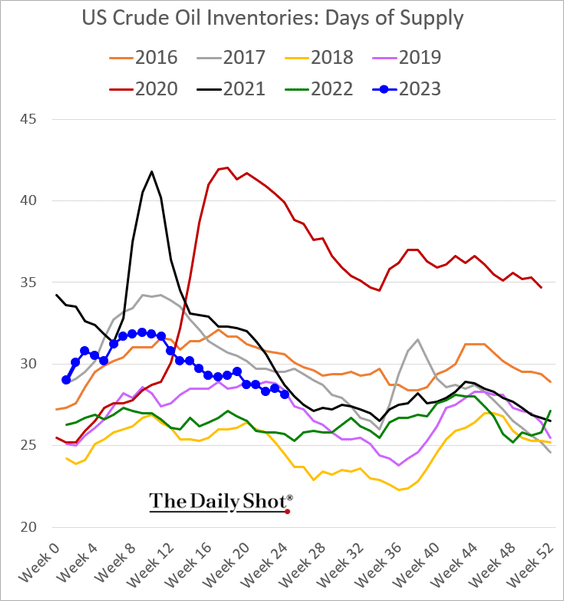
3. Next, let’s take a look at US petroleum inventories.
– Crude oil (barrels):
Days of supply:
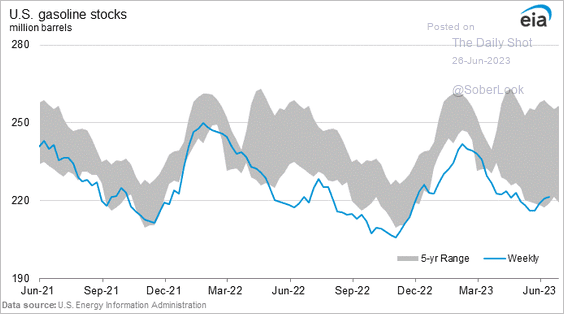
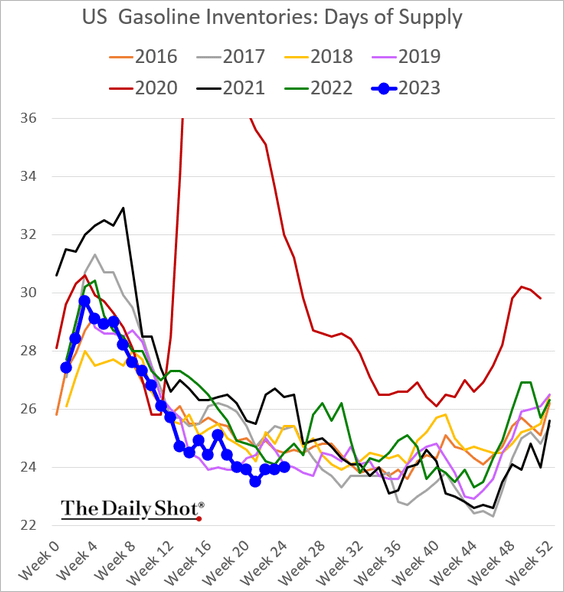
– Gasoline inventories:
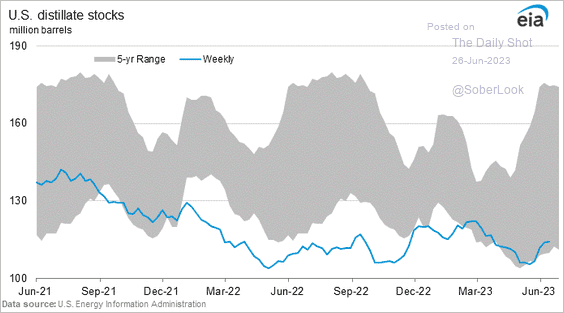
– Distillates inventories:
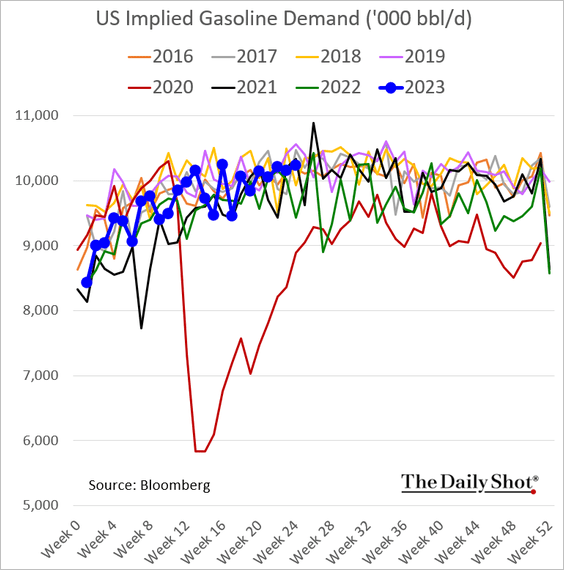
4. Gasoline demand is holding above last year’s levels.
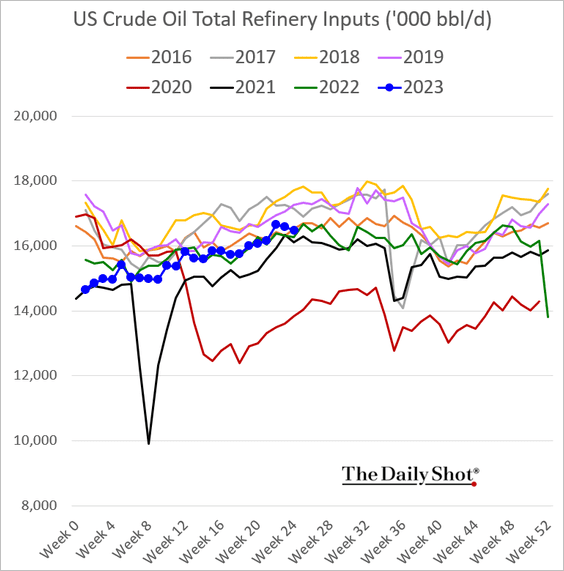
This chart shows US refinery runs.
——————–
5. Oil usually performs well in recessions.
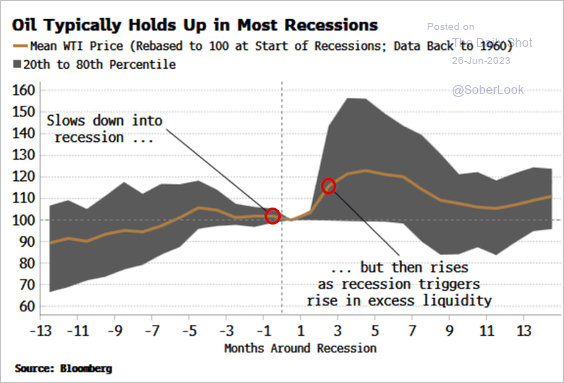 Source: Simon White, Bloomberg Markets Live Blog
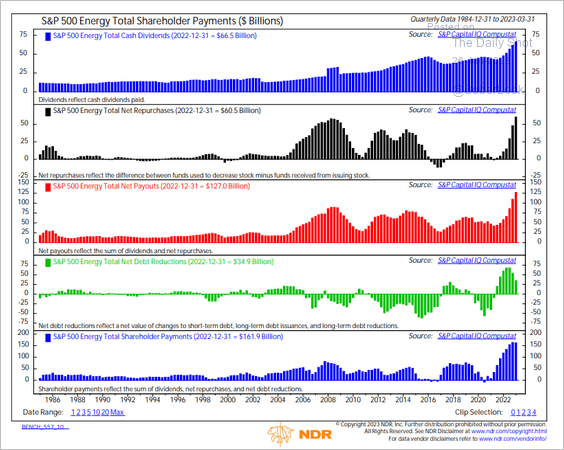
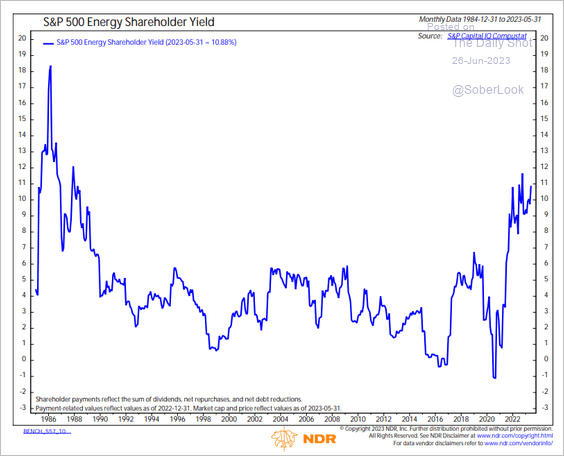
6. The S&P 500 energy sector has been more friendly to shareholders this cycle. (2 charts)
 Source: @_rob_anderson
 Source: @_rob_anderson
Back to Index
Equities
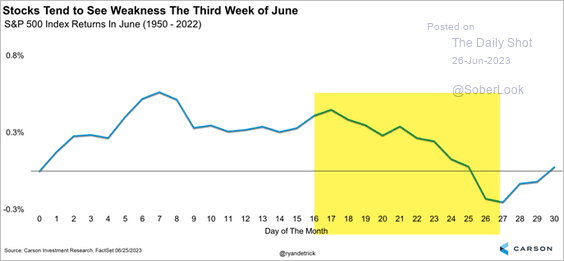
1. Last week’s market pullback was consistent with historical patterns.
 Source: @RyanDetrick
• Equities tend to see a pullback one month after an extreme high in the stock/bond ratio (current situation), …
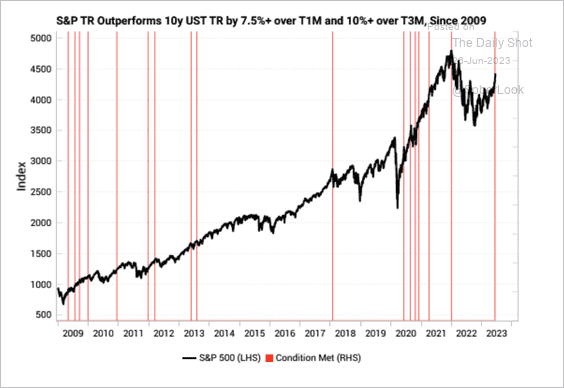 Source: Variant Perception
… although performance improves three months onward.
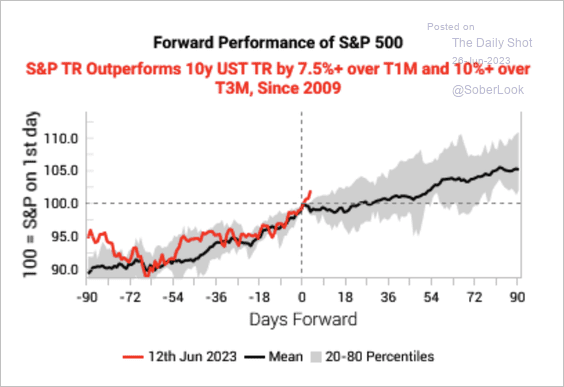 Source: Variant Perception
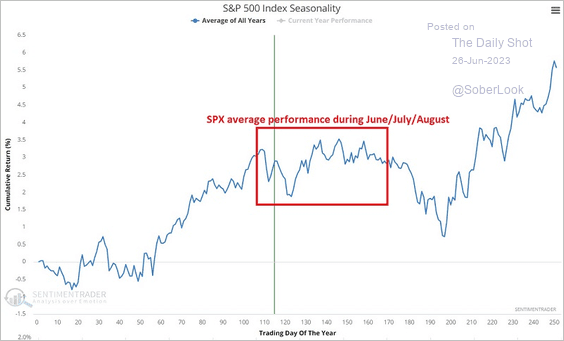
• The S&P 500 typically trades sideways during the summer.
 Source: SentimenTrader
——————–
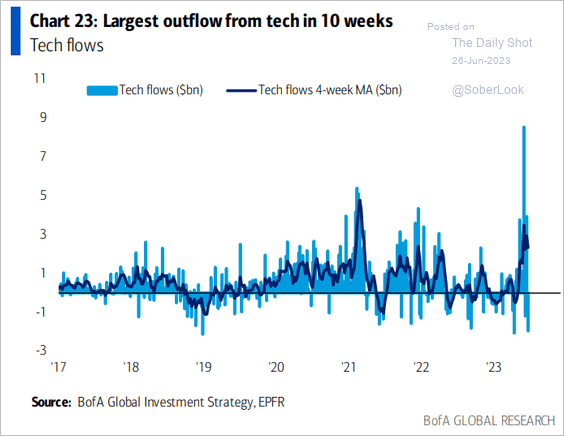
2. Tech funds saw some outflows …
 Source: BofA Global Research
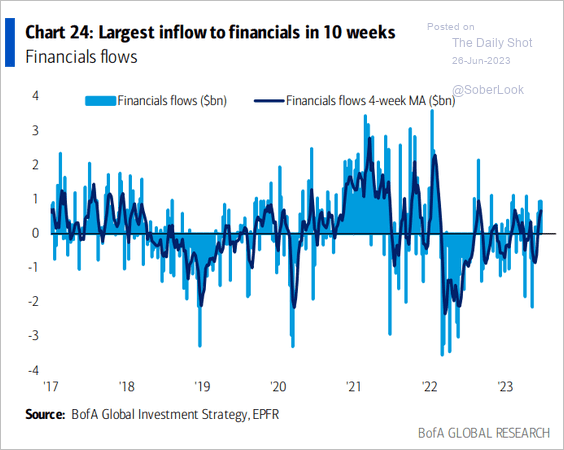
… while financials gained capital.
 Source: BofA Global Research
——————–
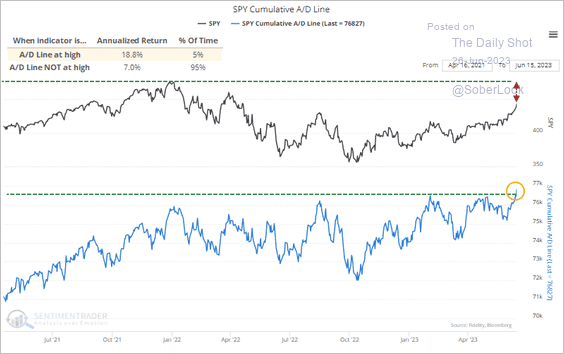
3. The S&P 500’s cumulative advance/decline line reached an all-time high, reflecting improving breadth.
 Source: SentimenTrader
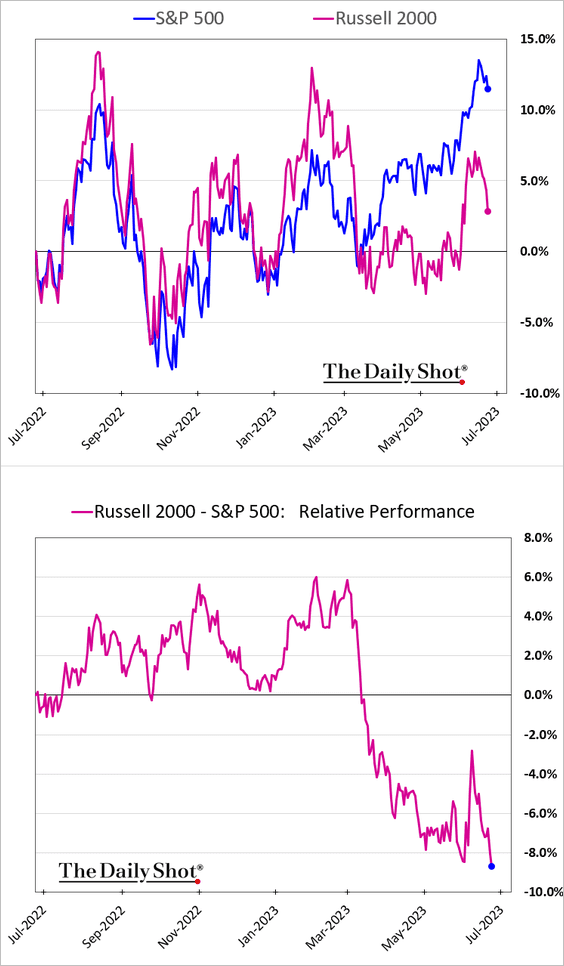
4. Small caps widened their underperformance last week.
5. The Nasdaq 100 valuation continues to diverge from real yields. Something has to give.
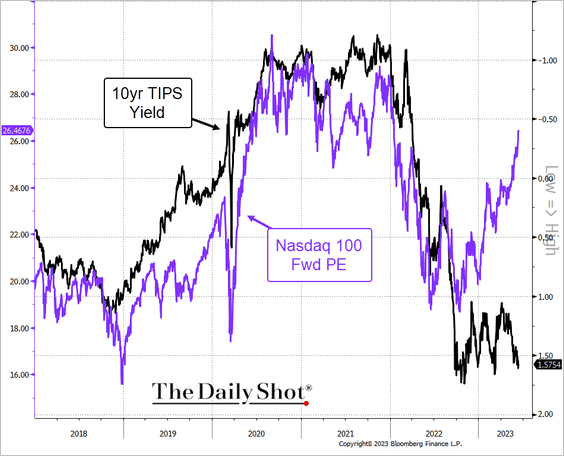 Source: @TheTerminal, Bloomberg Finance L.P.
6. The VIX/S&P 500 correlation surged in recent days.
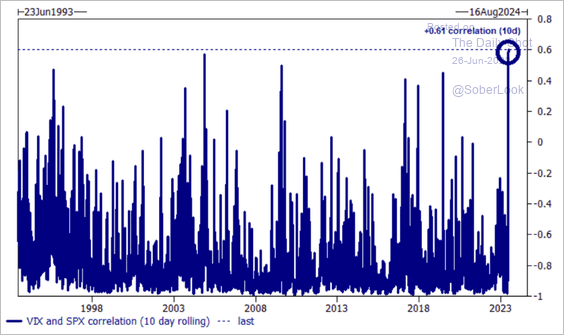 Source: Goldman Sachs; @dailychartbook
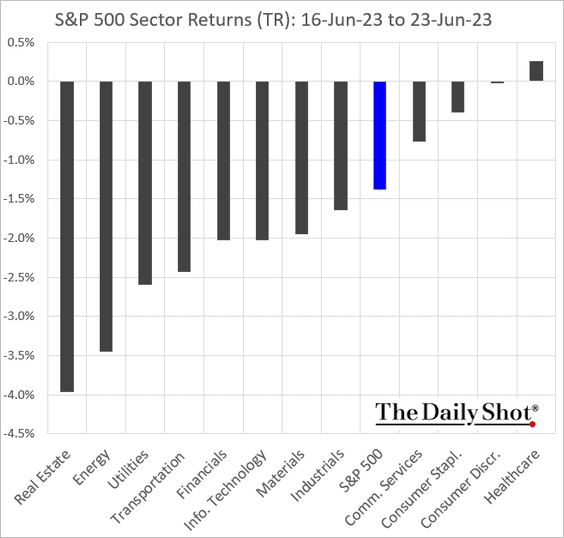
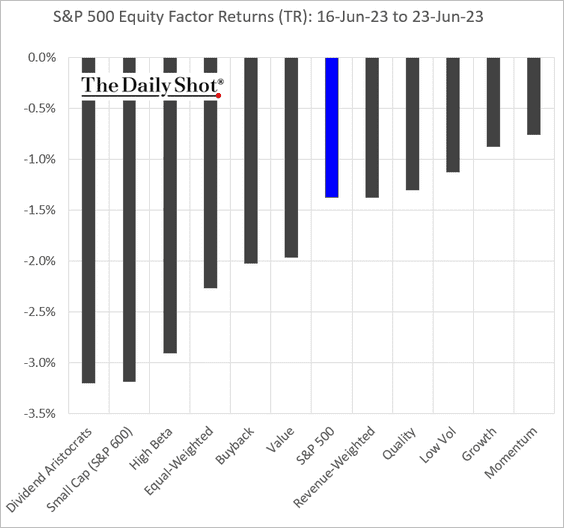
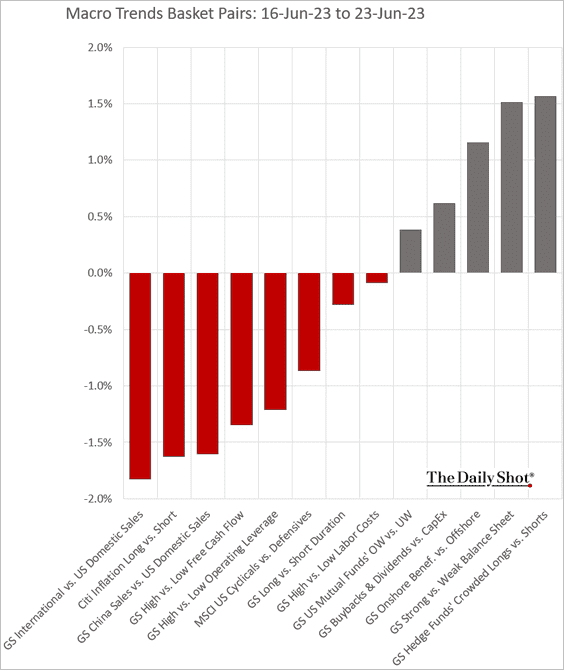
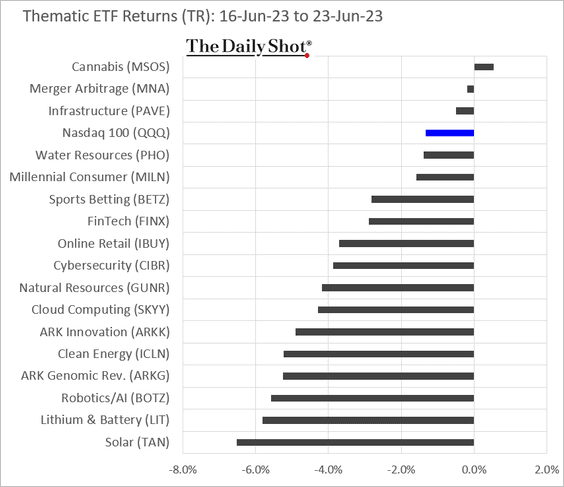
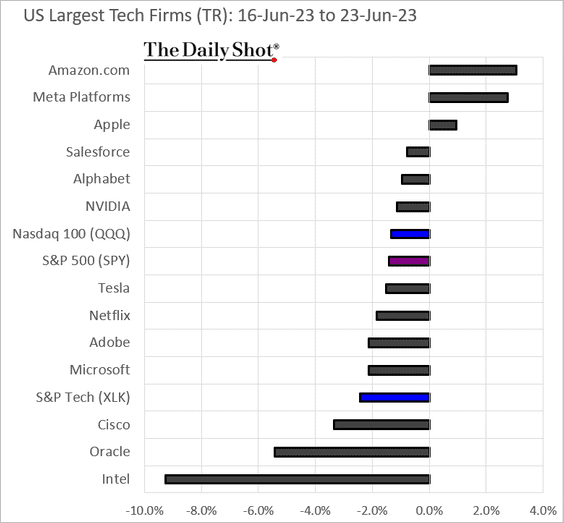
7. Next, we have some performance updates from last week.
• Sectors:
• Equity factors:
• Macro basket pairs’ relative performance:
• Thematic ETFs:
• Largest US tech firms:
Back to Index
Credit
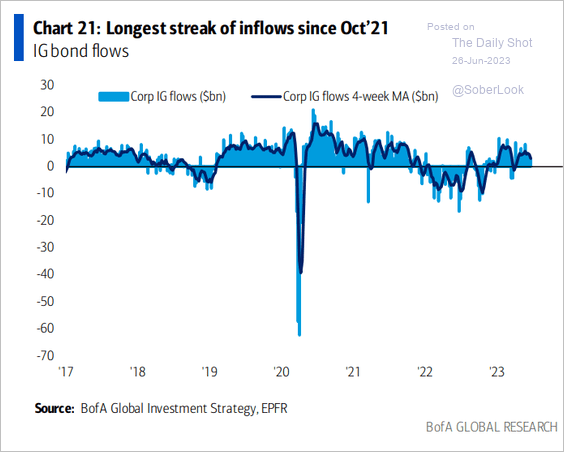
1. Investment-grade bond funds continue to see inflows.
 Source: BofA Global Research
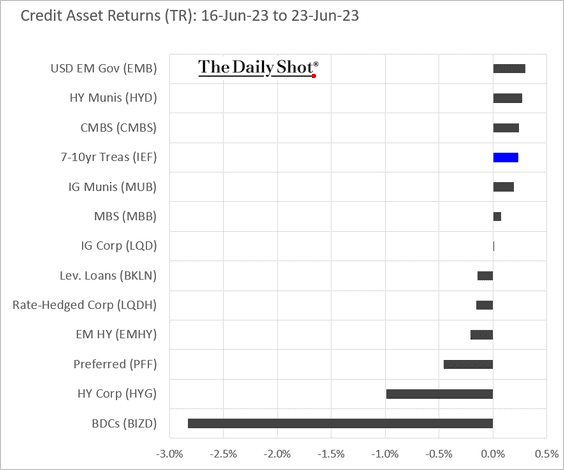
2. Here is last week’s performance by asset class.
Back to Index
Rates
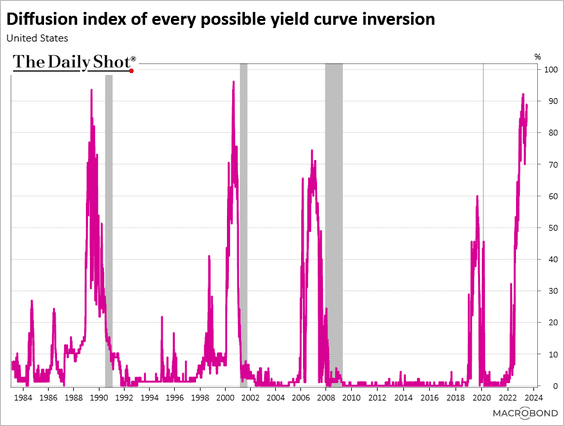
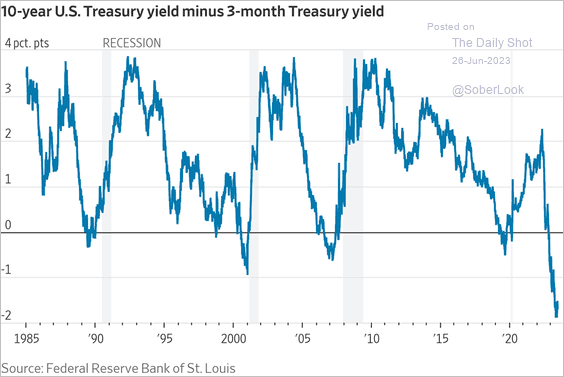
1. Almost 90% of the Treasury curve is inverted.
 Source: Chart and data provided by Macrobond
 Source: @WSJ Read full article
——————–
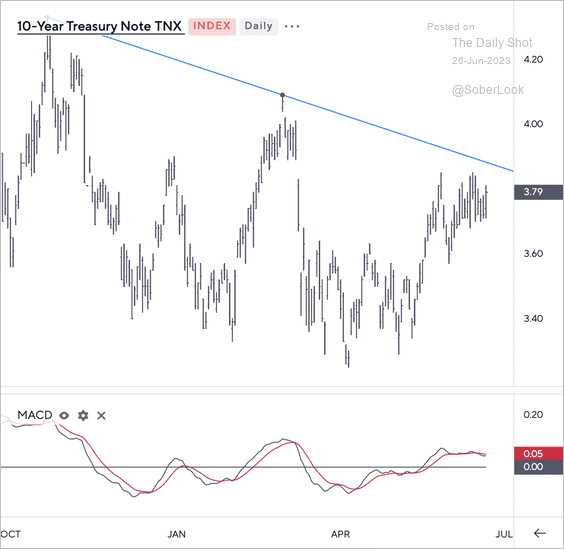
2. The 10-year Treasury yield is testing downtrend resistance.
 Source: Symbolik
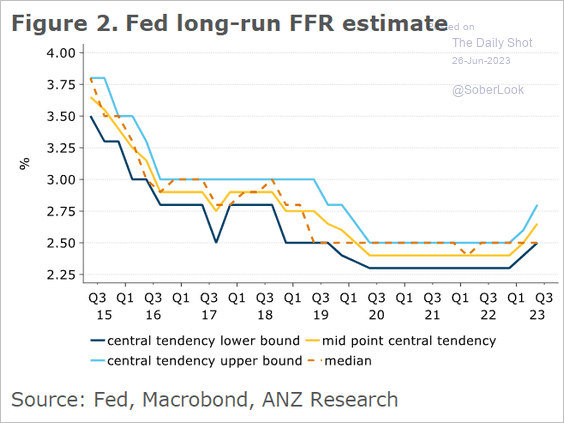
3. While the median FOMC projection for the long-run fed funds rate has been stable in recent years, the central tendency measure points to a higher long-run forecast.
 Source: @ANZ_Research
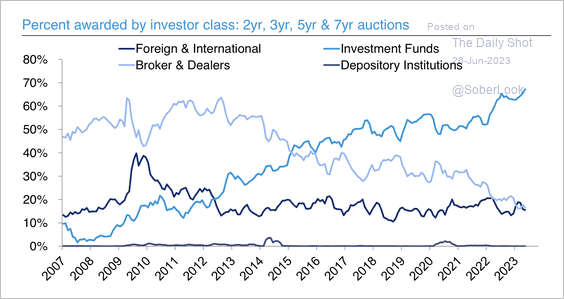
4. Investment fund allotments for 2-year and 7-year Treasury auctions have risen strongly.
 Source: Deutsche Bank Research
Back to Index
Global Developments
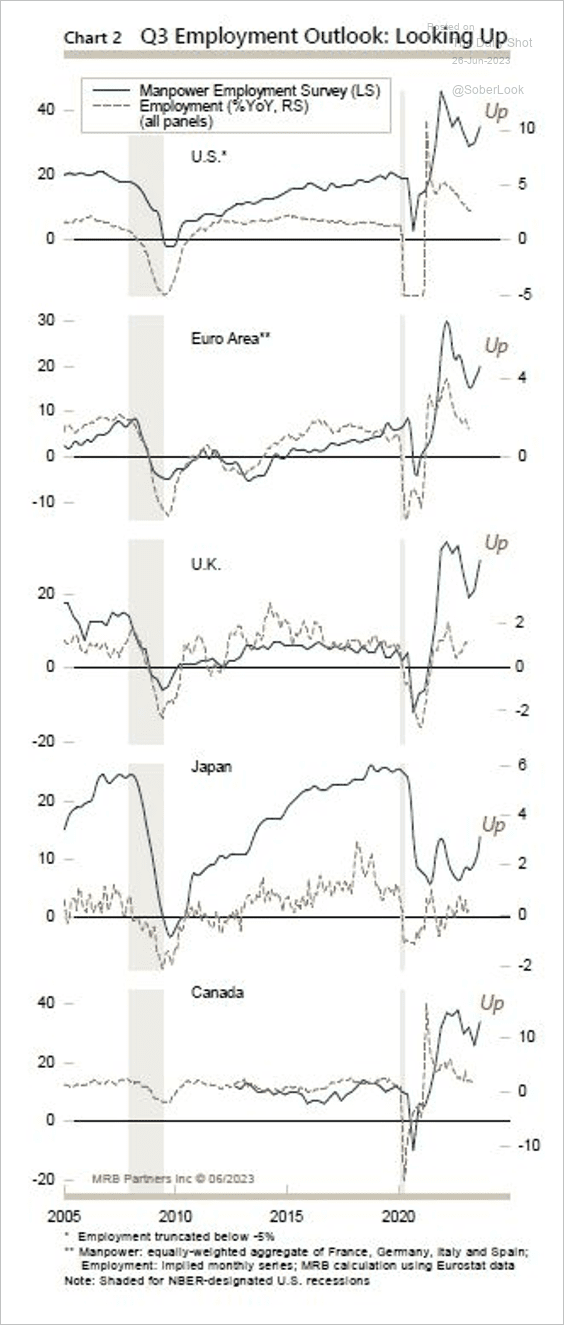
1. Employment conditions are improving among developed markets.
 Source: MRB Partners
2. Fund flows into risky assets are still outpacing safe assets.
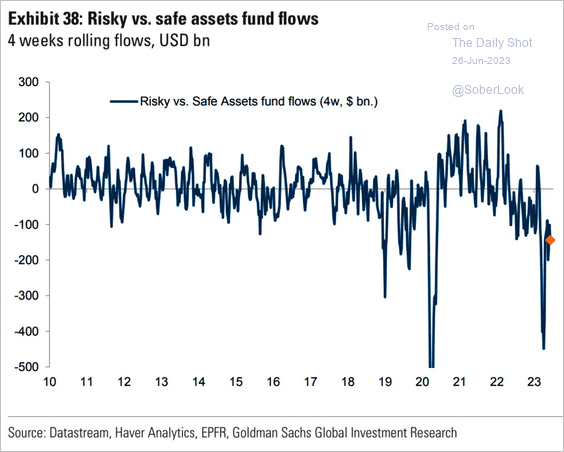 Source: Goldman Sachs
3. Here is a look at labor productivity and innovation.
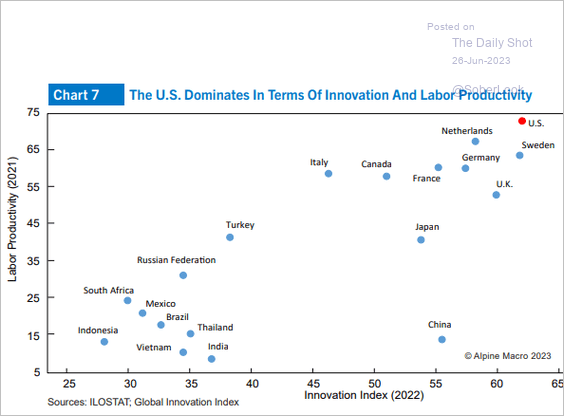 Source: Alpine Macro
4. Supply-chain stress has mostly dissipated.
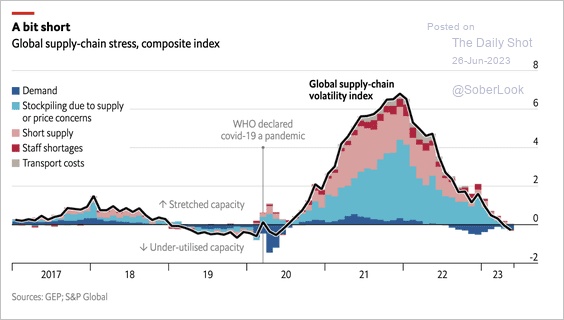 Source: The Economist Read full article
5. The WFH shift is not going away.
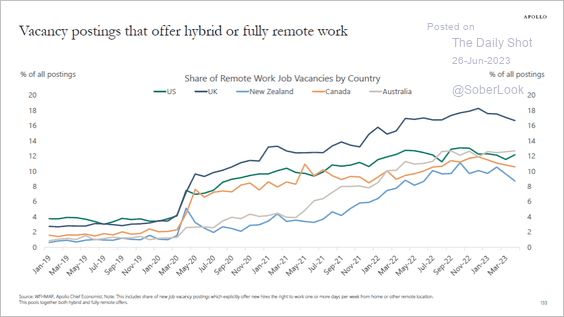 Source: Torsten Slok, Apollo
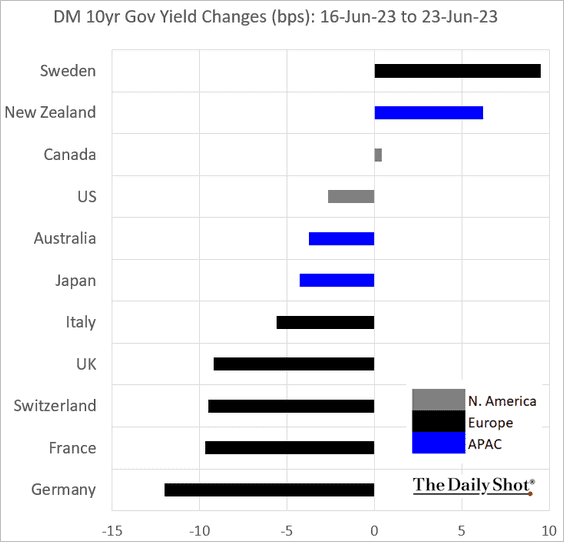
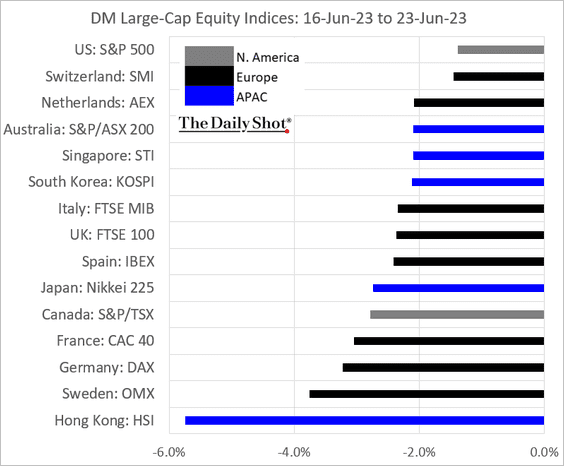
6. Finally, we have some DM performance data from last week.
• Currency indices:
• Bond yields:
• Large-cap equity indices:
——————–
Food for Thought
1. S&P 500 top 20 stocks’ weight and returns:
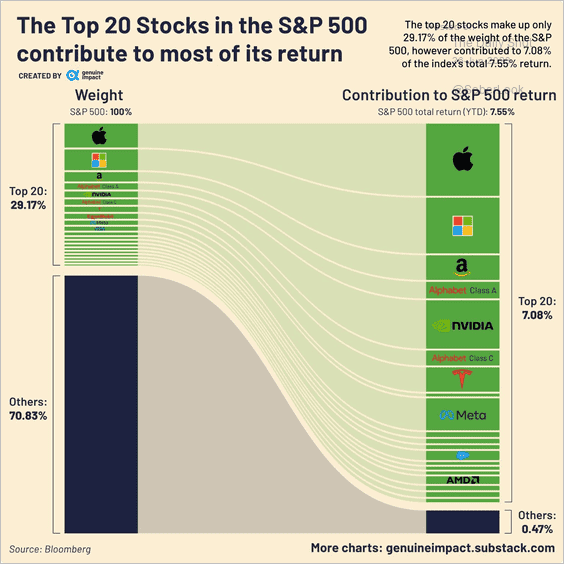 Source: Visual Capitalist Read full article
2. Big Oil profits:
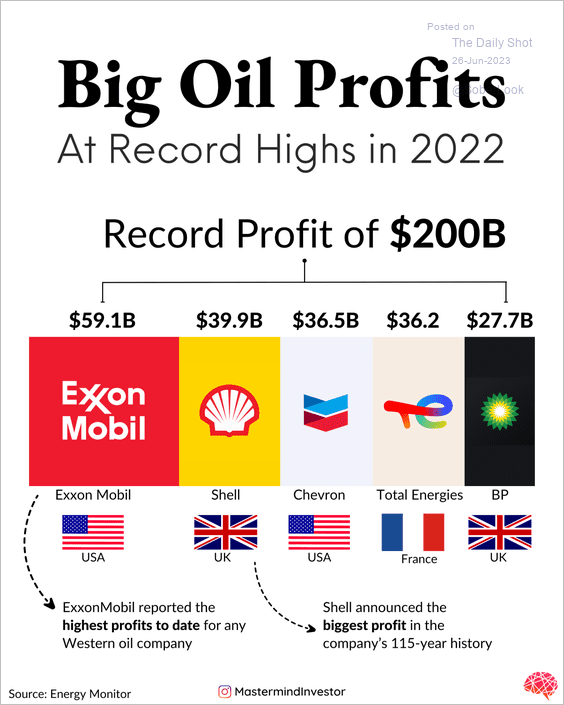 Source: Visual Capitalist Read full article
3. Declining demand for pizza delivery:
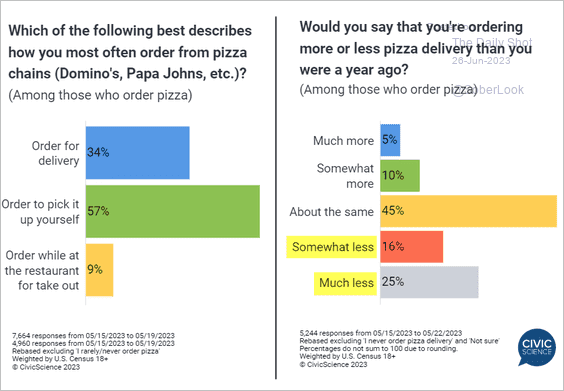 Source: @CivicScience Read full article
4. Indoor farming startups:
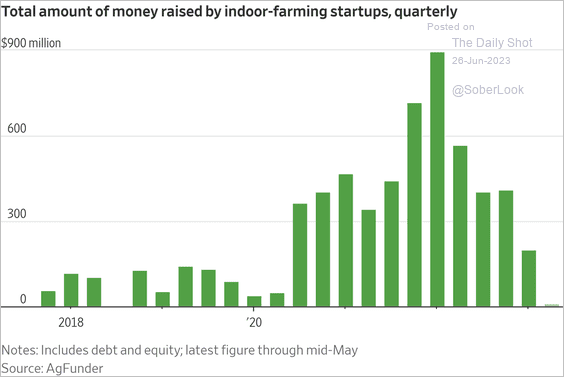 Source: @WSJ Read full article
5. Poultry exporters’ market share:
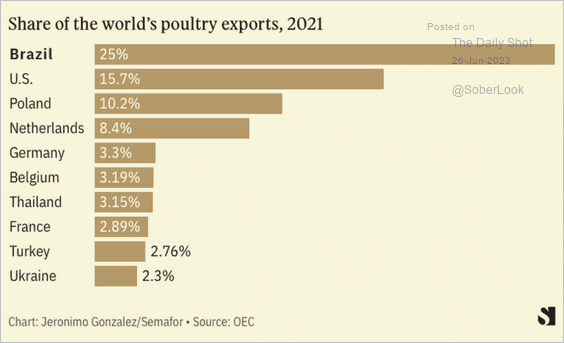 Source: Semafor
6. Top steel-producing nations:
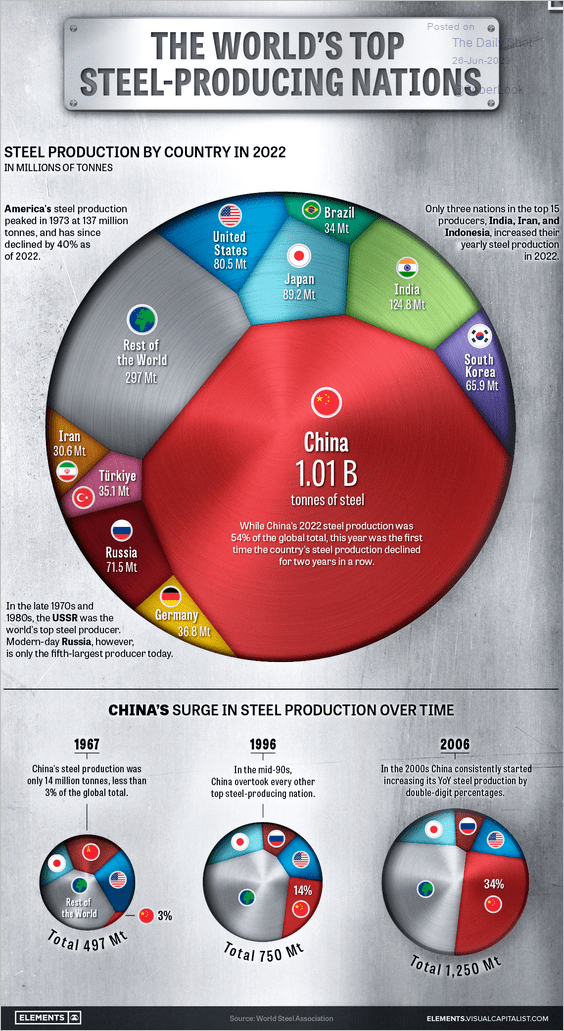 Source: Visual Capitalist Read full article
7. Relationship status by gender and educational attainment:
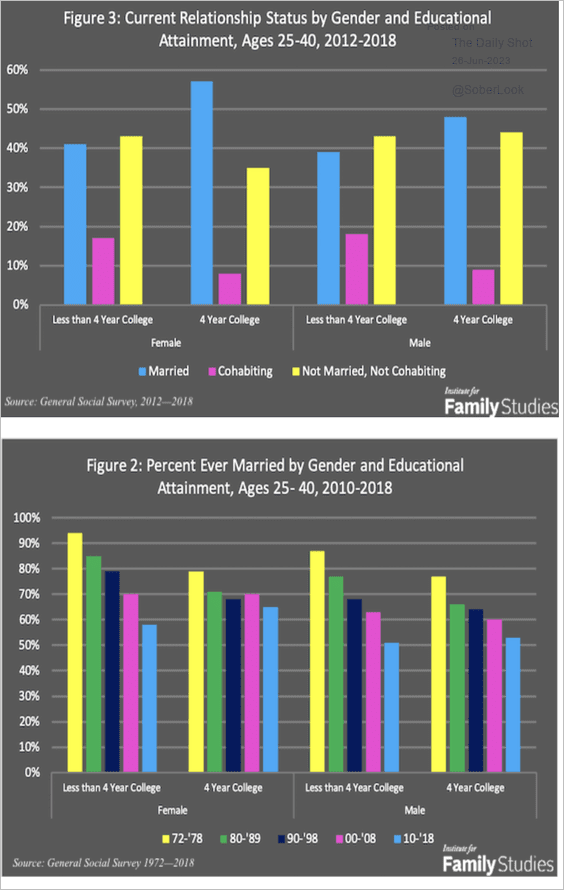 Source: IFS Institute Read full article
8. Cannabis legality by state:
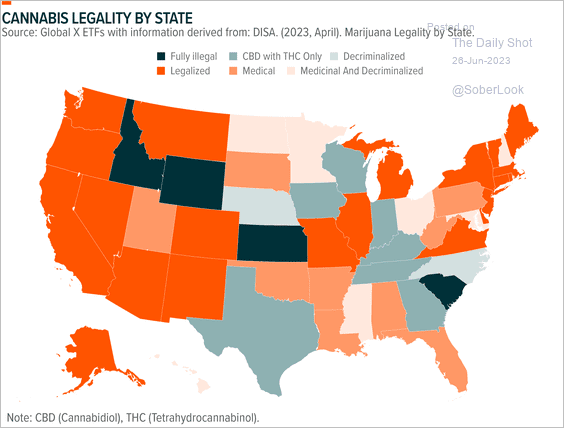 Source: Global X ETFs Read full article
9. Close calls on airport runways:
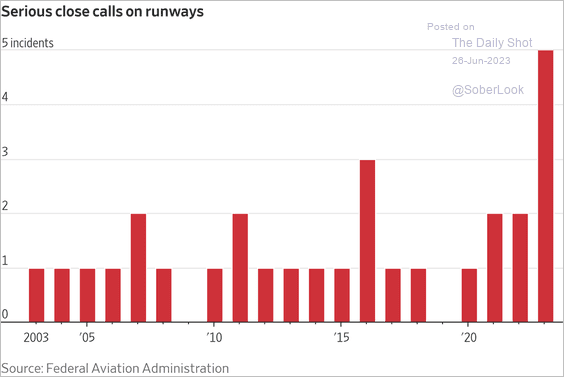 Source: @WSJ Read full article
10. Taking a break from Twitter:
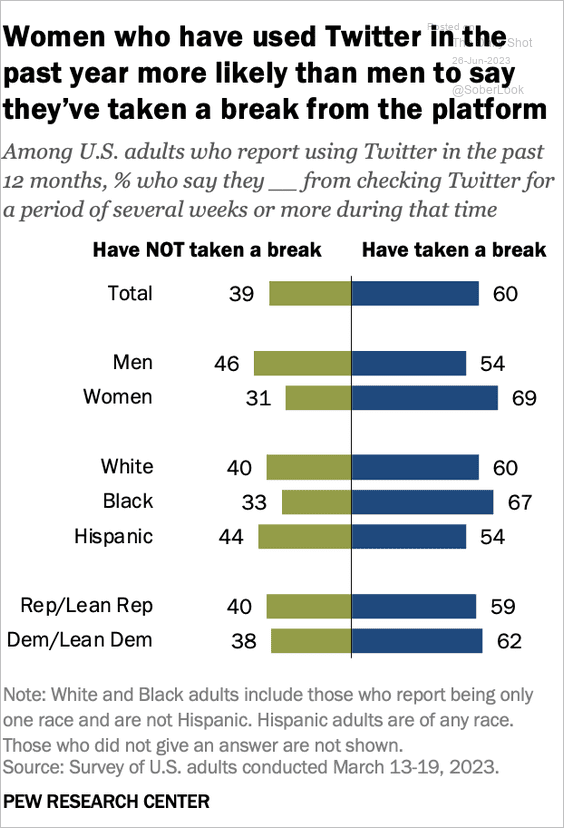 Source: Pew Research Center Read full article
11. Suicide rates:
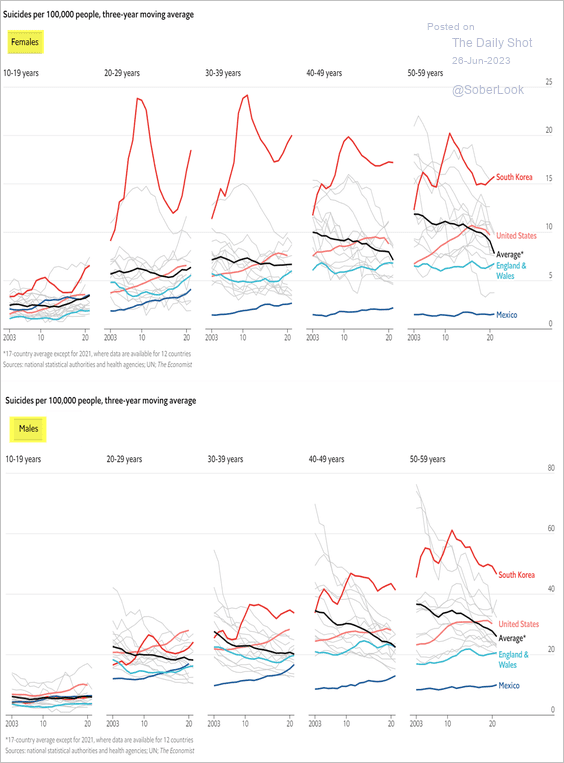 Source: The Economist Read full article
12. The number of years to get to 30 teams in major sports leagues in North America:
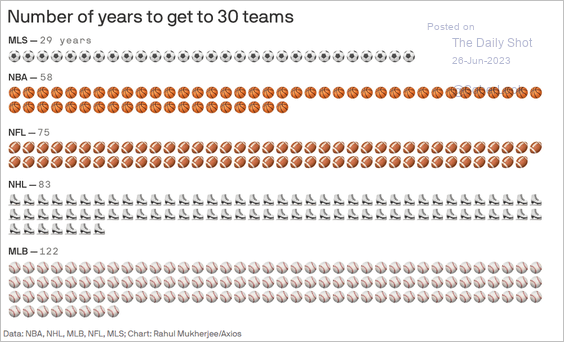 Source: @axios Read full article
——————–
Back to Index