
The Daily Shot: 14-Jul-23
• The United States
• The United Kingdom
• The Eurozone
• Asia-Pacific
• China
• Emerging Markets
• Cryptocurrency
• Commodities
• Energy
• Equities
• Alternatives
• Credit
• Rates
• Food for Thought
The United States
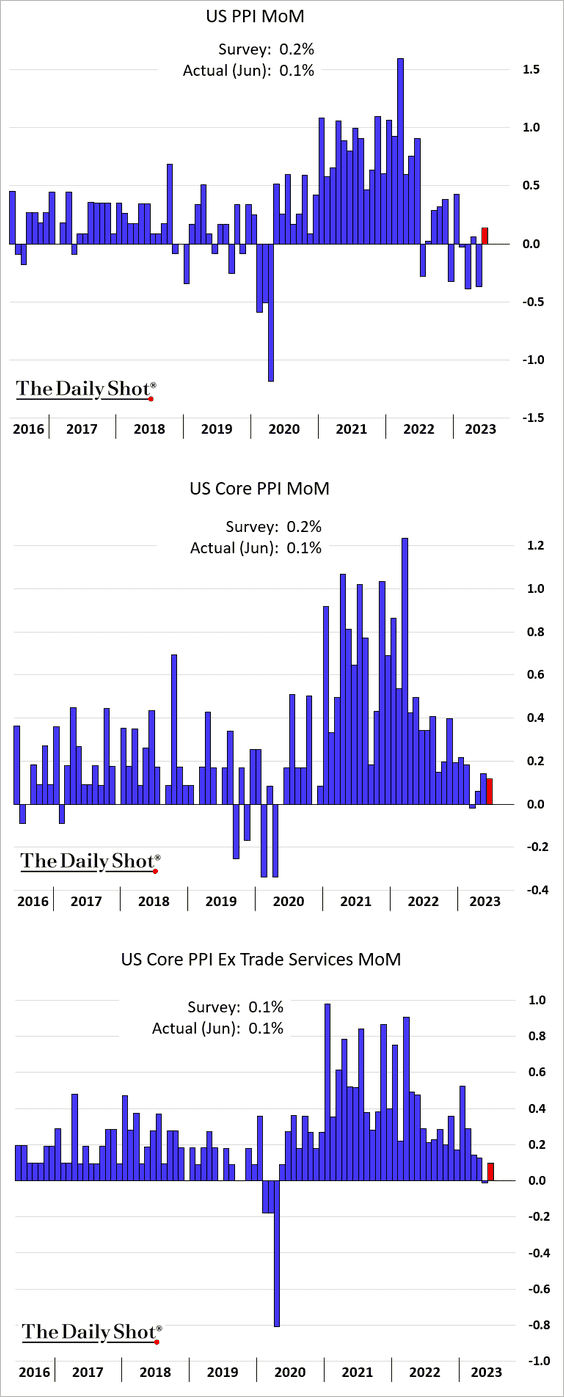
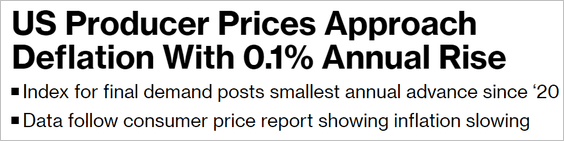
1. The PPI report provided further evidence of easing inflationary pressures, with the June headline and core figures coming in below forecasts.
 Source: @economics Read full article
• The core goods PPI change was negative for the first time since the COVID shock.

• Logistics costs continue to decline.

• On a year-over-year basis, the headline PPI is about to enter deflation.
 Source: FHN Financial
• Upstream prices are declining.
 Source: Mizuho Securities USA
• The US will import some disinflation from China.
 Source: Pantheon Macroeconomics
——————–
2. Next, we have some additional data on consumer inflation.
• Alternative core CPI measures showed slowing underlying inflation.
– Cleveland Fed’s Median CPI (monthly changes):

– Cleveland Fed’s Trimmed-Mean CPI:

– Atlanta Fed’s sticky CPI:

The sticky CPI is now annualizing at below 2%.
 Source: Deutsche Bank Research
– New York Fed’s UIG:
 Further reading
• Here are some sector trends.
– Vehicles:

– Airfare:
 Source: Scotiabank Economics
– Housing:

Nomura sees rent inflation gradually heading lower, …
 Source: Nomura Securities
… based on leading indicators.
 Source: ING
By the way, the massive divergence between wage growth and rent increases is not sustainable.
 Source: @WSJ Read full article
——————–
3. The US dollar is crashing after benign inflation reports.
 Source: barchart.com
4. The wage tracker from the Atlanta Fed indicates a deceleration in wage growth, yet it remains elevated.

Job hopping is not nearly as lucrative as it was at its peak last year, pointing to easing labor market imbalances. The Great Resignation has lost its luster.

——————–
5. Jobless claims did not rise as much as they typically do during the July 4th week.


Nonetheless, continuing claims are now 30.5% above last year’s levels.

——————–
6. The budget deficit is much wider this year than in 2022, …

… as federal receipts shrink while outlays continue to grow.
 Source: Oxford Economics
Back to Index
The United Kingdom
1. Key economic indicators held up better than expected in May.
• Services:

• Manufacturing production:

• Construction:

——————–
2. The trade deficit was wider than expected in May.

3. Improving real wages should support retail sales.
 Source: ING
4. UK investment and savings have lagged other advanced economies.
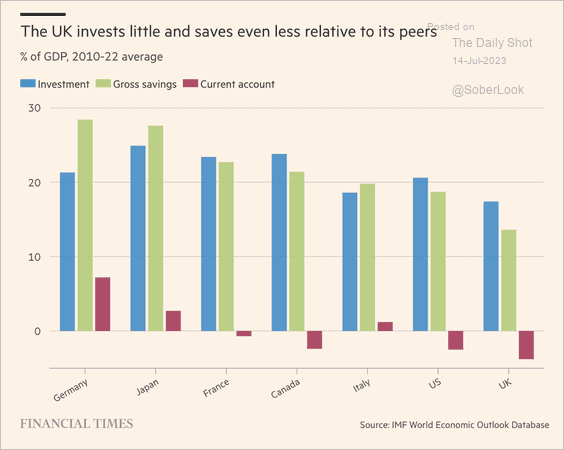 Source: @financialtimes Read full article
5. The GDP per capita has also been lagging.
 Source: Tony Blair Institute
6. Job growth in London has been outpacing the rest of the UK.
 Source: @financialtimes Read full article
7. What do Britons think about Brexit? How do they view the relationship with the EU going forward?
 Source: Tony Blair Institute
Back to Index
The Eurozone
1. Industrial production is down on a year-over-year basis.
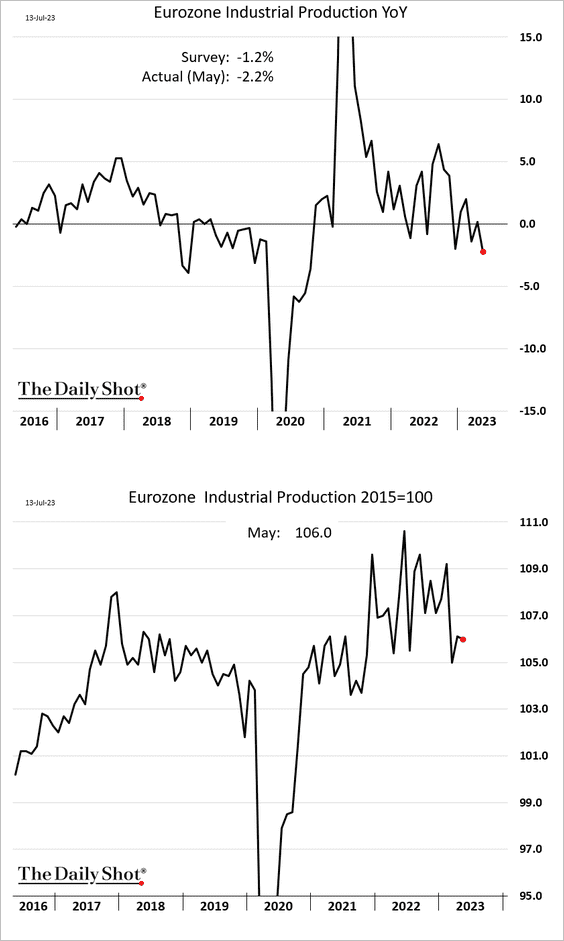
 Source: @WindSonja, @markets Read full article
——————–
2. The ECB minutes were hawkish, pointing to more rate hikes ahead.
 Source: @financialtimes Read full article
However, the market took its cue from moderating US CPI, lowering the expected ECB rate trajectory.

Back to Index
Asia-Pacific
Asian currencies are surging against the dollar.
– The yen:

– The Taiwan dollar:

– The South Korean won:

• The Aussie dollar is at resistance.

Back to Index
China
1. The renminbi is rebounding.

2. The decline in industrial profits points to weaker manufacturing investment.
 Source: BCA Research
Consumer staples, utilities, and auto stocks have maintained uptrends relative to the broader A-share market.
 Source: BCA Research
——————–
3. So far, the savings drawdown has boosted consumer spending and retail sales, although sentiment is still relatively weak.
 Source: MRB Partners
4. This chart shows China’s export changes by product (year-over-tear).
 Source: Pantheon Macroeconomics
Back to Index
Emerging Markets
1. Mexican industrial production jumped in May, boosted by construction. But factory output declined (2nd panel).

The Mexican peso continues to surge.

——————–
2. Next, we have some updates on Brazil.
• Service-sector output edged higher in May.

• Will we see a breakout in Brazil’s equities?
 Source: BCA Research
• Brazil’s population growth continues to slow.
 Source: @TheDailyShot Further reading
——————–
3. Malaysia’s ringgit is surging, driven by equity and bond inflows.
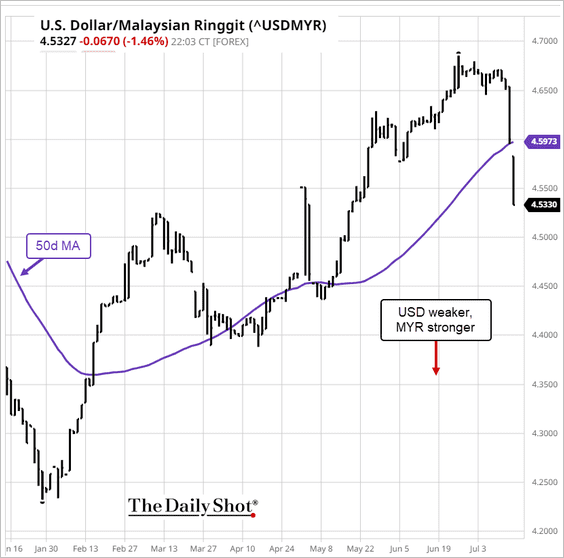 Source: barchart.com
4. Romania’s industrial production is down sharply relative to 2022.

Inflation is still above 10%.

——————–
5. Turkey’s industrial production climbed in May.

6. After some improvements this year, South Africa’s mining output was down again in May.

Back to Index
Cryptocurrency
1. It has been a good week for cryptos, with XRP outperforming top peers while Bitcoin Cash (BCH) consolidated recent gains.
 Source: FinViz
Here is the month-to-date performance.

• XRP soared on Thursday after US courts ruled that the sale of Ripple’s XRP tokens did not constitute investment contracts. This essentially means that XRP is not a security.
 Source: CoinDesk Read full article
 Source: Bloomberg Law Read full article
• By the way, XRP ranks third in Kaiko’s trading liquidity score, a strong improvement from Q1 when it ranked sixth.
 Source: @KaikoData
• Coinbase shares surged on Thursday.

——————–
2. Also, on Thursday, the SEC charged Celsius and its founder/former CEO with violating securities laws.
 Source: SEC Read full article
——————–
• Market depth for Celsius’ altcoin holdings is very low. Liquidations could place significant pressure on markets.
 Source: @KaikoData
——————–
3. The next bitcoin halving is roughly 280 days away.
 Source: @glassnode
4. Bitcoin’s 14-day price range has been extremely narrow. Will we see a volatile price move ahead?
 Source: @glassnode
Back to Index
Commodities
1. Periods of low volatility during uptrends bode well for gold prices.
 Source: Aazan Habib, Paradigm Capital
2. Iron ore futures resumed their rally.

3. Here is a look at global export restrictions on critical materials.
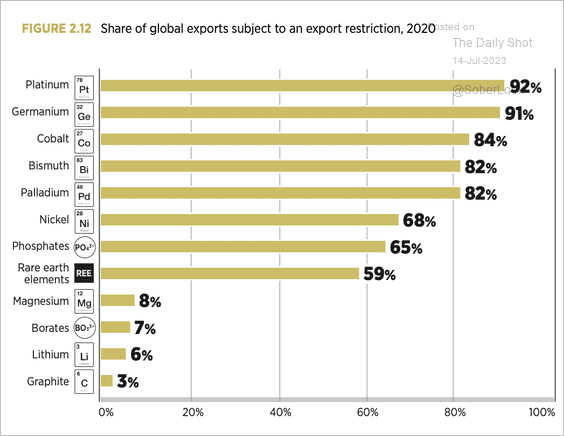 Source: IRENA
4. Olive oil prices hit a record high due to the Spanish drought.
 Source: @financialtimes Read full article
Back to Index
Energy
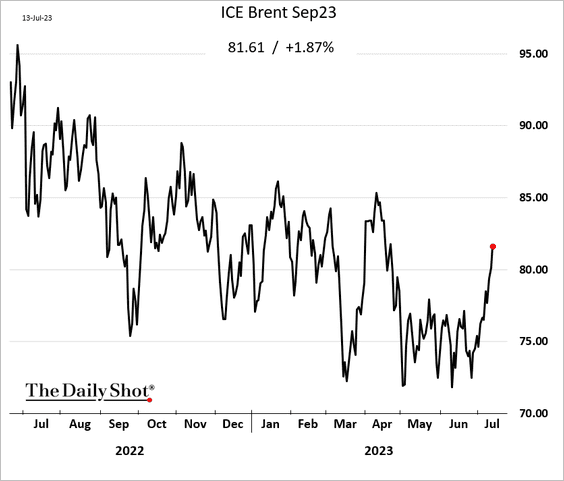
1. Crude oil prices continue to surge.
2. Here is a look at expected oil demand growth by source/product.
 Source: IEA
 Source: IEA
——————–
3. The southern and western regions of the US are currently grappling with severe heatwave conditions.
 Source: NOAA
 Source: Reuters Read full article
Nonetheless, natural gas prices have been falling, …

… amid elevated inventories.

——————–
4. This chart illustrates the evolving share of global energy production across various fuel types.
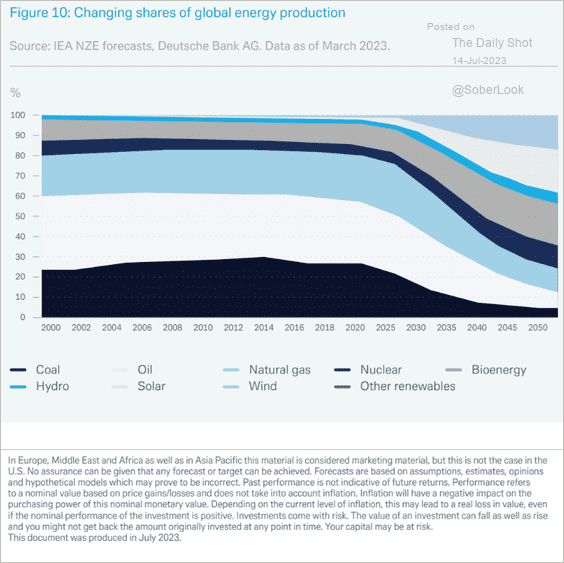 Source: Deutsche Bank Research
Back to Index
Equities
1. The S&P 500 forward P/E ratio is back above pre-COVID levels, nearing 20x.

2. Equity funds continue to see inflows.
 Source: BofA Global Research
Here is a longer-term view of fund flows into equities vs. bonds and cash.
 Source: Goldman Sachs; @Marlin_Capital
——————–
3. The NYSE new highs-new lows index made a year-to-date high, reflecting improving market breadth.
 Source: @the_chart_life
This chart shows the percentage of S&P 500 stocks that are above their 200-day moving average.
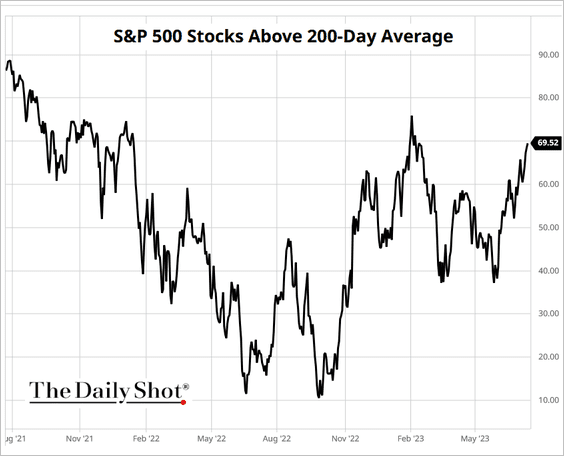 Source: barchart.com
——————–
4. Retail purchases of stocks and ETFs are off the recent highs.
 Source: Vanda Research
Here is a look at retail purchases by sector relative to this year’s peak.
 Source: Vanda Research
——————–
5. Investment managers have been boosting allocation to stocks.
 Source: NAAIM
6. Macro hedge funds’ stock exposure has been correlated with economic surprises.
 Source: Nomura; @dailychartbook
7. How did stocks perform after previous tightening cycles?
 Source: Macrobond
8. Despite bonds being much more attractive than stocks based on technicals and fundamentals (see chart), investor sentiment is markedly favoring stocks.
 Source: @jasongoepfert; h/t @dailychartbook
9. Small caps have been outperforming this month.

10. AI stocks surged this week.

11. Companies with a limited focus on ESG have been outperforming since May.

Back to Index
Alternatives
1. Capital deployment was down about 34% year-over-year in Q1 across Morgan Stanley’s coverage of private equity firms.
 Source: Morgan Stanley Research
Deal activity has been highest in professional services, industrials, and energy transition.
 Source: Morgan Stanley Research
——————–
2. Median US seed-stage startup valuations continued their upward trend in Q1. Greater participation among corporate venture capital and large investors helped boost seed-stage deal metrics, according to PitchBook.
 Source: PitchBook
US venture-growth deal value is expected to fall below $50 billion this year. PitchBook data shows 90% of the capital invested in this stage was tied to deals with nontraditional firms.
 Source: PitchBook
Back to Index
Credit
1. Will the stock rally boost high-yield bond prices?
 Source: @TheTerminal, Bloomberg Finance L.P.
On the other hand, elevated bankruptcies could put pressure on the high-yield market.
 Source: Simon White, Bloomberg Markets Live Blog
——————–
2. Middle-market syndicated lending has been slowing.
 Source: @theleadleft
3. US banks continue to tighten lending standards, especially for commercial real estate loans.
 Source: Deutsche Bank Research
• Banks have been less willing to lend to consumers, which typically coincides with recessions.
 Source: Deutsche Bank Research
• Deutsche Bank expects US bank loan loss provisions to remain elevated.
 Source: Deutsche Bank Research
Back to Index
Rates
1. Retail investors have been loading up on bond ETFs.
 Source: Vanda Research
2. The liquidity drawdown from the US Treasury boosting its cash holdings at the Fed (after the debt ceiling was lifted) has been offset by falling balances at the Fed’s RRP facility. This should keep US bank deposits relatively stable.
 Source: @TheTerminal, Bloomberg Finance L.P.
——————–
Food for Thought
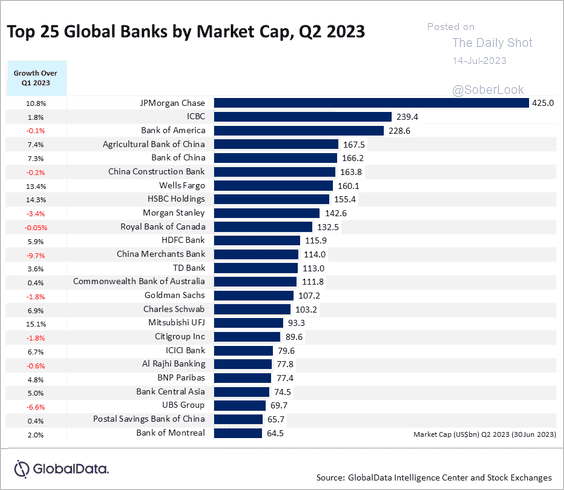
1. Top 25 global banks by market cap:
 Source: GlobalData
2. Investment in US manufacturing:
 Source: The Economist Read full article
3. Year-over-year changes in China’s exports by destination:
 Source: Pantheon Macroeconomics
4. Global residents’ perceptions of their local area as a “good place” for gay and lesbian people to live:
 Source: Gallup Read full article
5. Poverty rates among young adults who experienced childhood poverty:
 Source: @axios Read full article
6. Online use of languages vs. share of native language speakers:
 Source: @chartrdaily
7. Annual working hours by country:
 Source: Visual Capitalist Read full article
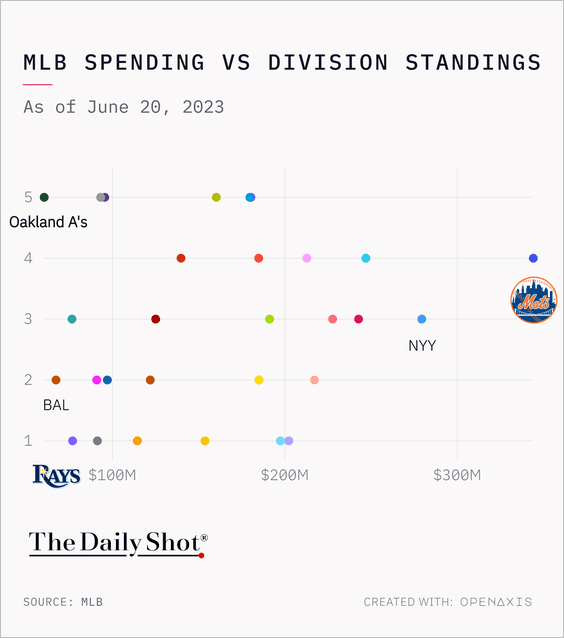
8. MLB spending vs. division standings:
 Source: @TheDailyShot
——————–
Have a great weekend!
Back to Index