
The Daily Shot: 17-Jul-23
• The United States
• Canada
• The United Kingdom
• The Eurozone
• Europe
• Japan
• China
• Emerging Markets
• Cryptocurrency
• Commodities
• Energy
• Equities
• Credit
• Global Developments
• Food for Thought
The United States
1. The U. Michigan consumer sentiment index jumped in July …
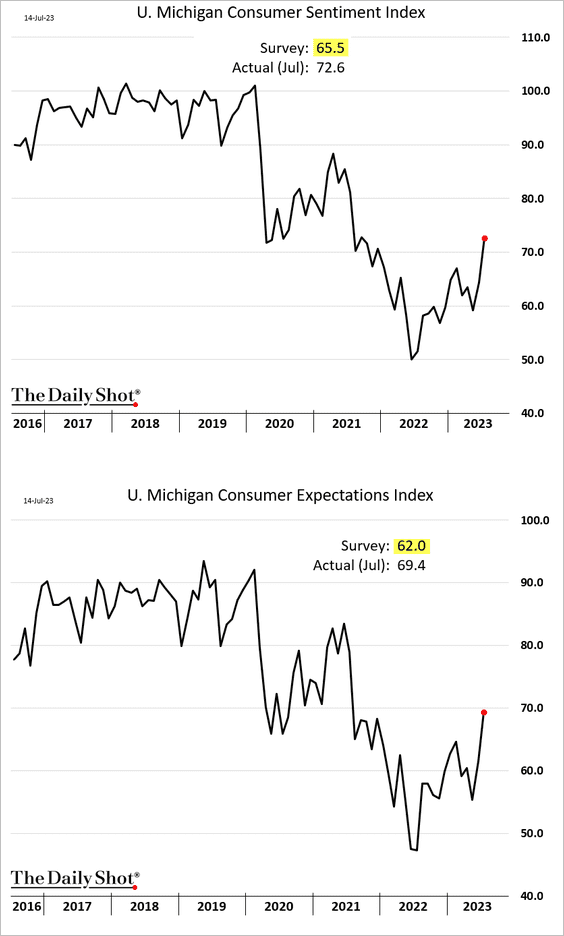
… boosted by the stock market rally and stabilization in home prices (improving household balance sheet).
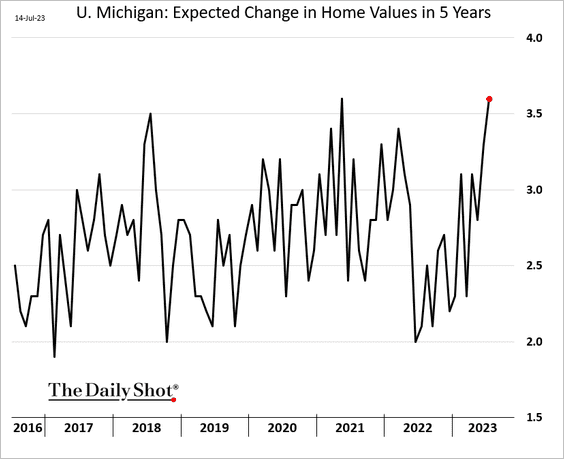
This index tracks consumer expectations for home prices.
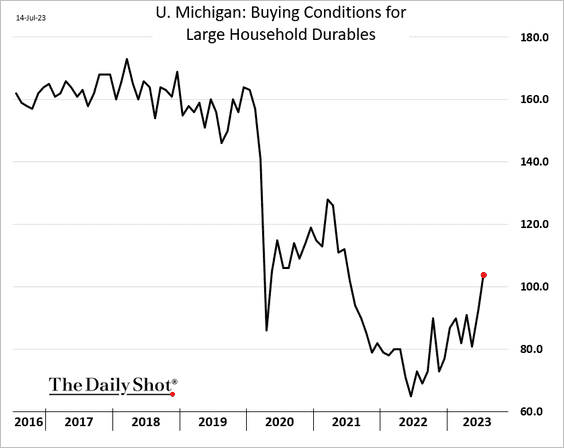
• Buying conditions for household durables surged.
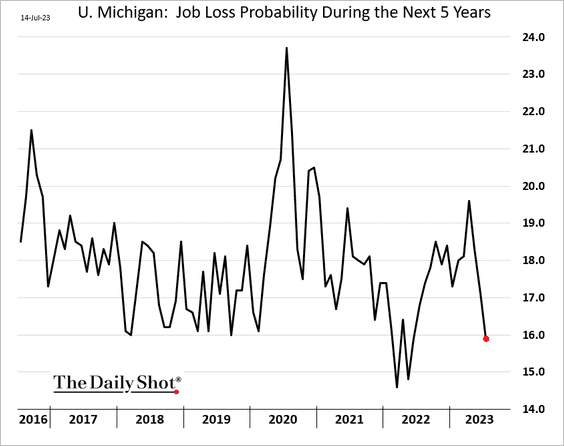
• More consumers are becoming unconcerned about job losses.
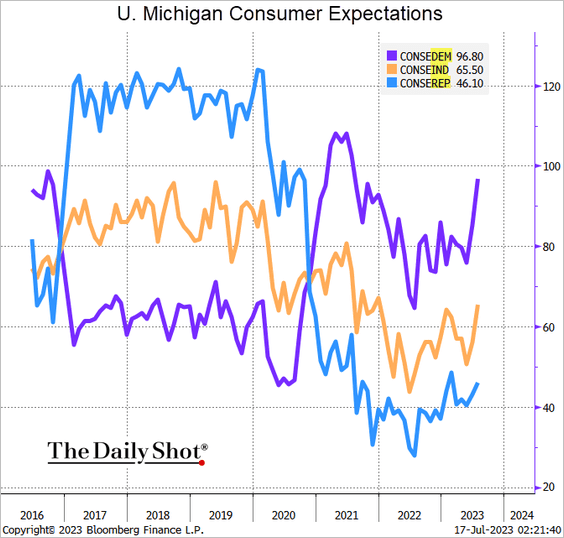
• Here is the consumer expectations index by political affiliation.
 Source: @TheTerminal, Bloomberg Finance L.P.
• Inflation expectations edged higher, …
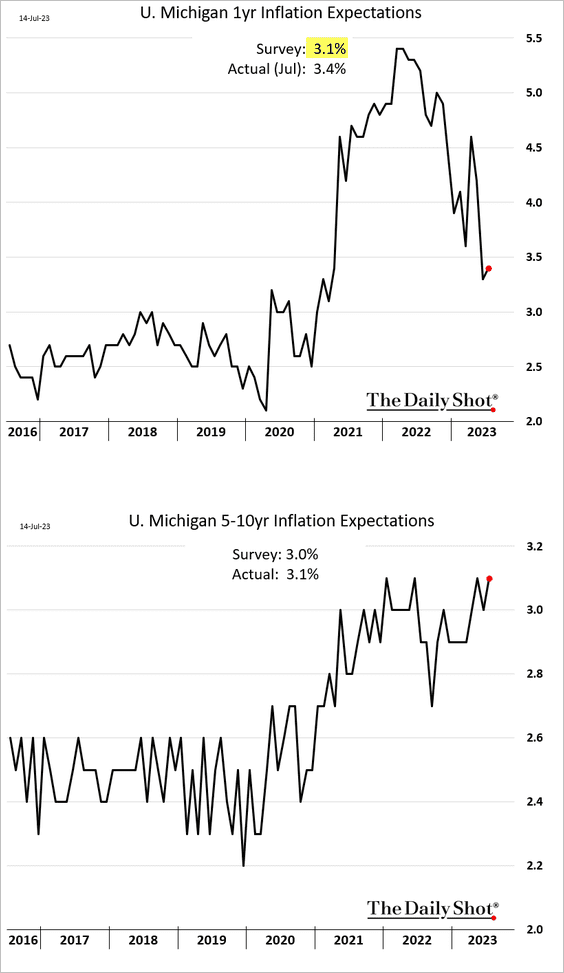
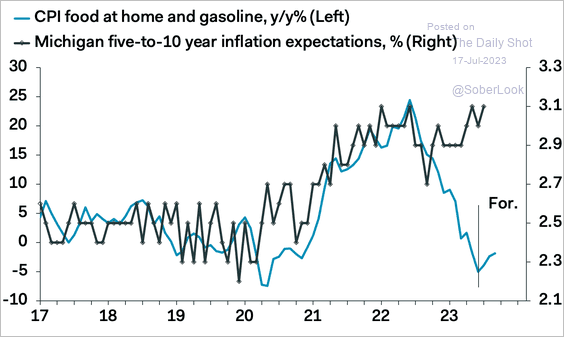
… with long-term expectations remaining sticky. This is a concern for the Fed.
 Source: Pantheon Macroeconomics
——————–
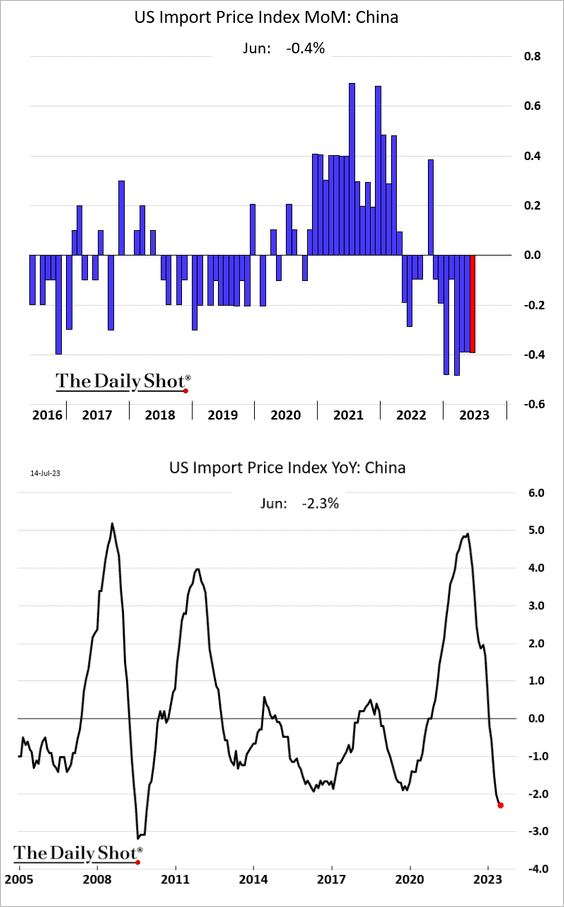
2. Import prices continue to drop.
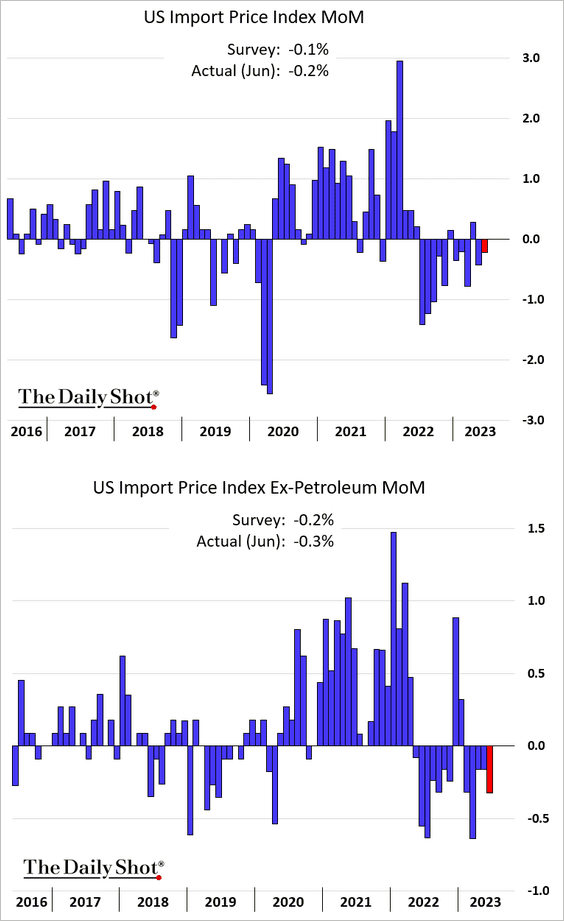
The US is importing some disinflation from China.
——————–
3. Shrinking profit margins could force businesses to raise prices or reduce staff.
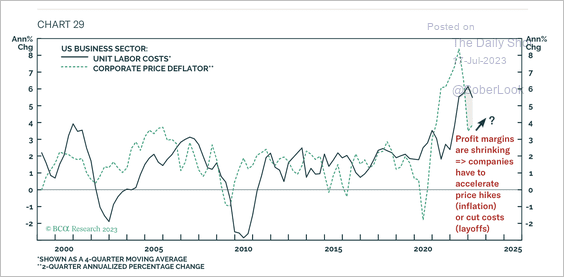 Source: BCA Research
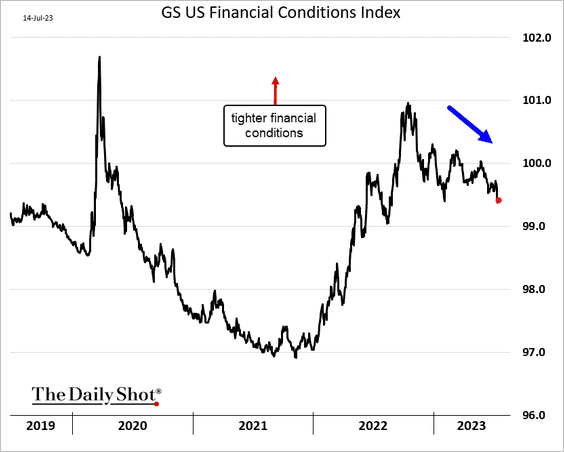
4. US financial conditions have been easing,
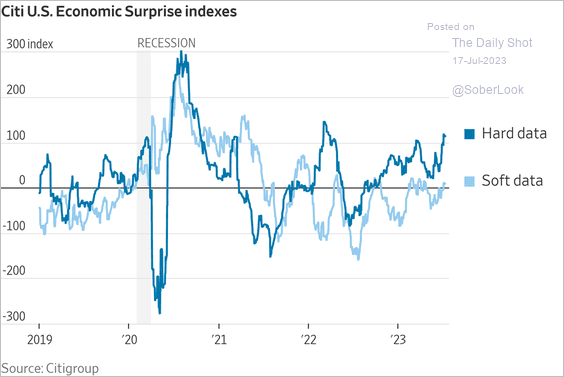
5. Economic surprises have been positive for hard data, while soft data (surveys) has been lagging.
 Source: @WSJ Read full article
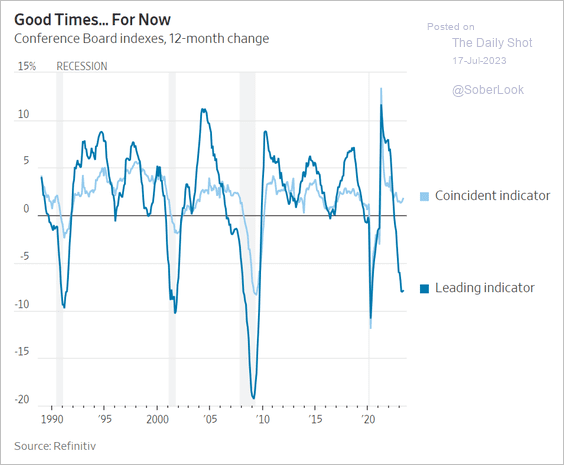
Related to the above, the Conference Board’s leading and coincident indices have diverged.
 Source: @WSJ Read full article
——————–
6. Automobile sales are expected to accelerate next year.
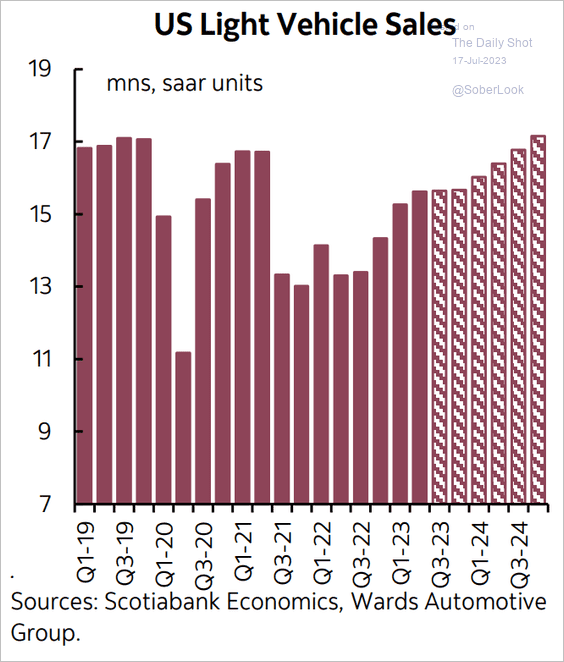 Source: Scotiabank Economics
7. Demand for office space turned higher in Q2.
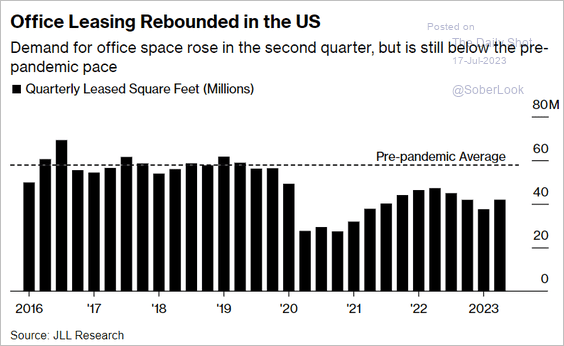 Source: @wealth Read full article
8. Next, we have labor force participation among women with children.
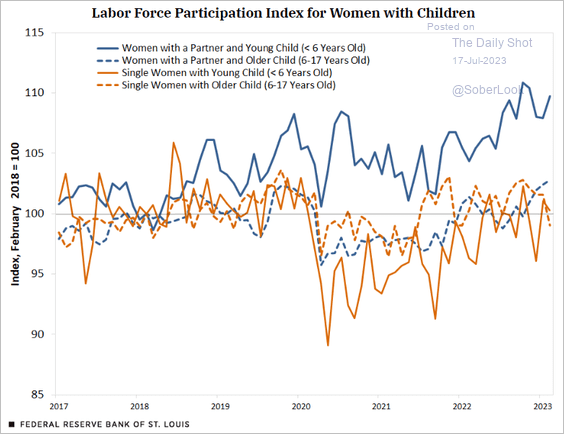 Source: @stlouisfed Read full article
9. This chart shows the contributions to households’ nominal income by industry.
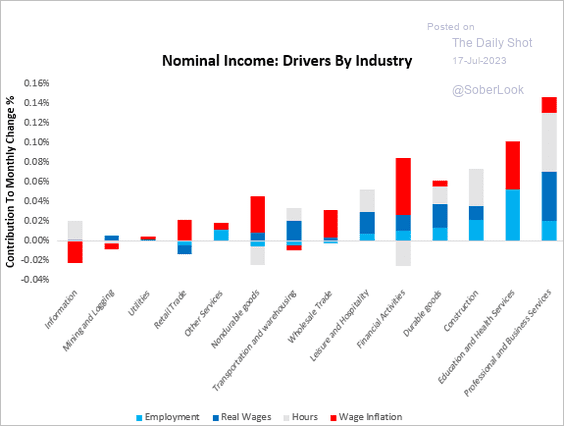 Source: Prometheus Research
10. The duration of economic cycles has progressively increased over the course of the past century.
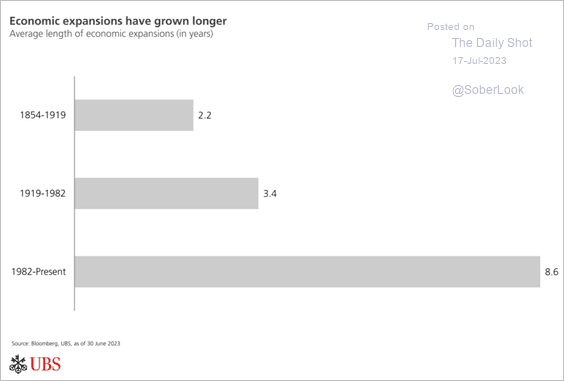 Source: UBS Research
Back to Index
Canada
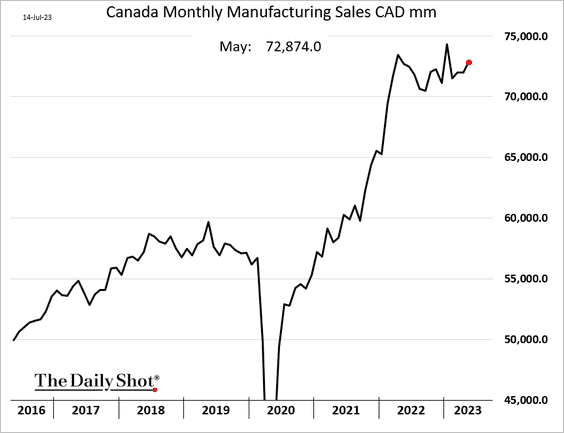
1. Manufacturing sales climbed in May.
2. Home sales have been rebounding.
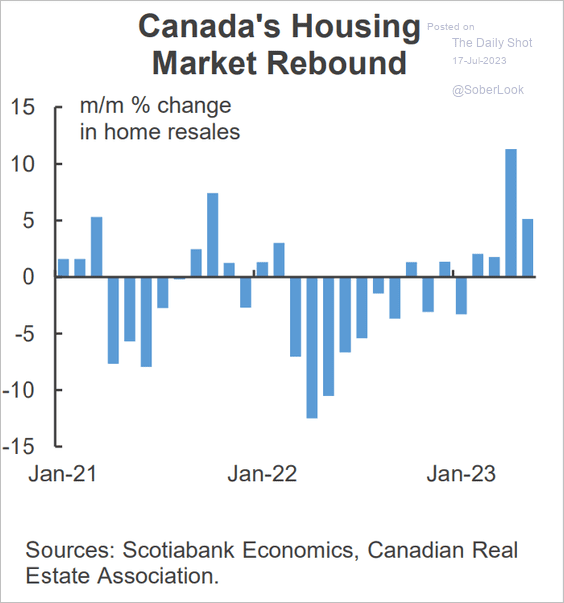 Source: Scotiabank Economics
3. This chart shows mortgage originations and rates by mortgage type.
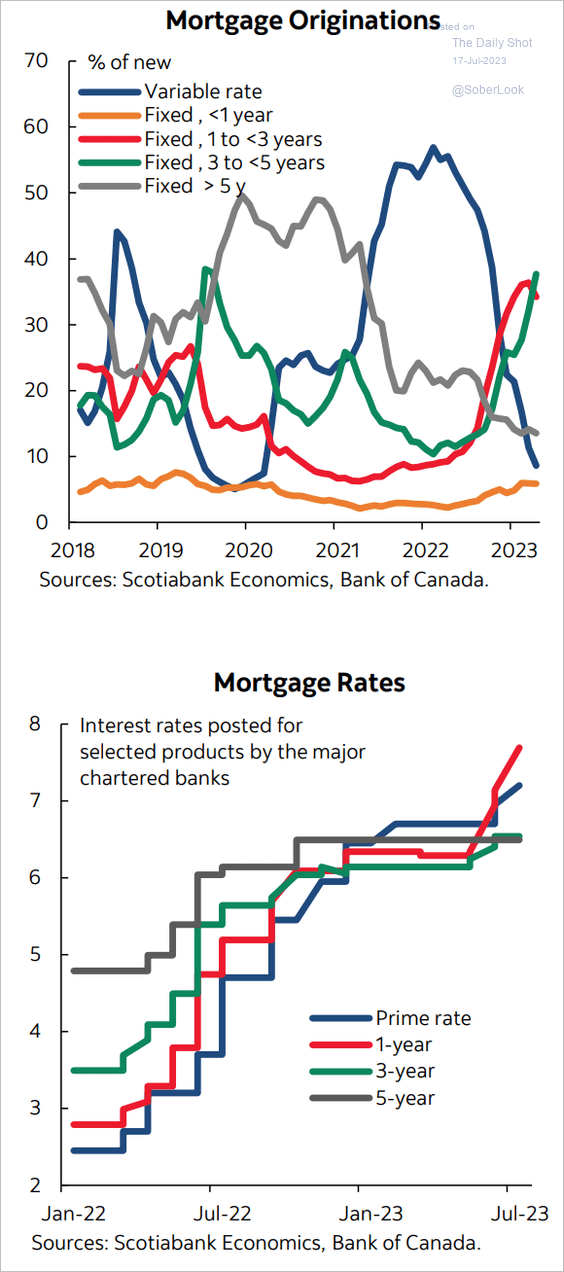 Source: Scotiabank Economics
Back to Index
The United Kingdom
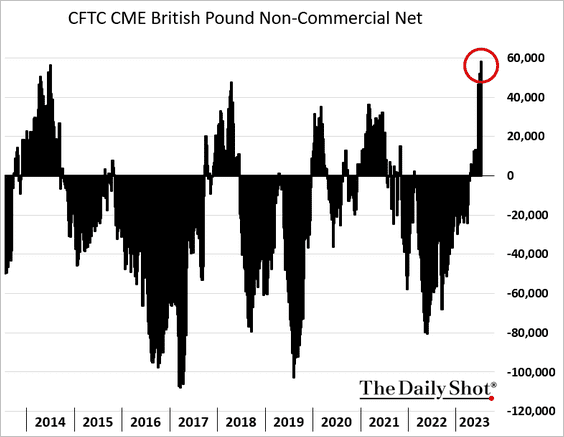
1. Speculative bets on the British pound hit a multi-year high.
2. Is wage growth heading lower?
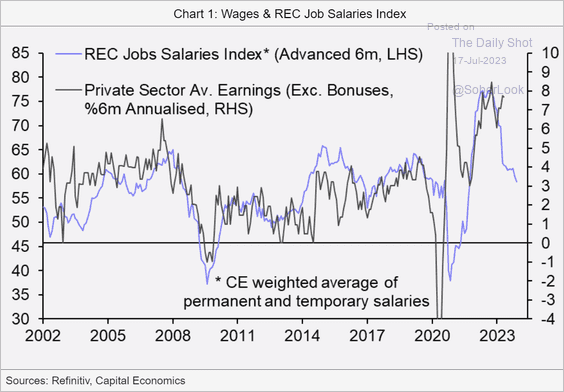 Source: Capital Economics
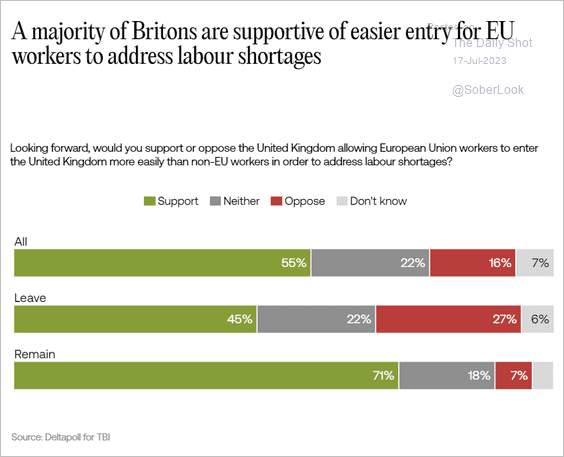
3. Should workers from the EU be granted a more streamlined access to the UK than workers from outside the European Union?
 Source: Tony Blair Institute
Back to Index
The Eurozone
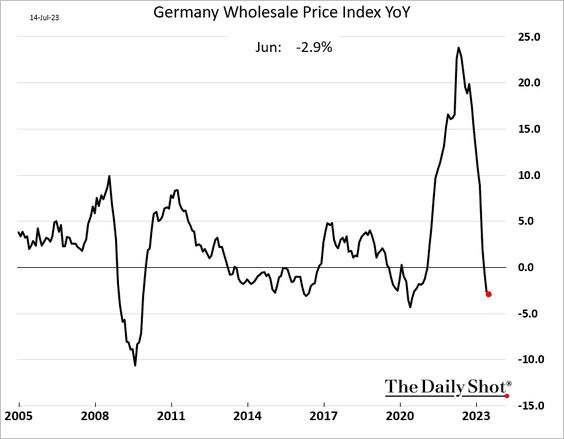
1. Let’s begin with Germany.
• Wholesale inflation:
• Critical imports from China:
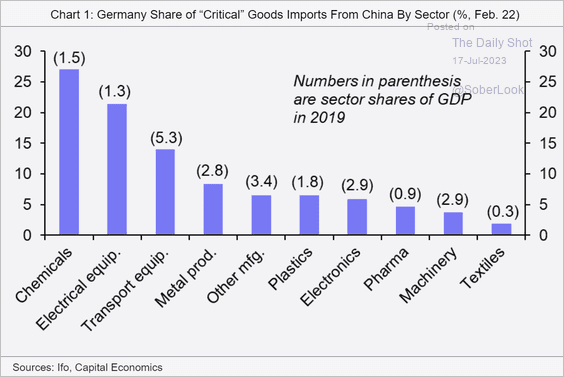 Source: Capital Economics
• German vs. US manufacturing investment:
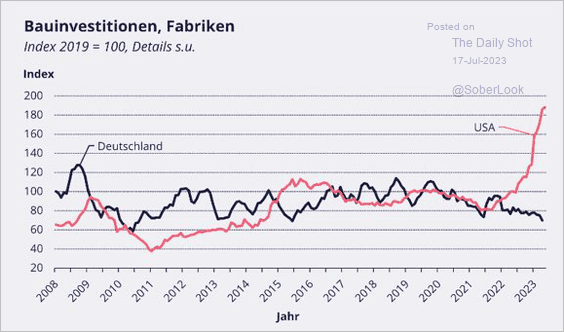 Source: @MichaelAArouet, @maxkrahe
• New building permits:
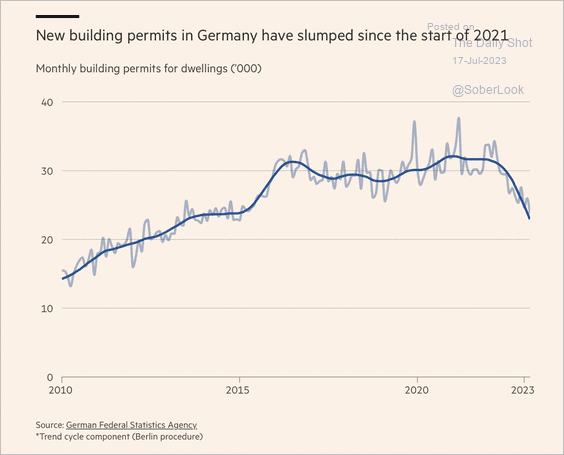 Source: @financialtimes Read full article
——————–
2. Italian sticky services inflation is expected to slow the CPI declines.
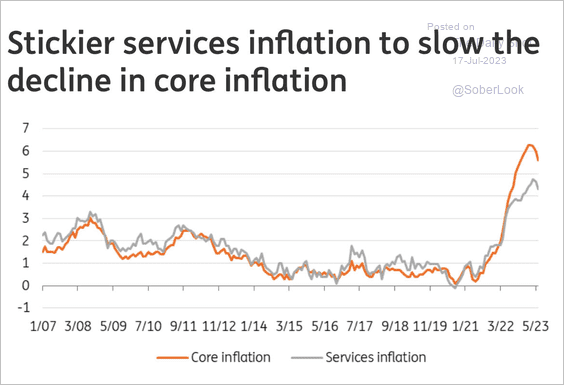 Source: ING
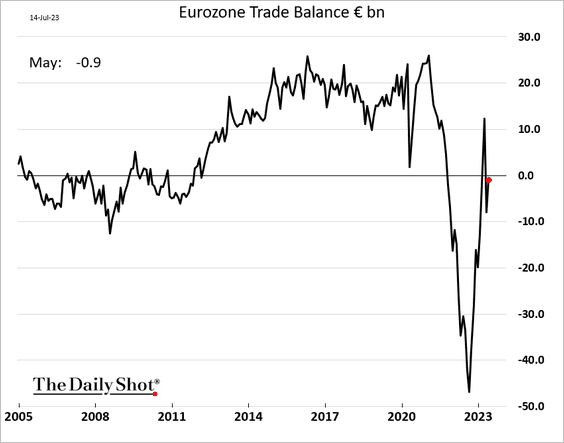
3. The euro-area trade balance is close to zero.
4. The ECB’s policy transmission has been less effective than in previous cycles as banks keep deposit rates depressed.
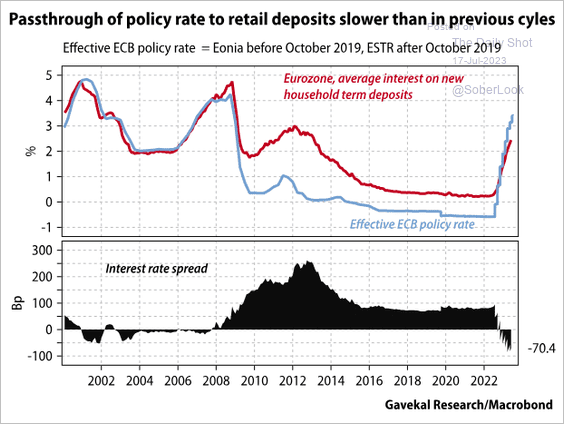 Source: Gavekal Research
5. Gains in the euro this month have been mostly driven by the US dollar’s weakness.
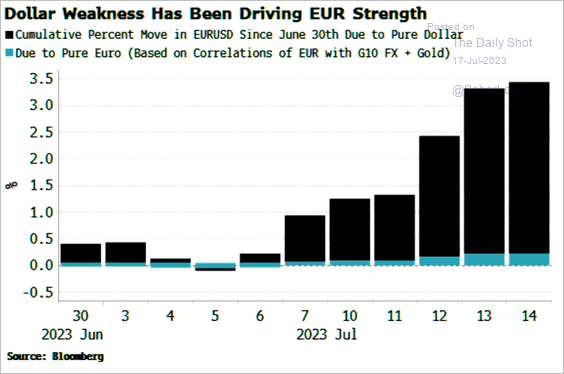 Source: Simon White, Bloomberg Markets Live Blog
Back to Index
Europe
1. Sweden’s June CPI print surprised to the upside.
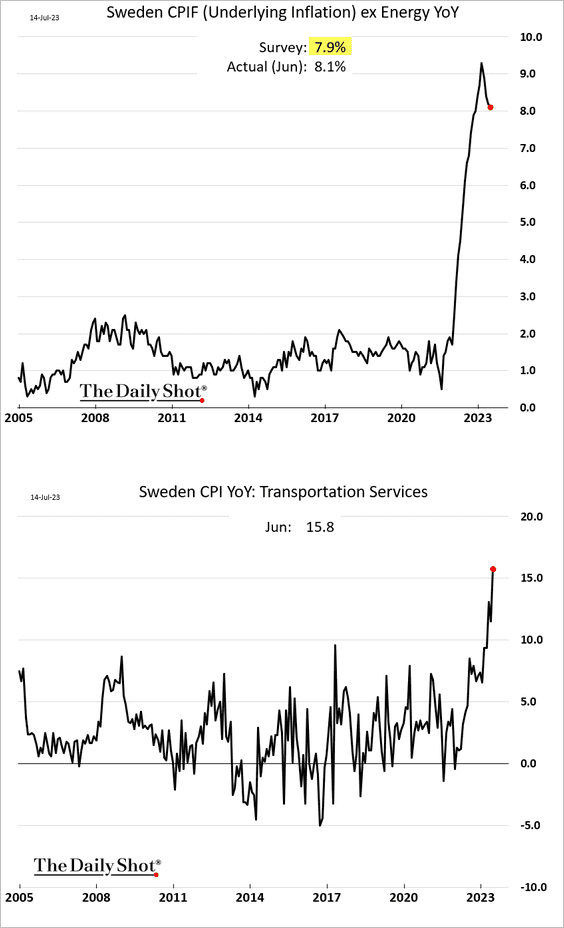
 Source: BBC Read full article
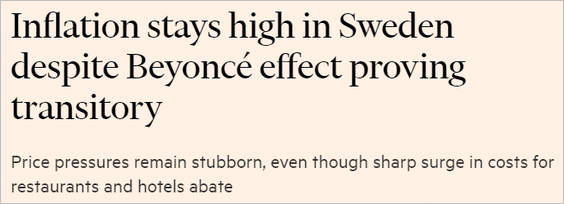 Source: @financialtimes Read full article
Here is a forecast from Nordea and Riksbank.
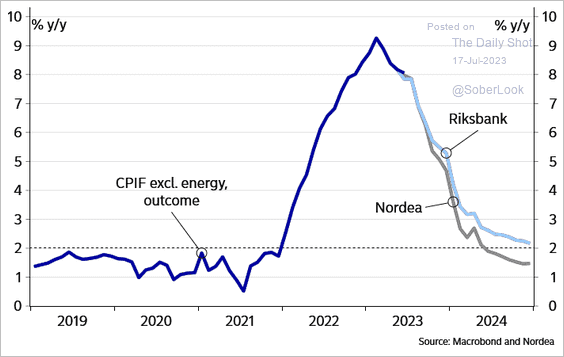 Source: Nordea Markets
——————–
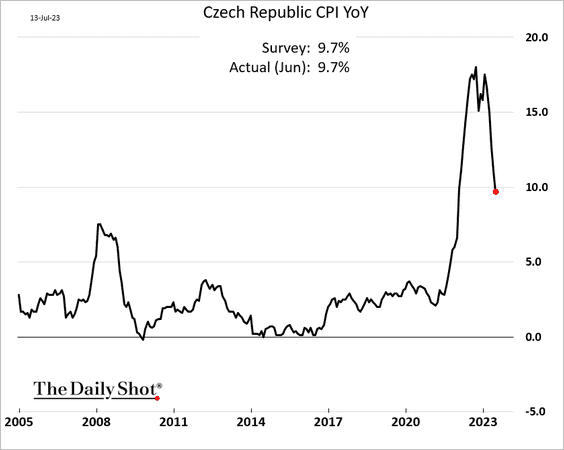
2. Czech inflation is moderating.
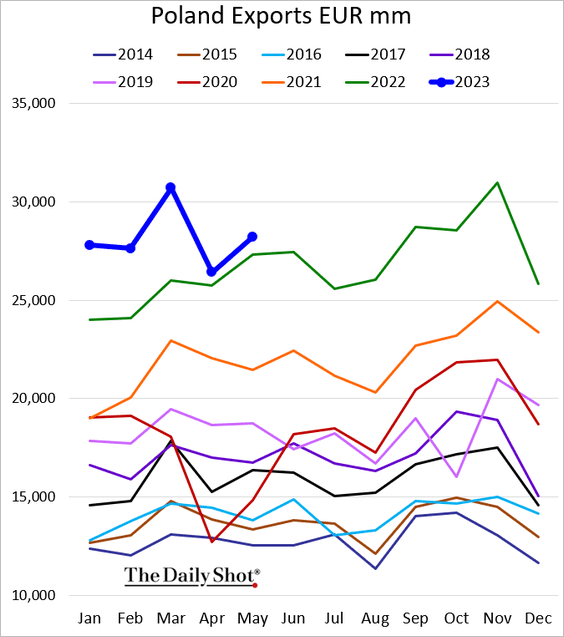
3. Poland’s exports remain above last year’s levels.
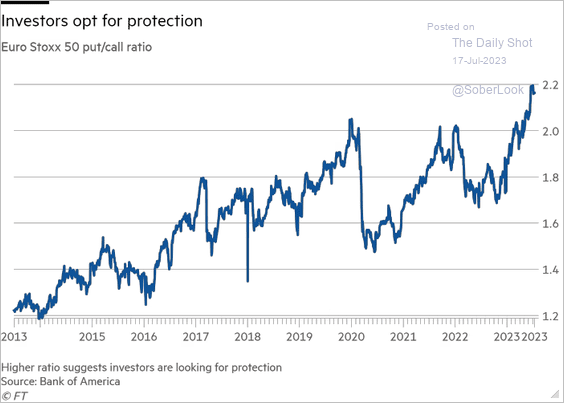
4. Stock traders have been increasingly cautious, with the put/call ratio hitting a new high.
 Source: @financialtimes Read full article
Back to Index
Japan
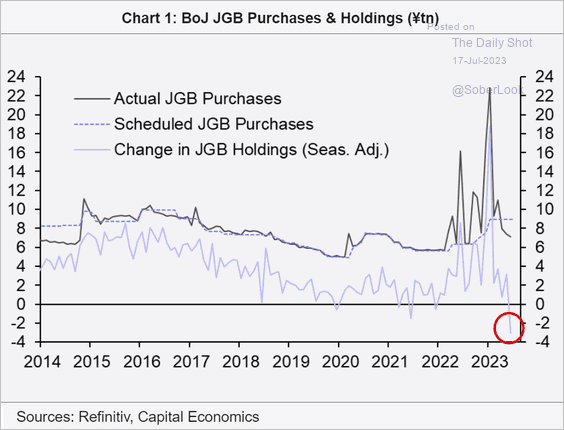
1. The BoJ’s JGB holdings declined sharply over the past month.
 Source: Capital Economics
2. Japanese electric appliance stocks have traded in line with the Nasdaq 100 this year.
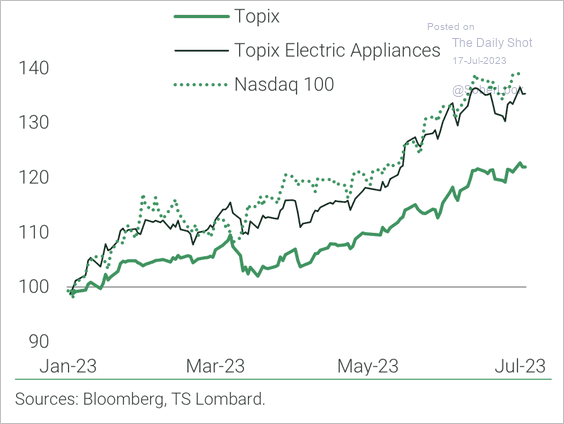 Source: TS Lombard
• The MSCI Japan Index appears overbought in the near term. Although, prices can remain overbought for some time in an uptrend, typically limiting pullbacks.
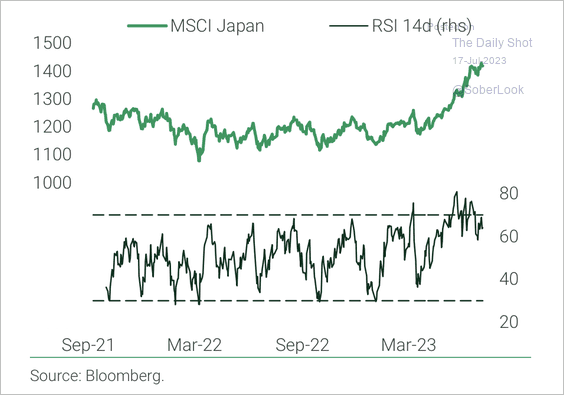 Source: TS Lombard
——————–
3. Here is the attribution of the yen’s gains this month.
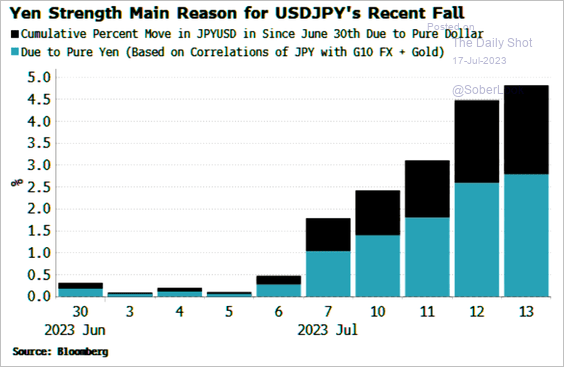 Source: Simon White, Bloomberg Markets Live Blog
Back to Index
China
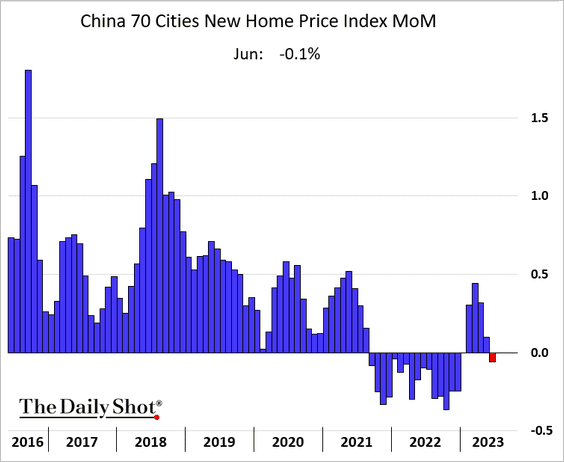
1. New home prices are falling again.
2. Bank shares appear to have stabilized.
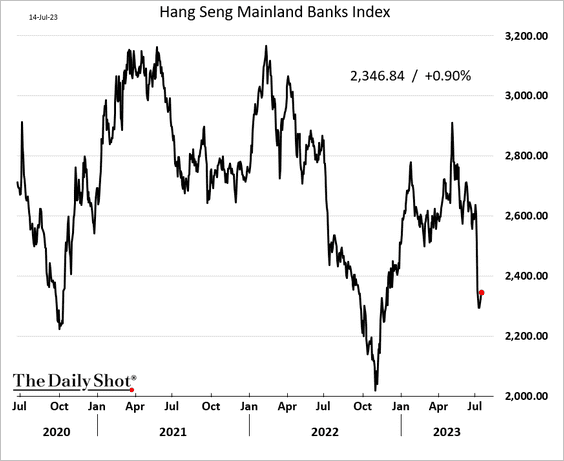 h/t BofA Global Research
3. Local government debt continues to climb as a share of China’s GDP.
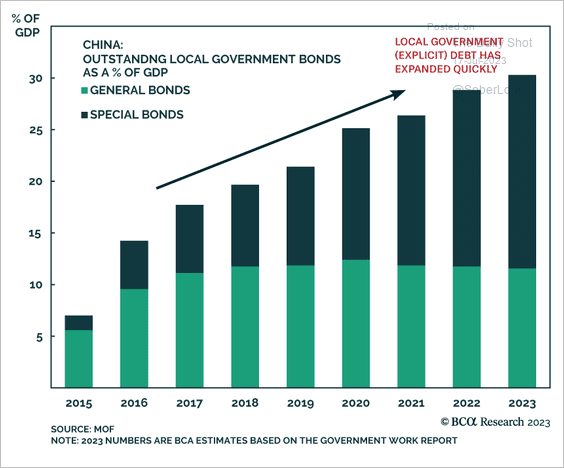 Source: BCA Research
4. The credit impulse is back in negative territory, according to Alpine Macro.
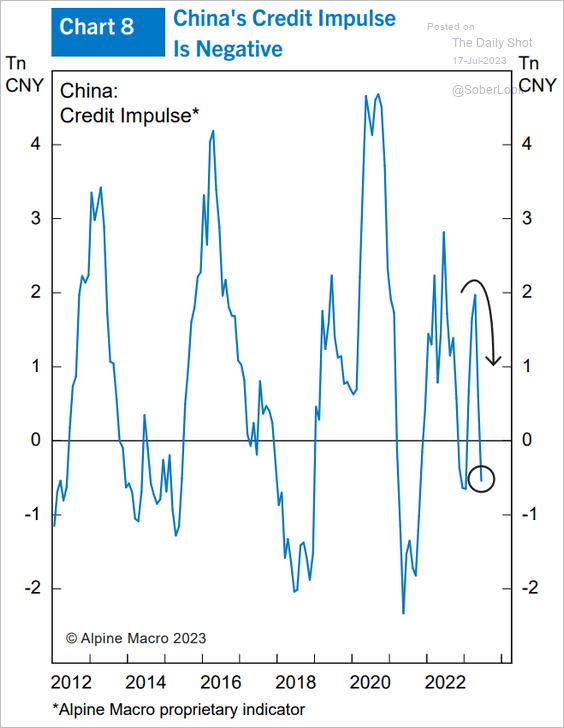 Source: Alpine Macro
Back to Index
Emerging Markets
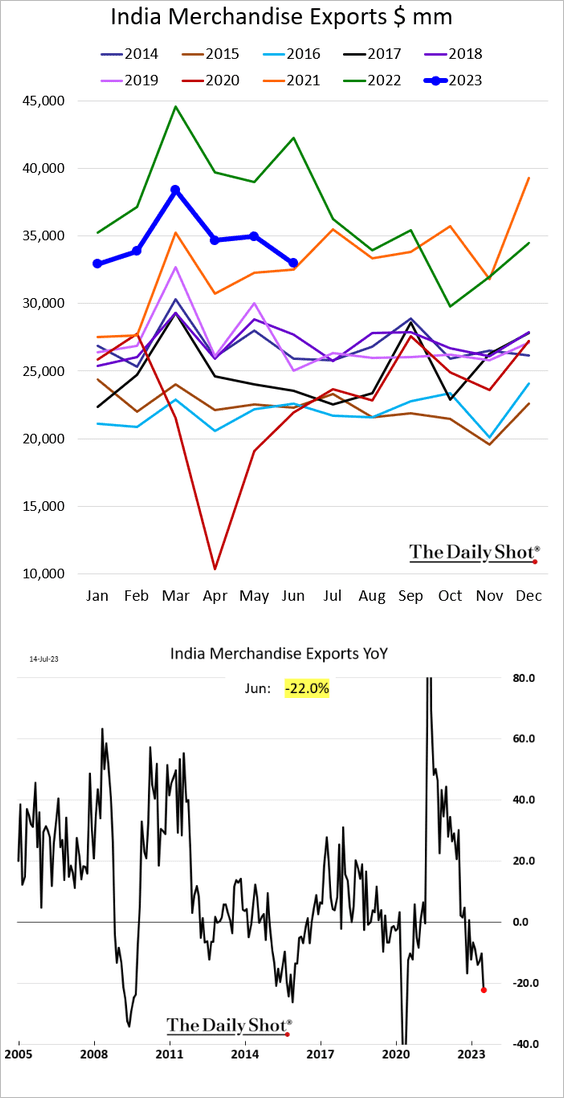
1. India’s wholesale prices continue to fall.
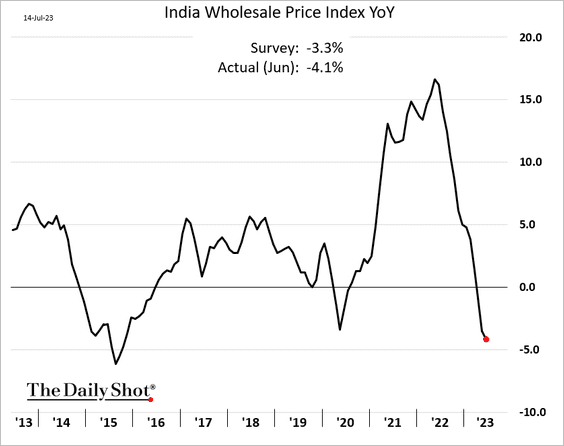
• India’s exports were down 22% year-over-year in June.
——————–
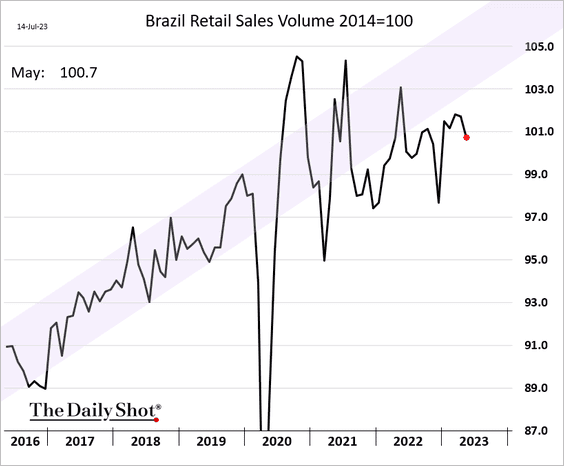
2. Brazil’s retail sales declined in May.
3. This chart shows year-to-date LatAm equity fund flows.
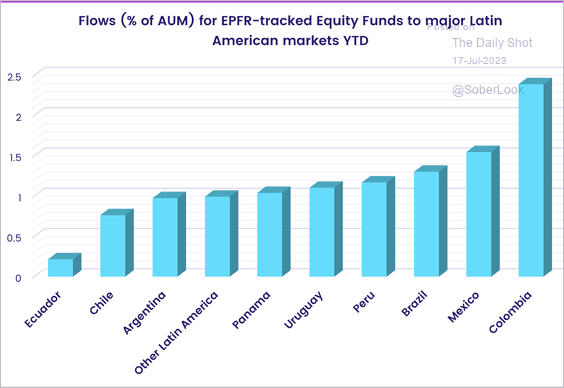 Source: EPFR
4. Ukrainian bounds are starting to recover.
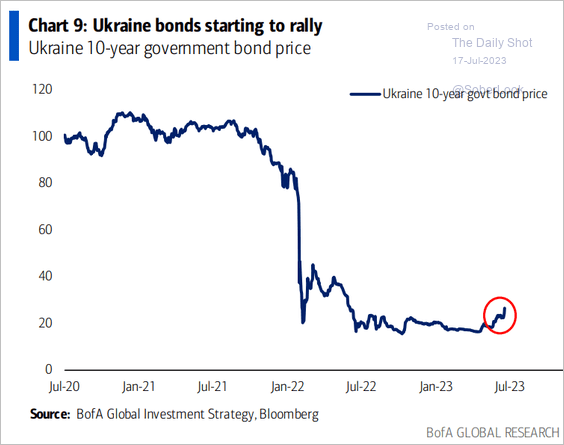 Source: BofA Global Research
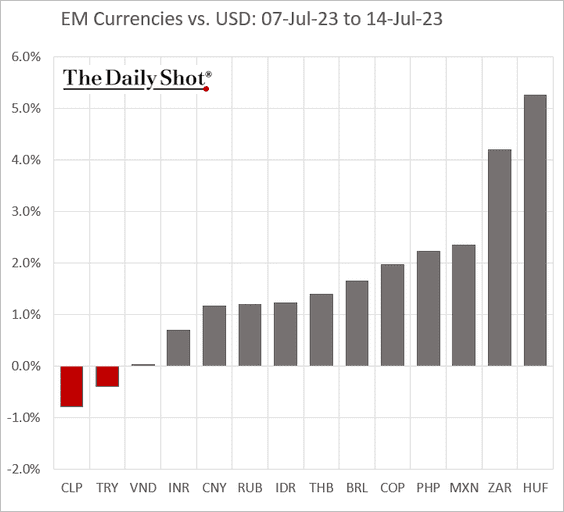
5. Next, we have some performance data from last week.
• Currencies:
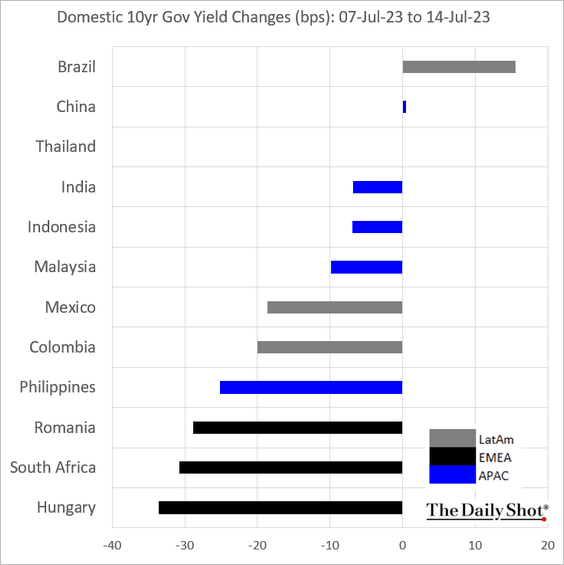
• Bond yields:
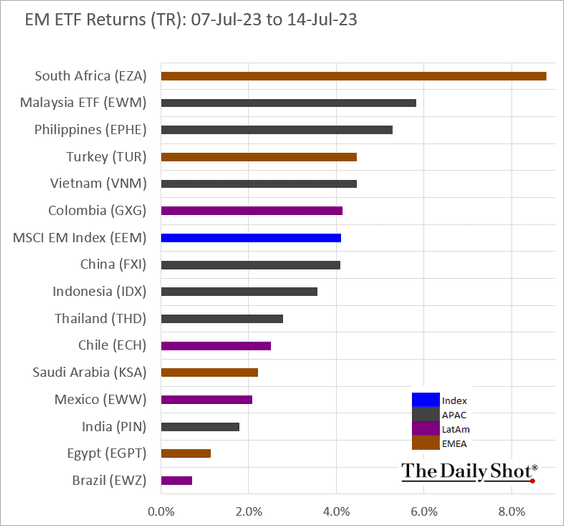
• Equity ETFs:
Back to Index
Cryptocurrency
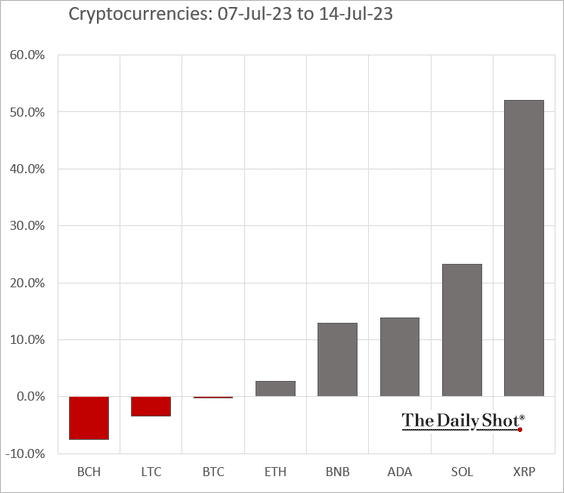
1. XRP was up more than 50% last week.
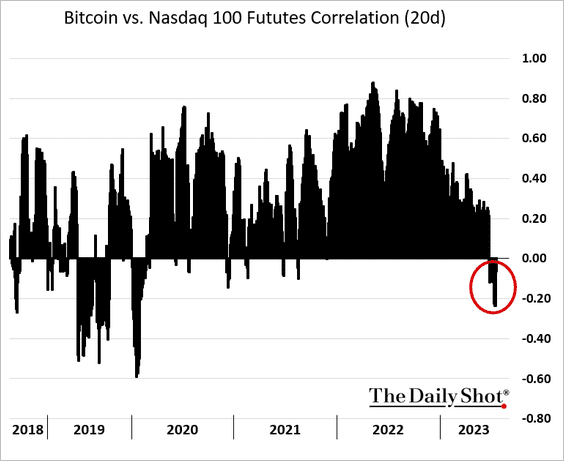
2. Bitcoin’s correlation to growth stocks has turned negative.
Back to Index
Commodities
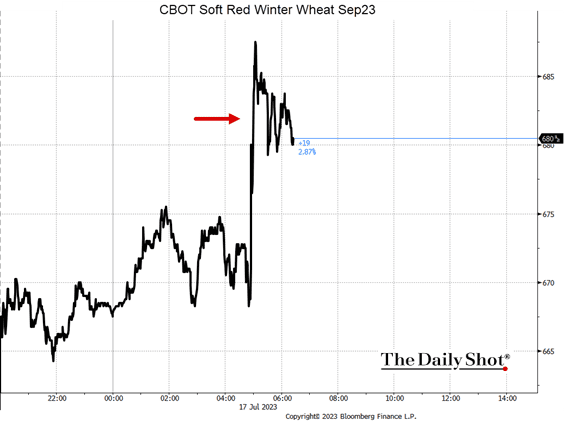
1. Wheat futures jumped this morning as the Ukraine grain export deal collapsed (see story).
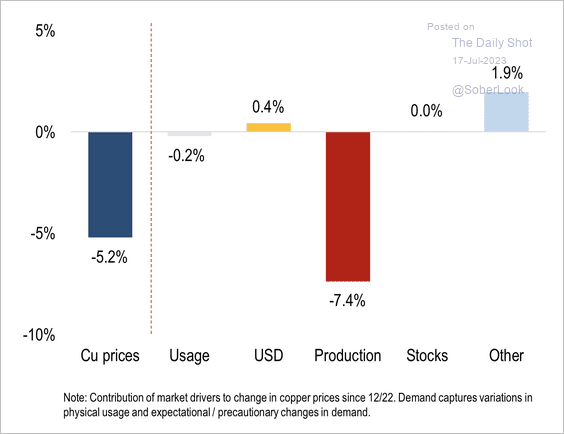
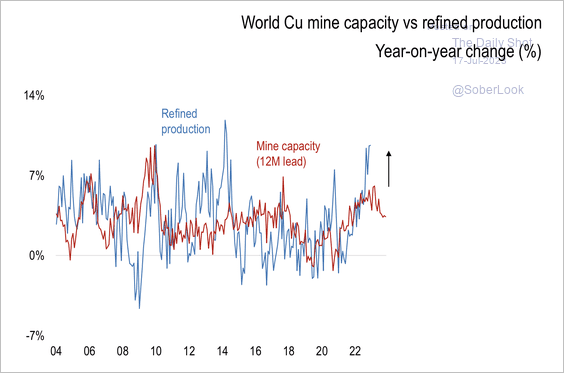
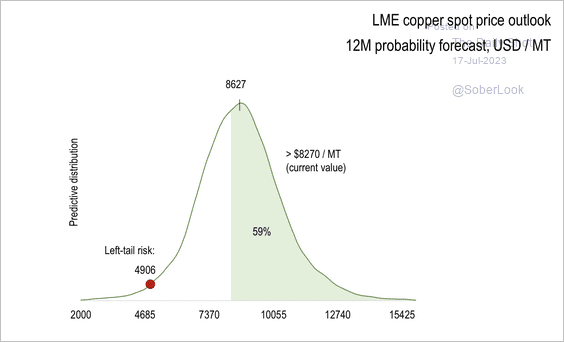
2. Recent copper price weakness has been supply related as ample mine supply fueled refined output. (2 charts)
 Source: Nomura Securities
 Source: Nomura Securities
Numera Analytics expects a rebound in Chinese property construction to boost copper prices.
 Source: Nomura Securities
——————–
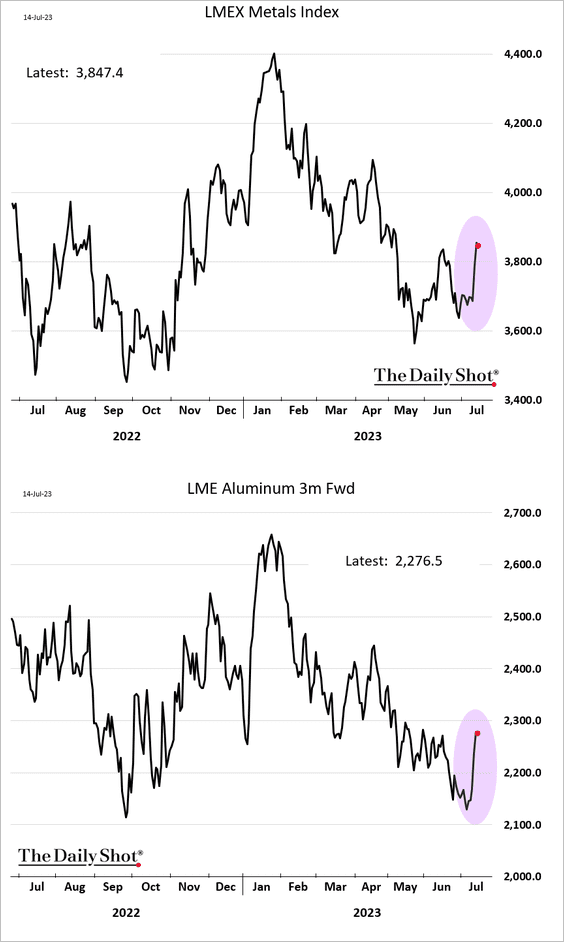
3. Industrial commodities got a boost from the US dollar weakness last week.
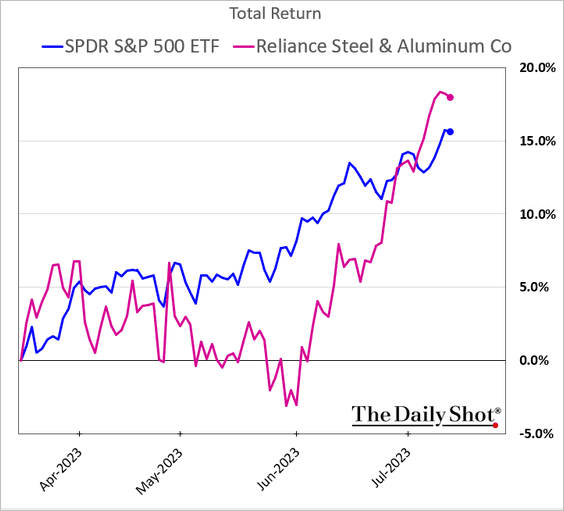
• Some metals equities have been outperforming.
——————–
4. Precious metals also rallied in response to the dollar’s decline.
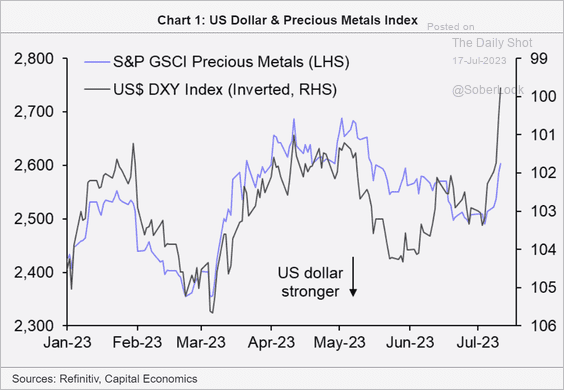 Source: Capital Economics
But precious metals’ fund flows continue to trend lower.
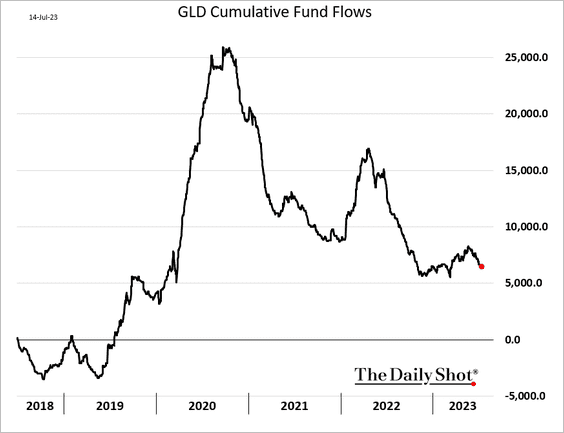
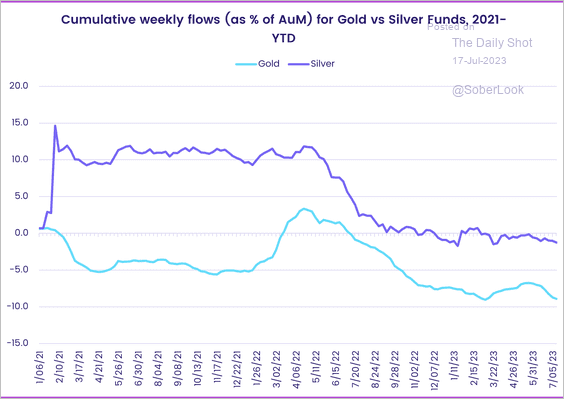 Source: EPFR
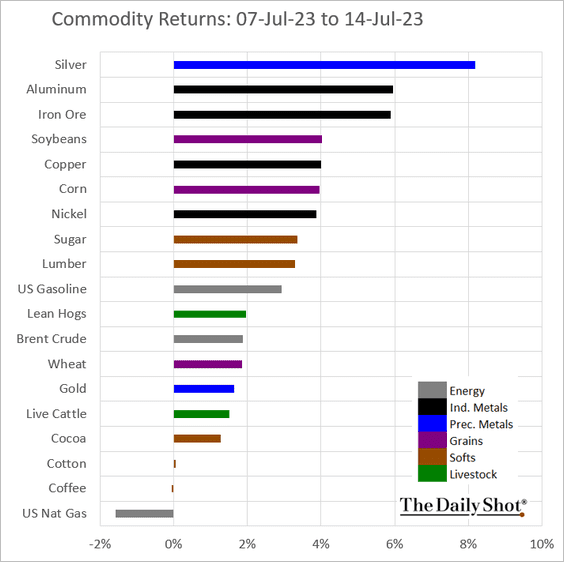
——————–
5. Here is last week’s performance across key commodity markets.
Back to Index
Energy
1. US rig count continues to sink, …
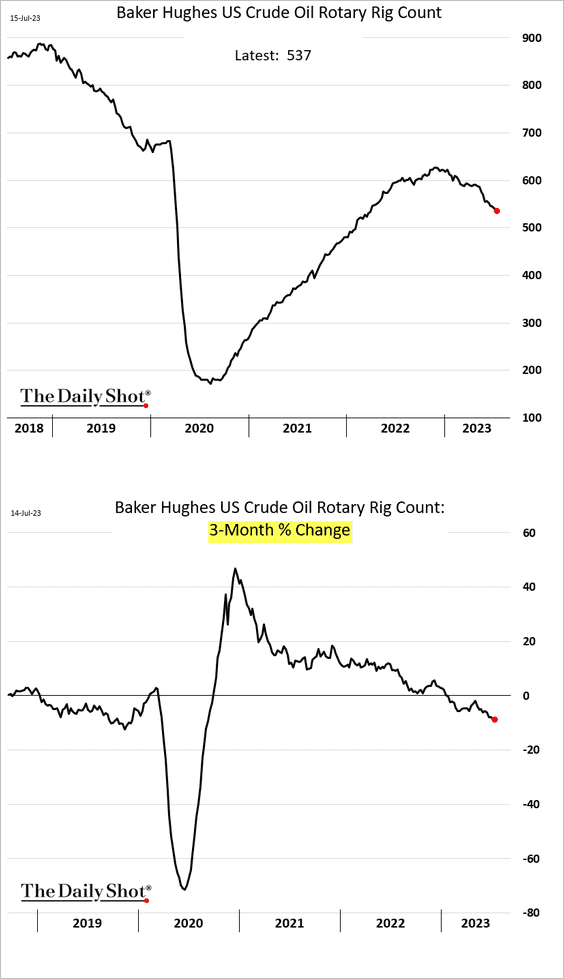
… driven mostly by the Permian region.
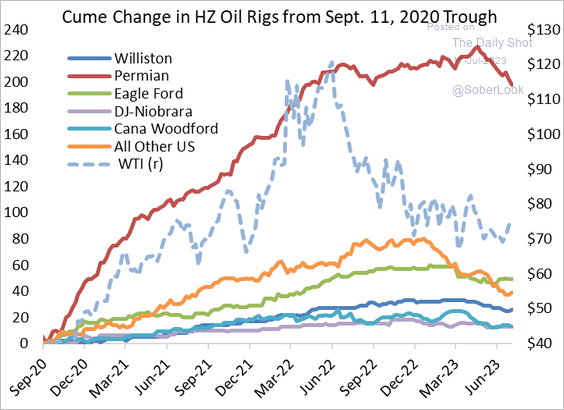 Source: Princeton Energy Advisors
——————–
2. Weak energy prices have weighed on equipment and services firms, although some fundamentals are improving.
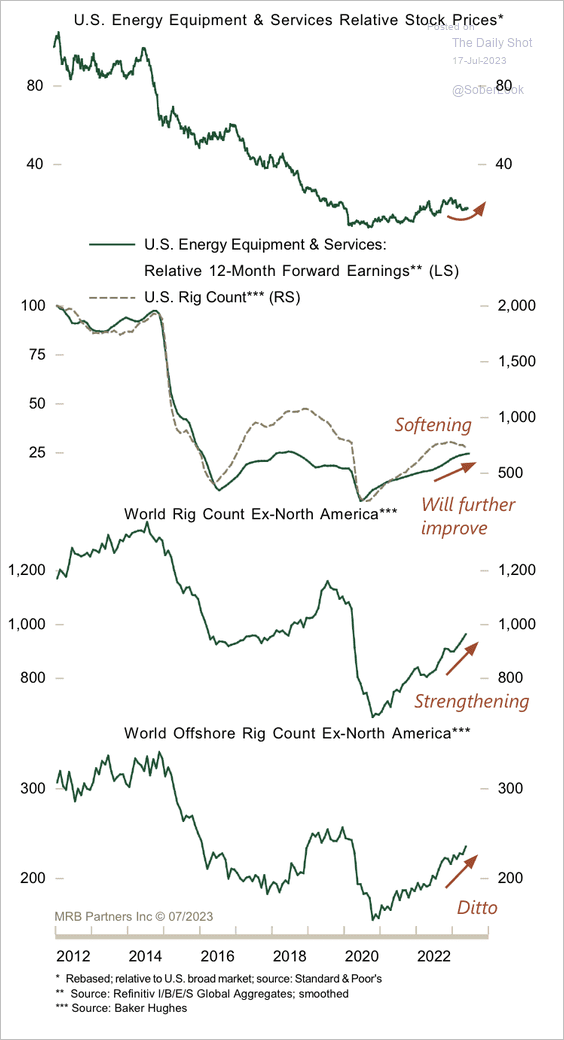 Source: MRB Partners
3. Energy stocks’ relative performance keeps lagging behind crude oil prices.
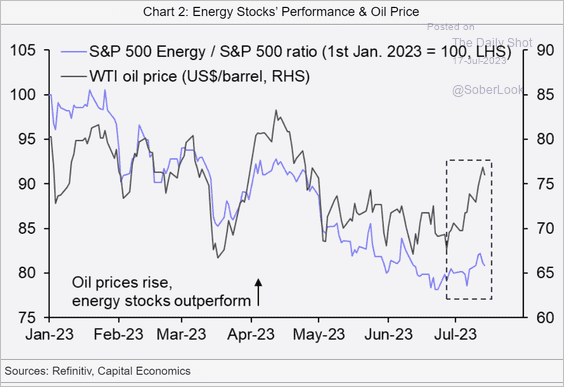 Source: Capital Economics
Back to Index
Equities
1. Deutsche Bank’s positioning index continues to show rising allocations to equities, increasingly driven by discretionary bets.
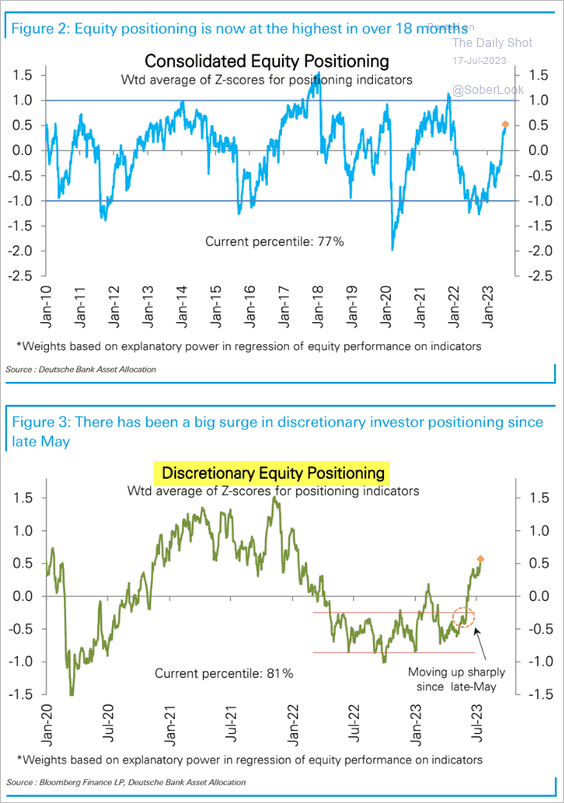 Source: Deutsche Bank Research
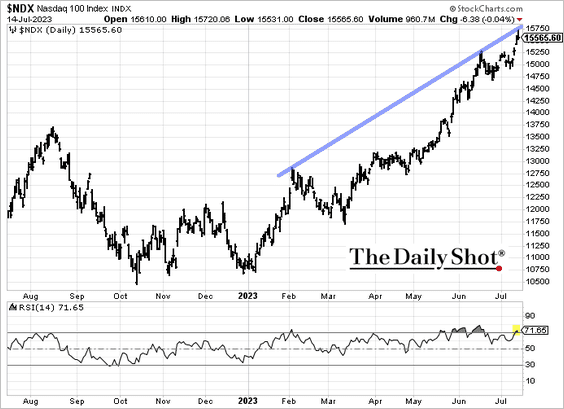
2. Time for a pullback in the Nasdaq 100?
3. Earnings downgrades have stopped.
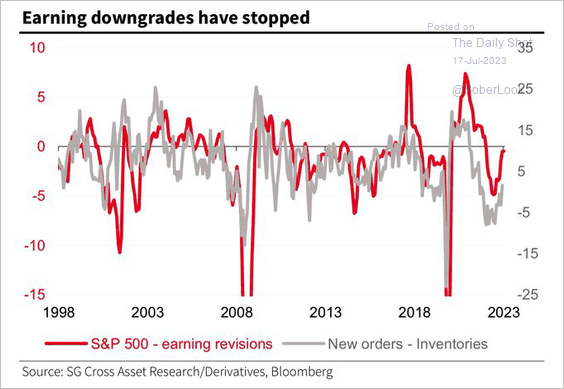 Source: TD Securities; @WallStJesus
4. On average, earnings season accounts for a disproportionate amount of the annual S&P 500 price performance.
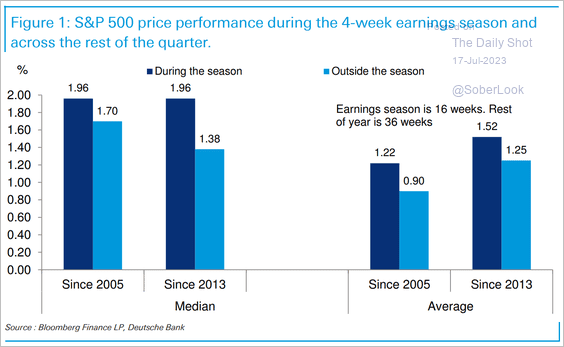 Source: Deutsche Bank Research
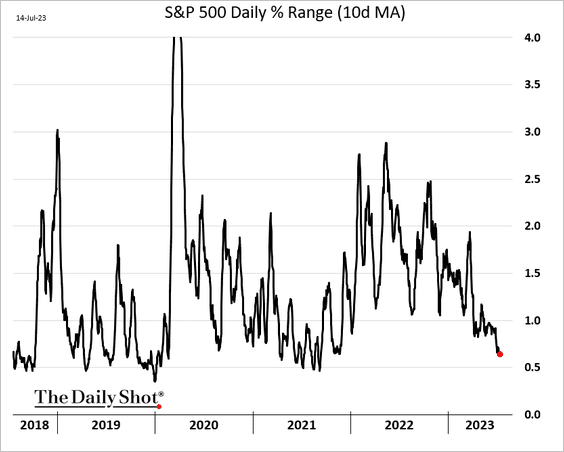
5. Intradeay volatility has been moving lower.
• Volatility is expected to rebound next year.
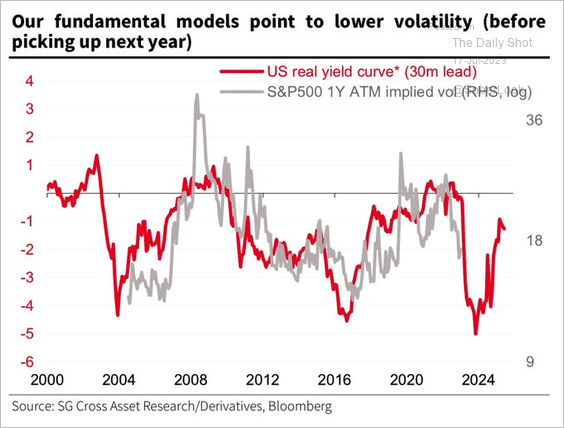 Source: SG Markets Cross Asset Research; @WallStJesus
——————–
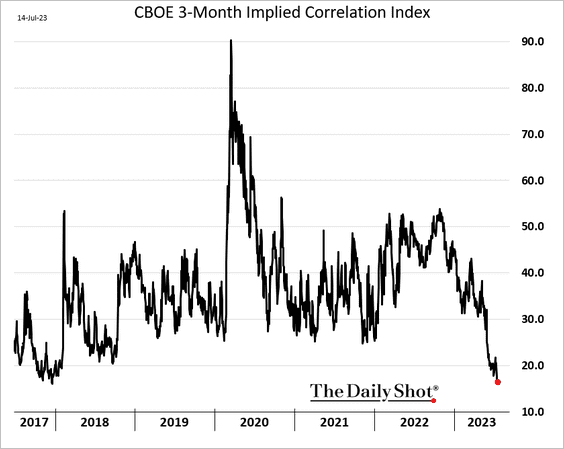
6. Implied equity correlations hit a multi-year low.
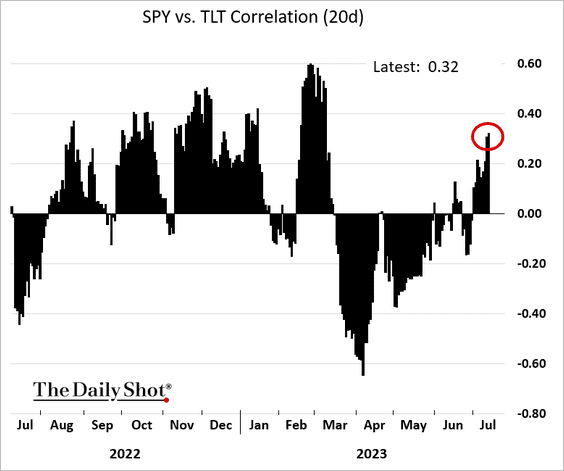
7. Stock/bond correlations continue to move deeper into positive territory.
8. Defensive stocks have been underperforming …
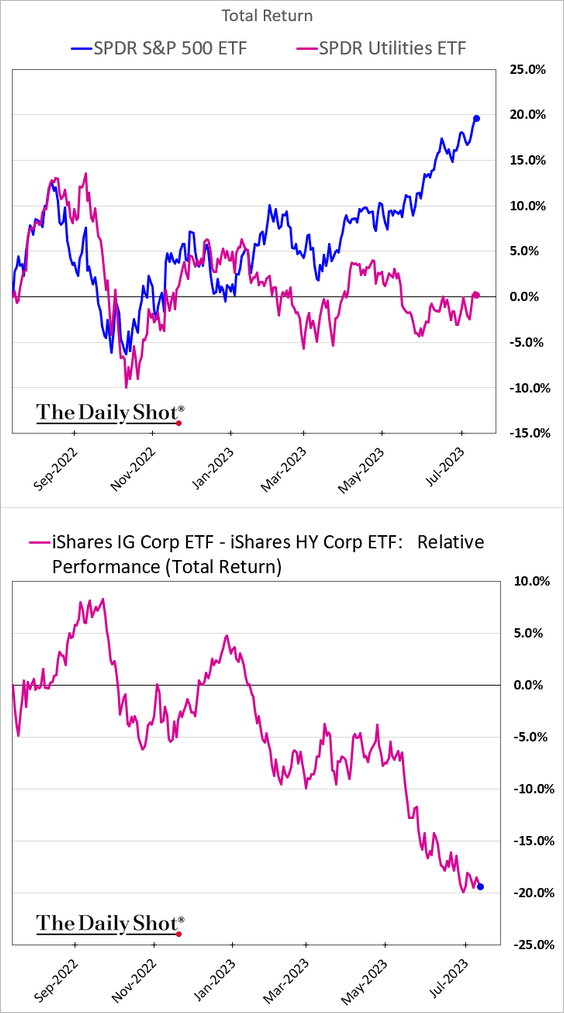
… amid fund outflows.
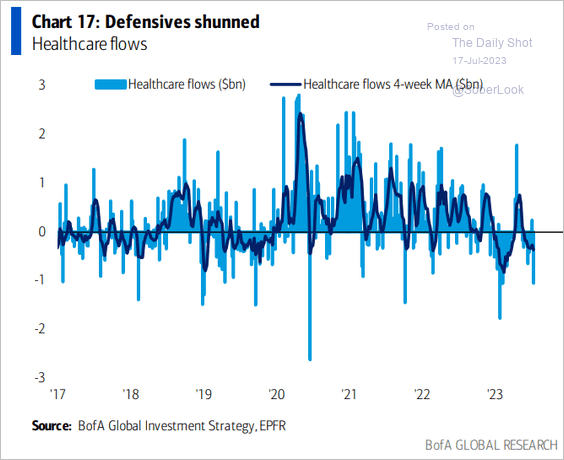 Source: BofA Global Research
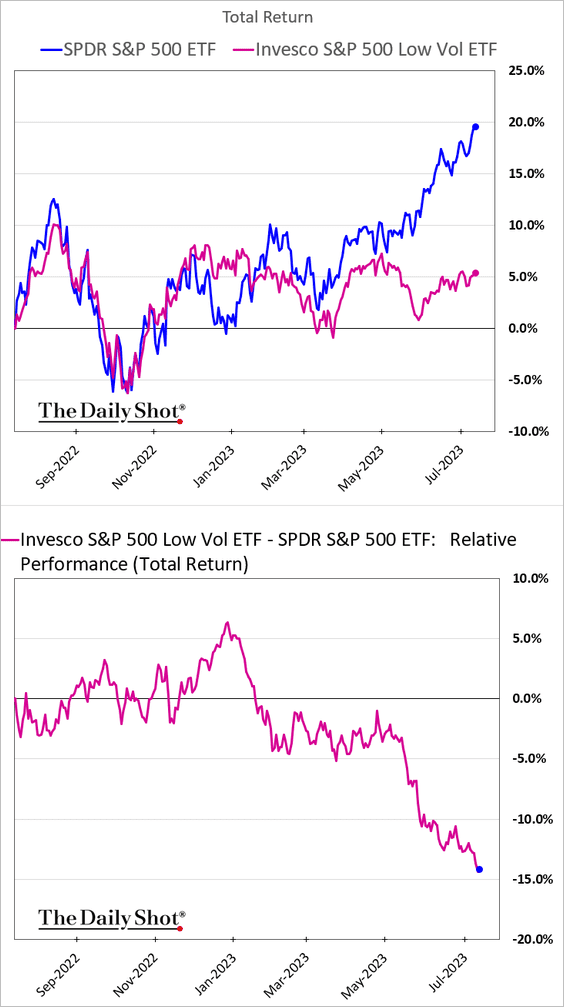
• Low-vol stocks keep lagging.
——————–
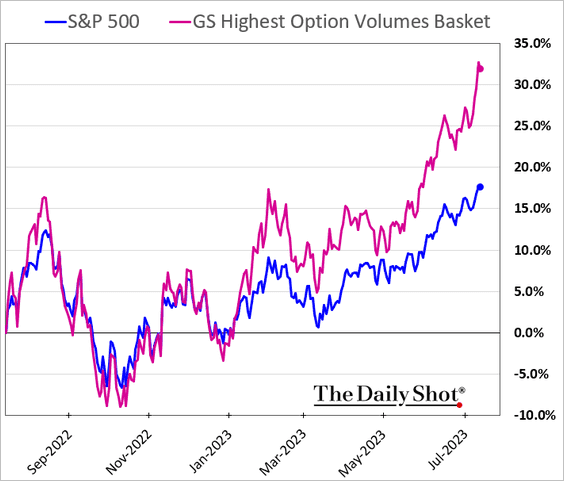
9. Stocks with high options volumes have been widening their outperformance.
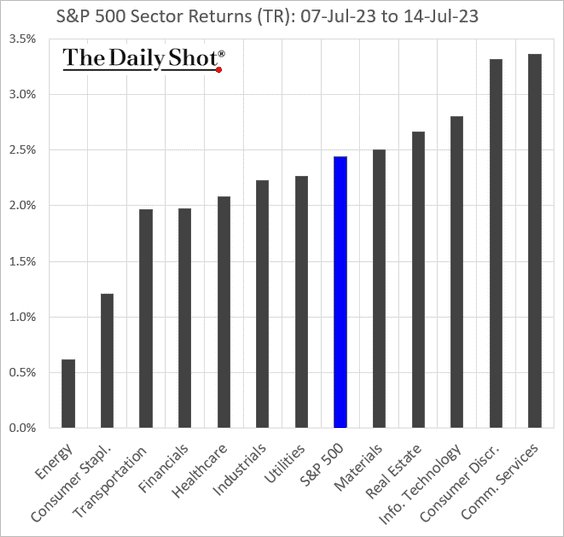
10. Finally, we have some performance data from last week.
• Sectors:
• Equity factors:
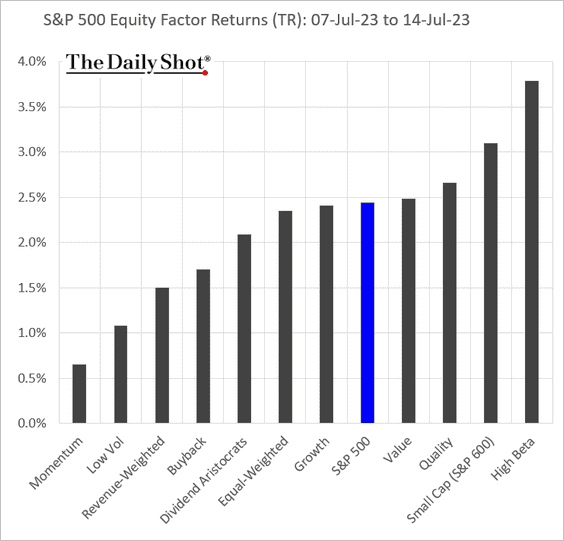
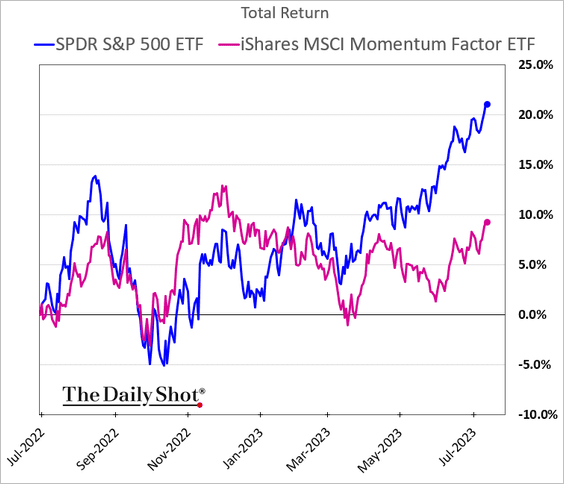
Momentum continues to underperform.
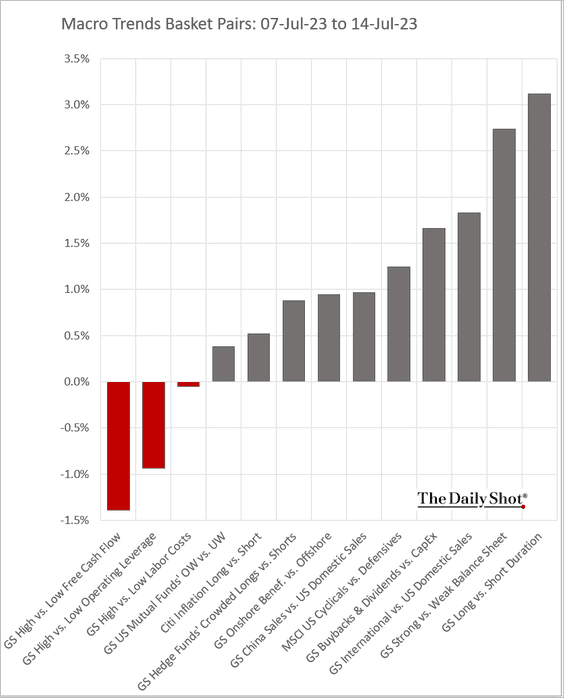
• Macro baskets’ relative performance:
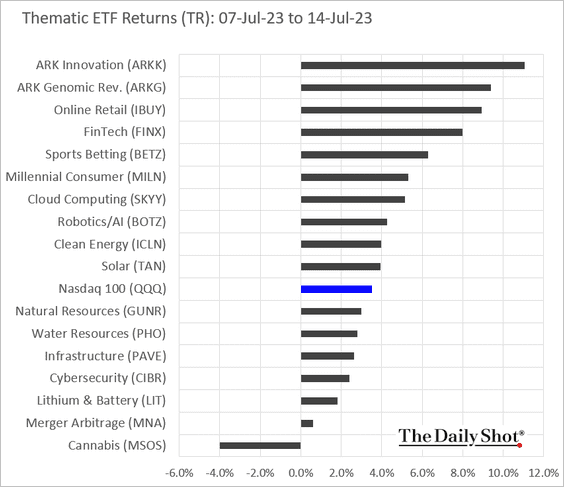
• Thematic ETFs:
• Largest US tech firms:
By the way, tech flows remain positive.
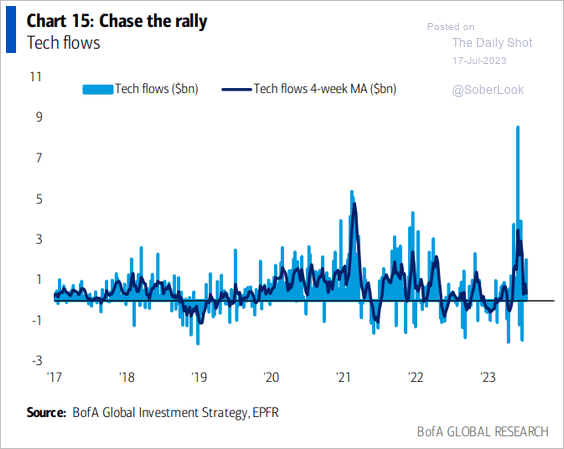 Source: BofA Global Research
Back to Index
Credit
1. Corporate spreads continue to tighten.
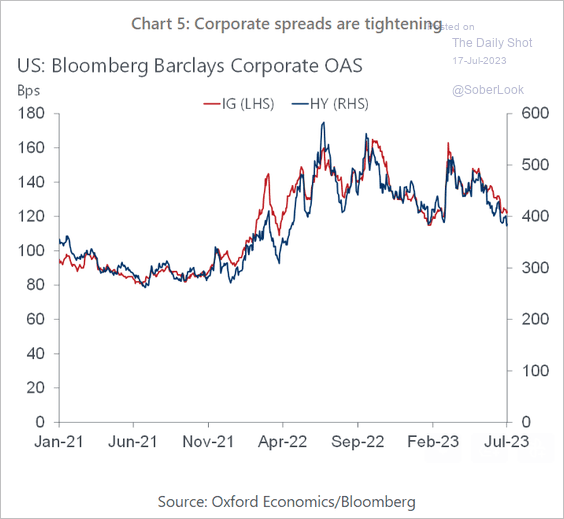 Source: Oxford Economics
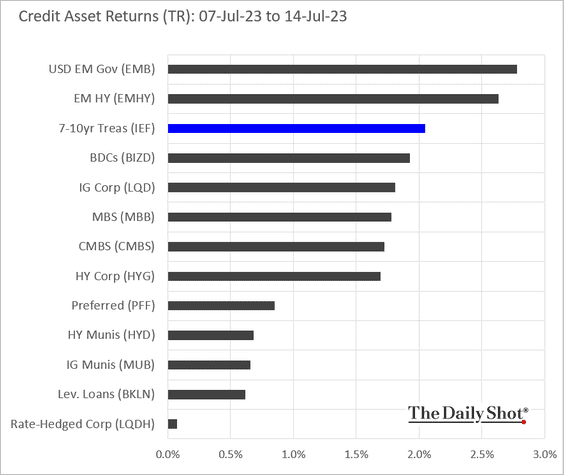
2. Here is last week’s performance by asset class.
Back to Index
Global Developments
1. This chart shows consumer inflation across G7 economies.
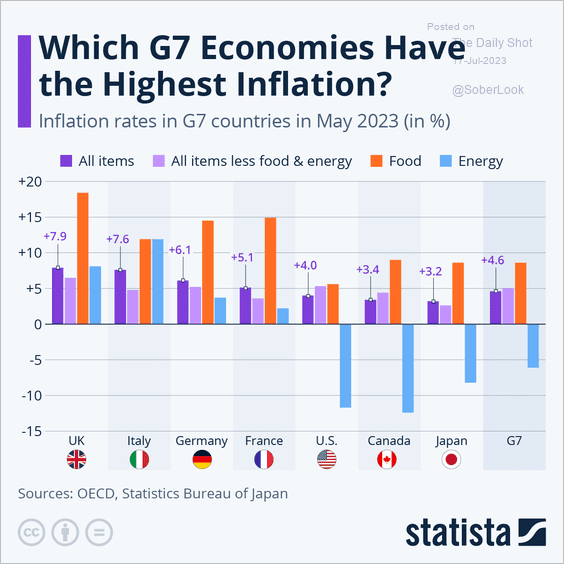 Source: Statista
2. Which regions will drive growth in global automobile sales?
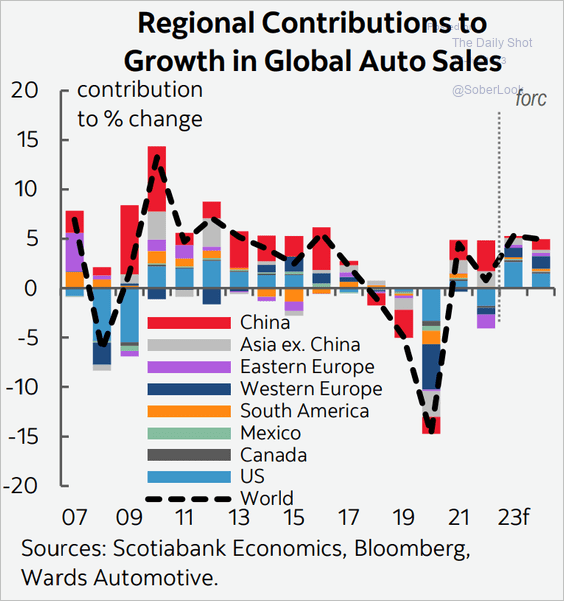 Source: Scotiabank Economics
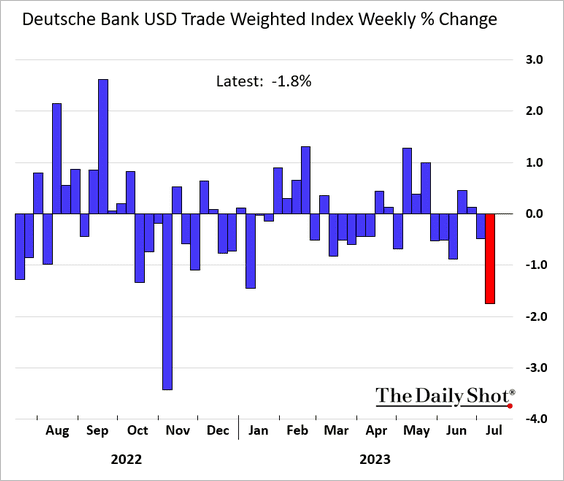
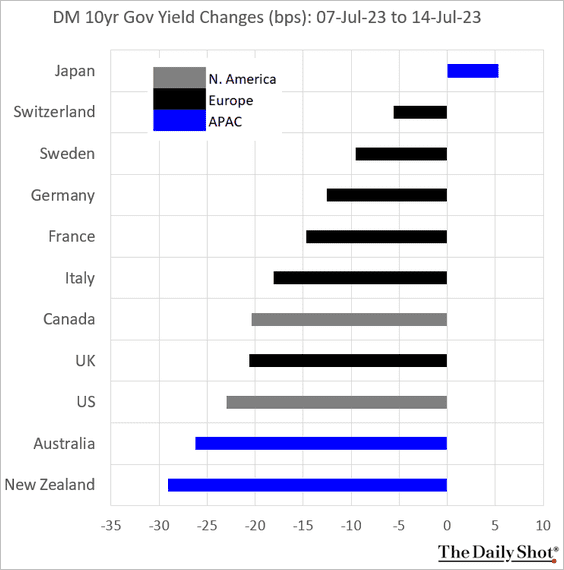
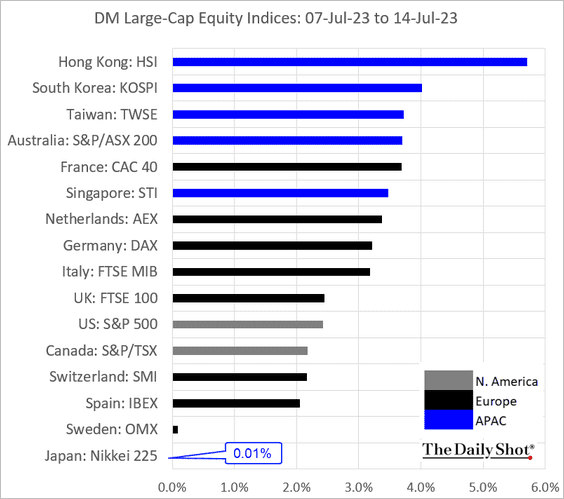
3. Here is last week’s performance for advanced economies.
• Currency indices:
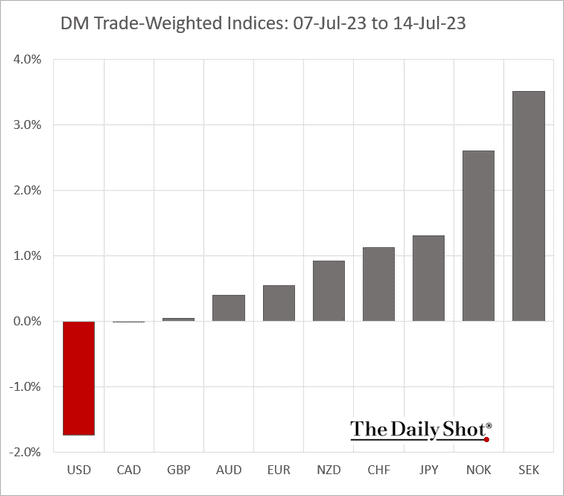
It was a rough week for the US dollar.
• Bond yields:
• Large-cap equity indices:
——————–
Food for Thought
1. The luxury watch market (a classic bubble):
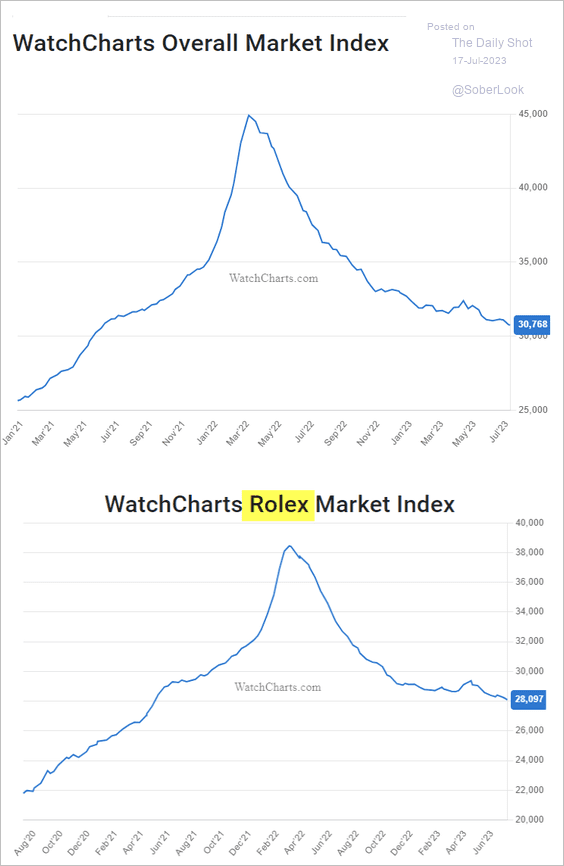 Source: WatchEnthusiasts
2. AB InBev global sales:
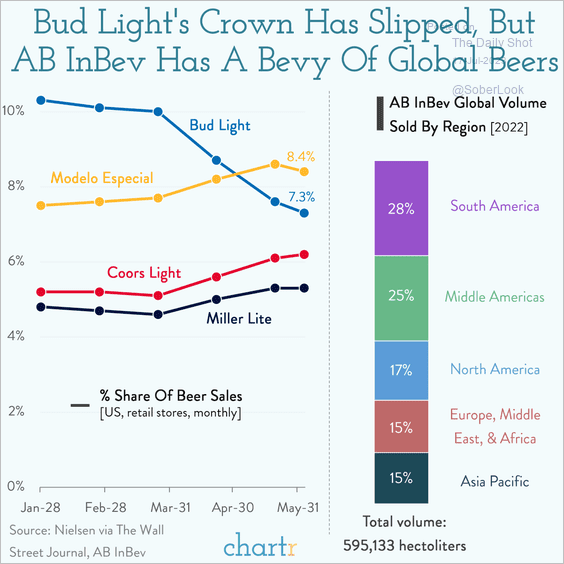 Source: @chartrdaily
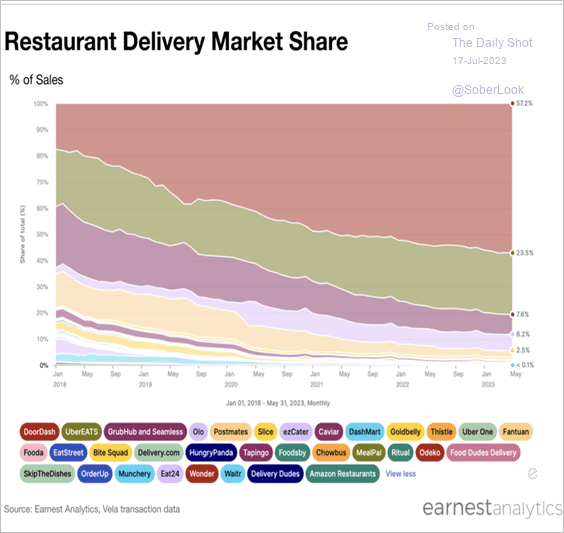
3. Restaurant delivery market share:
 \
\
4. US federal government’s interest costs:
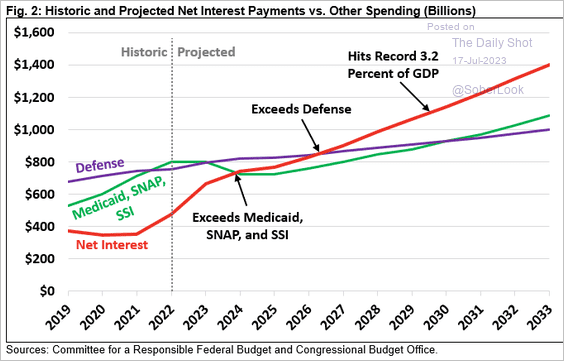 Source: Committee for a Responsible Federal Budget
5. Private-school students as a share of undergraduate enrollments:
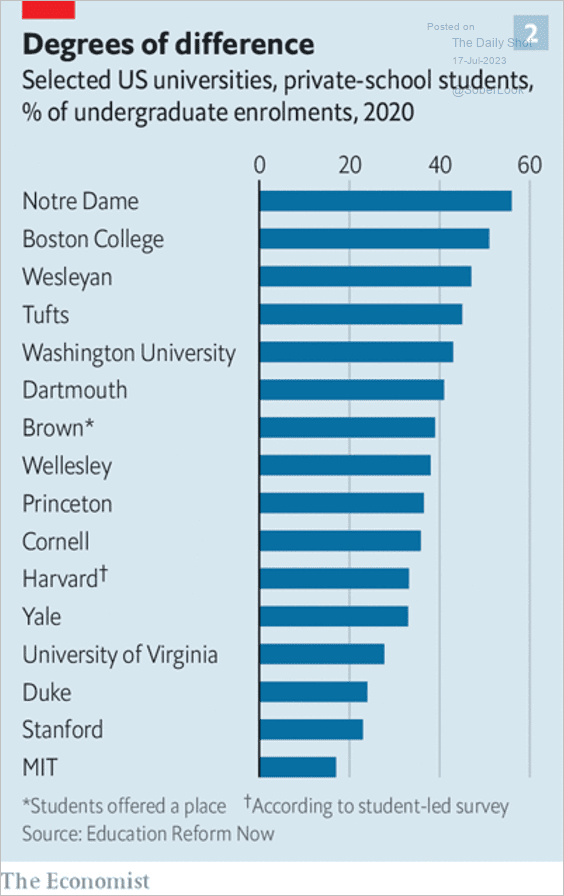 Source: The Economist Read full article
6. GOP presidential nomination probabilities in the betting markets:
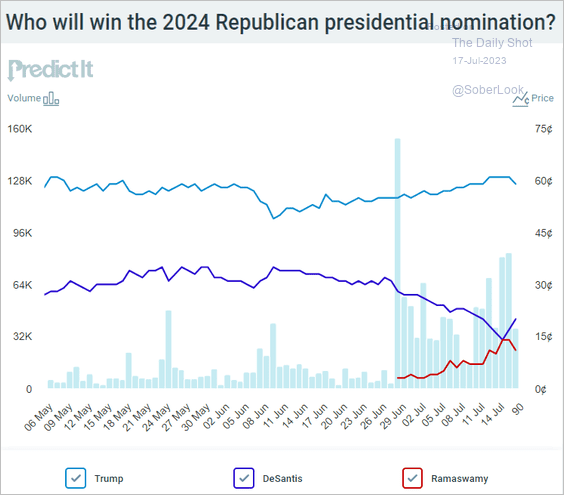 Source: @PredictIt
7. Electricians’ wage growth:
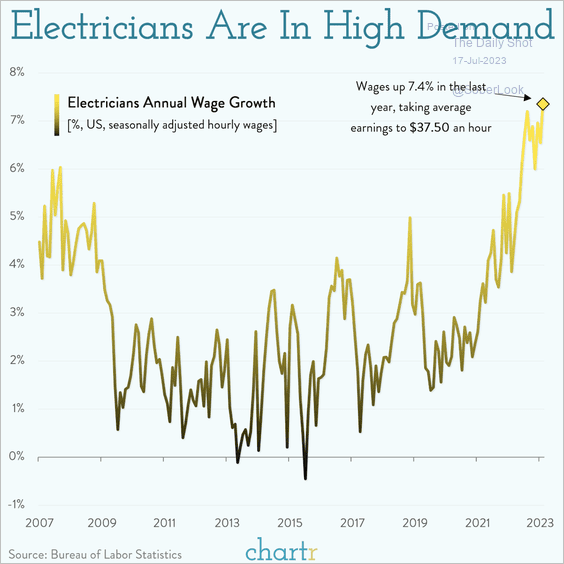 Source: @chartrdaily
8. Places to stream music:
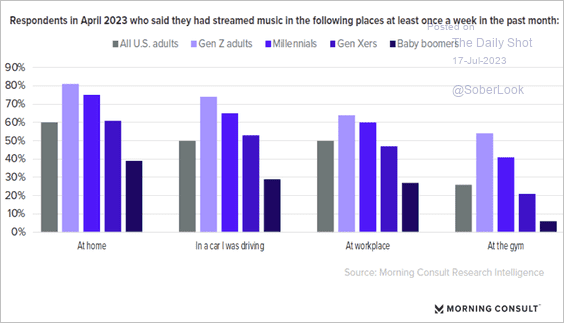 Source: Morning Consult Read full article
——————–
Back to Index