
The Daily Shot: 19-Jul-23
• The United States
• Canada
• The Eurozone
• China
• Emerging Markets
• Commodities
• Equities
• Credit
• Rates
• Global Developments
• Food for Thought
The United States
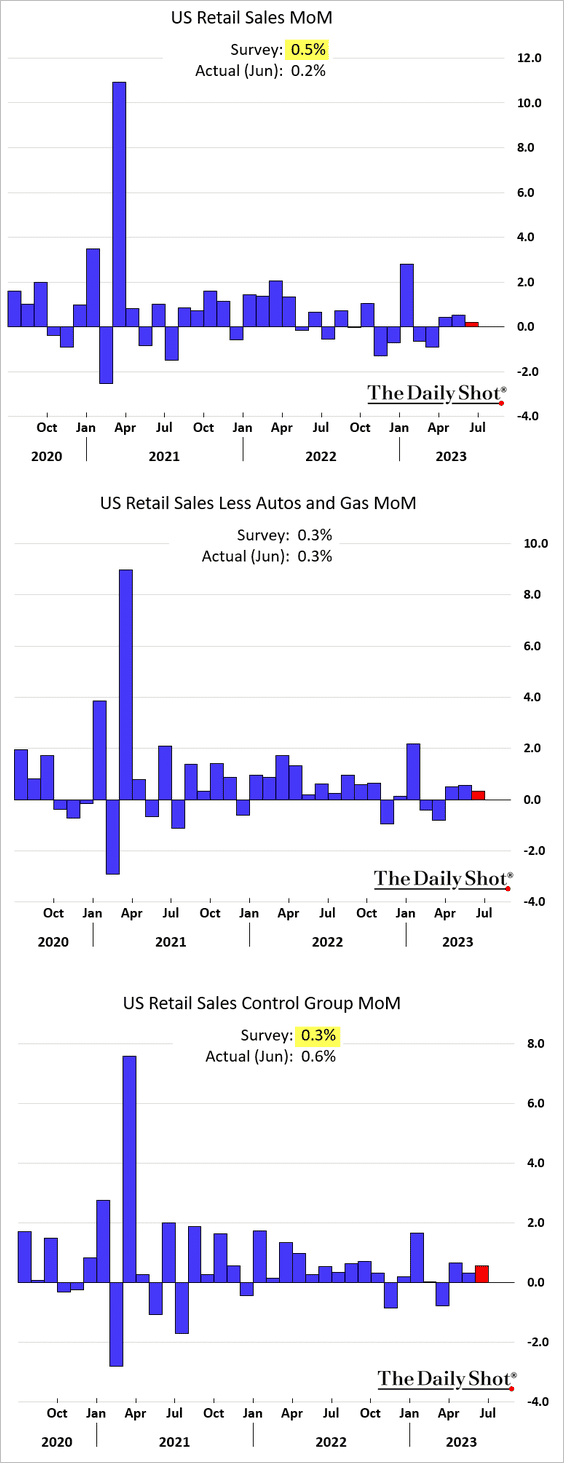
1. The headline retail sales index climbed less than expected in June. However, the “control group” (core retail sales) topped economists’ forecasts (3rd panel).
 Source: Reuters Read full article
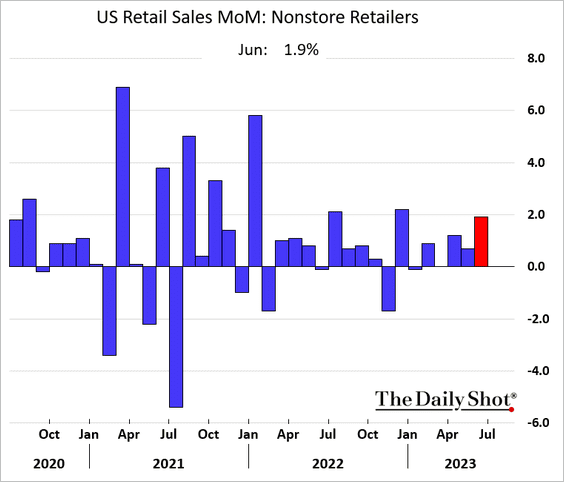
• The control group got a boost from online sales.
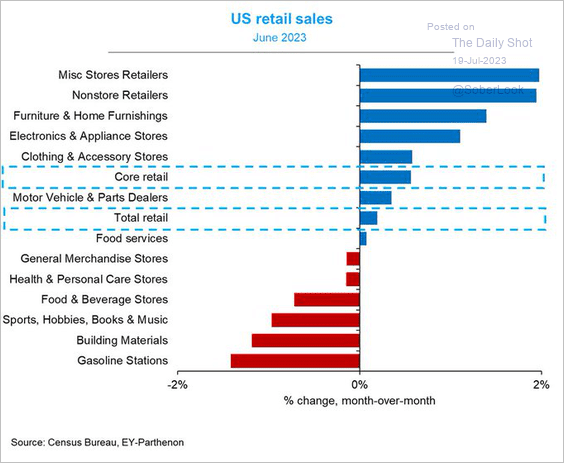
Here is the breakdown by sector.
 Source: @GregDaco
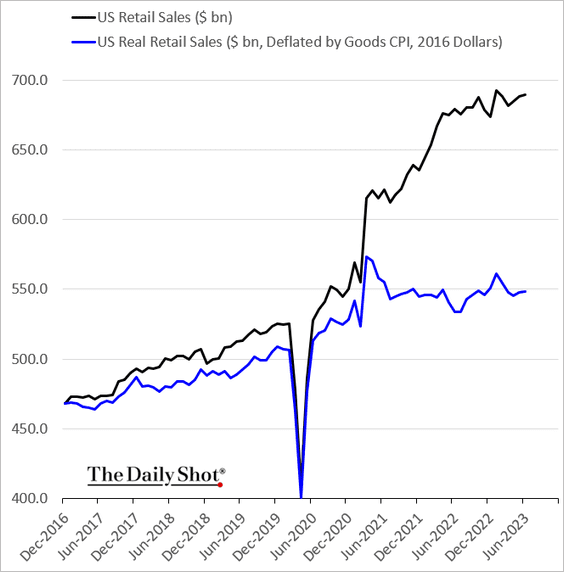
• This chart shows nominal and real retail sales levels.
——————–
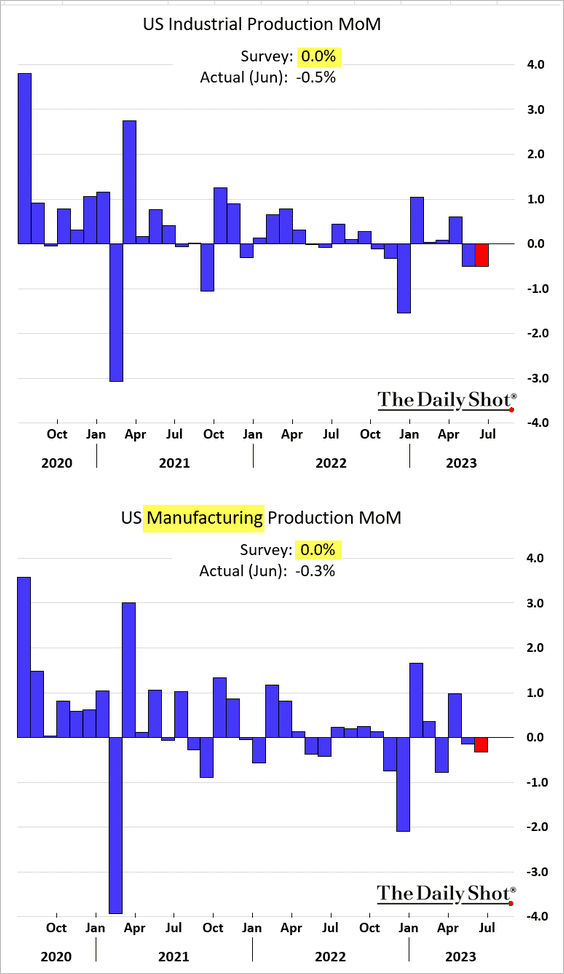
2. Industrial production declined again last month as manufacturing output contracted.
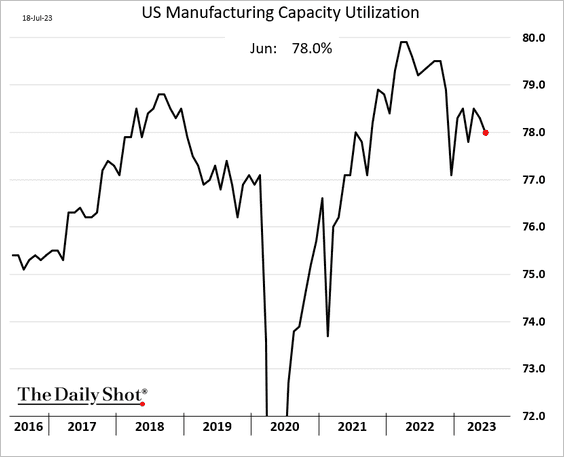
• Here is the capacity utilization.
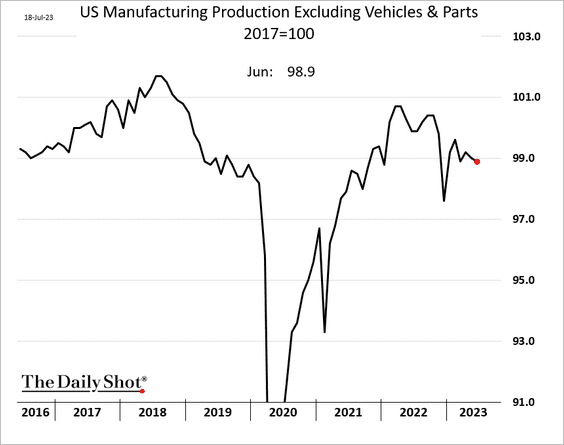
• Excluding automobile production …
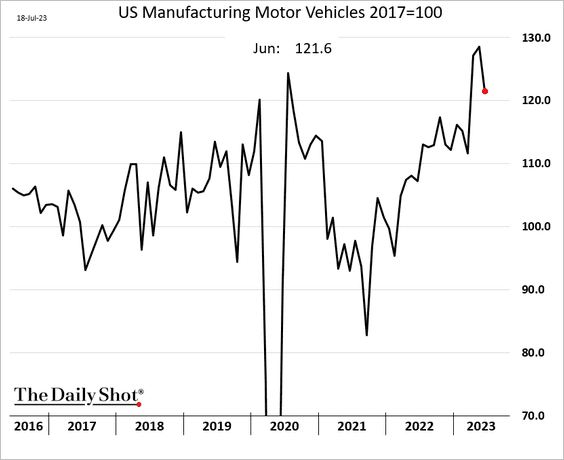
… factory output has been trending lower.
 h/t Pantheon Macroeconomics
——————–
3. The GDPNow Q2 growth estimate is holding above 2% (annualized).
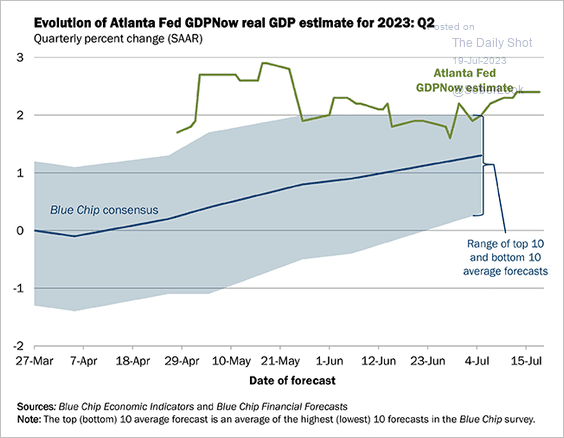 Source: @AtlantaFed Read full article
Here is the attribution.
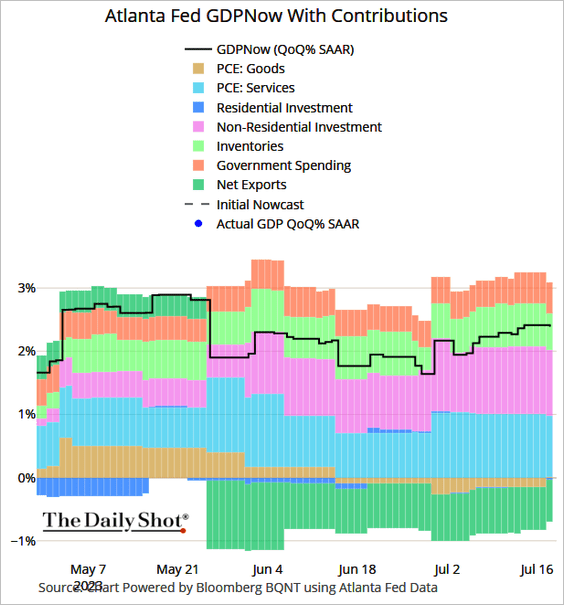 Source: @TheTerminal, Bloomberg Finance L.P.
——————–
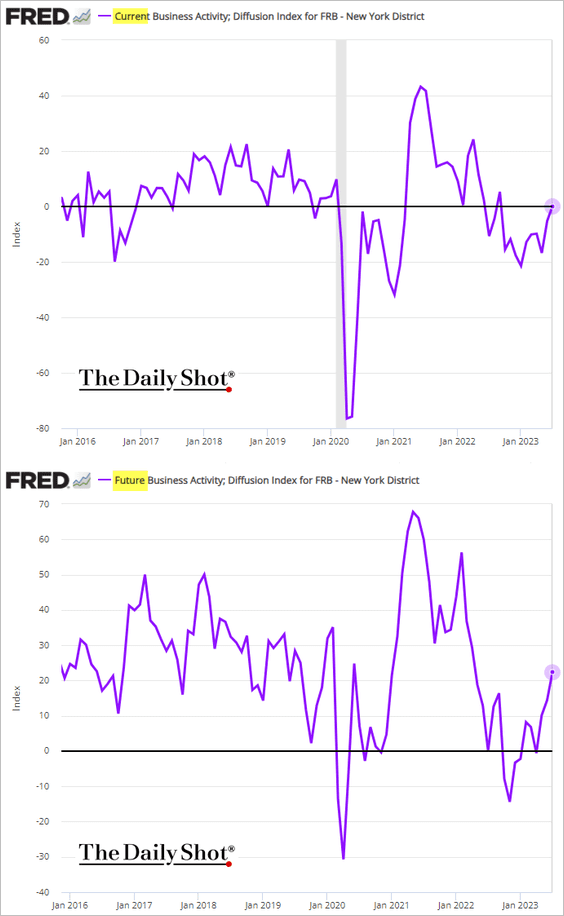
4. The NY Fed’s regional services index shows stabilization in business activity and a more upbeat outlook.
5. Market financial conditions have tightened much less than bank credit tightening would suggest.
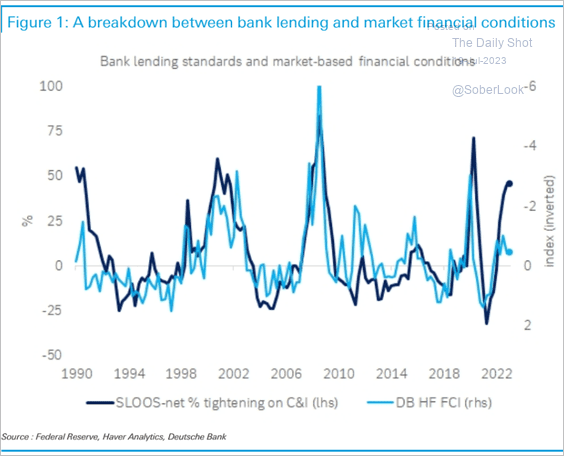 Source: Deutsche Bank Research
6. Business applications remain elevated.
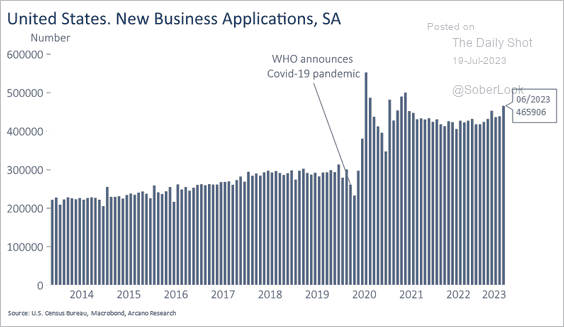 Source: Arcano Economics
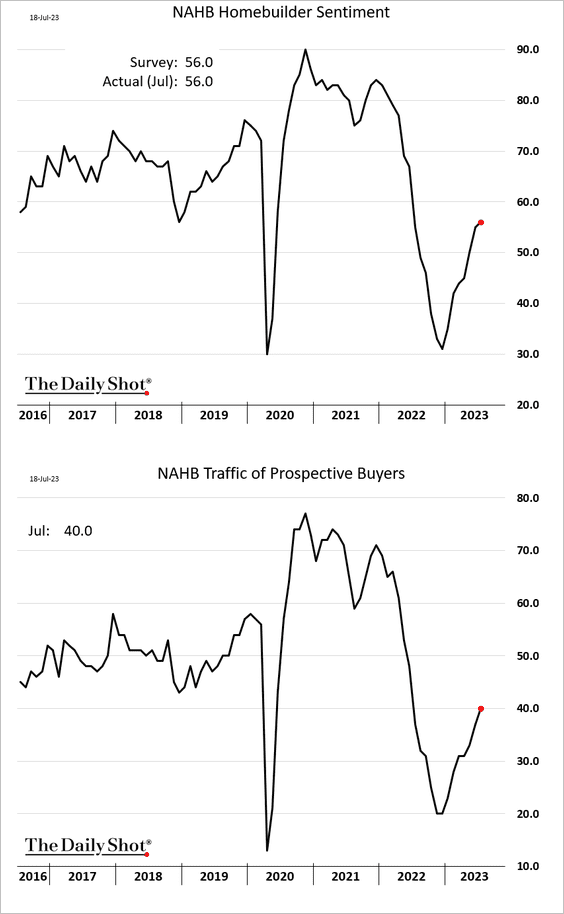
7. Next, we have some updates on the housing market.
• Homebuilder sentiment improved slightly this month.
But weak mortgage applications point to downside risks for residential construction.
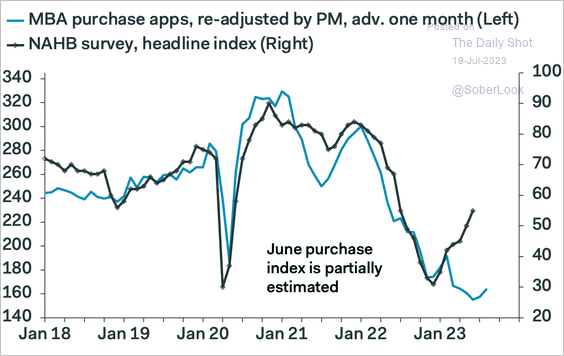 Source: Pantheon Macroeconomics
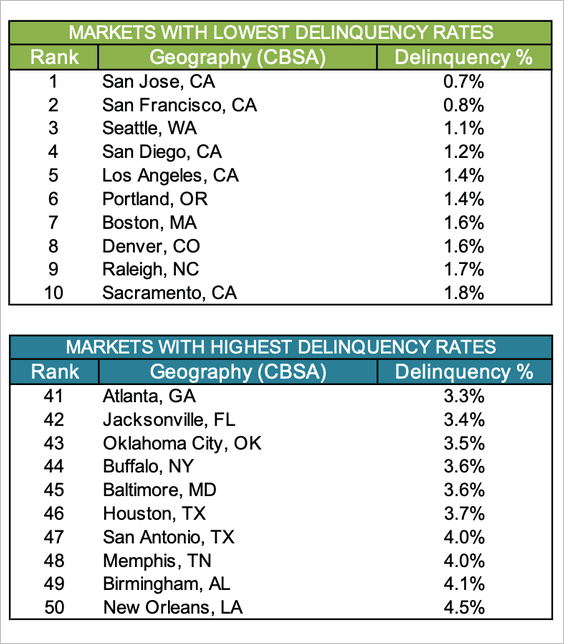
• The national delinquency rate among first-lien mortgages is near record lows.
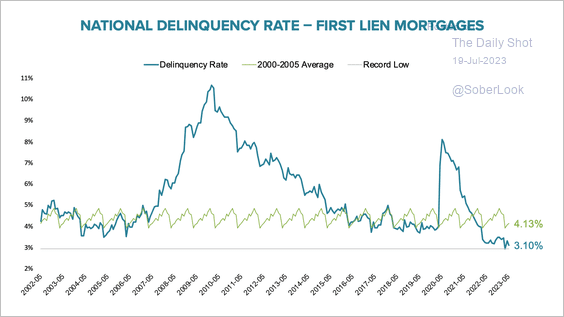 Source: Black Knight
Here is a look at the highest and lowest delinquency rates by metro area.
 Source: Black Knight
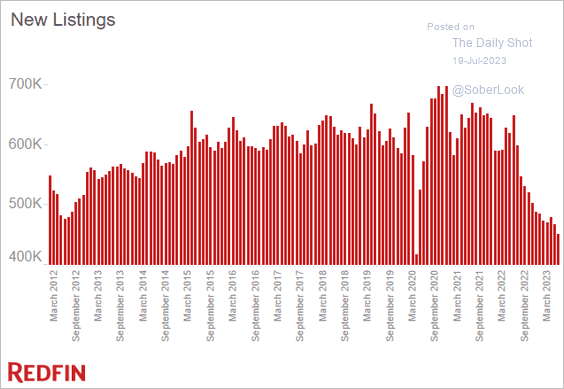
• US housing inventory continues to tighten, with new listings hitting the lowest level since the COVID shock.
 Source: Redfin
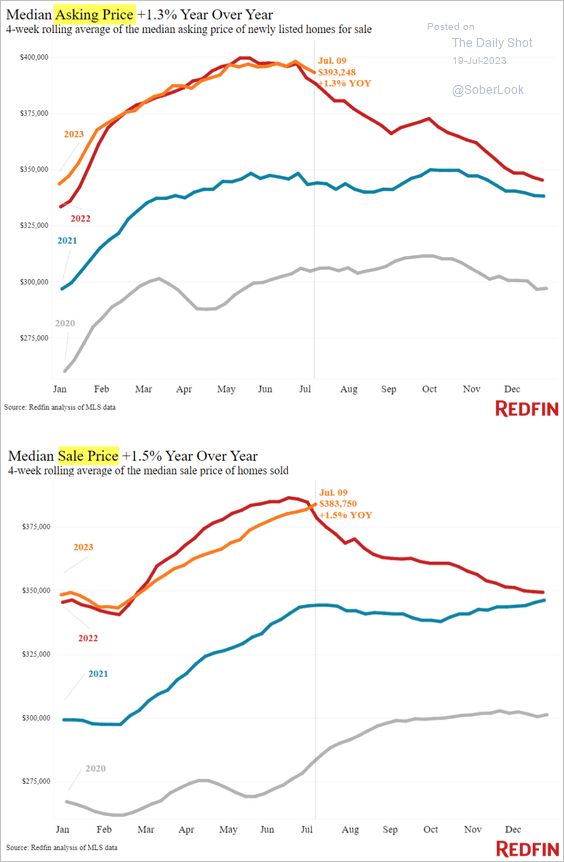
• The median sale price is now above last year’s levels.
 Source: Redfin
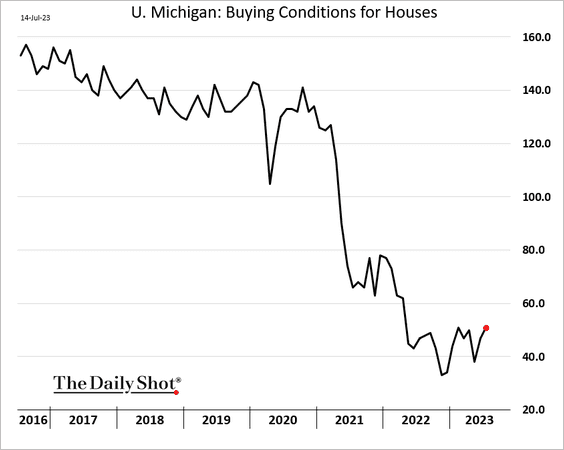
• The U. Michigan’s index of buying conditions for houses has stabilized but remains depressed.
• US housing affordability deterioration has been more severe than in other advanced economies.
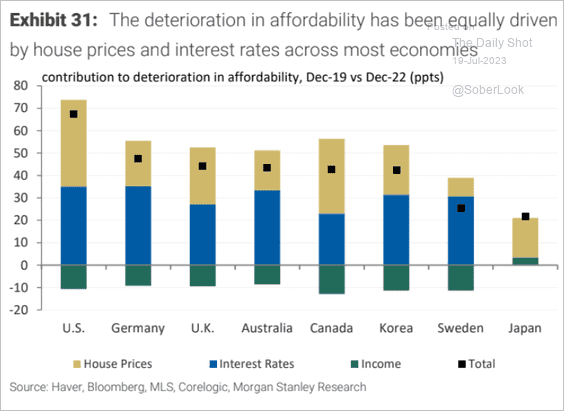 Source: Morgan Stanley Research
Back to Index
Canada
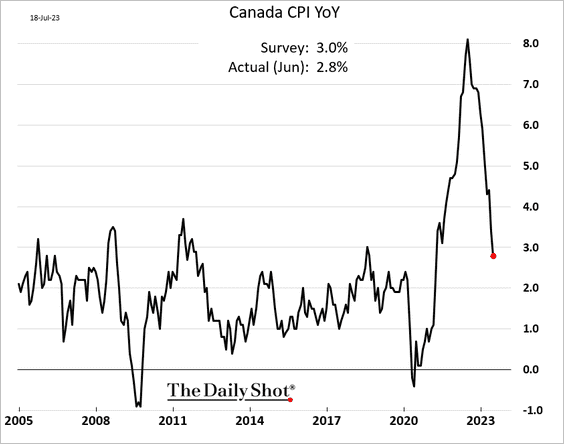
1. The headline CPI dipped below 3% in June.
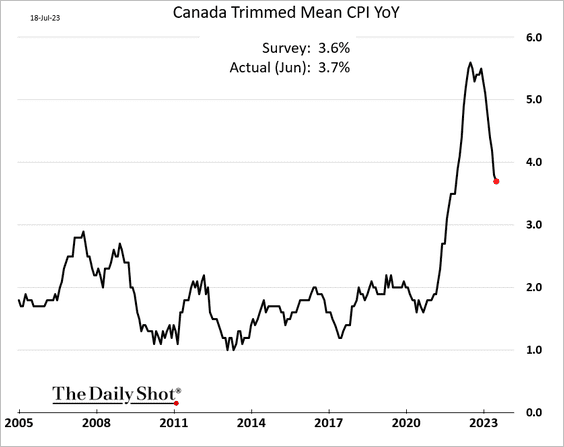
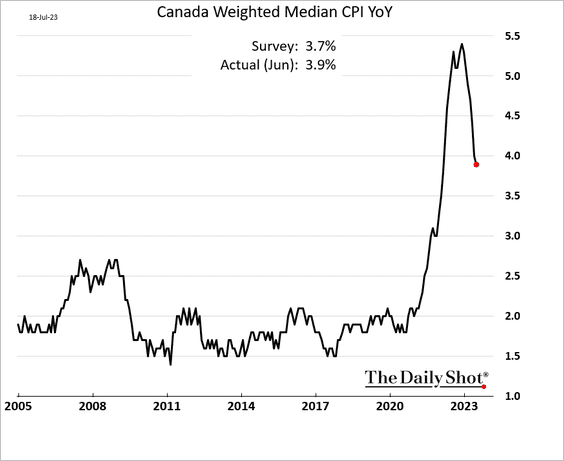
But core inflation topped expectations.
– Trimmed-mean:
– Median:
• “Super core” inflation is still running hot.
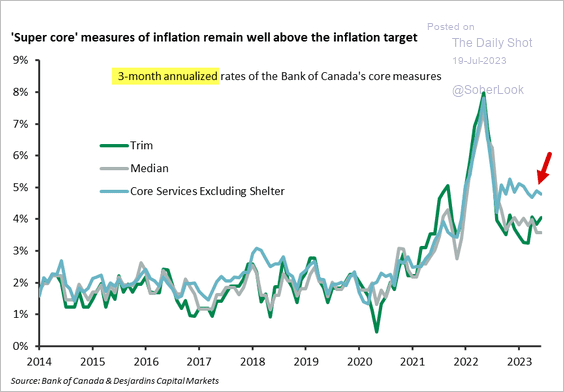 Source: Desjardins
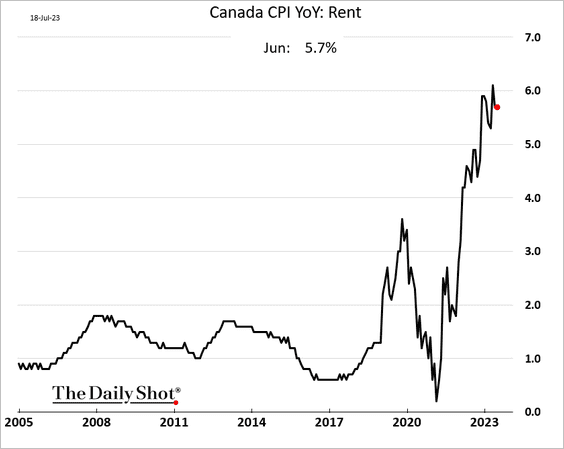
• Here is rent inflation.
• The CPI index excluding food and energy is now inside the BoC’s target range.
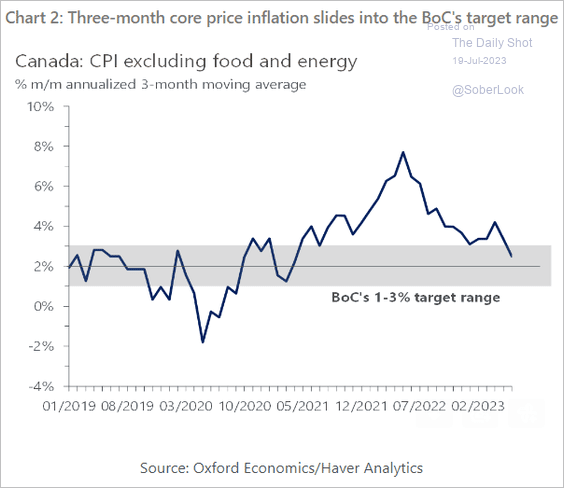 Source: Oxford Economics
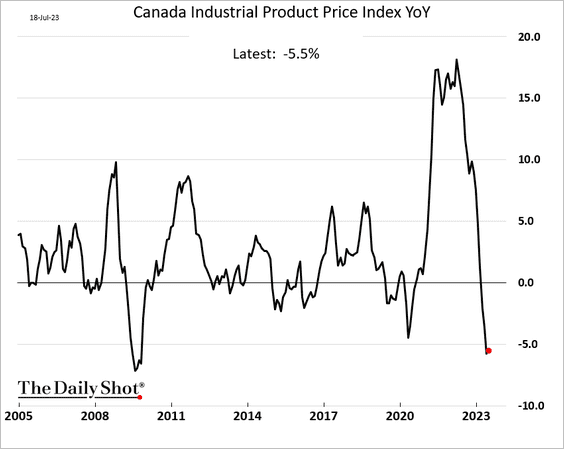
• Industrial PPI is deep in negative territory.
——————–
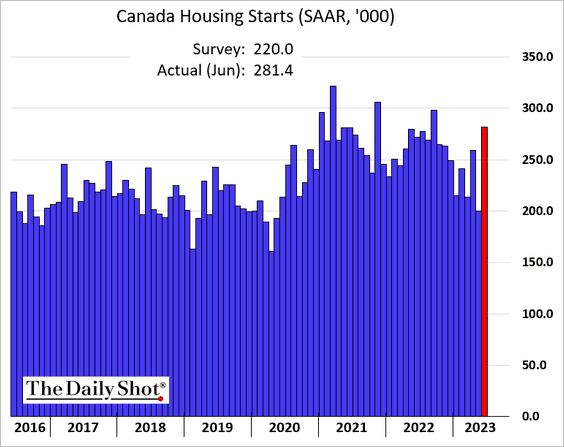
2. Housing starts surged last month.
3. Profitability in the consumer staples sector is improving, with stronger earnings than the broader TSX Composite.
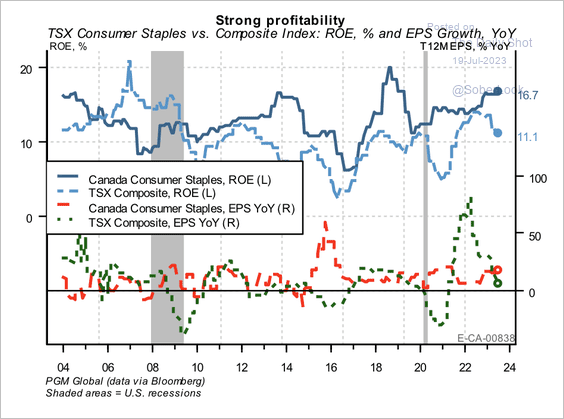 Source: PGM Global
Back to Index
The Eurozone
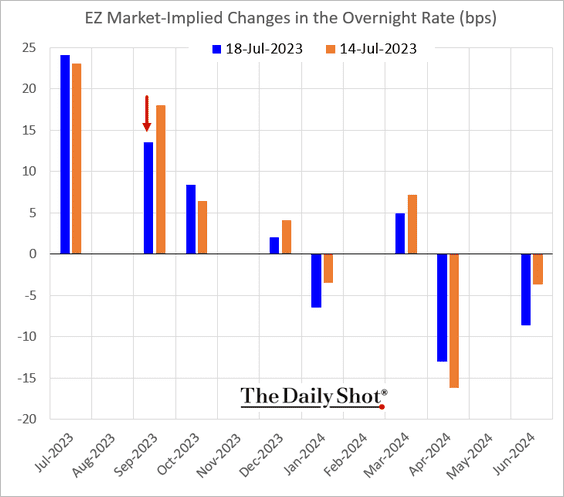
1. ECB’s Klaas Knot was a bit more dovish than expected.
 Source: @economics Read full article
• A September rate hike is now a coin toss.
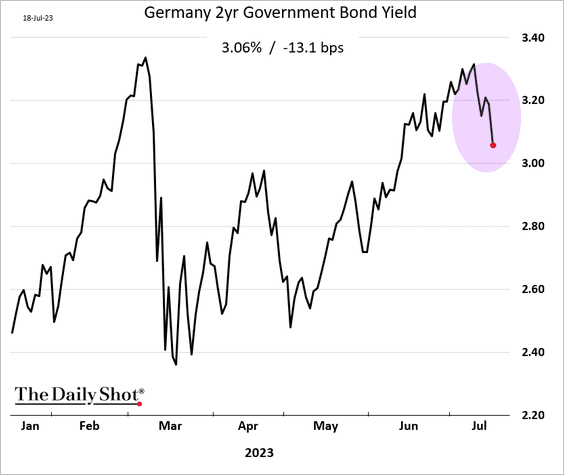
• Bund yields dropped sharply.
——————–
2. The Oxford Economics’ GDP tracker looks weak.
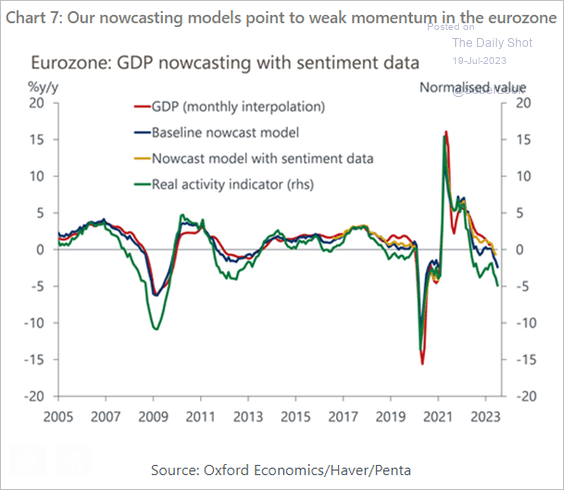 Source: Oxford Economics
3. A built-in wage-price spiral?
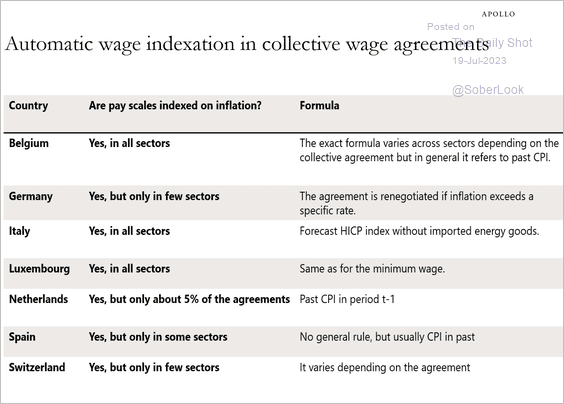 Source: Torsten Slok, Apollo
4. As natural gas prices spiked last year, German companies were able to do more with less gas.
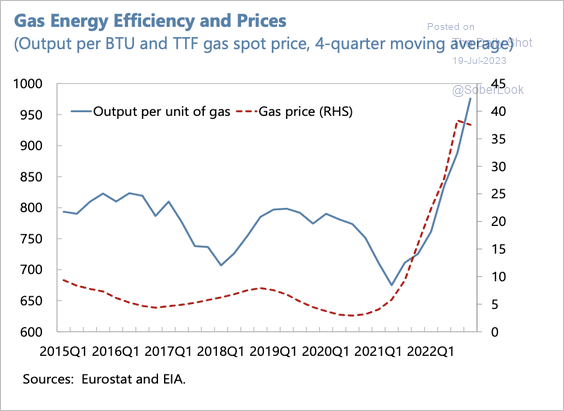 Source: IMF Read full article
5. This chart shows Spain’s concrete consumption since 1965.
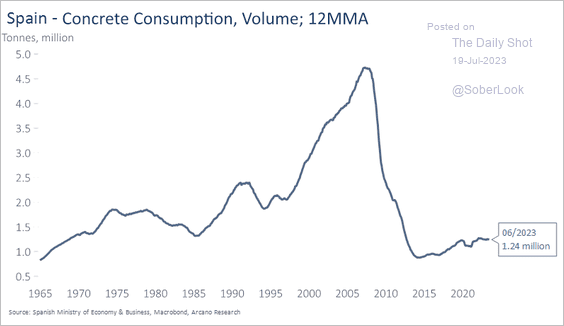 Source: Arcano Economics
Back to Index
China
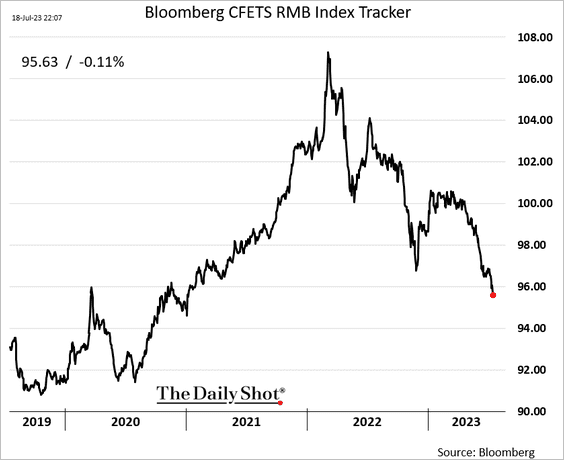
1. The renminbi remains under pressure.
• RMB against a basket of currencies:
• EUR/CNH:
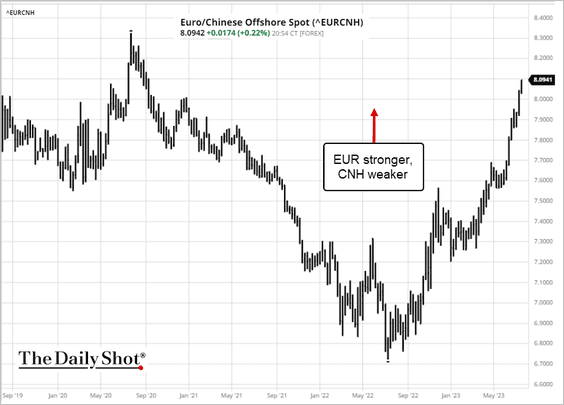 Source: barchart.com
——————–
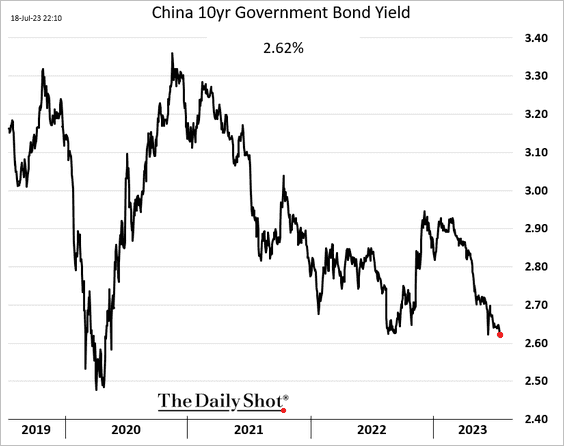
2. The 10-year yield hit the lowest level since the 2020 COVID shock.
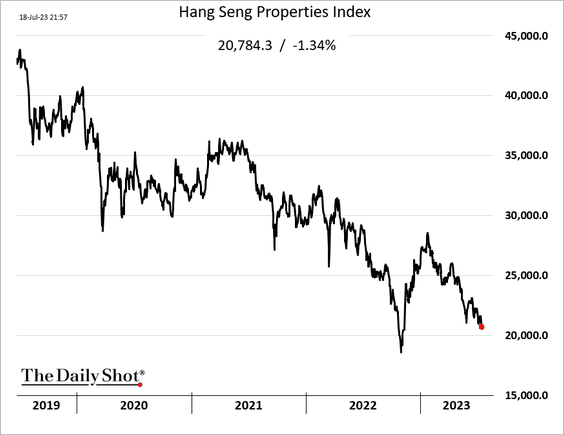
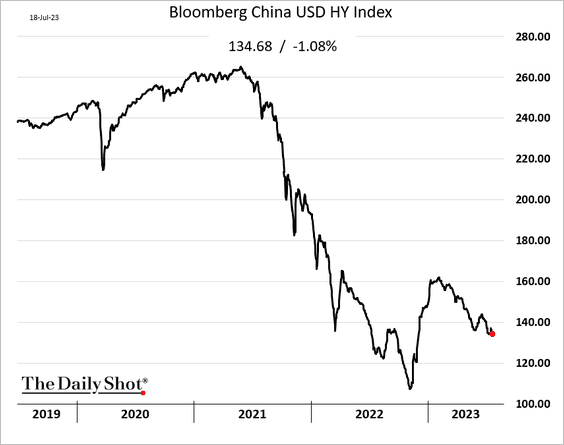
3. Property stocks and dollar-denominated bonds (mostly developers) continue to sink.
——————–
4. Holiday box office visits and shopping center traffic is recovering. (2 charts)
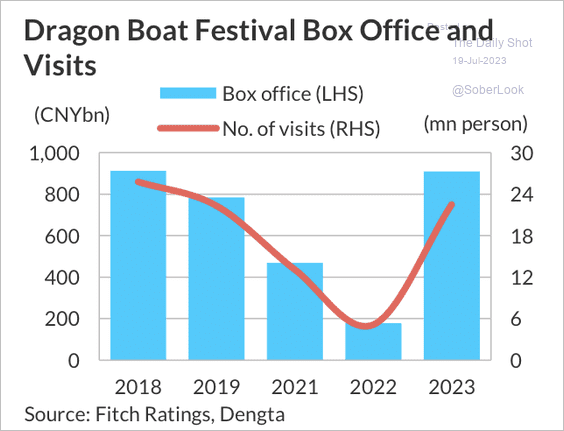 Source: Fitch Ratings
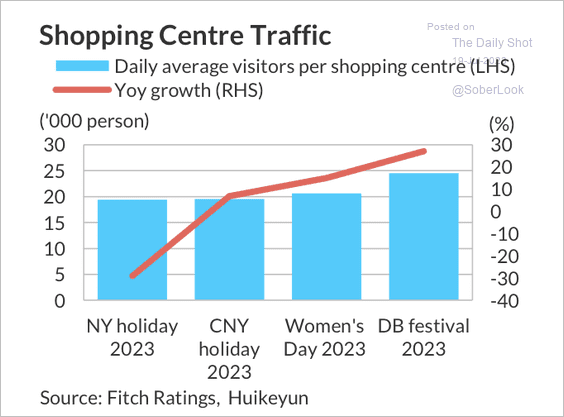 Source: Fitch Ratings
——————–
5. Fund managers increasingly see Chinese households prioritizing savings.
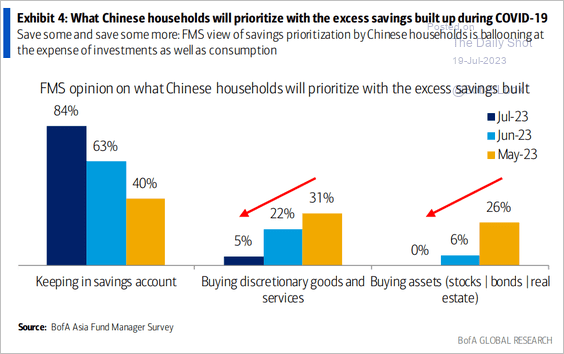 Source: BofA Global Research
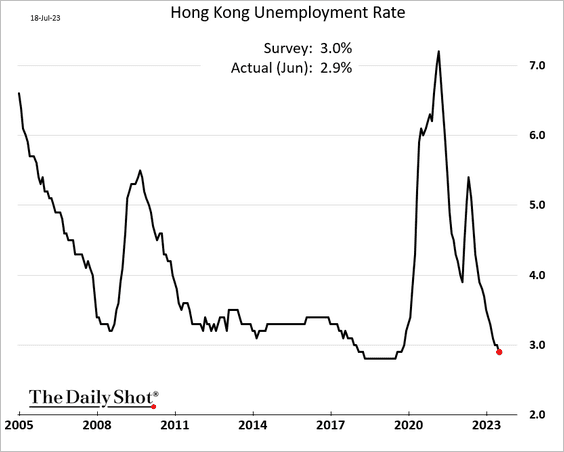
6. Hong Kong’s unemployment rate continues to fall.
Back to Index
Emerging Markets
1. Here is a look at EM equity valuations.
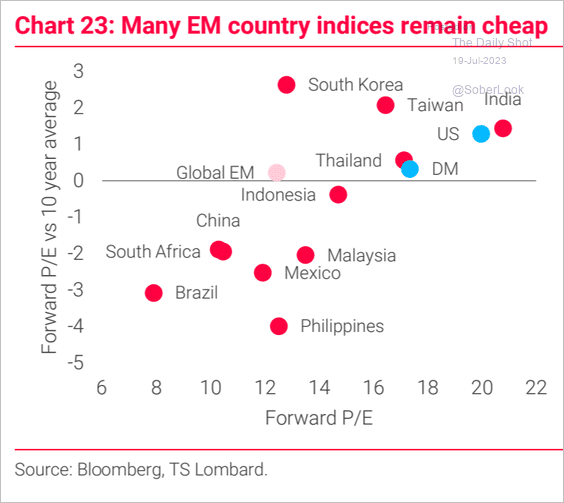 Source: TS Lombard
2. This chart shows the evolution of 2023 consensus GDP forecasts across regions.
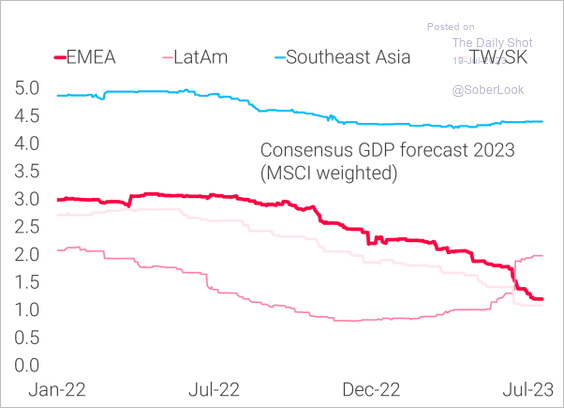 Source: TS Lombard
3. The Thai baht is rallying on hopes for easing political uncertainty.
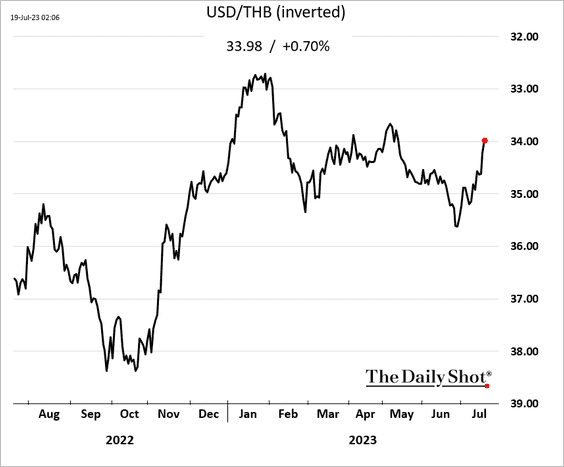
 Source: Reuters Read full article
——————–
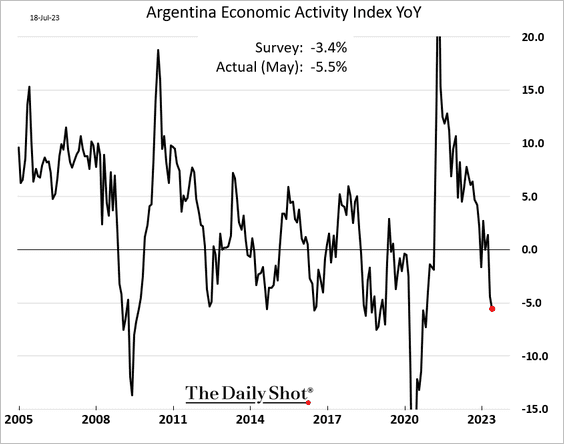
4. Argentina’s economy is shrinking rapidly.
Back to Index
Commodities
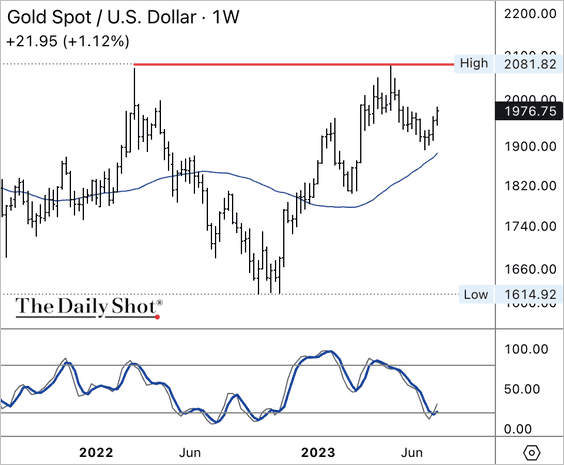
1. Gold is holding support above its 40-week moving average and is not yet overbought.
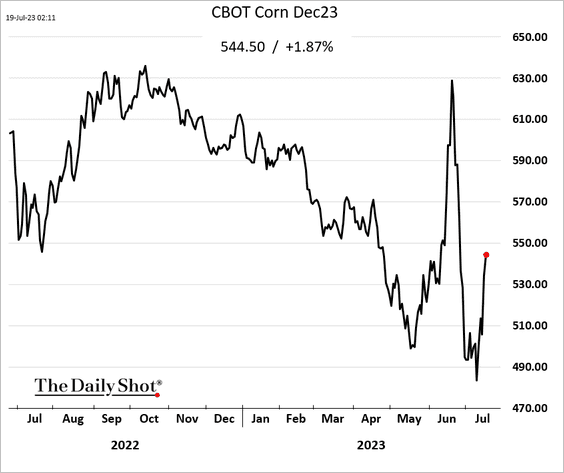
2. Anticipating drier and hotter conditions in the Midwest for the remainder of the month, corn futures are experiencing a rebound.
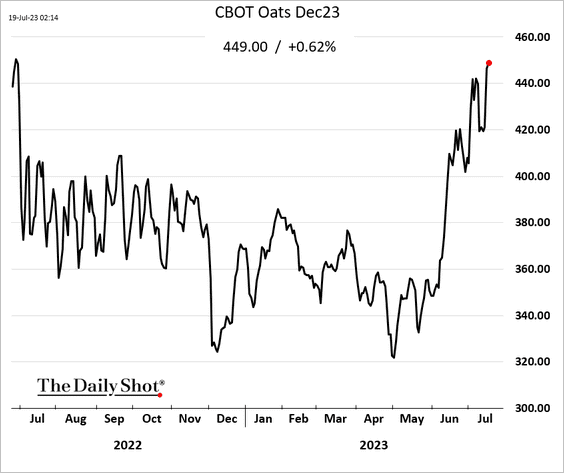
3. Oats futures are surging.
4. The pace of the US wheat harvest has been very sluggish.
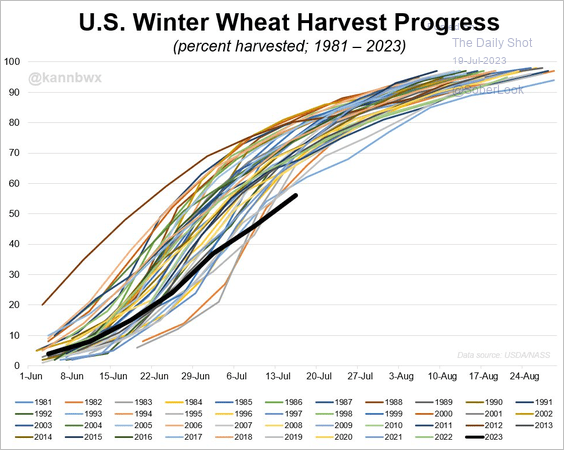 Source: @kannbwx
 Source: Brownfield Ag News Read full article
Separately, here’s the reason behind the relatively subdued response of the wheat market to Russia’s termination of the Ukraine export agreement.
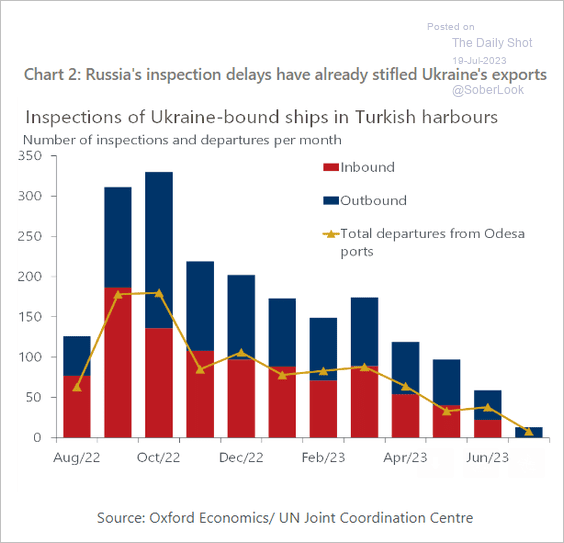 Source: Oxford Economics
Back to Index
Equities
1. The year-to-date divergence among key US equity indices has been massive.
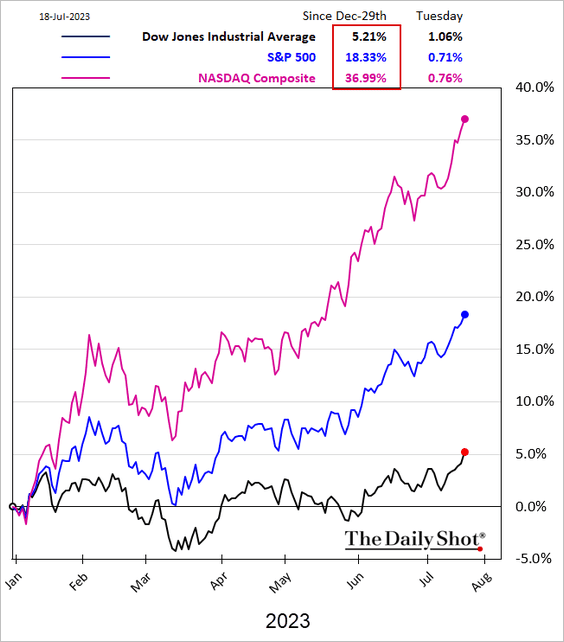 h/t @WSJ
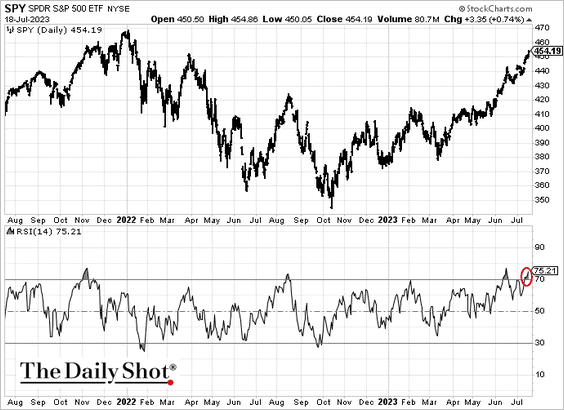
2. Technicals suggest that the market rally is stretched.
3. Investor sentiment is in “extreme optimism” territory.
• Oxford Economics sentiment index:
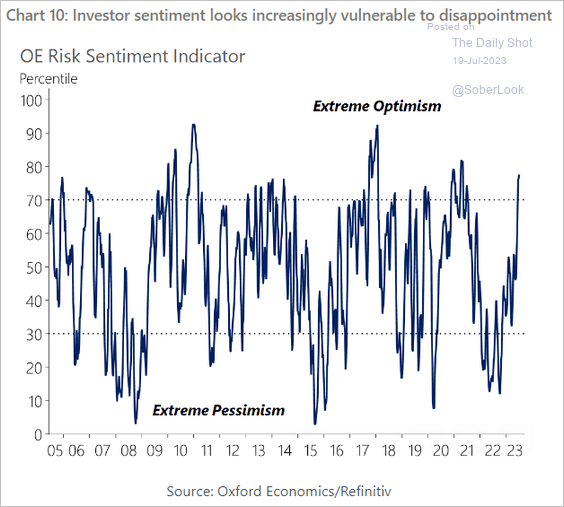 Source: Oxford Economics
• CNN Business Fear/Greed Index:
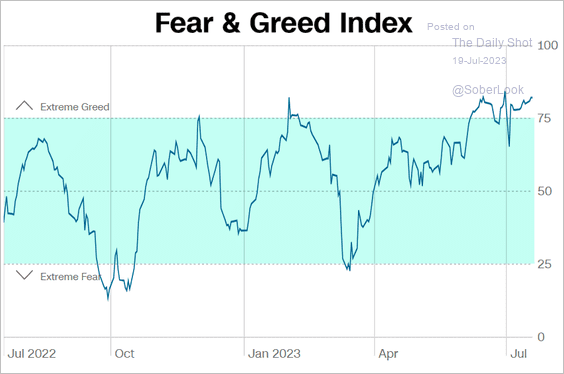 Source: CNN Business
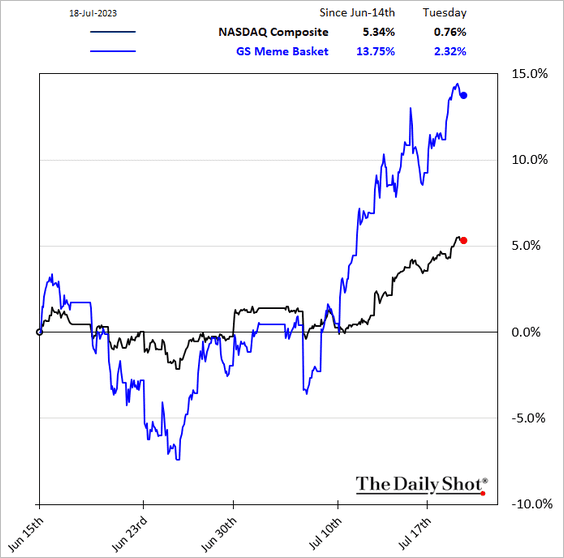
Speculative stocks have been outperforming.
——————–
4. Fund managers view “long big tech” as the most crowded trade.
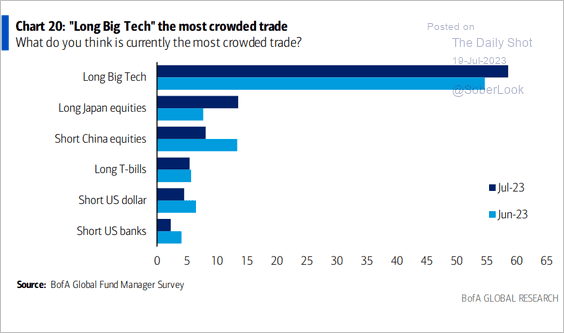 Source: BofA Global Research
5. High-beta stocks have massively outperformed the low-vol factor.
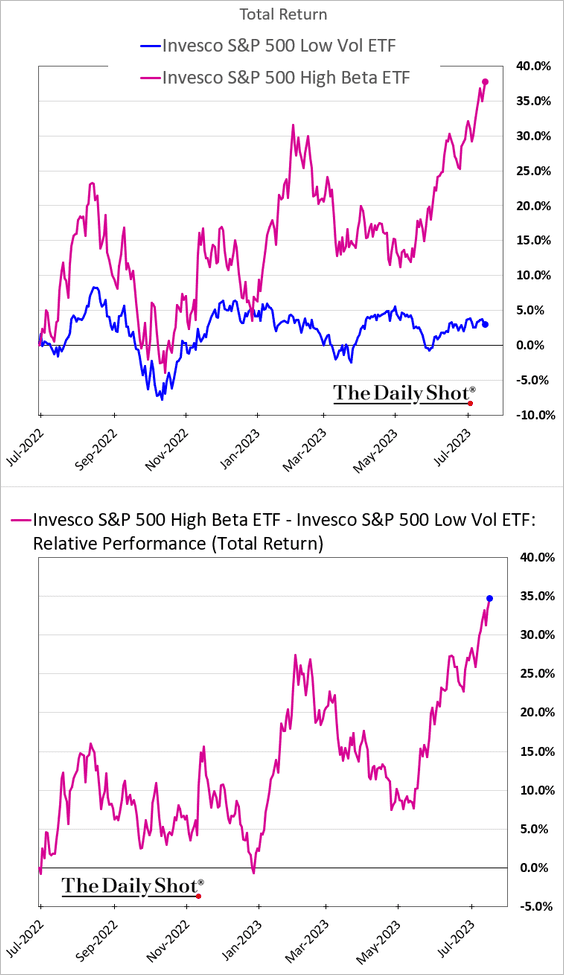
Here is a look at high-beta vs. low-vol factor performance across various indices (YTD).
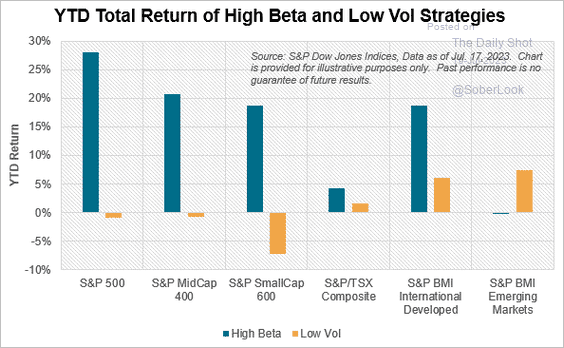 Source: S&P Dow Jones Indices
And this chart shows the year-to-date and month-to-date factor performance.
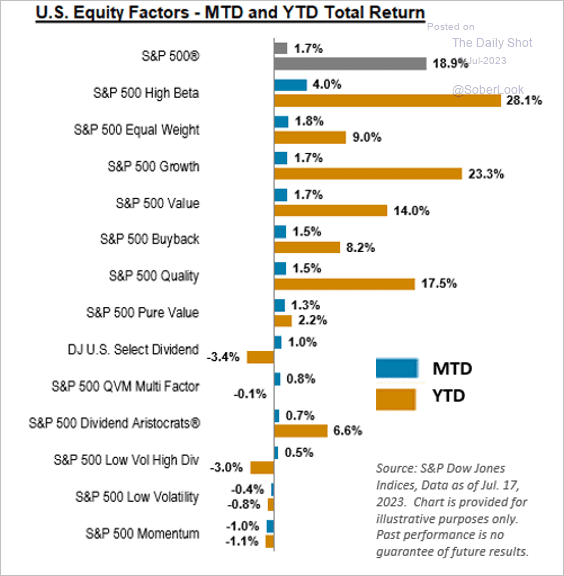 Source: S&P Dow Jones Indices
——————–
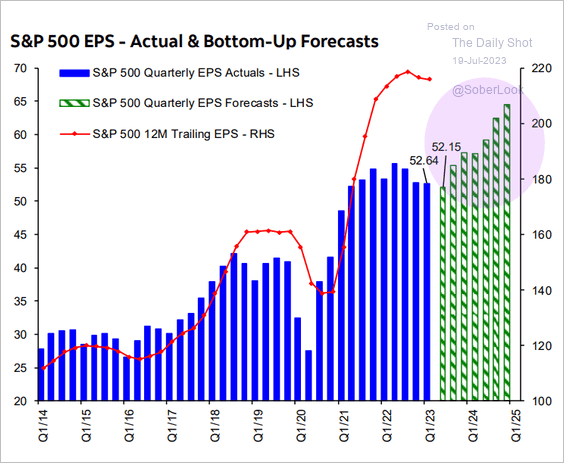
6. Analysts’ estimates suggest that the earnings recession is ending (2 charts).
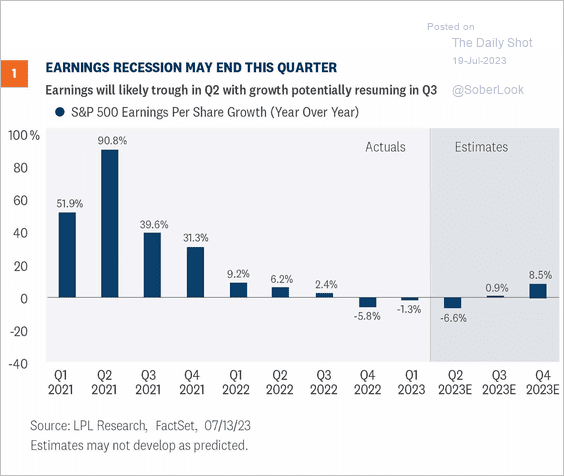 Source: LPL Research
 Source: Hugo Ste-Marie, Portfolio & Quantitative Strategy Global Equity Research, Scotia Capital
——————–
7. What were the average P/E ratios under different CPI and 10yr yield regimes (since 1970)?
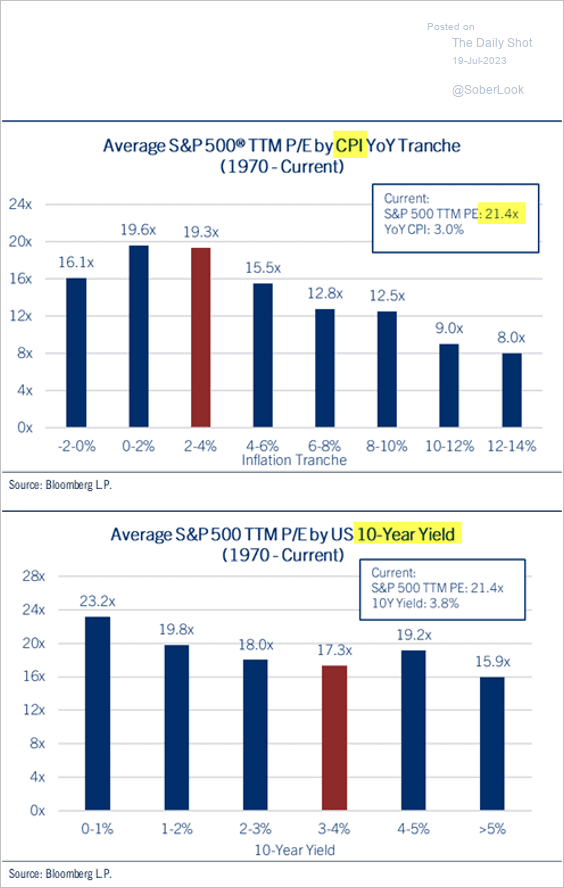 Source: John Lynch, Comerica Wealth Management
8. The implied correlation among US stocks is the lowest in 17 years. Are we overdue for a vol spike?
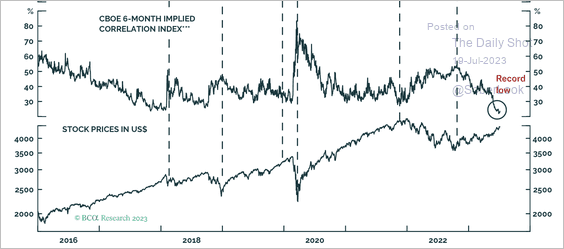 Source: BCA Research
9. Here is a look at the top 50 ETFs by AUM (enlarge chart here)
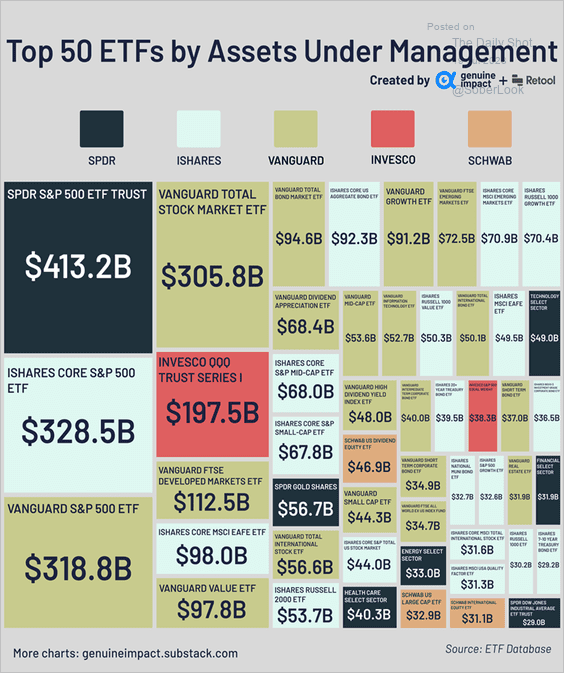 Source: @genuine_impact
Back to Index
Credit
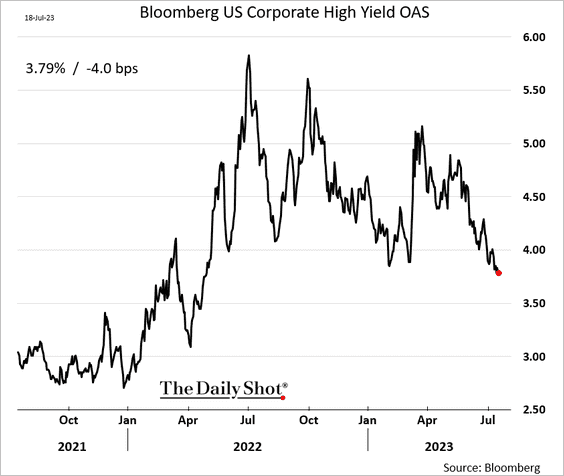
1. High-yield spreads continue to tighten.
2. Low issuance has brought the HY debt maturity wall closer.
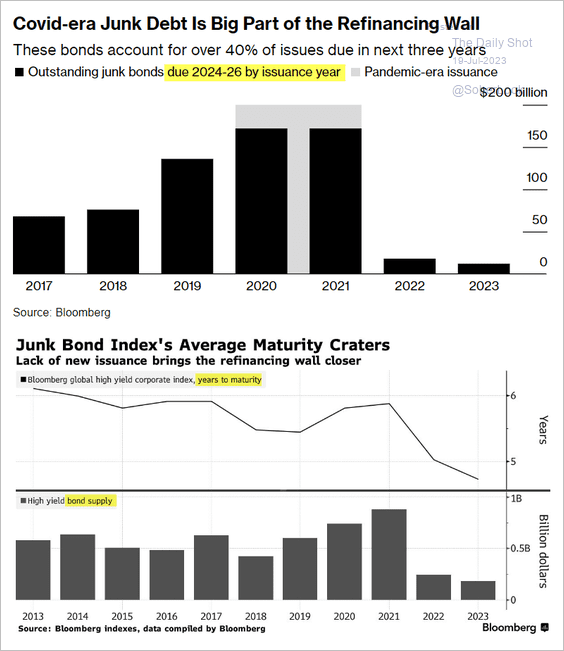 Source: @tasosvos, @eleanorrduncan, @markets Read full article
3. Here is a look at US banks’ loan-loss provisions.
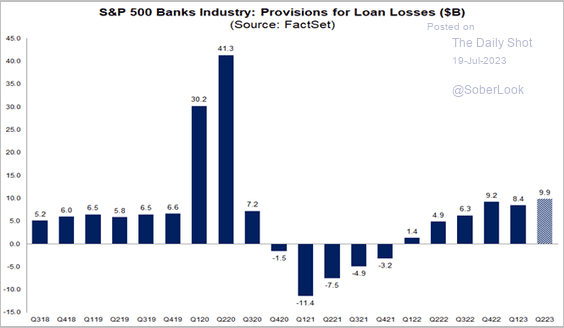 Source: @FactSet Read full article
• This chart shows credit card delinquency rates at small banks.
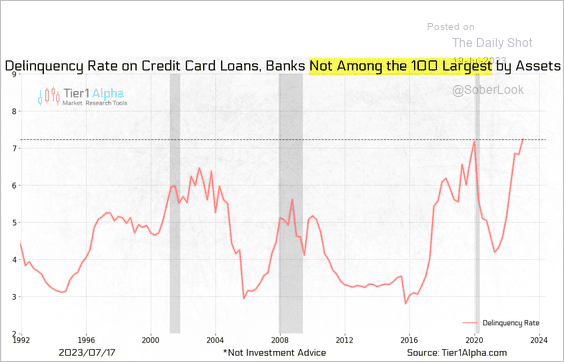 Source: @t1alpha
——————–
Rates
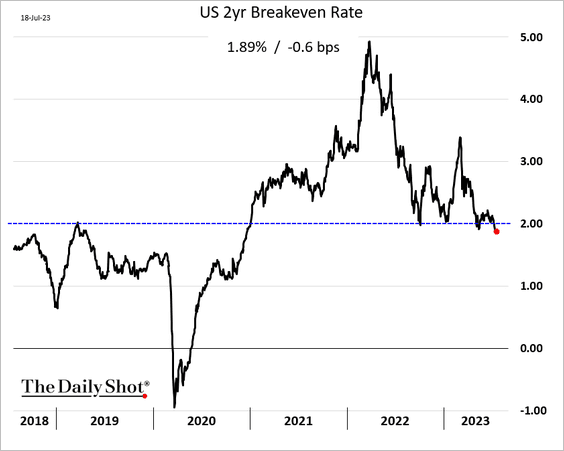
1. The 2-year US breakeven rate (inflation expectations) dipped below 2%.
2. BofA’s private clients continue to dump inflation-linked Treasuries.
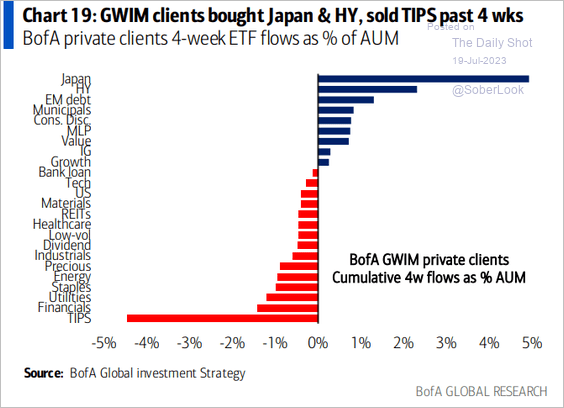 Source: BofA Global Research
3. The iShares 20+ Treasury Bond ETF (TLT) is testing downtrend resistance, although momentum is improving.
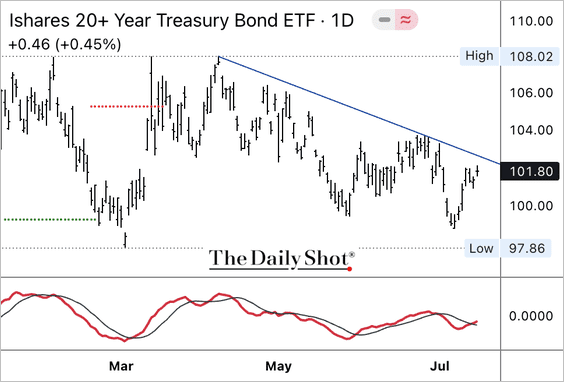
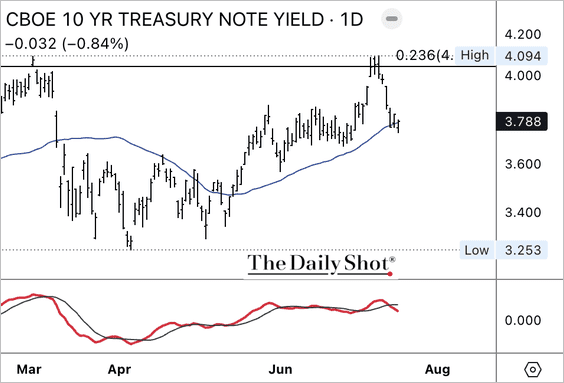
Conversely, the 10-year Treasury yield broke below support as upside momentum weakened.
——————–
4. G7 government bond yields are no longer oversold. MRB Partners sees potential for another up-wave of yields before reaching a cyclical peak.
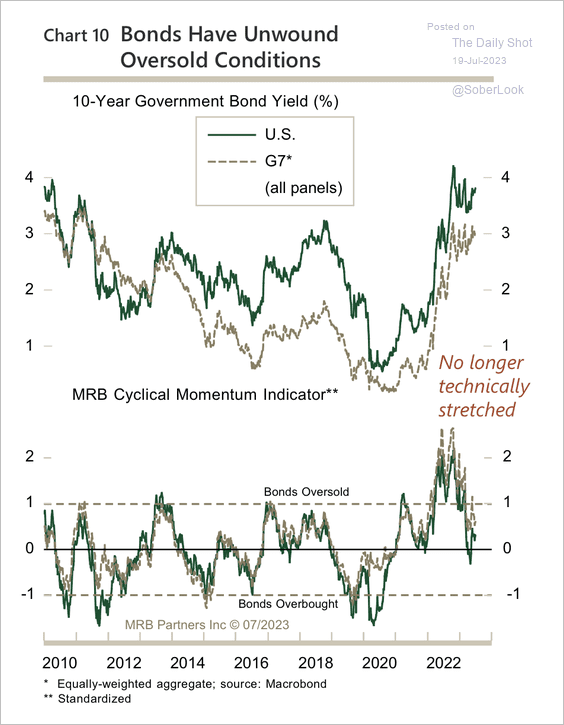 Source: MRB Partners
Back to Index
Global Developments
1. Risk premia indicators have declined significantly this year.
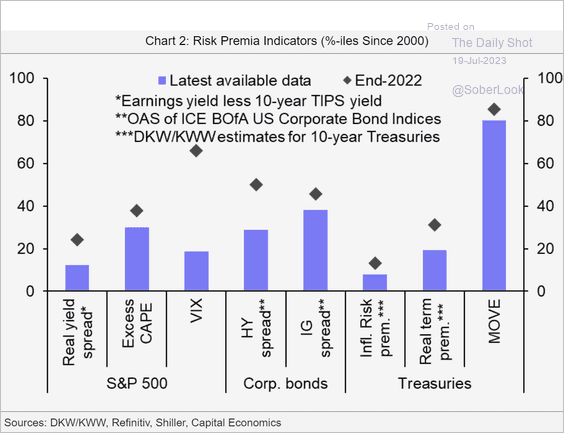 Source: Capital Economics
2. The dollar tends to rise during recessions …
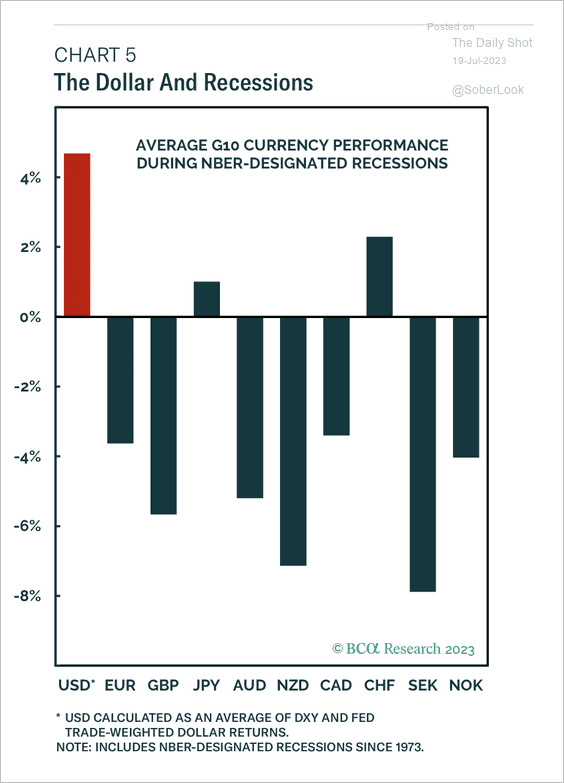 Source: BCA Research
… but it appears overvalued, which could limit the upside.
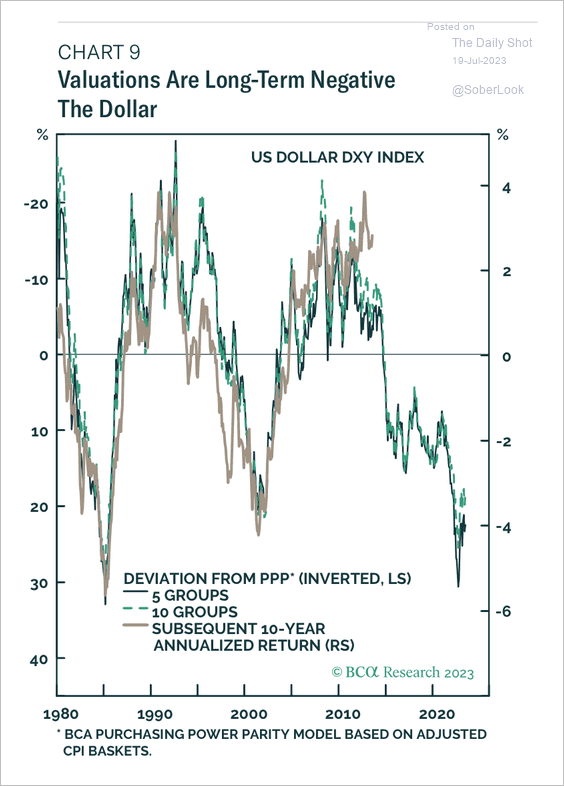 Source: BCA Research
——————–
3. Investors increasingly expect a soft landing for the global economy.
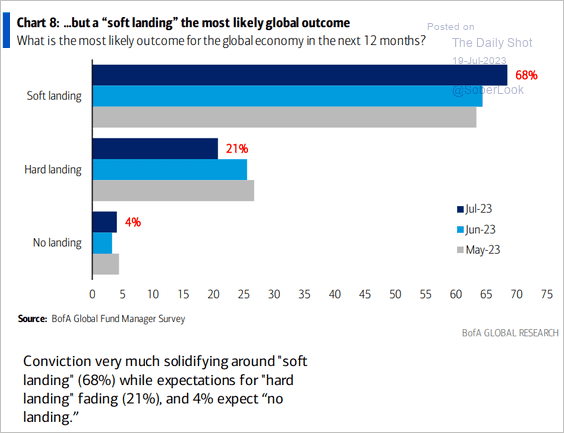 Source: BofA Global Research
——————–
Food for Thought
1. Amazon Prime Day spending:
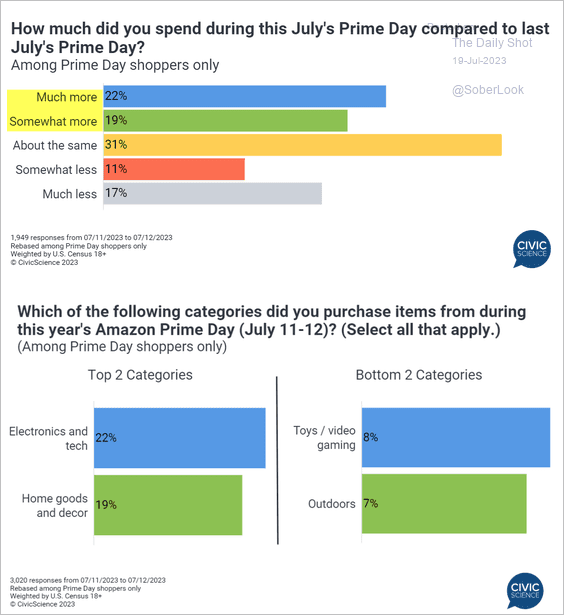 Source: @CivicScience Read full article
2. Subsea cables:
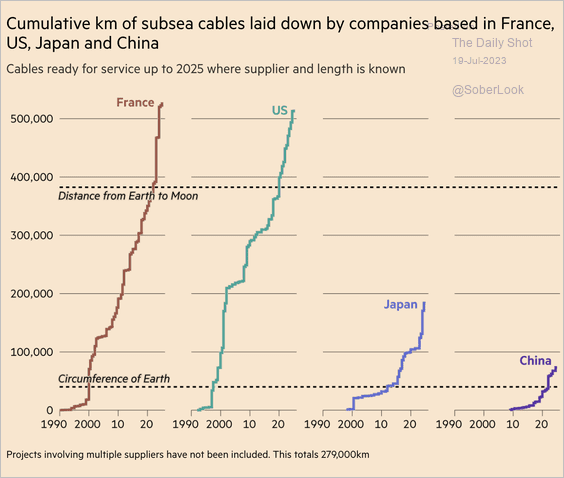 Source: @financialtimes Read full article
3. Coal-fired power plants:
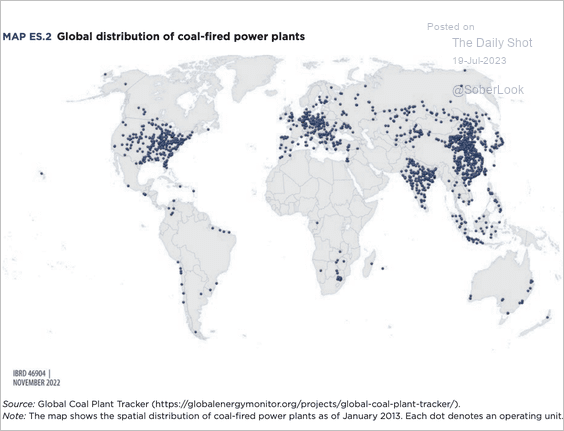 Source: World Bank Read full article
4. A toasty July:
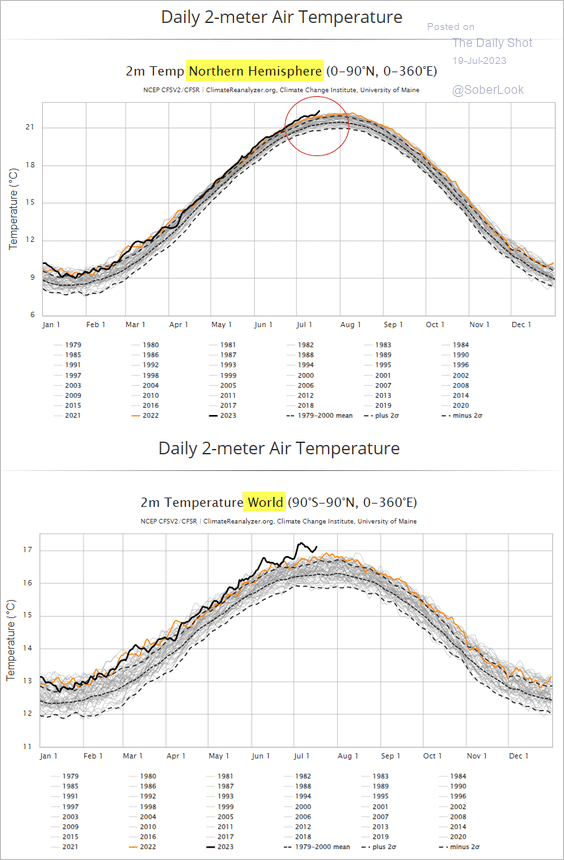 Source: Climate Reanalyzer
5. US presidential race fundraising;
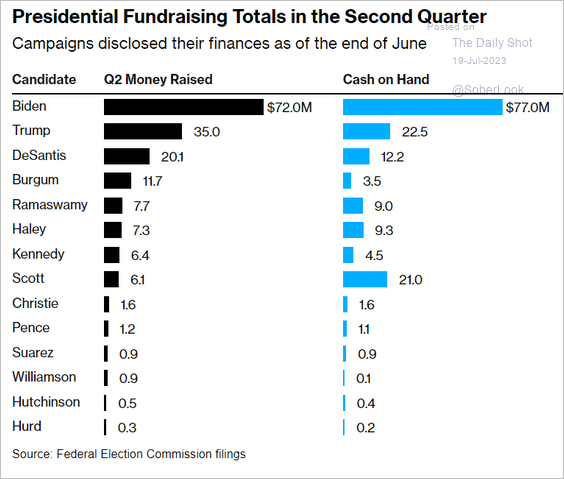 Source: @bpolitics Read full article
6. Google search activity for weight-loss diets and medications:
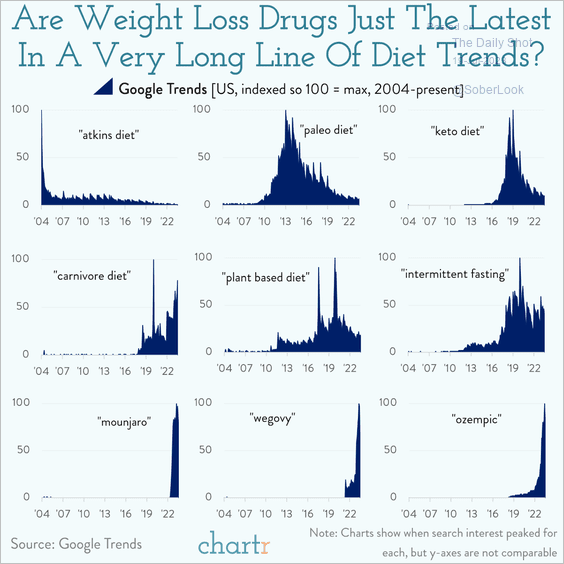 Source: @chartrdaily
7. Cancer rates among young adults:
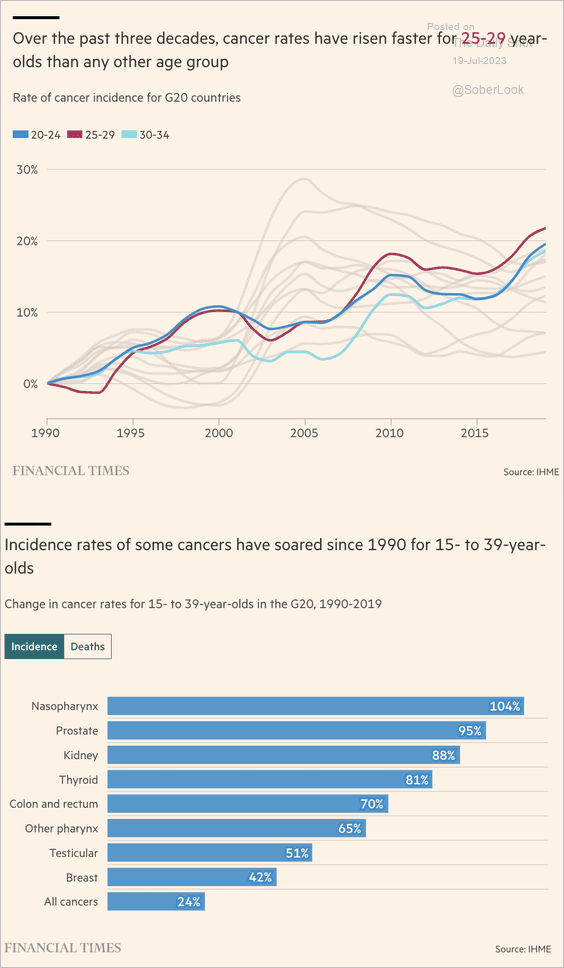 Source: @financialtimes Read full article
8. The cost of human body parts for medical research/training:
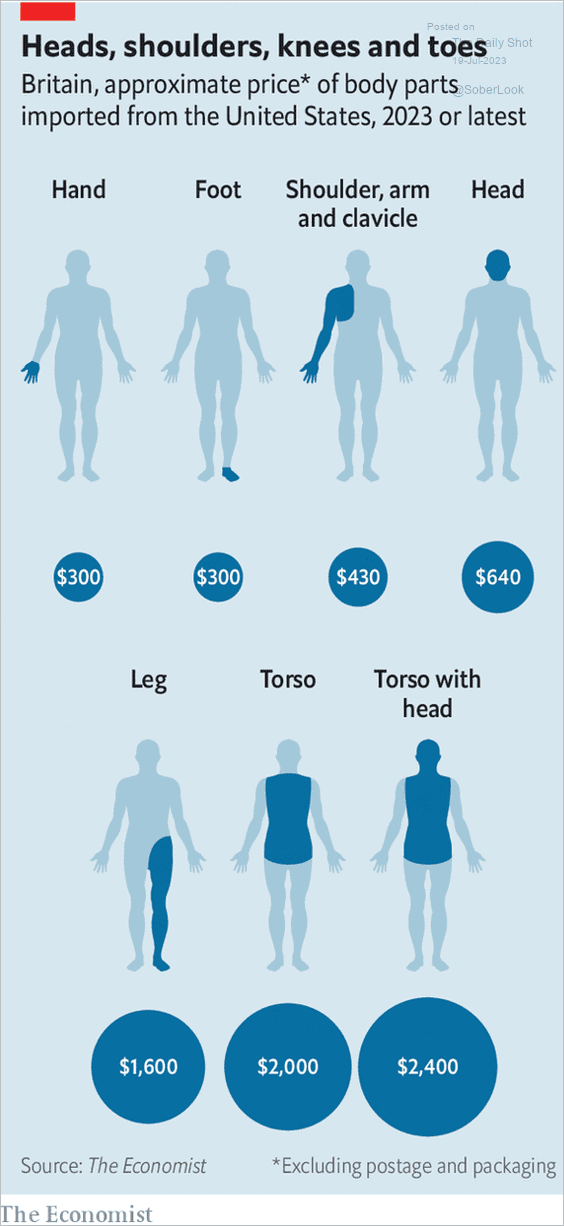 Source: The Economist Read full article
——————–
Back to Index