
The Daily Shot: 24-Jul-23
• The United States
• Canada
• The United Kingdom
• The Eurozone
• Japan
• Asia-Pacific
• China
• Emerging Markets
• Commodities
• Equities
• Credit
• Rates
• Global Developments
• Food for Thought
The United States
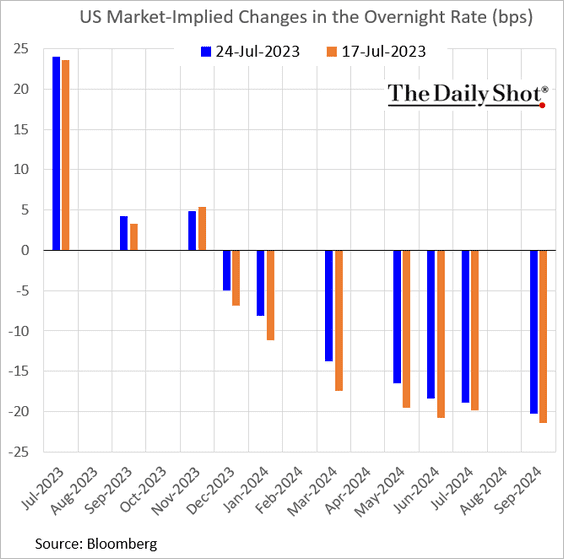
1. The market expects the Federal Reserve to raise rates this week, but the probability of further increases remains relatively low. Most economists see the July increase as the end of the hiking cycle.
• Here are some scenarios from ING and their impact on Treasury yields and the dollar.
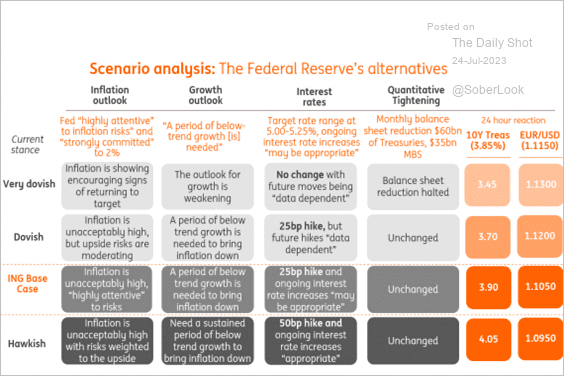 Source: ING
• Will we see some market volatility this week?
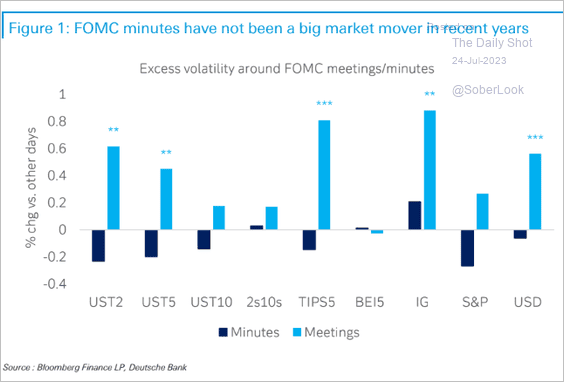 Source: Deutsche Bank Research
• How will the Fed’s rate hikes impact the economy over time?
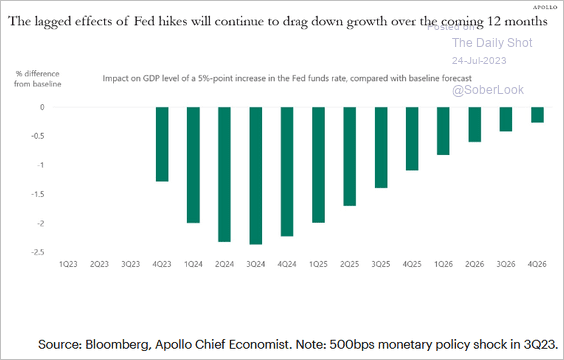 Source: Torsten Slok, Apollo
——————–
2. Goldman’s economists have lowered their projected likelihood of a recession occurring over the next 12 months.
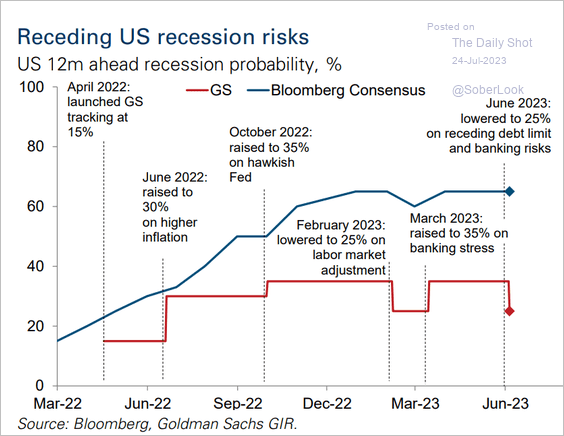 Source: Goldman Sachs
• Barclays’ economists have pushed their economic contraction forecast out to next year.
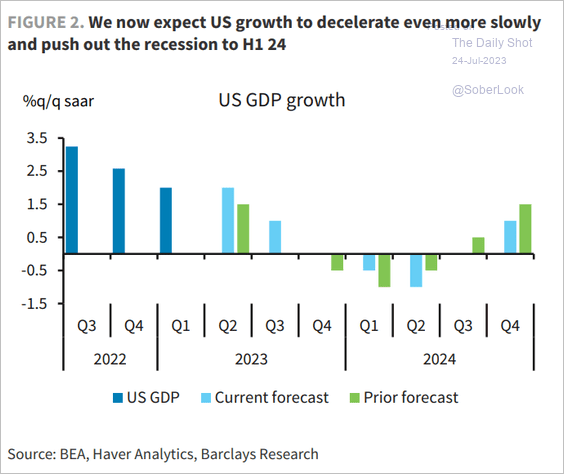 Source: Barclays Research
——————–
3. The scatterplot below suggests that US rental cost increases have been too high over the past decade, given supply fundamentals.
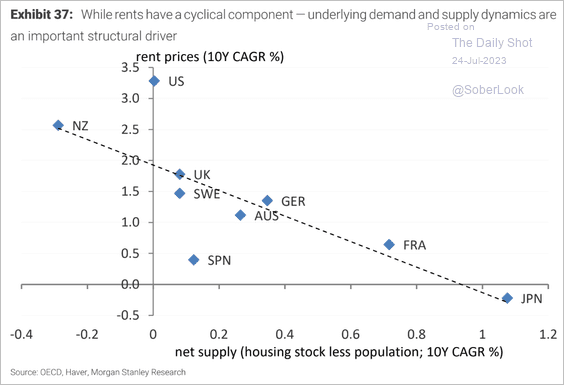 Source: Morgan Stanley Research
• The Apartment Market Tightness indicator points to a robust supply of rentals relative to demand.
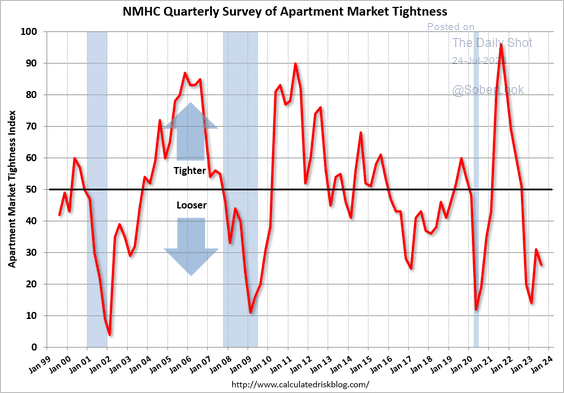 Source: Calculated Risk
——————–
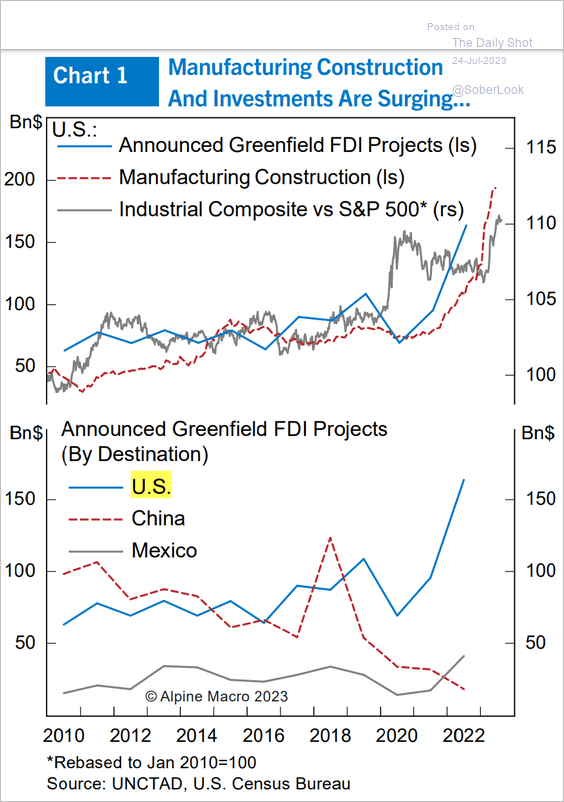
4. Foreign direct investment in US manufacturing has been strong.
 Source: BCA Research
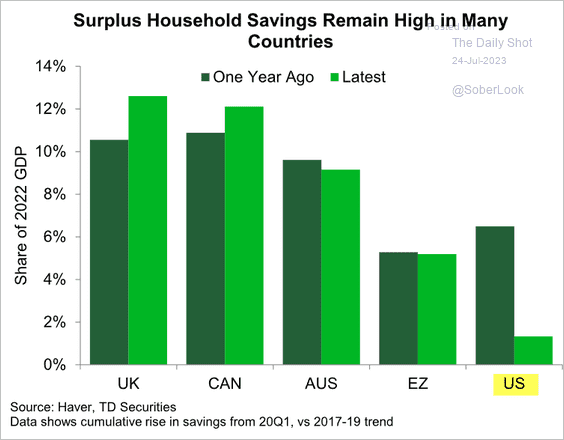
5. Extra cash tends to burn a hole in Americans’ pockets.
 Source: TD Securities
Back to Index
Canada
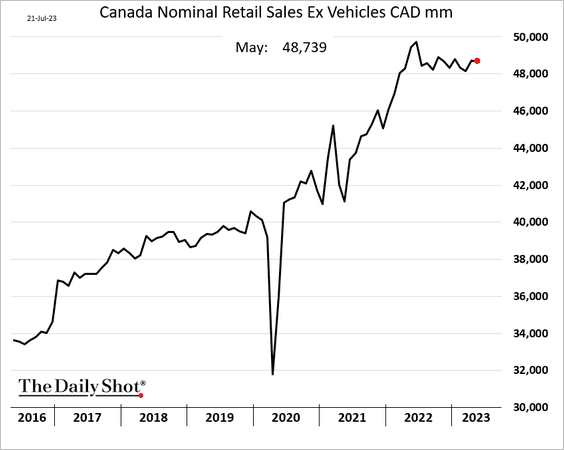
1. Retail sales held steady in May.
2. Excluding mortgage costs, the CPI is back at 2%.
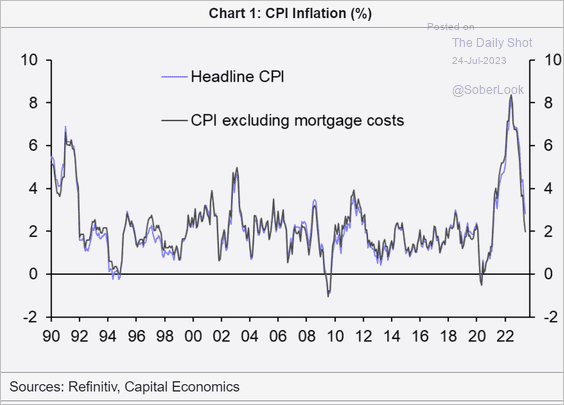 Source: Capital Economics
Back to Index
The United Kingdom
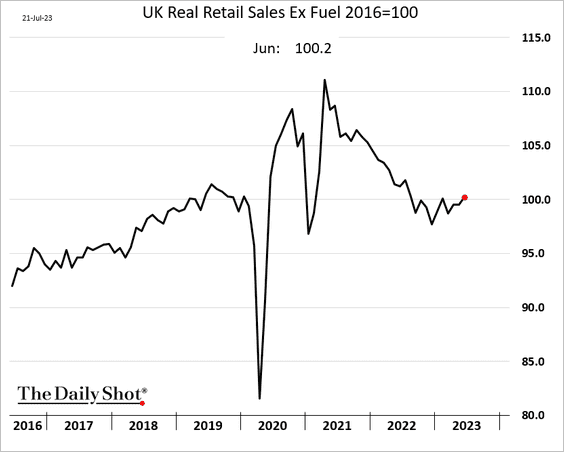
1. Retail sales strengthened last month.
2. Consumer confidence deteriorated in July.
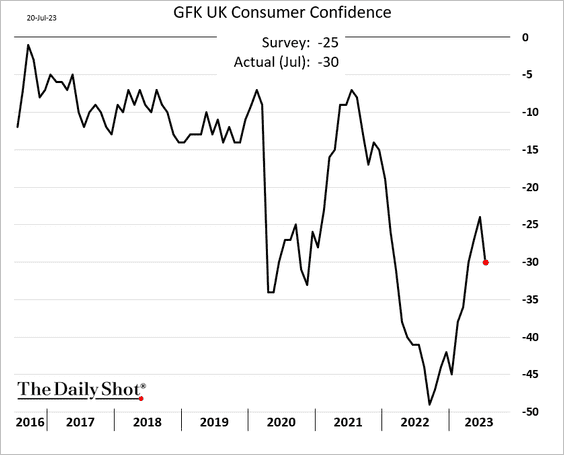
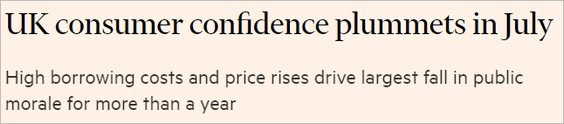 Source: @financialtimes Read full article
——————–
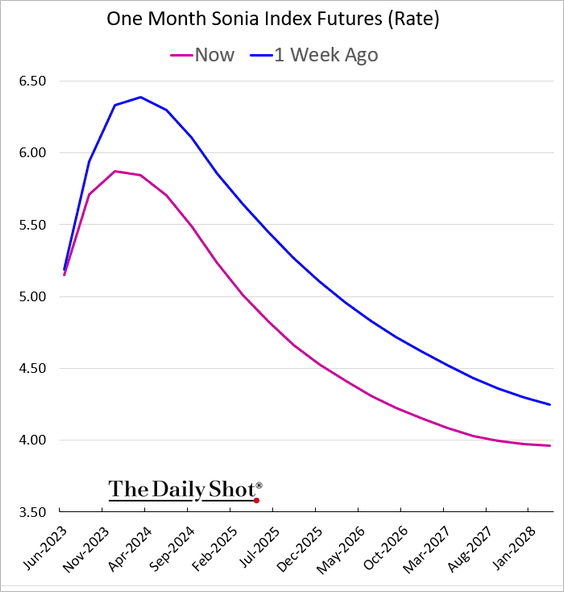
3. The market-implied BoE rate trajectory has downshifted sharply as inflation showed signs of easing.
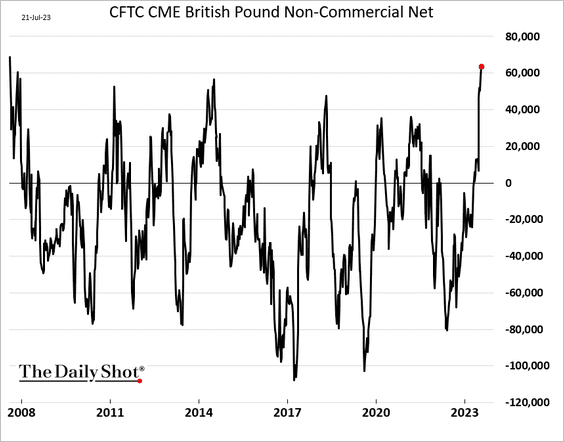
4. Speculative bets on the pound hit the highest level since 2007.
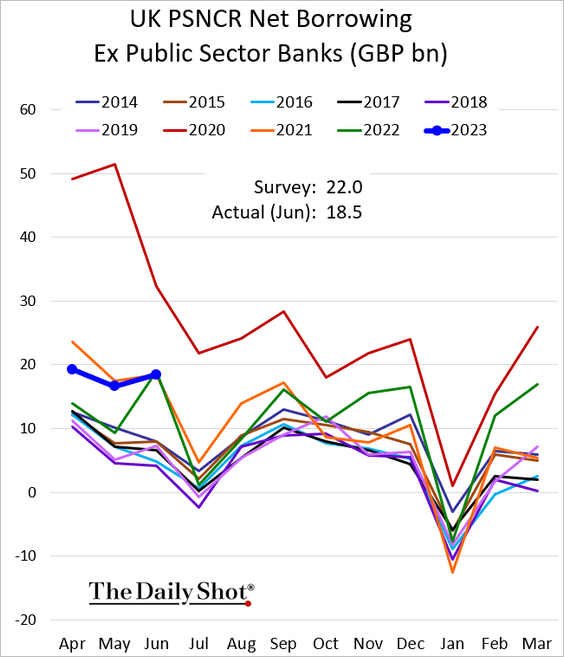
5. Government borrowing was lower than expected in June.
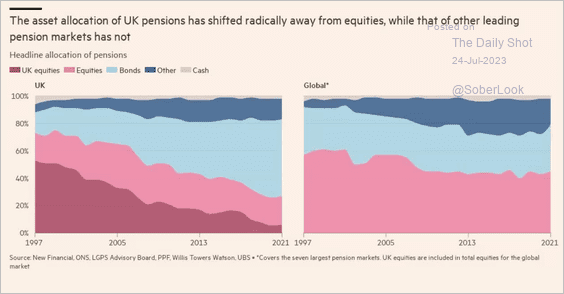
6. UK pensions have been rotating out of equities, a trend we don’t see globally.
 Source: @financialtimes Read full article
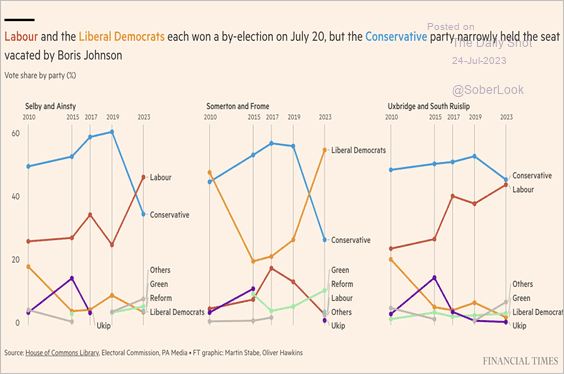
7. This chart shows local election results.
 Source: @financialtimes Read full article
Back to Index
The Eurozone
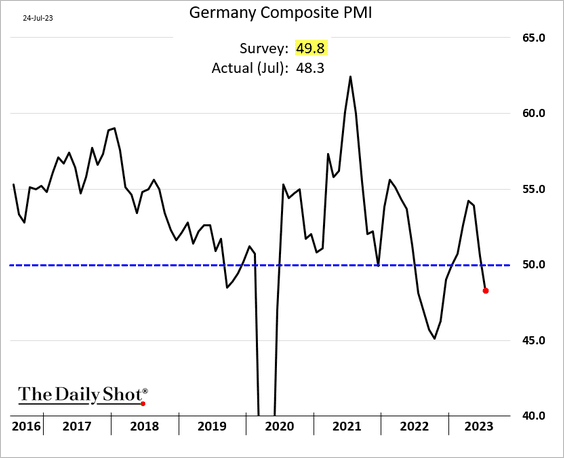
1. Germany’s PMI indicators declined this month, suggesting that the economy is contracting. We will have more on the euro-area PMI report tomorrow.
2. The Governing Council is increasingly concerned about the wage-price spiral risk.
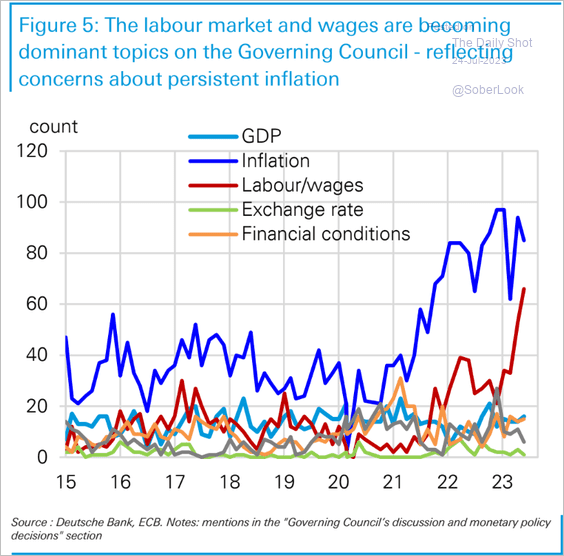 Source: Deutsche Bank Research
• There has been more disagreement among the Governing Council members.
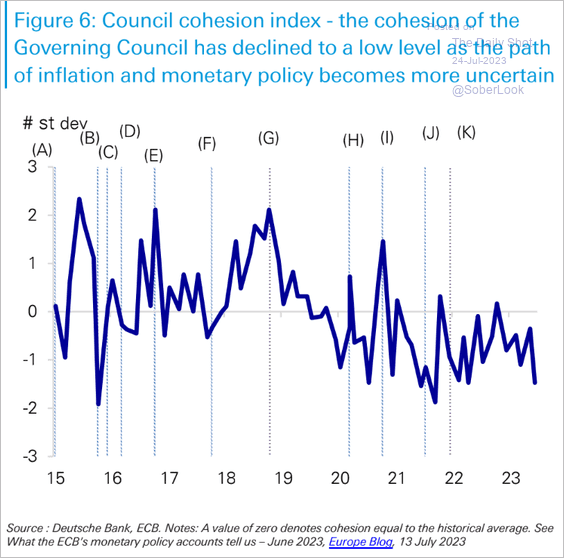 Source: Deutsche Bank Research
• CPI diffusion indicators point to disinflation.
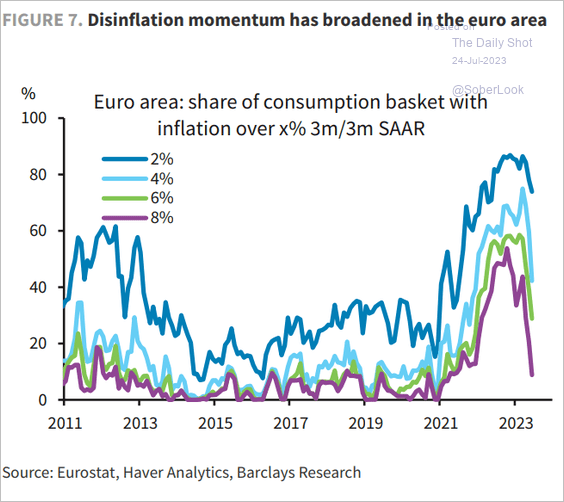 Source: Barclays Research
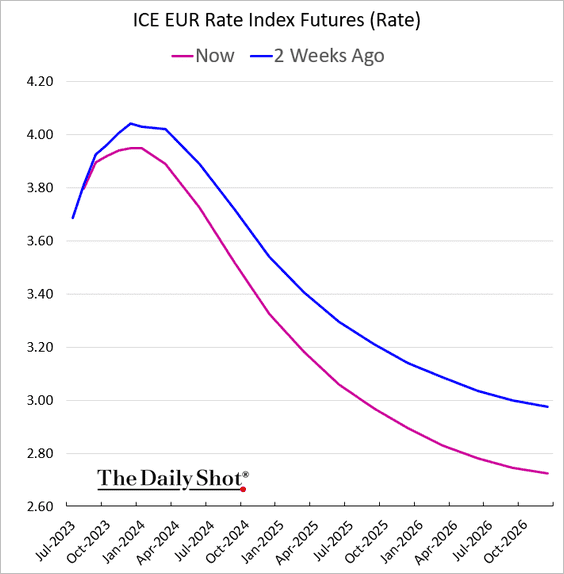
• The market-implied ECB rate trajectory has downshifted over the past couple of weeks.
——————–
3. This chart shows the COVID-era increase in public debt.
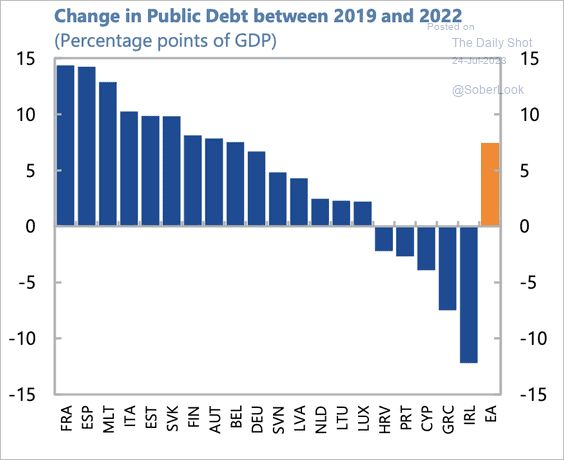 Source: IMF Read full article
4. Below are the preliminary results of Spain’s elections.
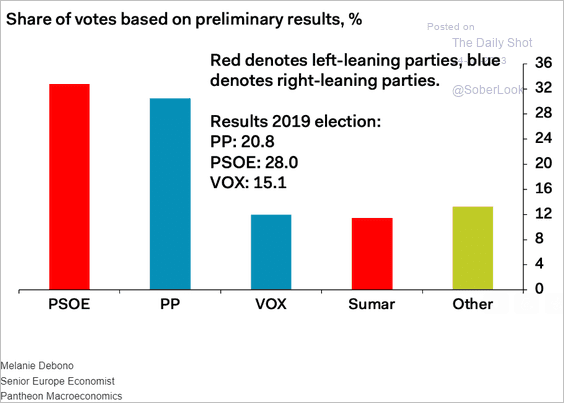 Source: Pantheon Macroeconomics
And here are some possible coalitions.
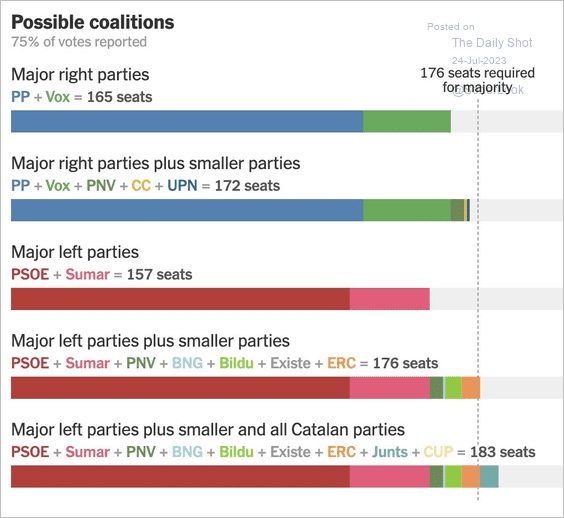 Source: The New York Times Read full article
Back to Index
Japan
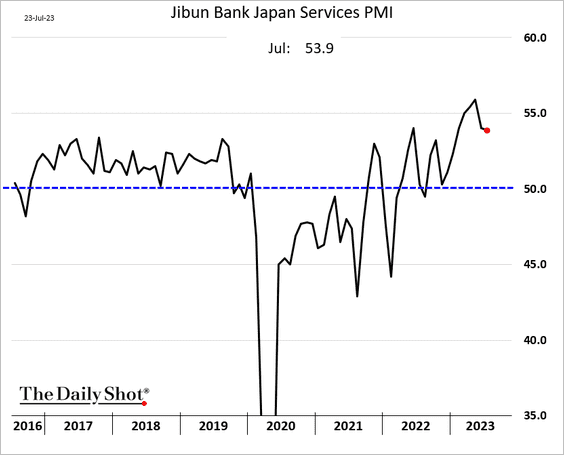
1. The manufacturing PMI moved further into contraction territory this month.
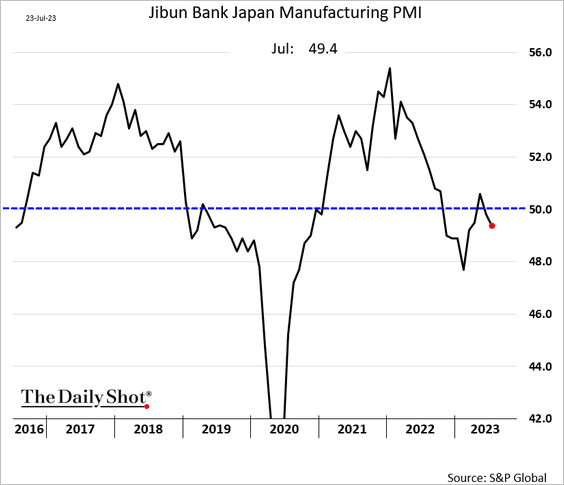
But services activity is holding up well.
——————–
2. Rising profit margins have been a major contributor to higher return on equity, while corporate efficiency (asset turnover) is recovering from pandemic lows.
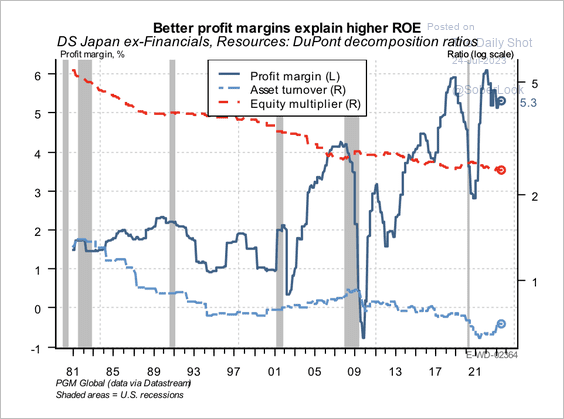 Source: PGM Global
• Dividends are growing faster than capex.
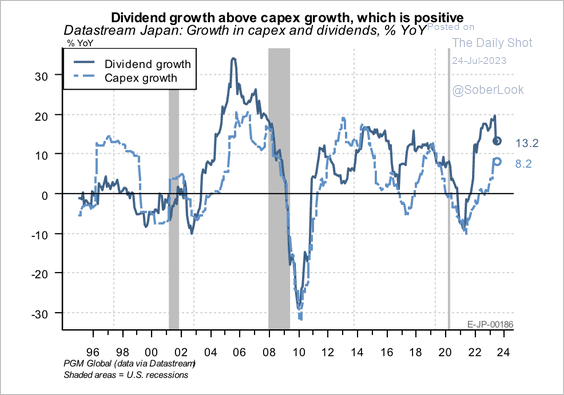 Source: PGM Global
——————–
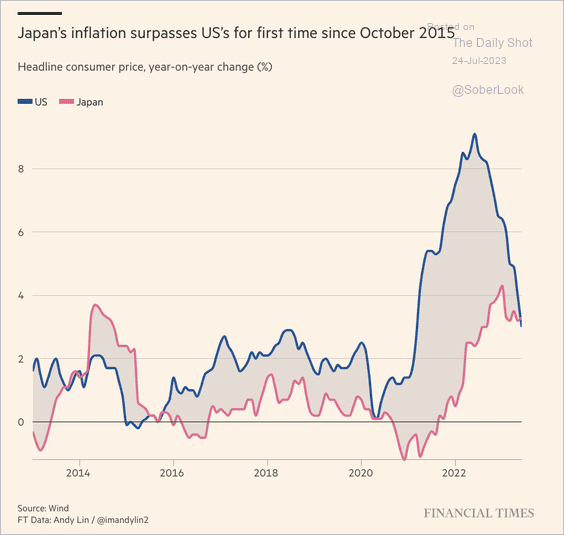
3. Japan’s CPI is now above that of the US.
 Source: @financialtimes Read full article
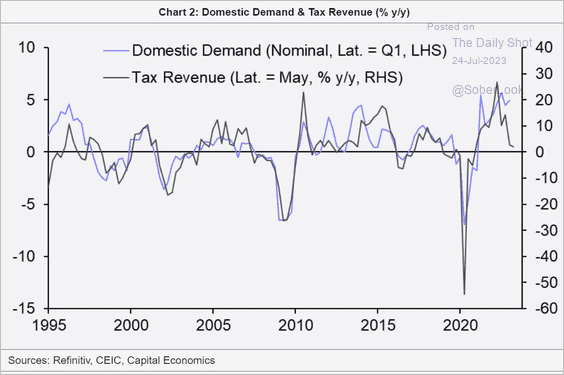
4. Tax revenue growth slowed sharply this year despite robust domestic demand.
 Source: Capital Economics
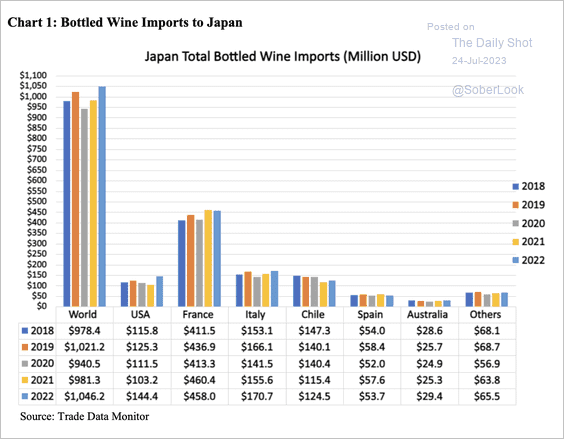
5. This chart shows Japan’s imports of wine by source.
 Source: USDA Read full article
Back to Index
Asia-Pacific
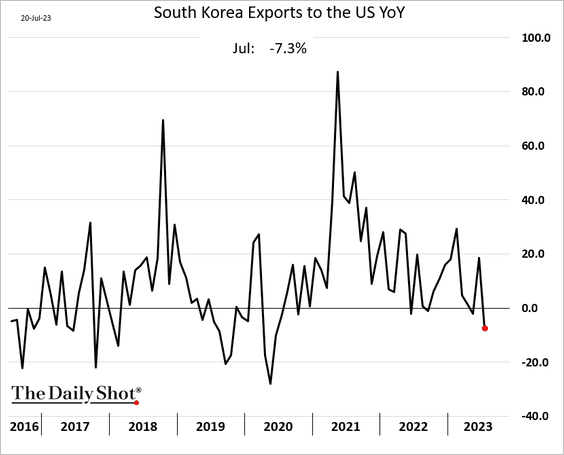
1. South Korea’s exports slowed this month.
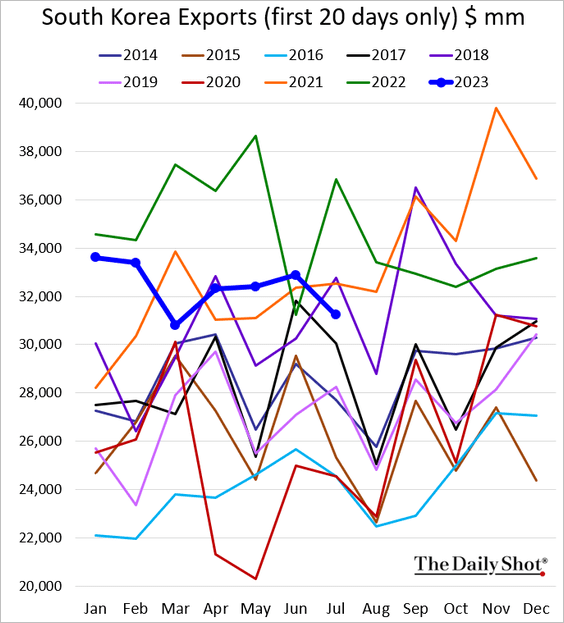
This chart shows exports to the US (year-over-year).
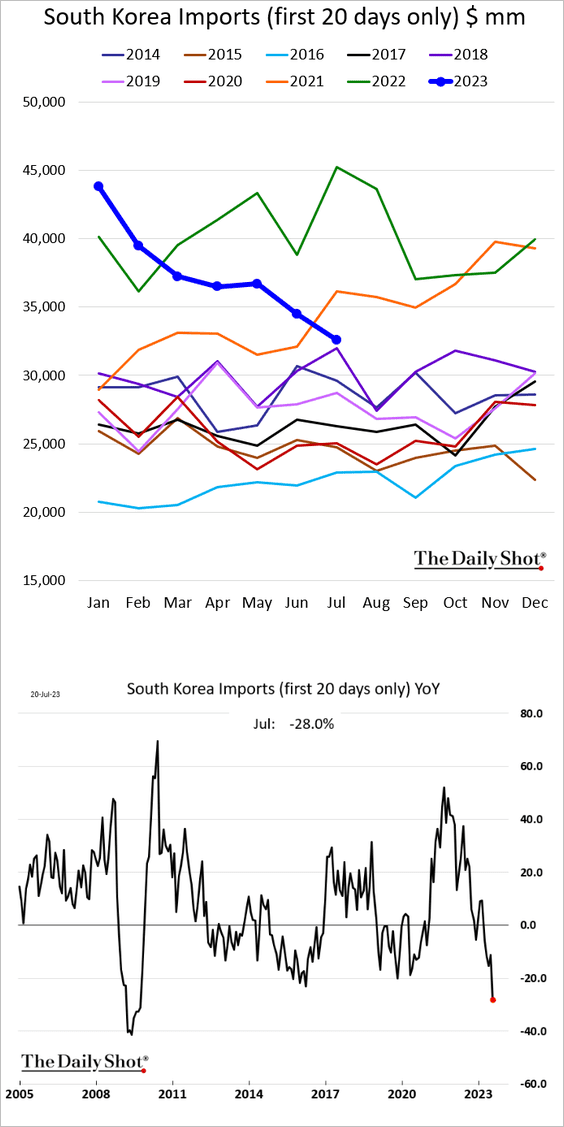
• Imports are crashing.
——————–
2. Australia’s manufacturing activity has stabilized, but services are now in contraction territory.
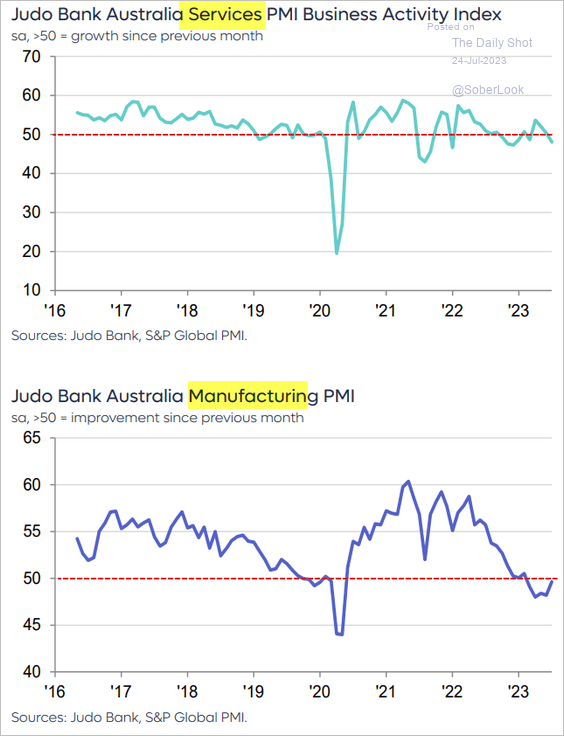 Source: S&P Global PMI
Back to Index
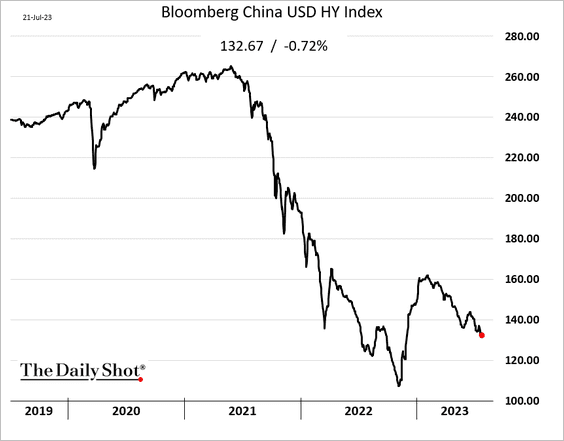
China
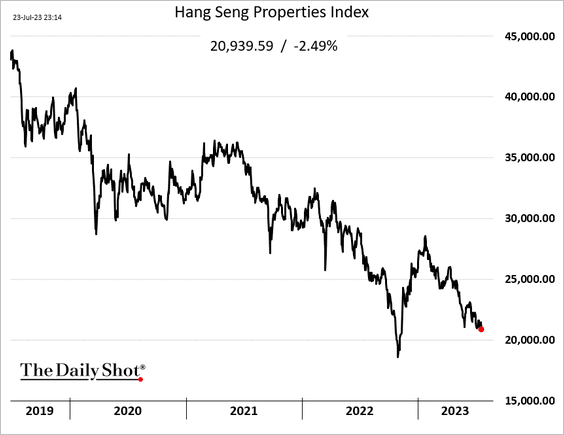
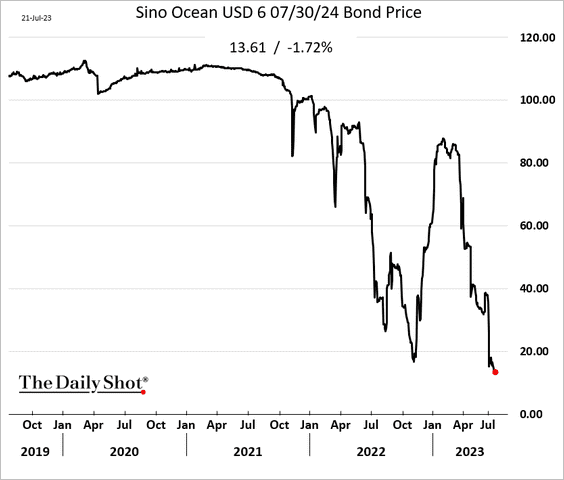
1. The property developer credit crisis continues to fester.
• Developers’ share prices:
• USD-denominated HY bond prices:
– Country Garden bond price:
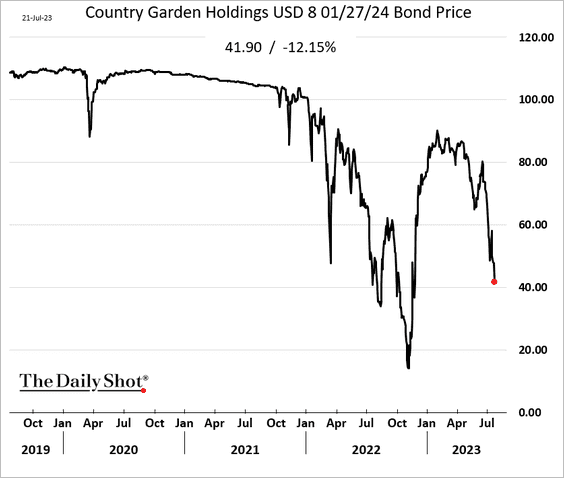
 Source: Reuters Read full article
– Sino Ocean bond price:
• China’s real estate sector contribution to economic growth:
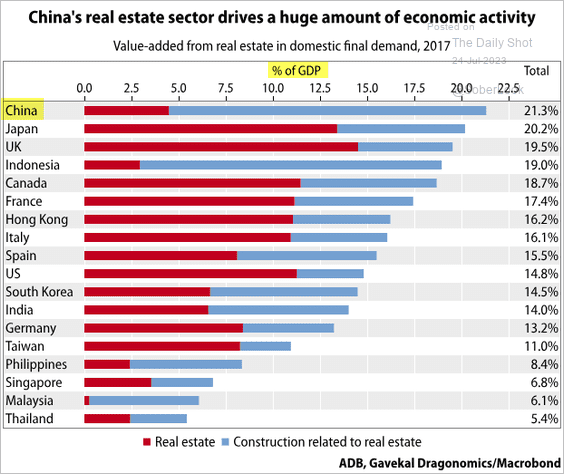 Source: Gavekal Research
– The drag on GDP:
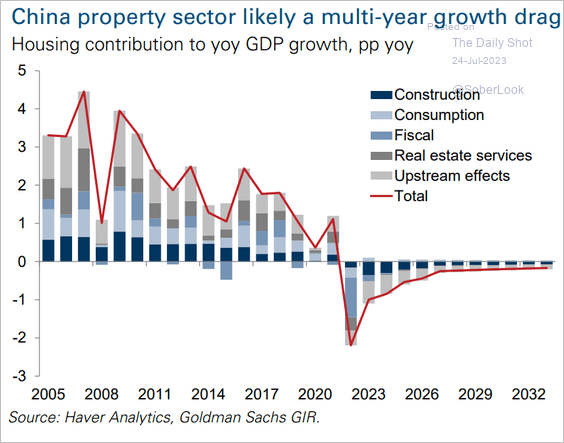 Source: Goldman Sachs
– PBoC to the rescue?
 Source: @economics Read full article
——————–
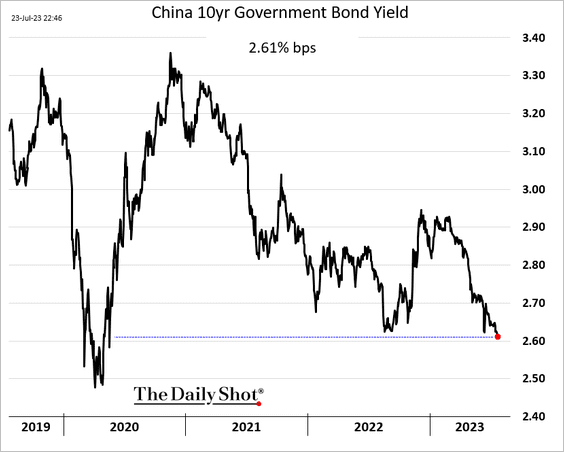
2. Bond yields keep drifting lower.
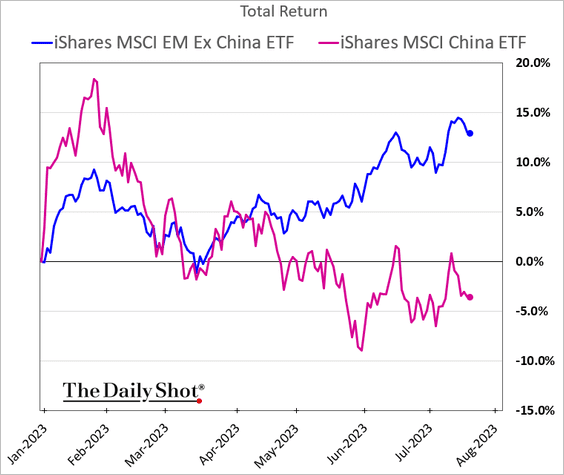
3. The stock market continues to underperform EM peers.
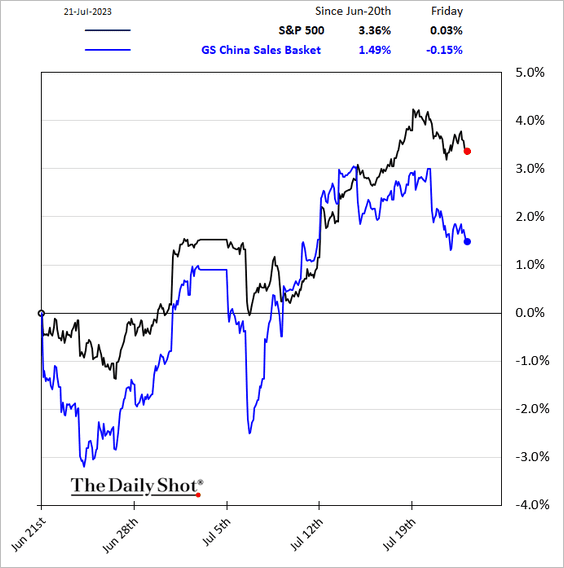
US companies with significant sales in China have been underperforming in recent days.
Back to Index
Emerging Markets
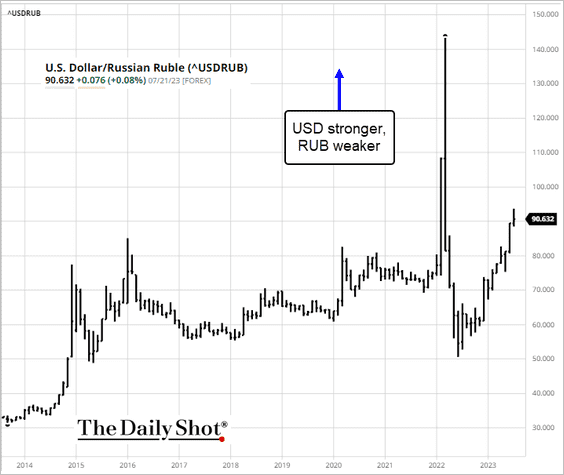
1. Russia’s central bank hiked rates to defend the ruble.
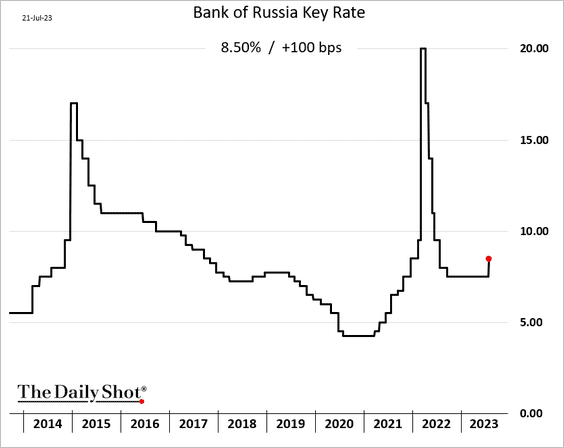
 Source: barchart.com
——————–
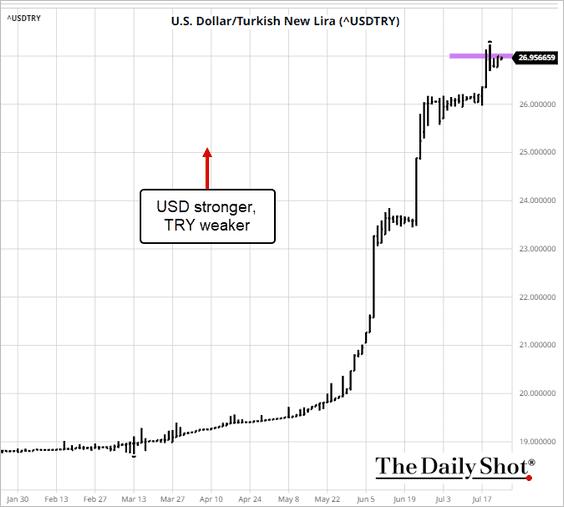
2. The Turkish lira continues to hit record lows.
3. The iShares Brazil ETF (EWZ) is testing long-term resistance but is not yet overbought.
 Source: Symbolik; {h/t} @TaviCosta
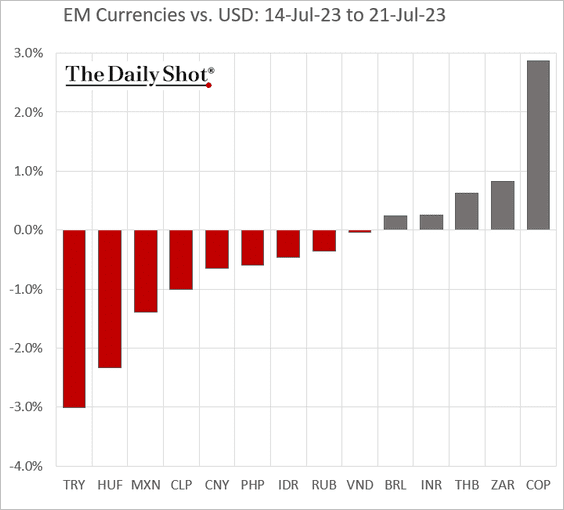
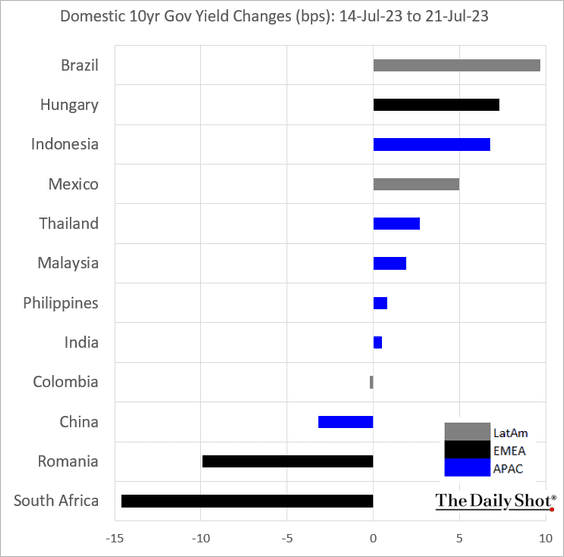
4. Next, we have some performance data from last week.
• Currencies:
• Bond yields:
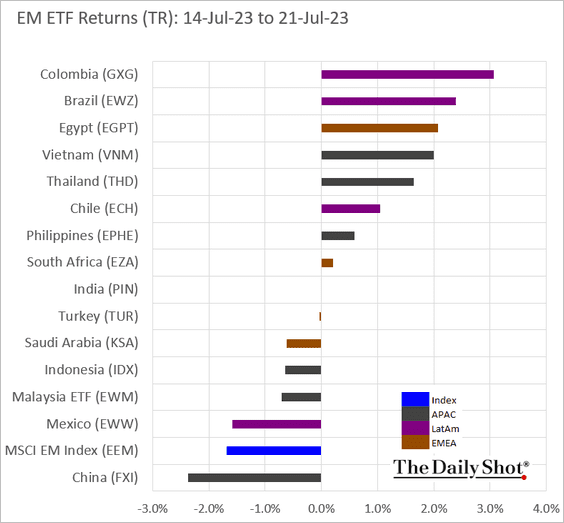
• Equity ETFs:
Back to Index
Commodities
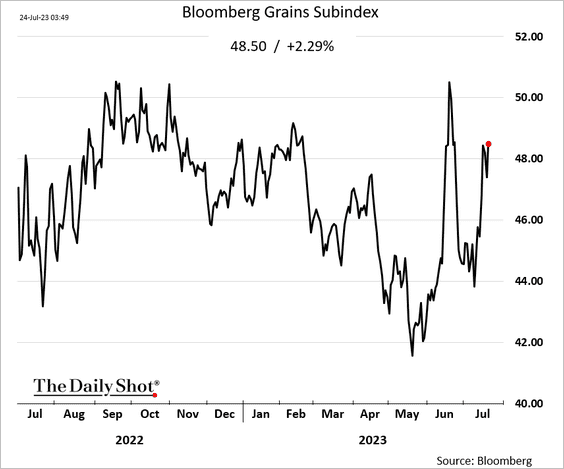
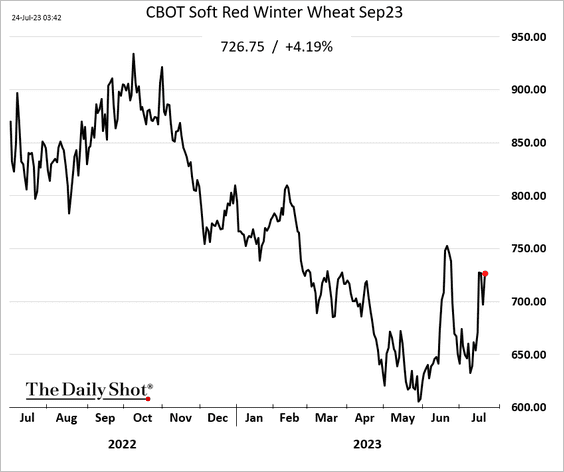
1. Grain prices resumed their rally as Russia continues to hit Ukraine’s port and grain storage infrastructure.
——————–
2. Rice prices have been surging.
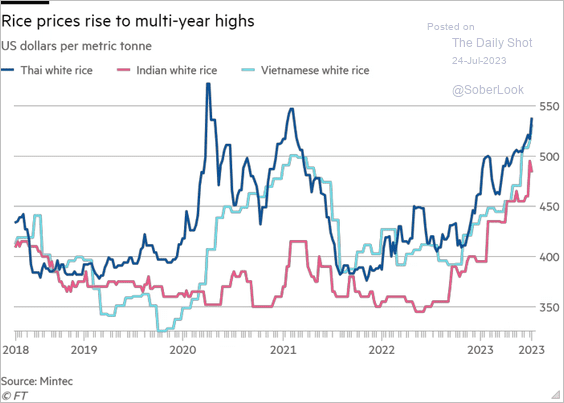 Source: @financialtimes Read full article
3. This chart shows US corn exports to Mexico.
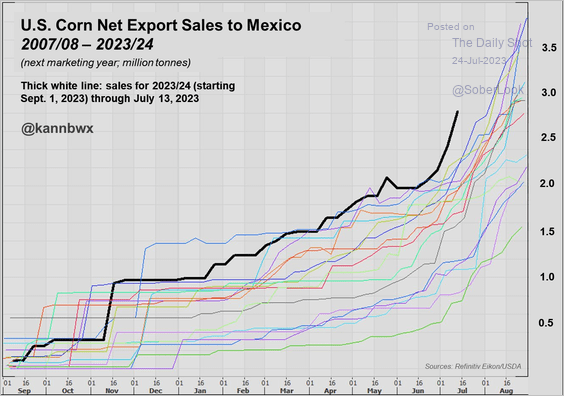 Source: @kannbwx
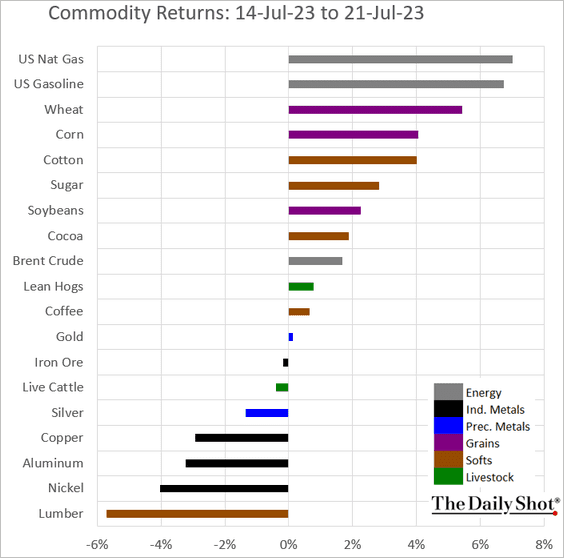
4. Here is last week’s performance across key commodity markets.
Back to Index
Equities
1. On Friday, the Dow managed to eke out its tenth consecutive gain.
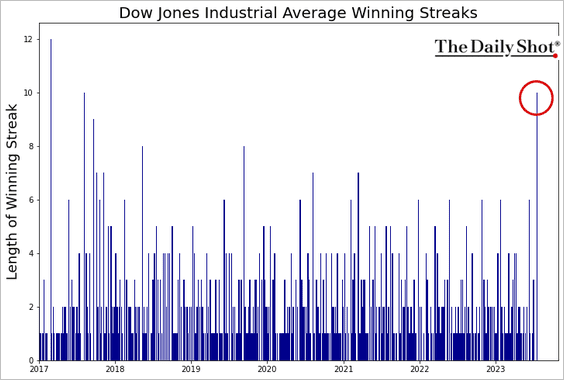
Transport shares have been outperforming, which some view as a bullish sign.
![]()
——————–
2. Deutsche Bank’s positioning indicator continues to climb further into “overweight” territory.
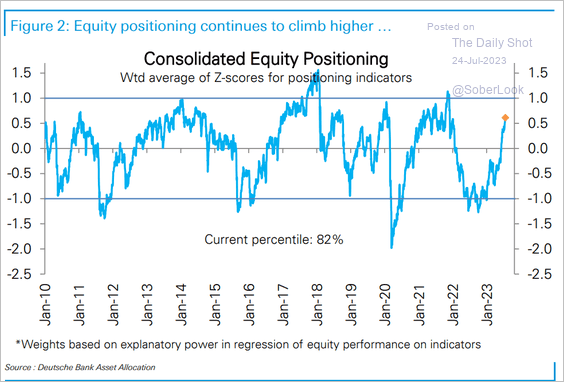 Source: Deutsche Bank Research
• Retail investors are much more upbeat than institutional investors.
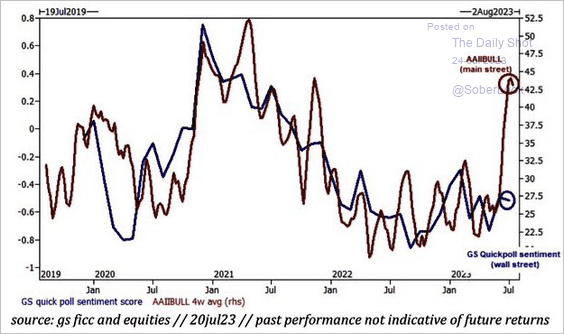 Source: Goldman Sachs; @Marlin_Capital
• This chart shows the sentiment indicator from CS.
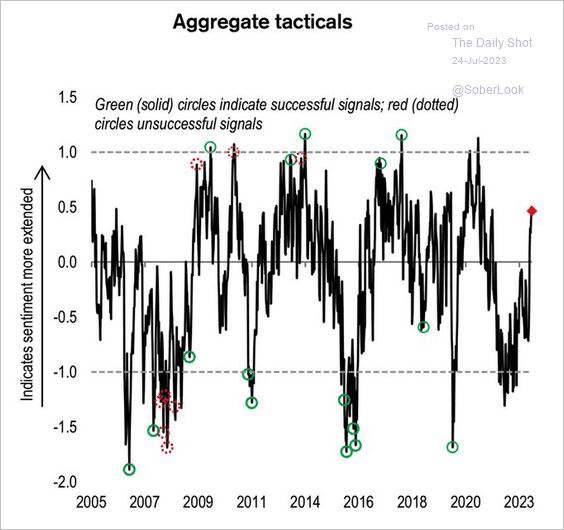 Source: @Credit Suisse; WallStJesus
Financial advisors are increasingly bullish.
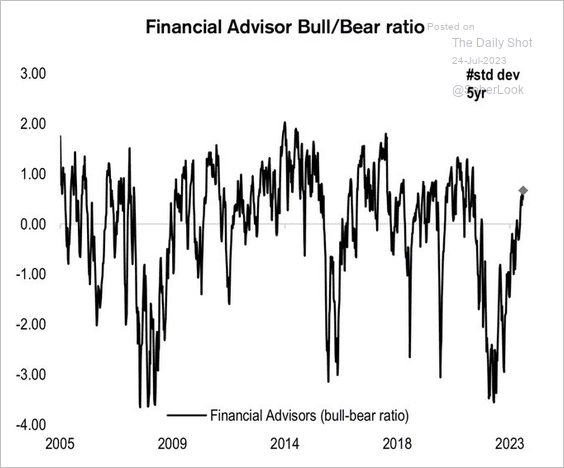 Source: @Credit Suisse; WallStJesus
• Options activity shows rising optimism.
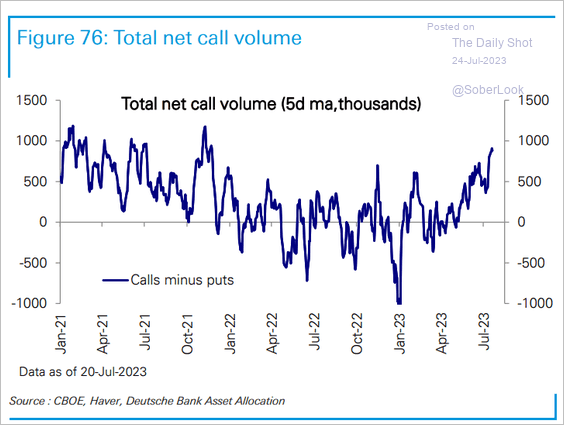 Source: Deutsche Bank Research
Here is the net call volume by sector.
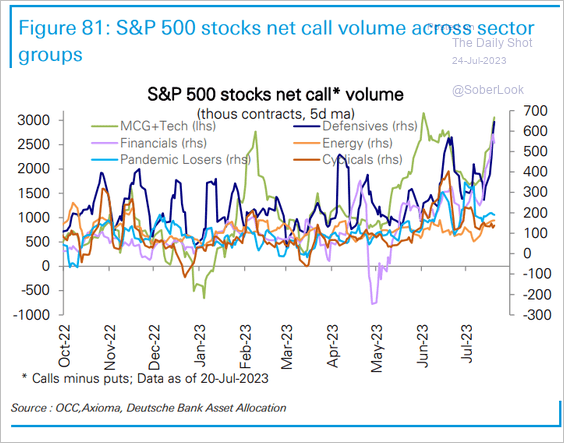 Source: Deutsche Bank Research
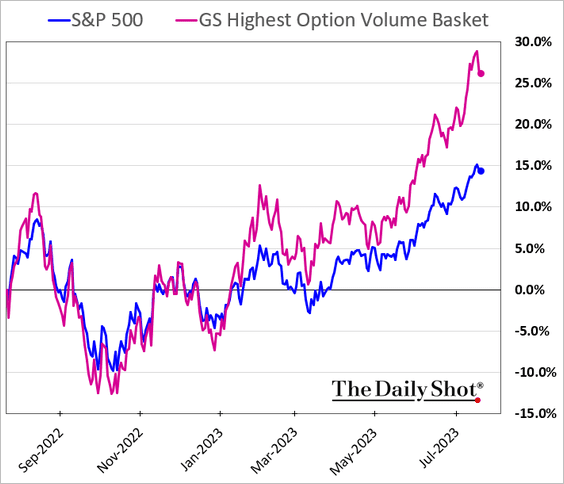
• Stocks with the highest options volumes have been outperforming.
——————–
3. Price movements have been larger than implied by the options market.
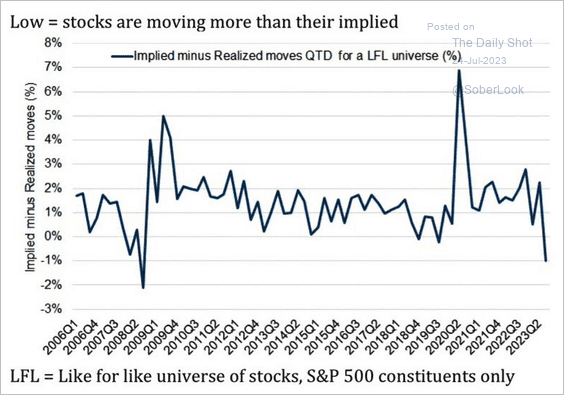 Source: Goldman Sachs; @Marlin_Capital
Companies that beat Q2 earnings estimates have underperformed so far.
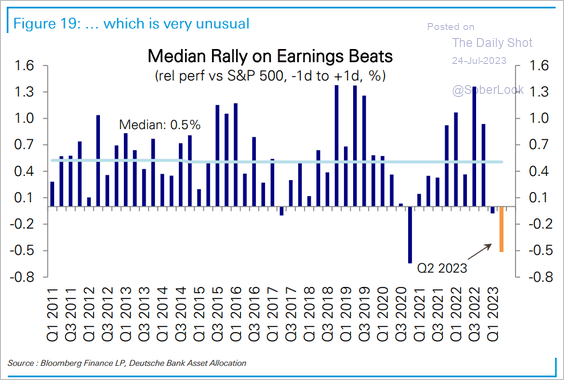 Source: Deutsche Bank Research
——————–
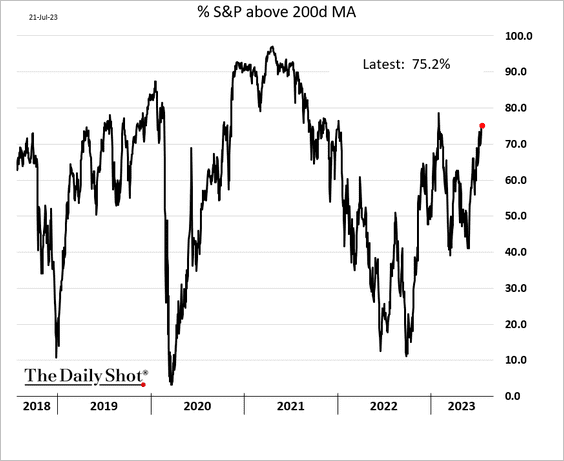
4. Market breadth continues to improve.
5. US homebuilding stocks have led moves in housing starts over the past year.
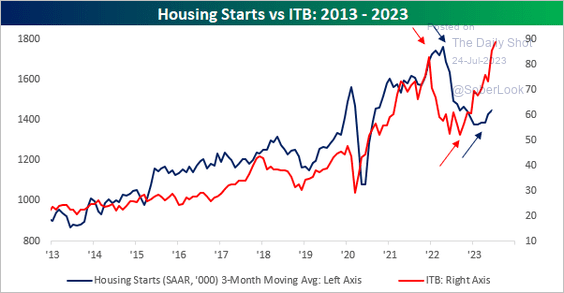 Source: @bespokeinvest
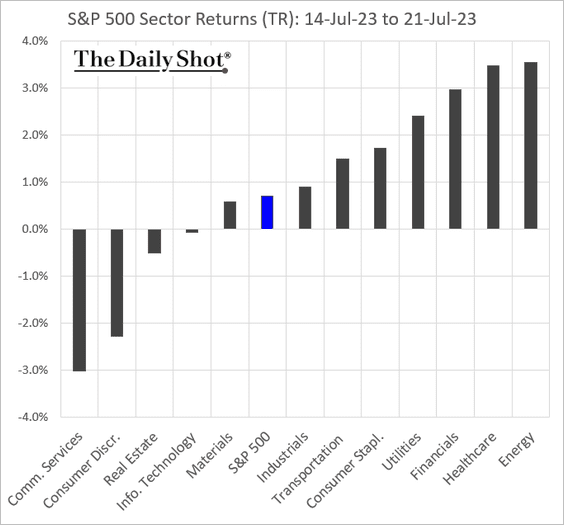
6. Next, we have some performance data from last week.
• Sectors:
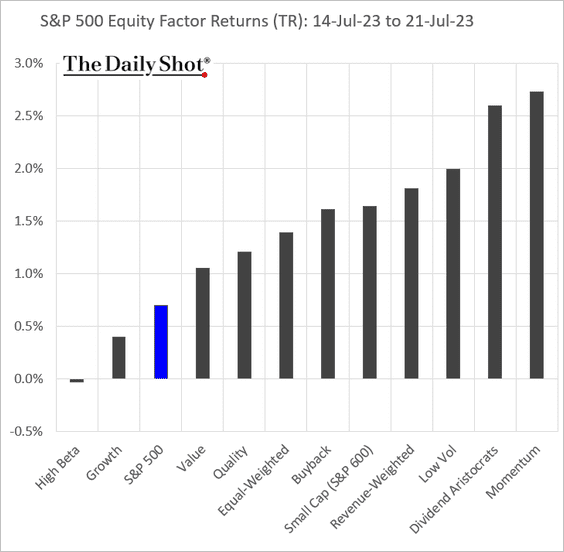
• Equity factors:
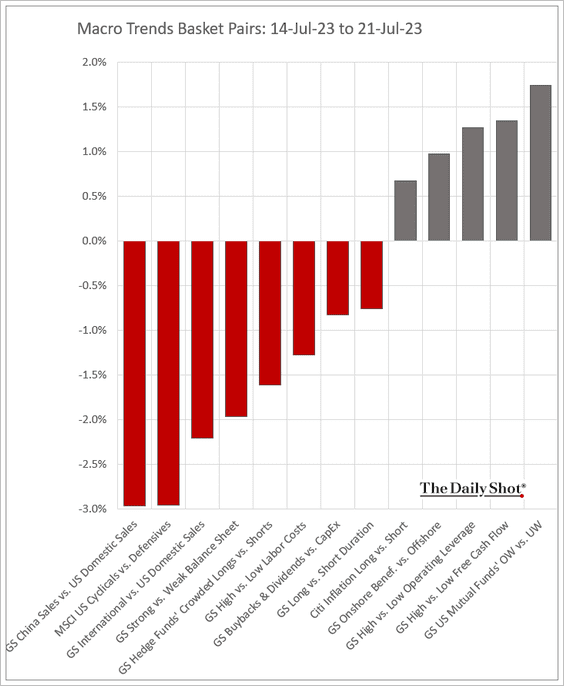
• Macro basket pairs’ relative performance:
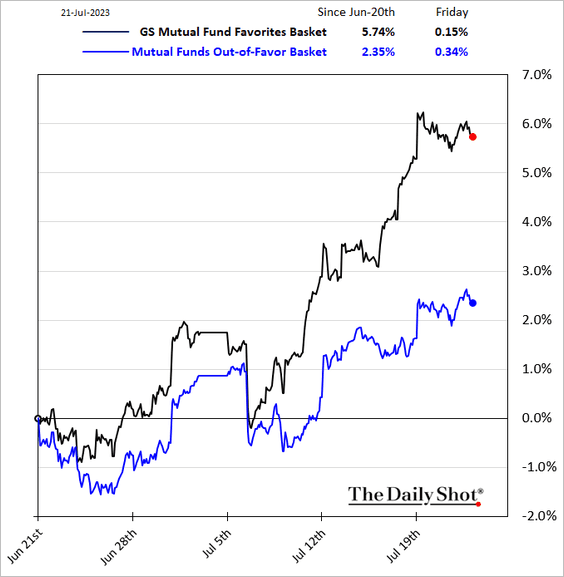
– Mutual funds’ picks have been outperforming.
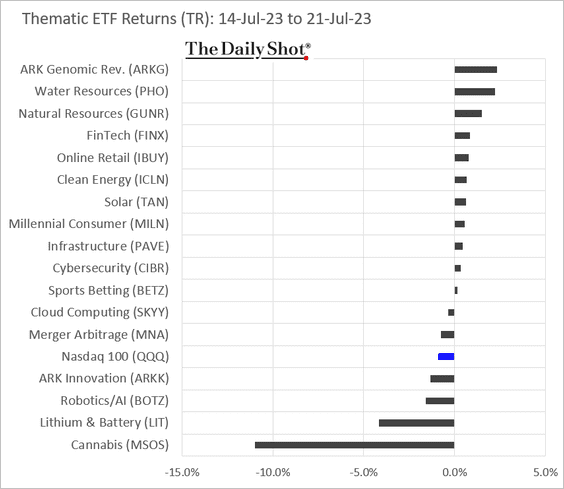
• Thematic ETFs:
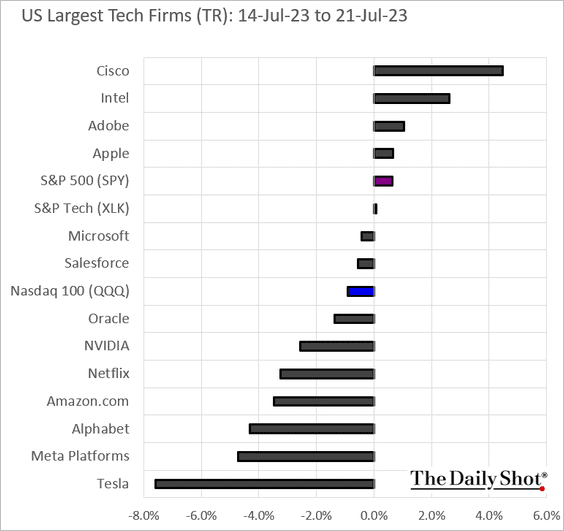
• Largest US tech firms:
——————–
Back to Index
Credit
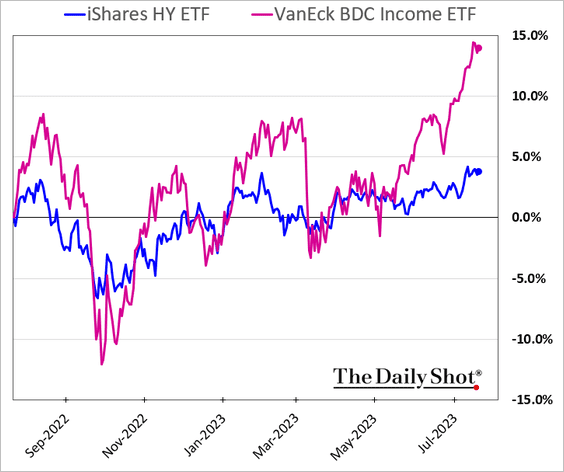
1. BDC prices have been surging.
2. US investment-grade companies were able to cut costs in Q1.
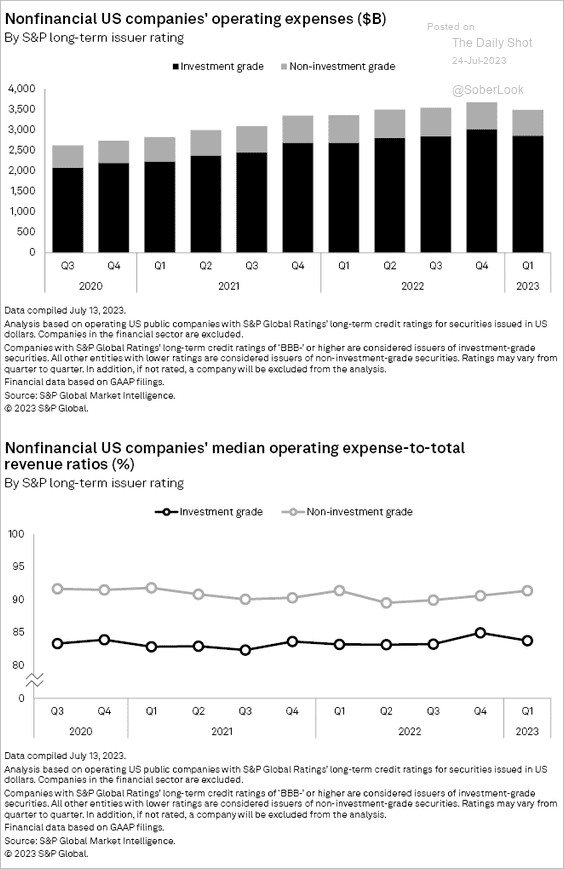 Source: S&P Global Market Intelligence
3. Investors have no appetite for banks’ preferred equity.
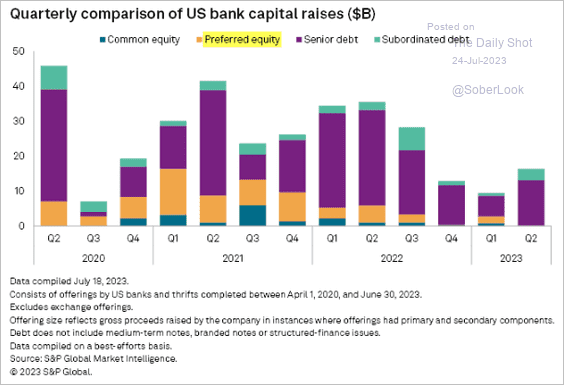 Source: S&P Global Market Intelligence
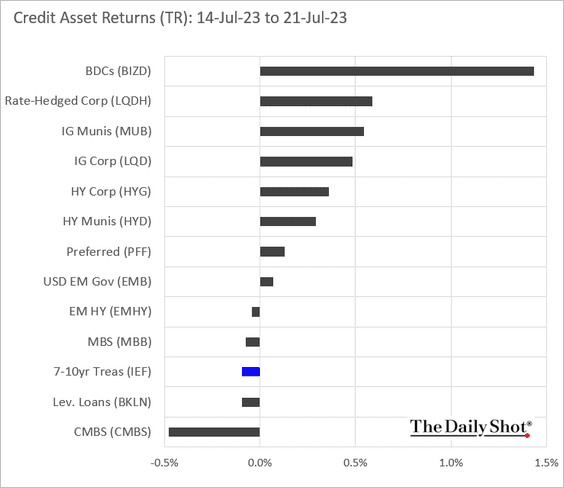
4. Here is last week’s performance across credit asset classes.
Back to Index
Rates
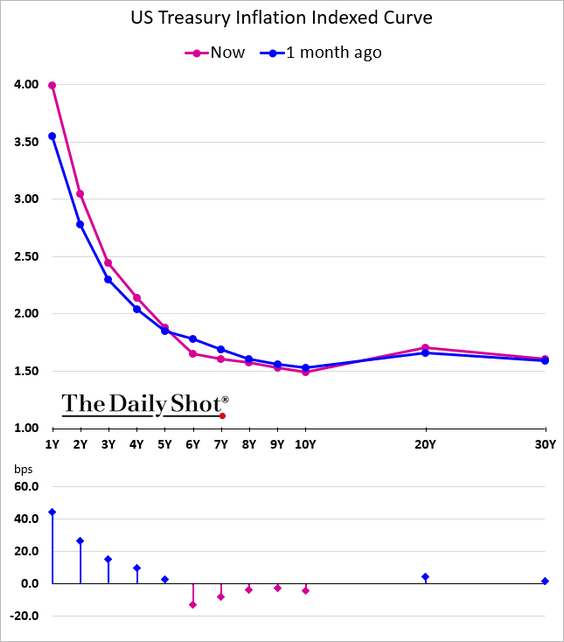
1. The US real yield curve is increasingly inverted as short-term inflation expectations ease.
2. Longer-maturity Treasuries tend to outperform after the last Fed rate hike.
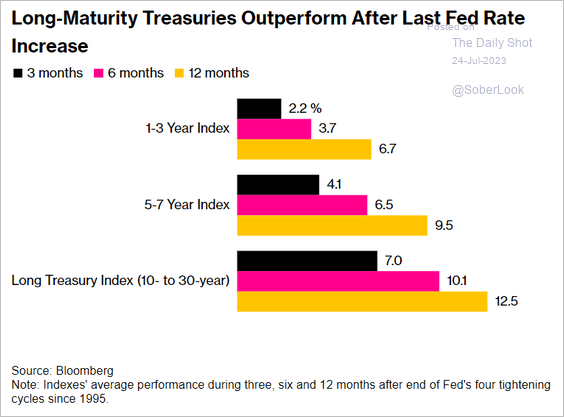 Source: @markets Read full article
Back to Index
Global Developments
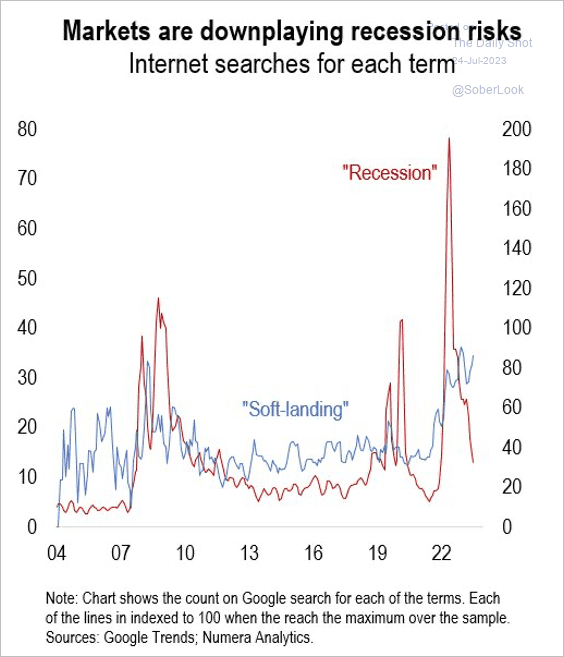
1. Internet searches for “soft landing” increased as fears of a deep recession faded.
 Source: Numera Analytics (@NumeraAnalytics)
2. Investors see monetary policy as being tight relative to fiscal policy.
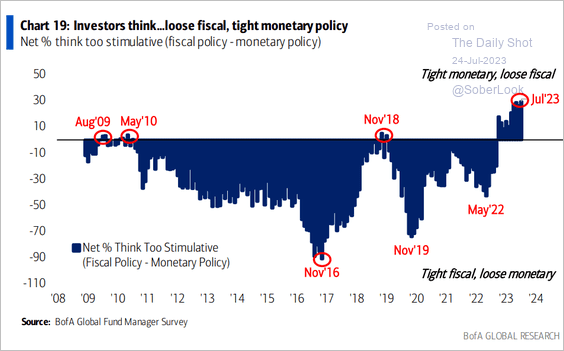 Source: BofA Global Research
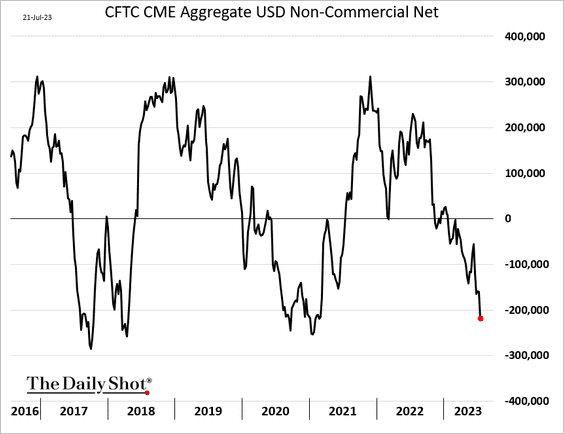
3. Traders are boosting their bets against the US dollar.
This chart shows asset manager positioning.
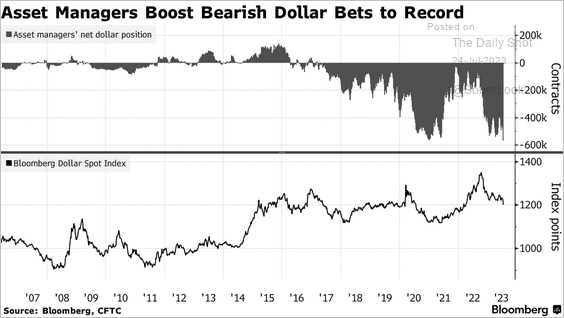 Source: @markets Read full article
——————–
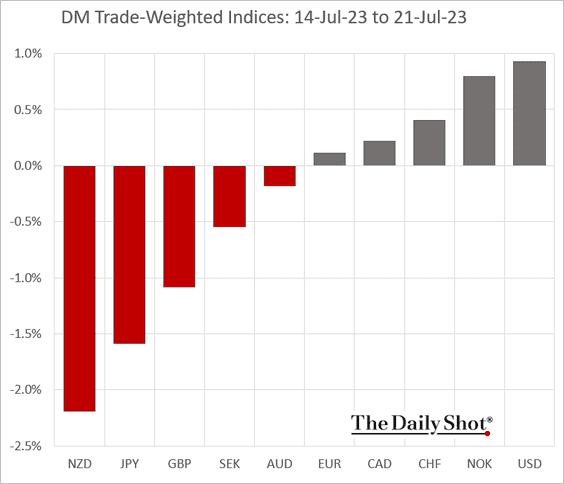
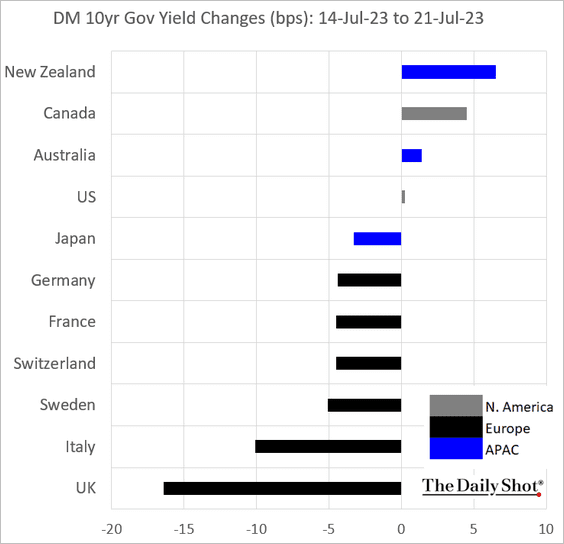
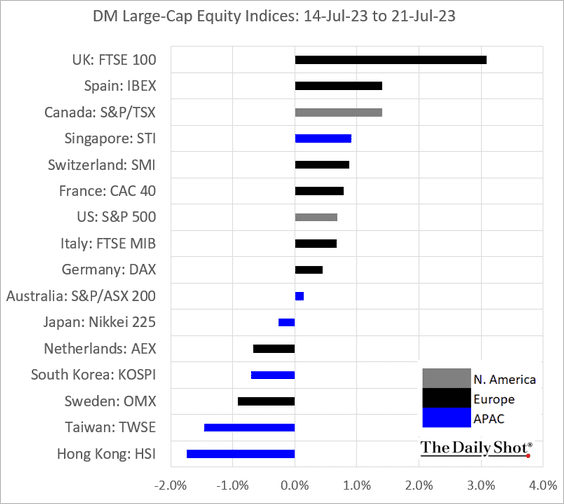
4. Here is last week’s DM performance data.
• Currency indices:
• Bond yields:
• Large-cap equity indices:
——————–
Food for Thought
1. US import growth by source:
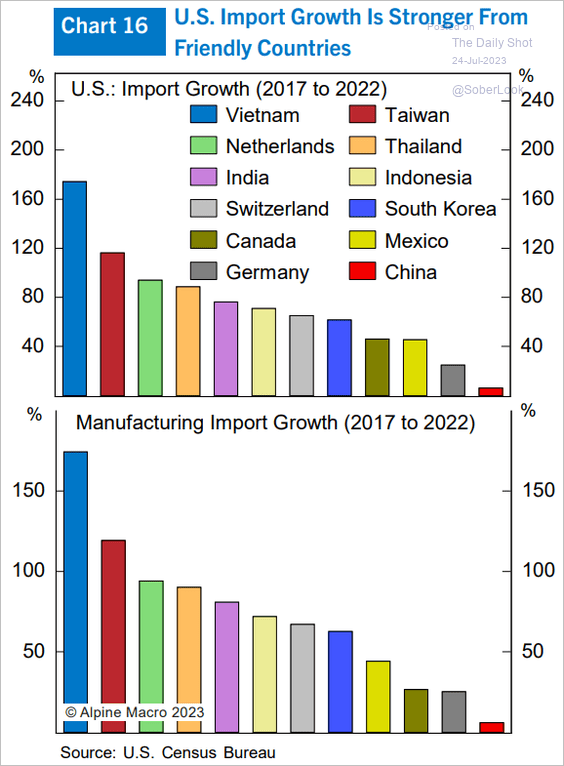 Source: Alpine Macro
2. China’s birth rate:
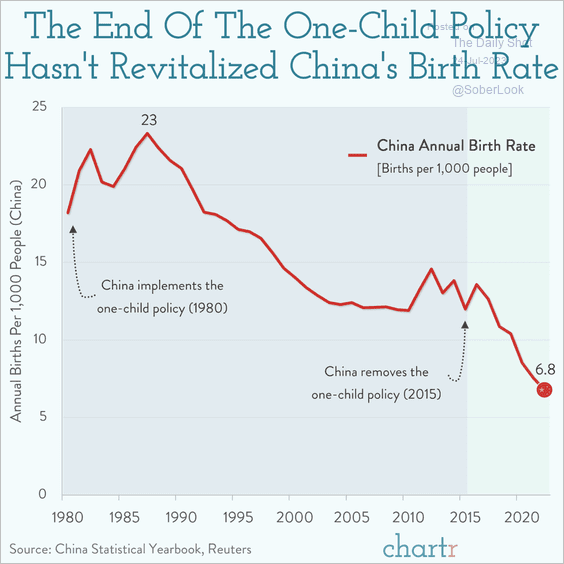 Source: @chartrdaily
3. Emigrating millionaires:
 Source: Statista
4. Percent of state populations that moved to Texas in 2020:
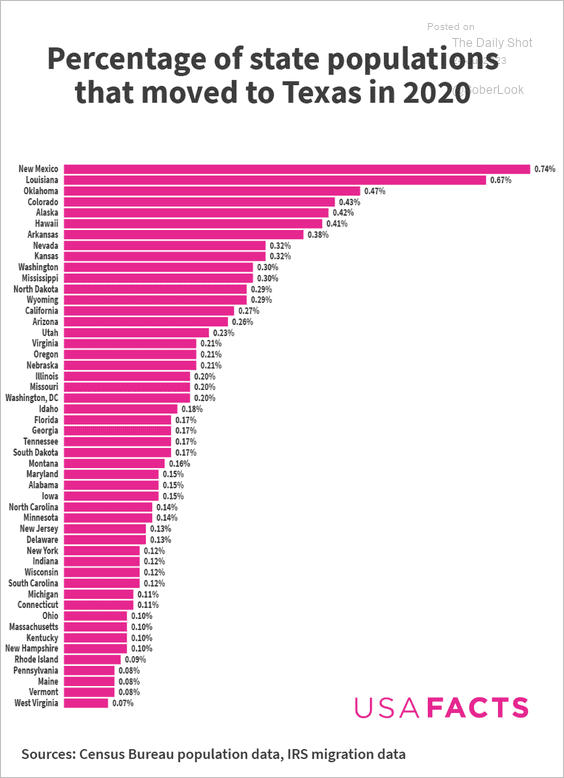 Source: USAFacts
5. US adults who financially support (or don’t support) their parents:
 Source: U.S. Census Bureau Read full article
6. High school dropout rates:
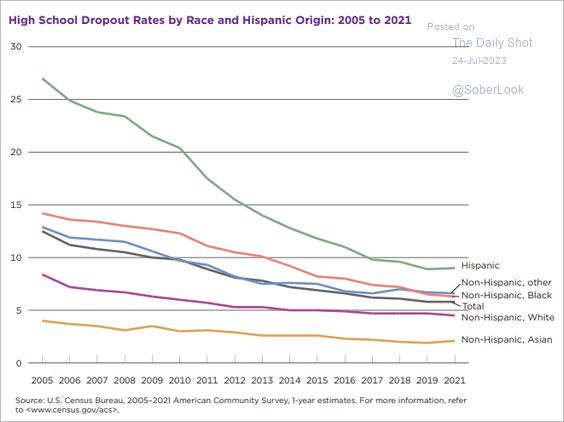 Source: U.S. Census Bureau Read full article
7. Women in space:
 Source: Statista
——————–
Back to Index