
The Daily Shot: 25-Jul-23
• The United States
• Canada
• The United Kingdom
• The Eurozone
• Europe
• Japan
• Asia-Pacific
• China
• Cryptocurrency
• Commodities
• Energy
• Equities
• Credit
• Rates
• Food for Thought
The United States
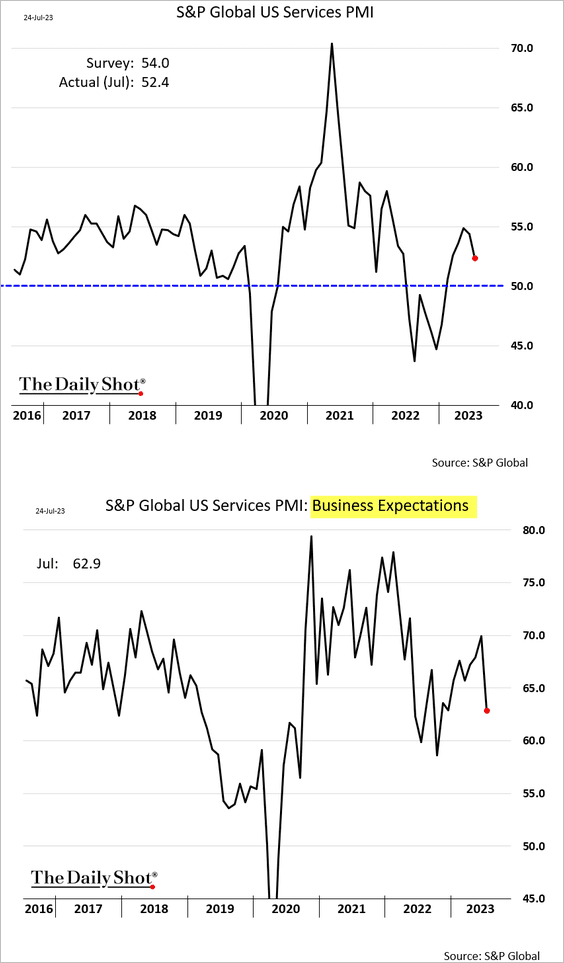
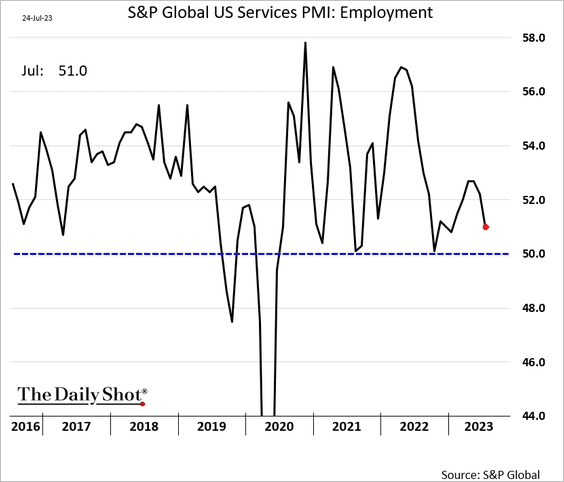
1. The services PMI index from S&P Global declined in July but remained in growth territory (PMI > 50). Business outlook and hiring softened.
 Source: Reuters Read full article
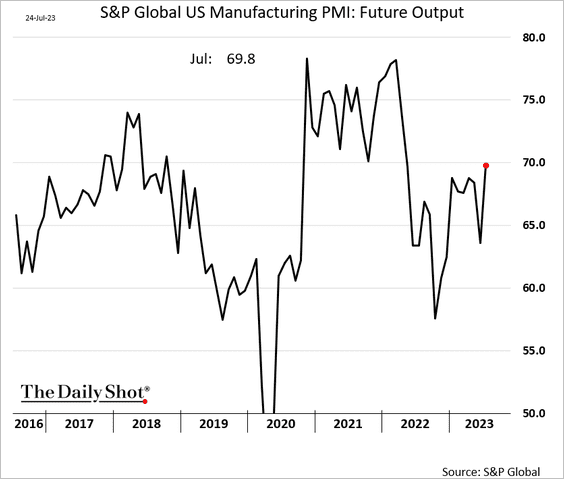
• On the other hand, factory activity showed signs of improvement, …
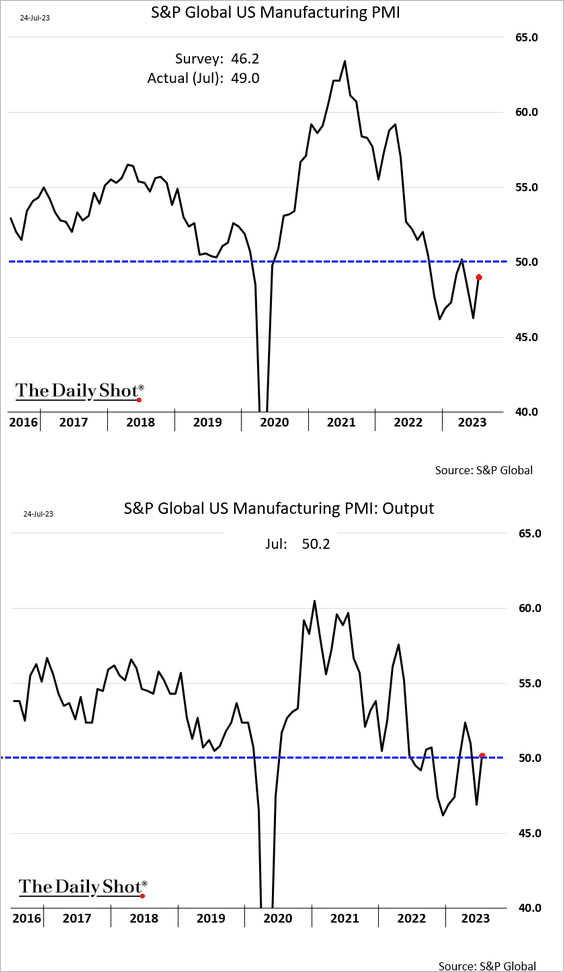
… as outlook brightened.
• Separately, the rising stock/bond ratio points to a recovery in the ISM manufacturing PMI.
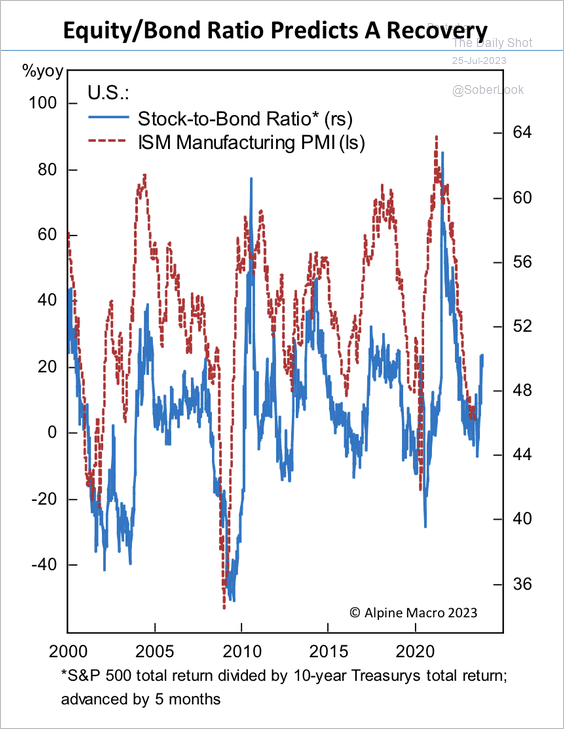 Source: Alpine Macro
——————–
2. Easing financial market conditions will have some Federal Reserve officials advocating for further tightening.
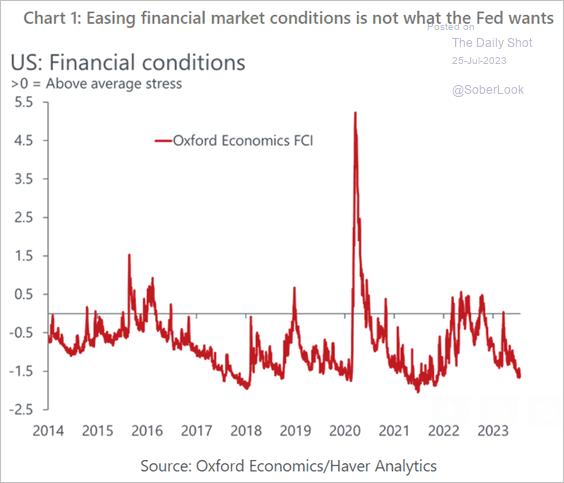 Source: Oxford Economics
3. Fed officials track supercore inflation closely because it tends to align with wage growth.
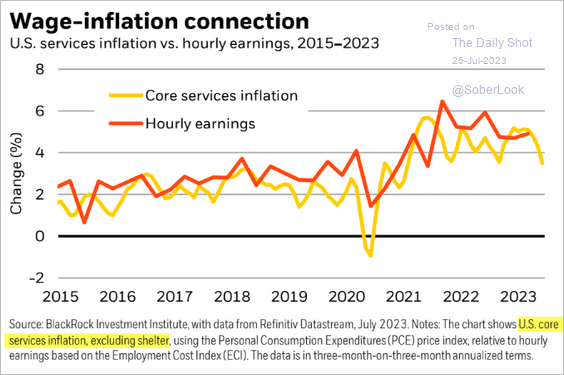 Source: BlackRock Investment Institute
4. Labor market imbalances continue to ease as job openings moderate.
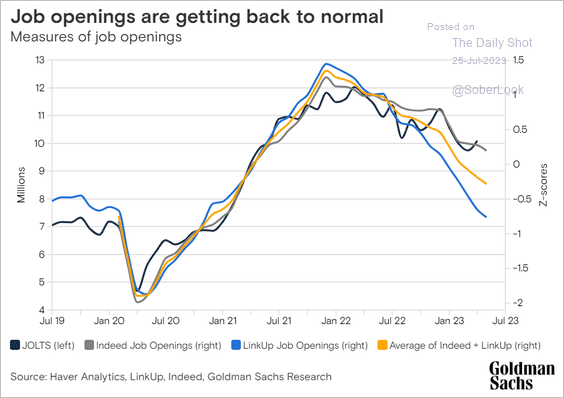 Source: Goldman Sachs
Fewer firms are mentioning labor shortages on earnings calls.
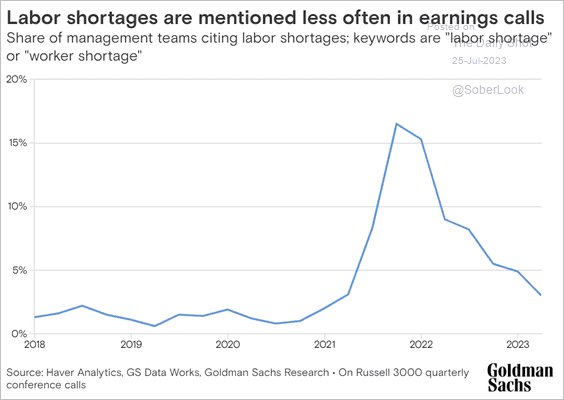 Source: Goldman Sachs
——————–
5. Next, we have some data on student debt.
• by income:
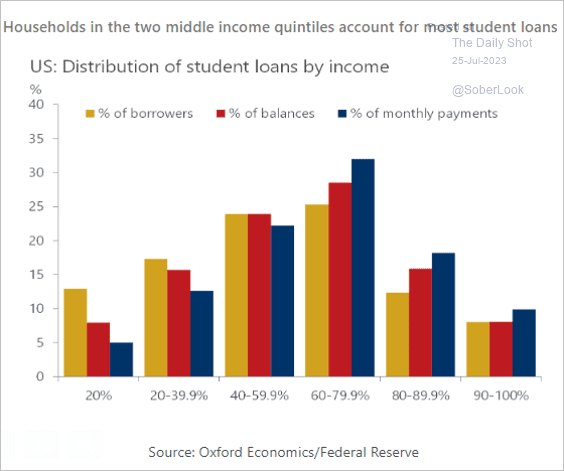 Source: Oxford Economics
• by age group:
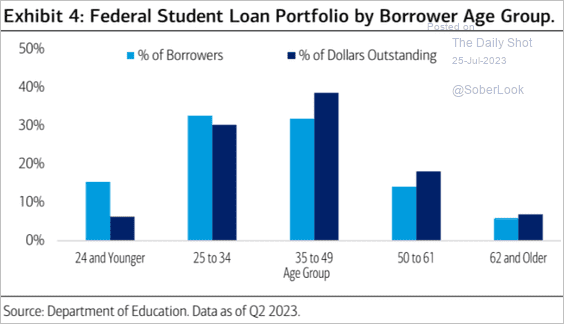 Source: Merrill Lynch
——————–
6. The AEI Housing Center analysis suggests that the year-over-year home price changes never dipped below zero in this cycle and are now rebounding.
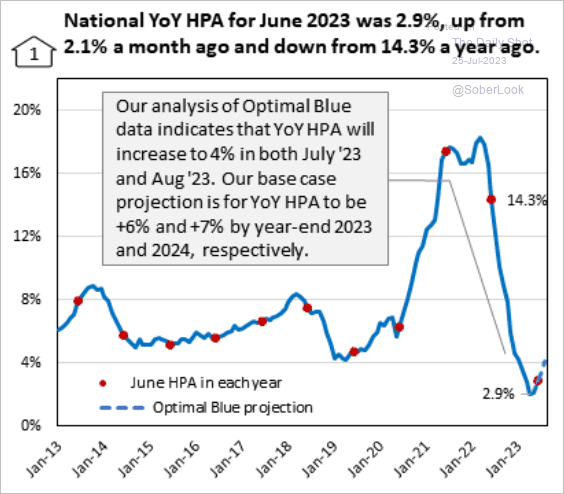 Source: AEI Housing Center
Back to Index
Canada
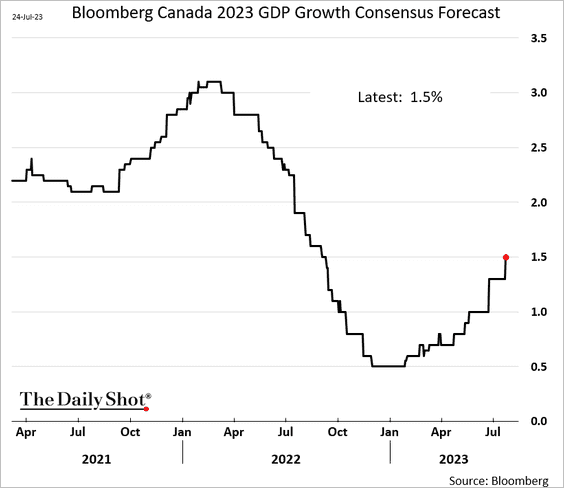
1. Economists are revising this year’s GDP growth higher.
2. Collective bargaining has sharply boosted wages in Canada.
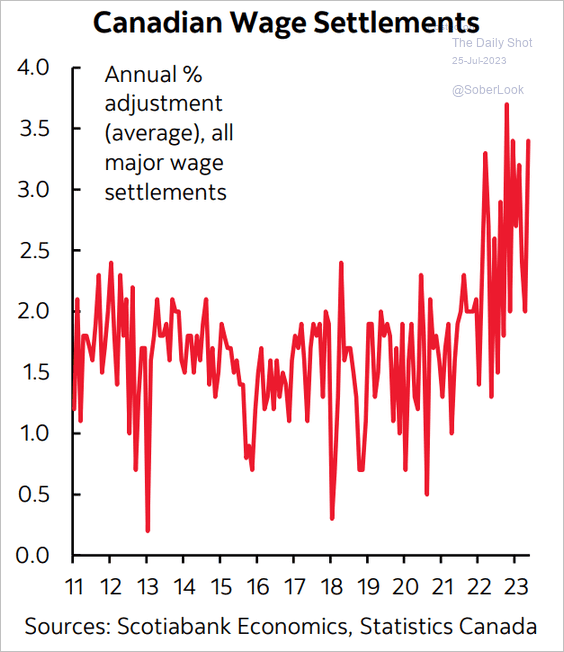 Source: Scotiabank Economics
Back to Index
The United Kingdom
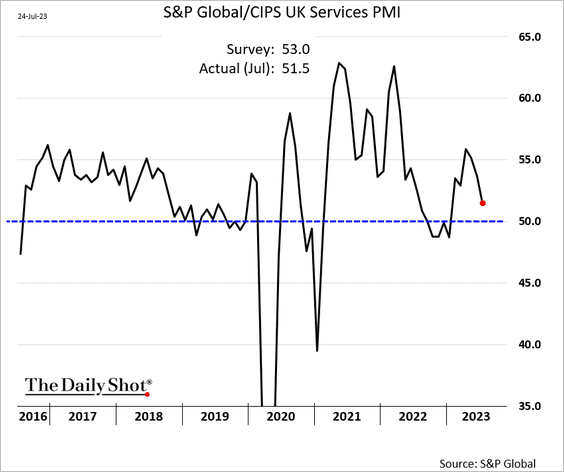
1. Just like in the US, service sector growth is slowing.
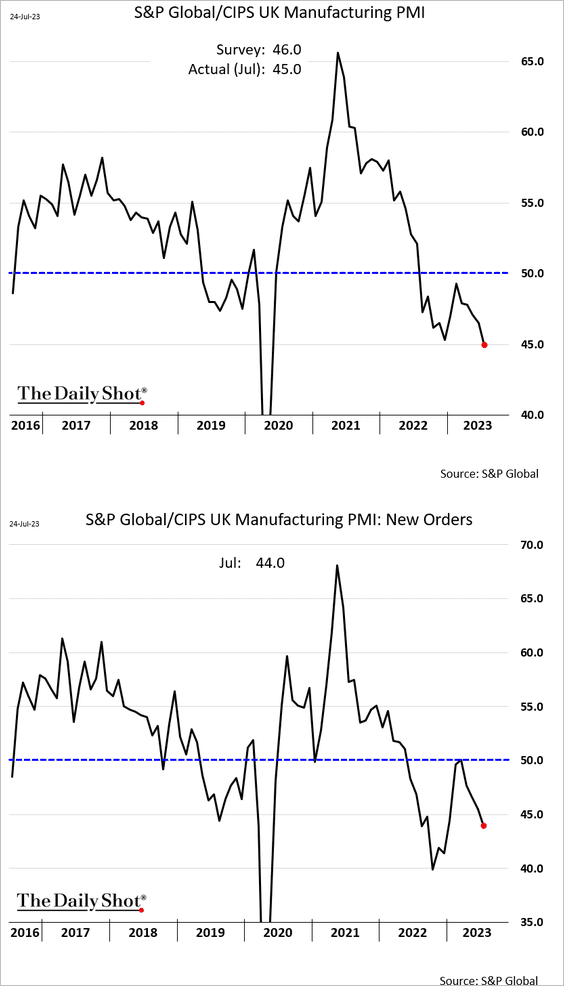
• UK manufacturing activity moved deeper into contraction territory.
• Output price inflation across services and manufacturing is moderating, …
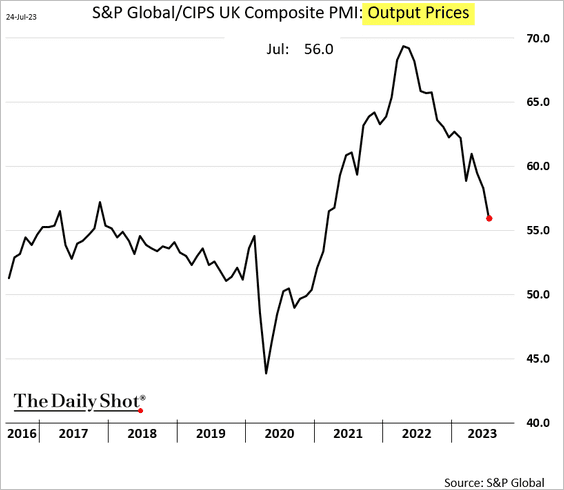
… signaling declines in the CPI.
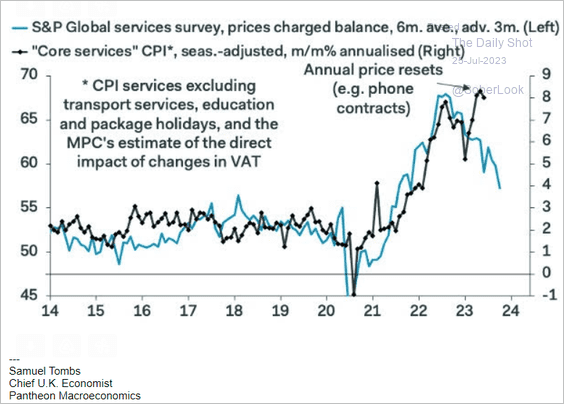 Source: Pantheon Macroeconomics
——————–
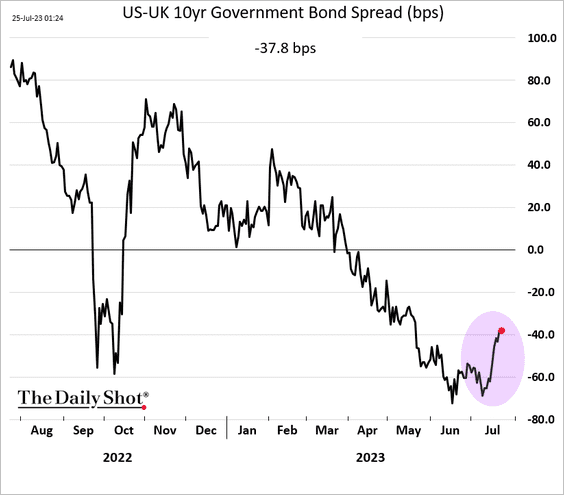
2. The US-UK 10-year spread is tightening.
Back to Index
The Eurozone
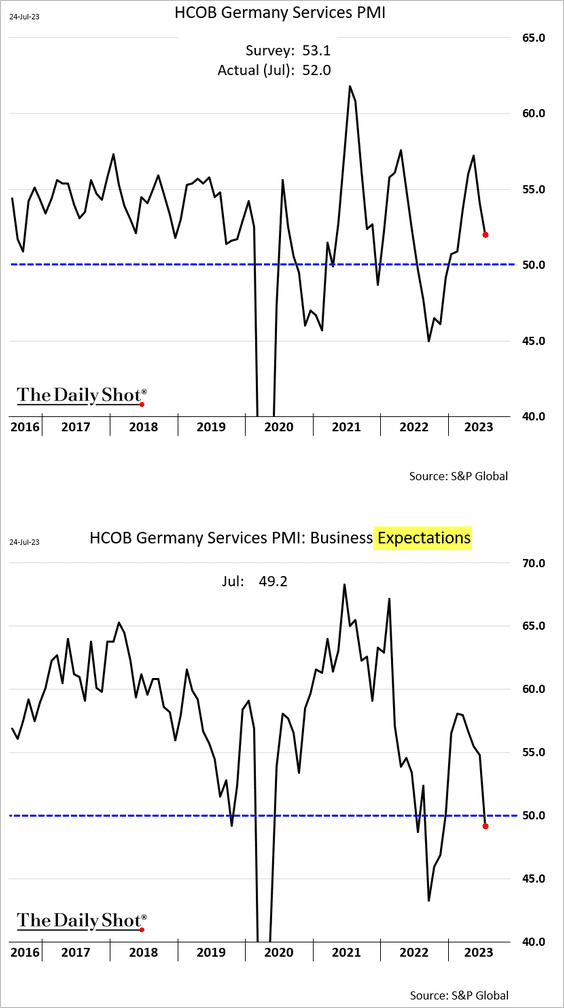
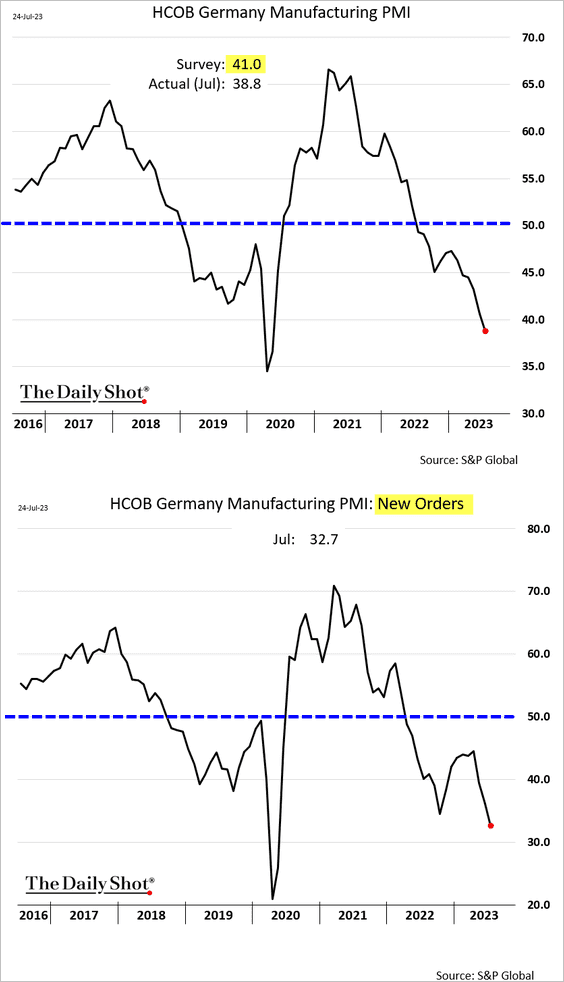
1. As we saw yesterday, Germany’s PMI figures point to economic headwinds.
– Services activity is slowing, and business outlook is deteriorating.
– Manufacturing contraction is accelerating as demand tumbles.
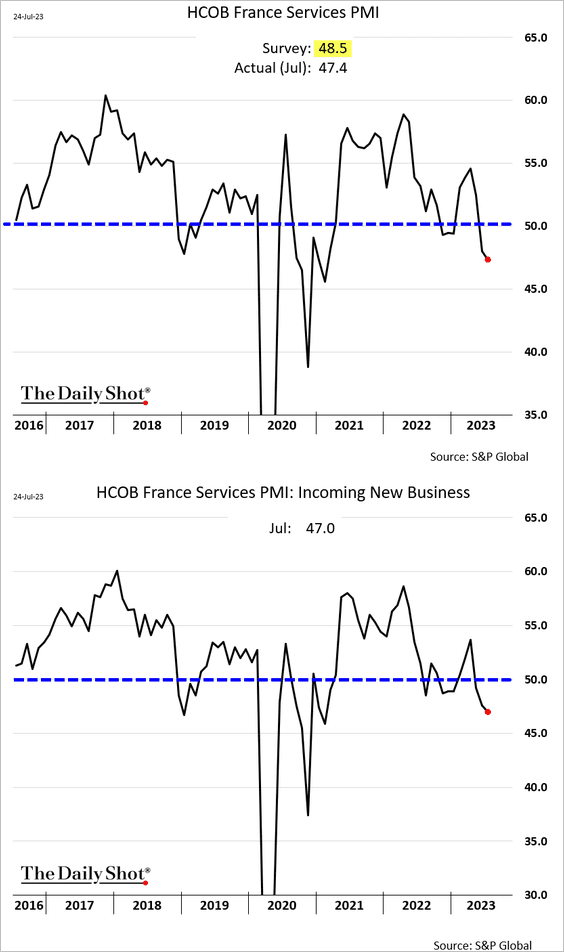
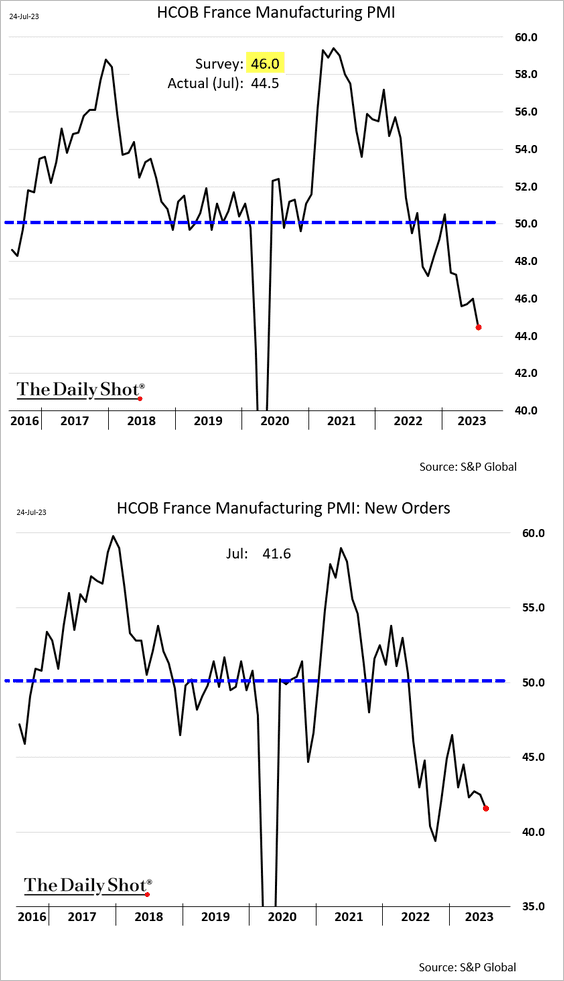
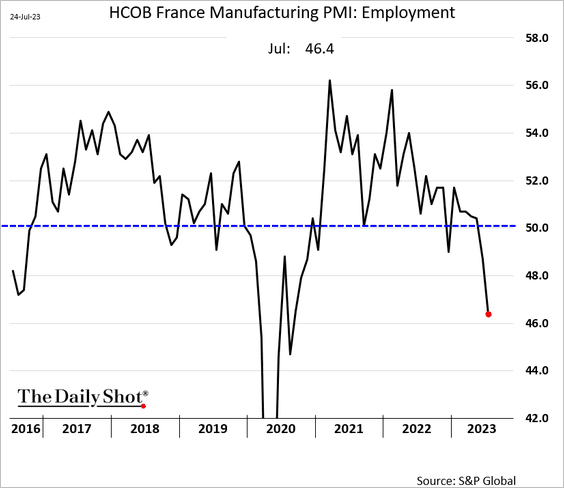
• French PMI indicators point to a GDP contraction.
– Services:
– Manufacturing:
– Manufacturing employment:
– French composite PMI vs. GDP:
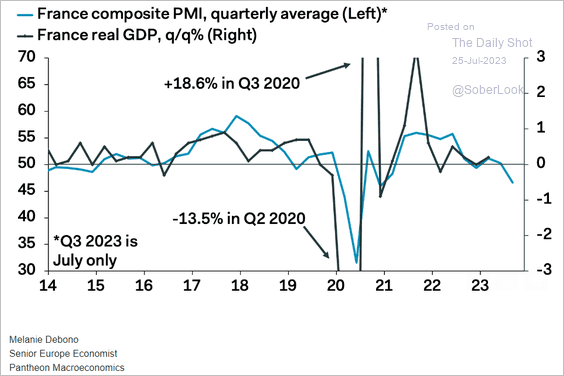 Source: Pantheon Macroeconomics
• The euro-area composite PMI shows shrinking business activity.
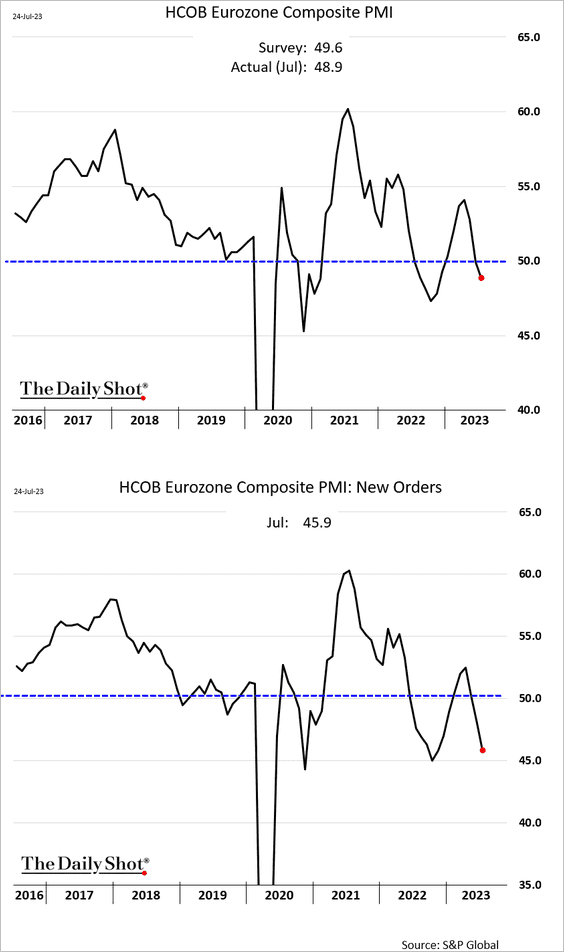
• Recession?
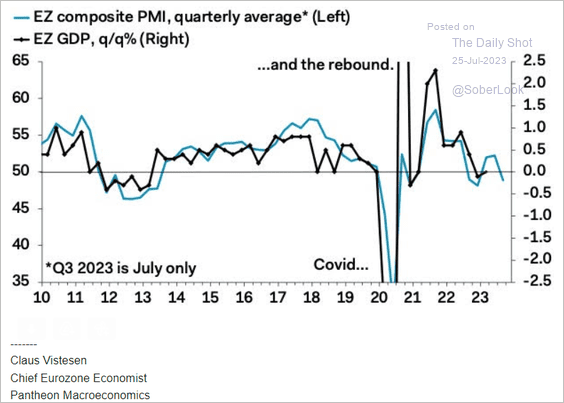 Source: Pantheon Macroeconomics
 Source: Reuters Read full article
——————–
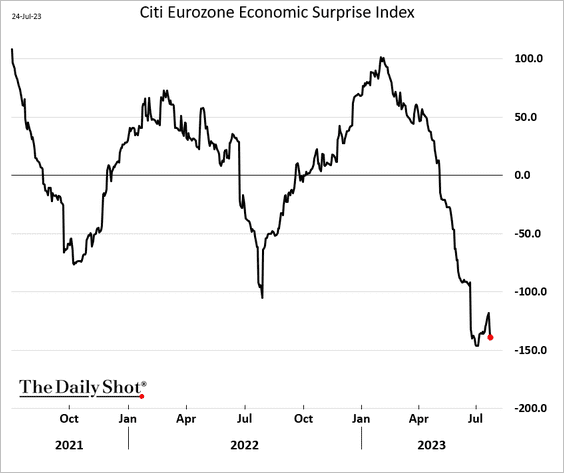
2. The downside PMI surprise sent the Citi Economic Surprise Index sharply lower.
3. Bankruptcies have been rising.
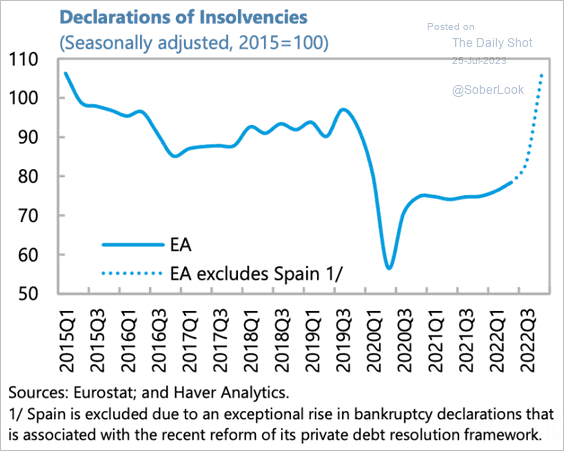 Source: IMF Read full article
4. This table shows potential ECB scenarios this week and expected market responses (from ING).
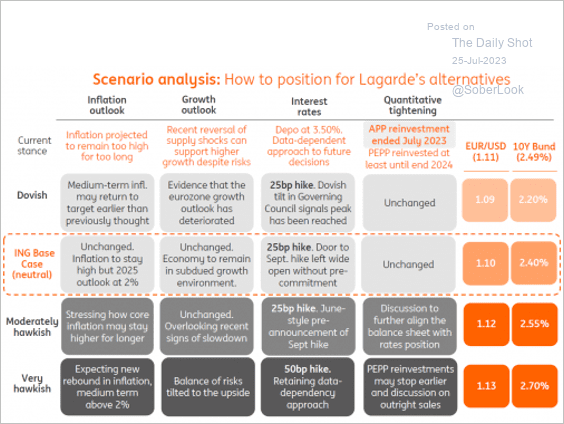 Source: ING
A 25 bps rate hike this week is baked in, and there is an 80% chance of another 25 bps hike this year.
Back to Index
Europe
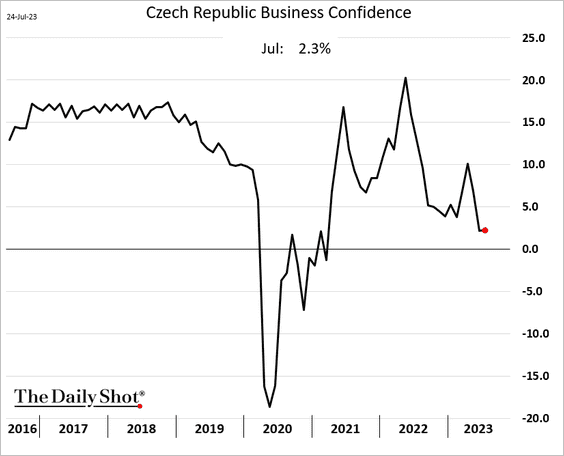
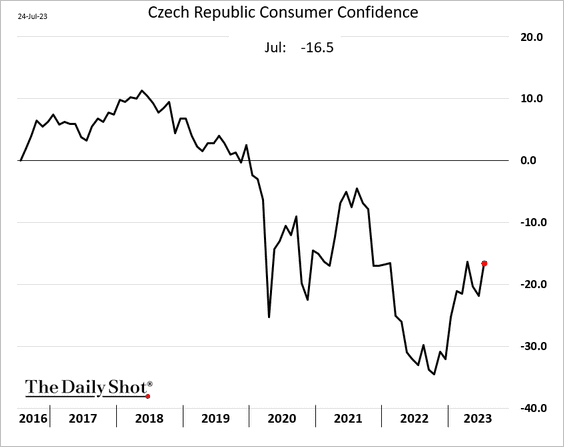
1. Czech business confidence was stable this month, and consumer sentiment is rebounding.
——————–
2. Earnings growth has been mixed across sectors, while expectations sharply declined alongside weaker economic data. Could we see surprise earnings beats? (2 charts)
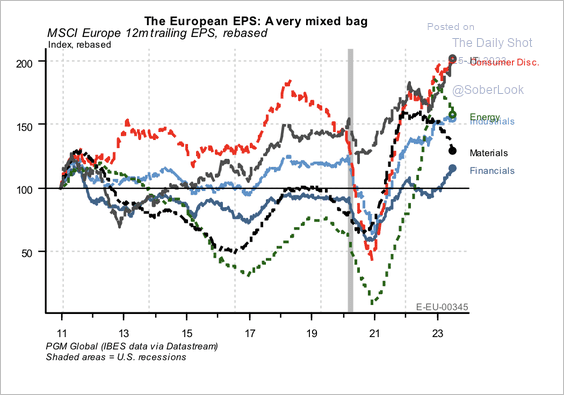 Source: PGM Global
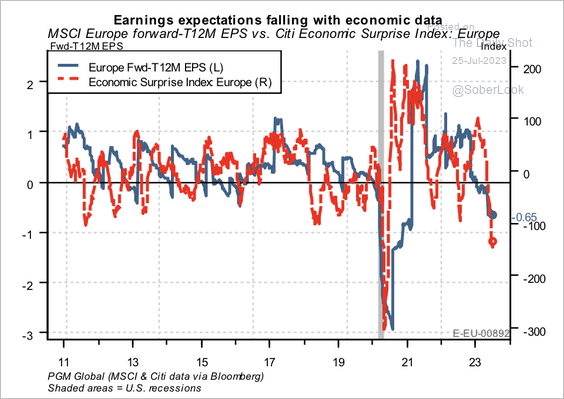 Source: PGM Global
——————–
3. This piechart shows the contributions to the EU’s industrial production.
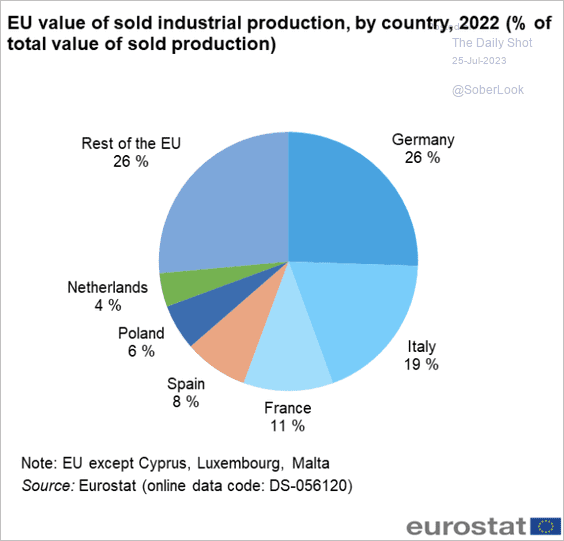 Source: Eurostat Read full article
Back to Index
Japan
1. Wage growth surged this year.
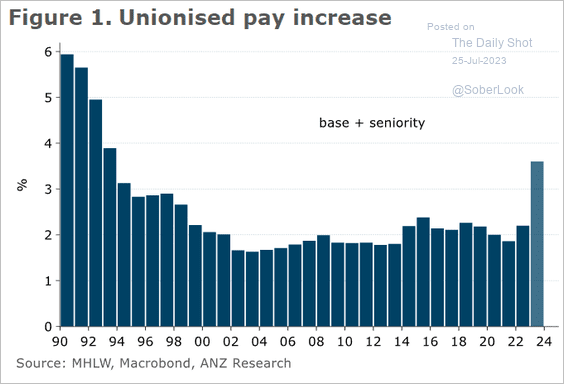 Source: @ANZ_Research
2. The labor force is expected to contract significantly in the decades ahead.
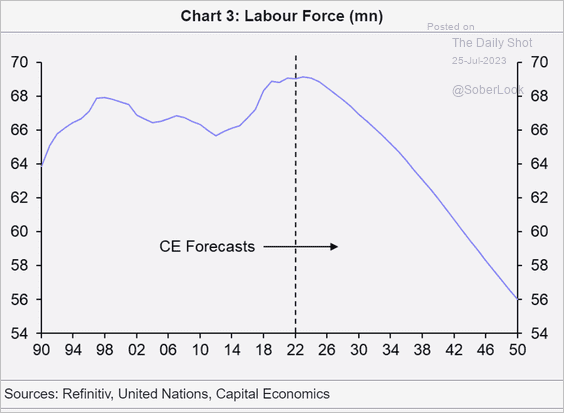 Source: Capital Economics
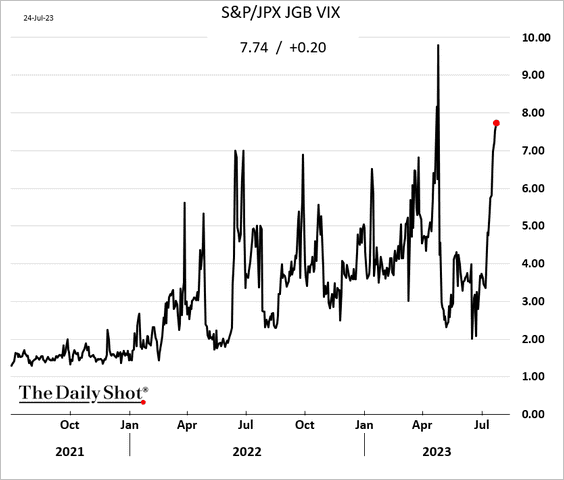
3. The JGB market implied volatility has been surging amid BoJ policy uncertainty.
Back to Index
Asia-Pacific
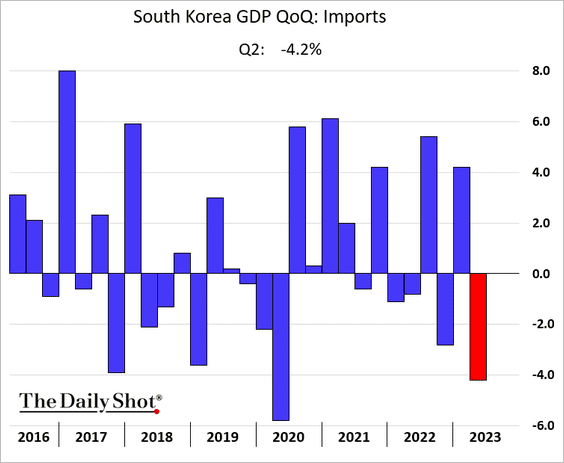
1. South Korea’s Q2 GDP print was better than expected, …
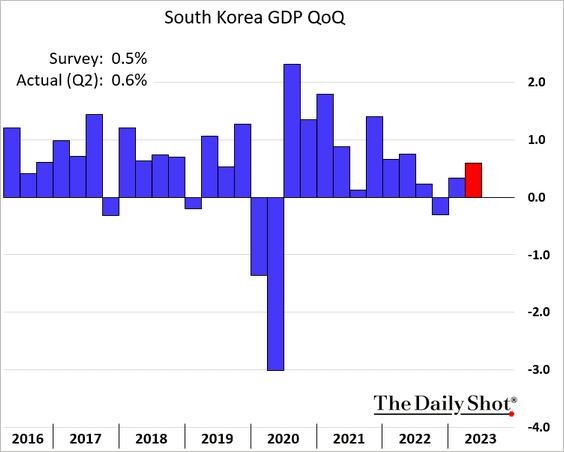
… boosted by net exports as imports tumbled. Domestic demand weakened.
 Source: Reuters Read full article
——————–
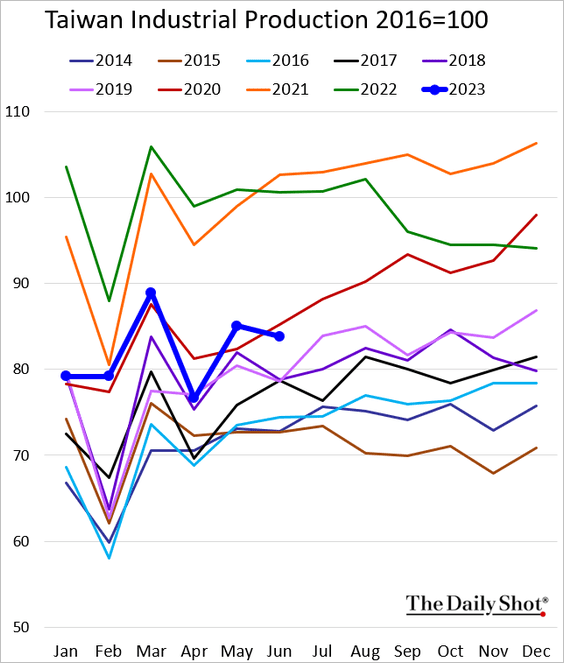
2. Taiwan’s industrial production dropped below 2020 levels.
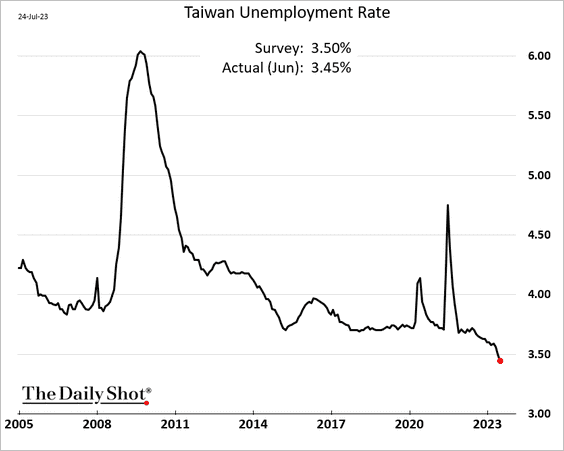
Nonetheless, the unemployment rate continues to fall.
——————–
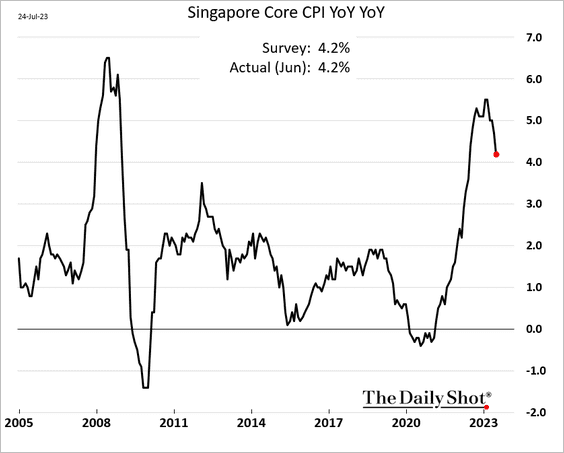
3. Singapore’s CPI is slowing.
Back to Index
China
1. Crashing producer prices will pressure corporate earnings.
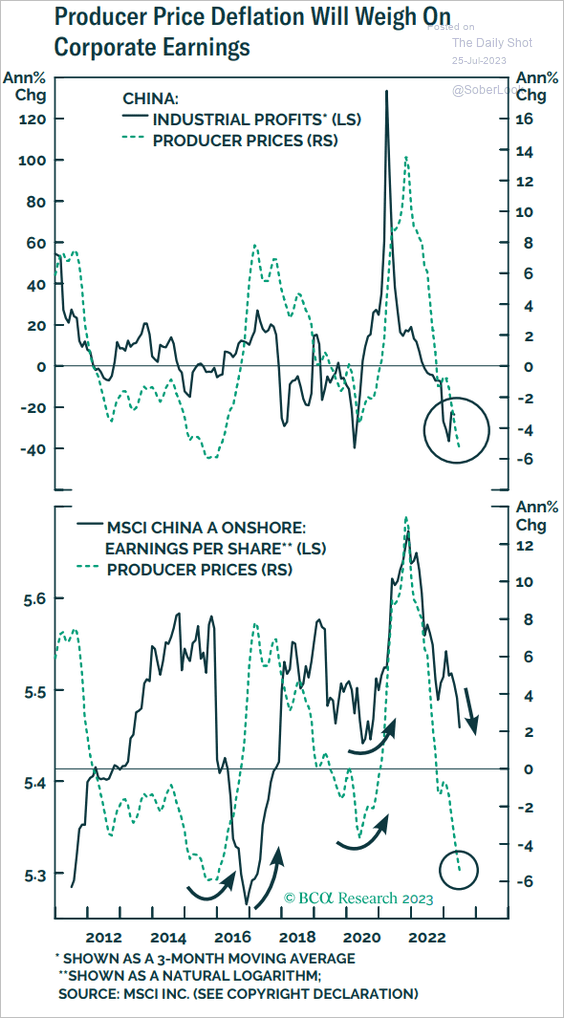 Source: BCA Research
2. The July SMI report showed contracting business activity.
• Services:
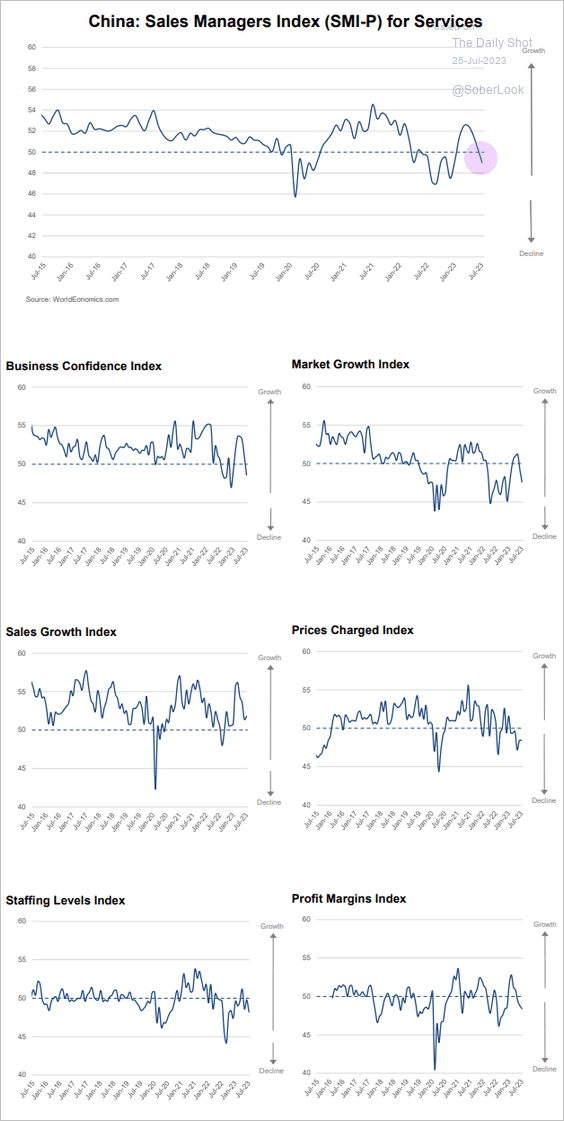 Source: World Economics
• Manufacturing:
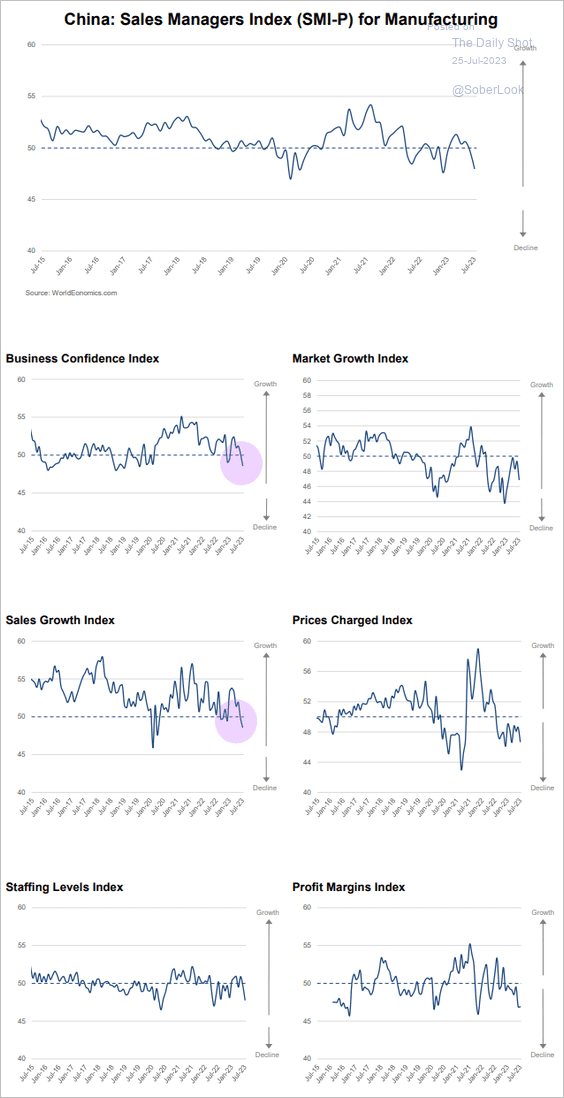 Source: World Economics
——————–
3. The CSI 300 Index is testing long-term support.
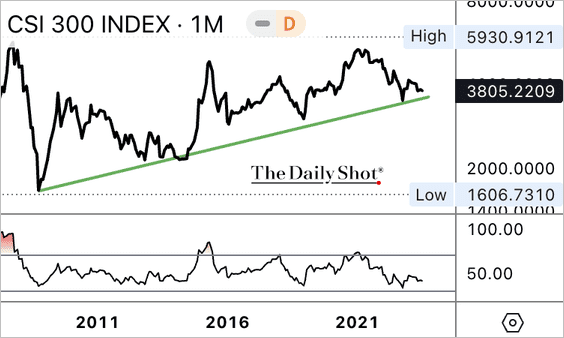
• For now, the Hang Seng Index remains capped below its 100-week moving average with negative momentum.
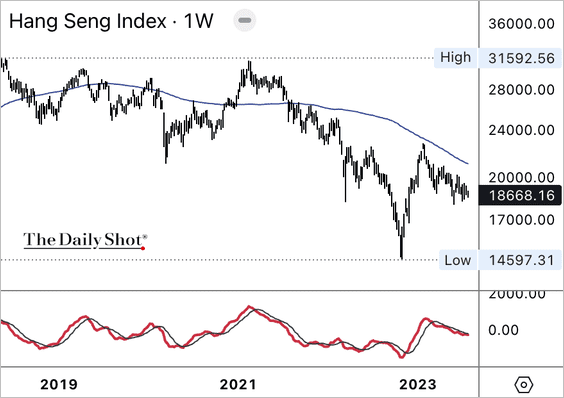
• Variant Perception’s models show tactical upside for Chinese and Hong Kong stocks, assuming additional liquidity support flows through into asset prices.
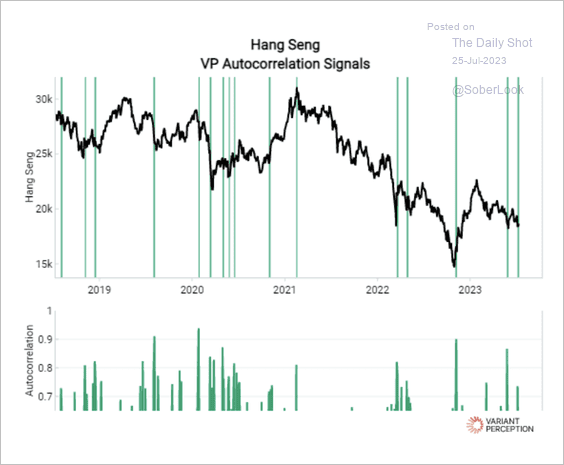 Source: Variant Perception
——————–
4. Here is why some US firms have been relocating from China.
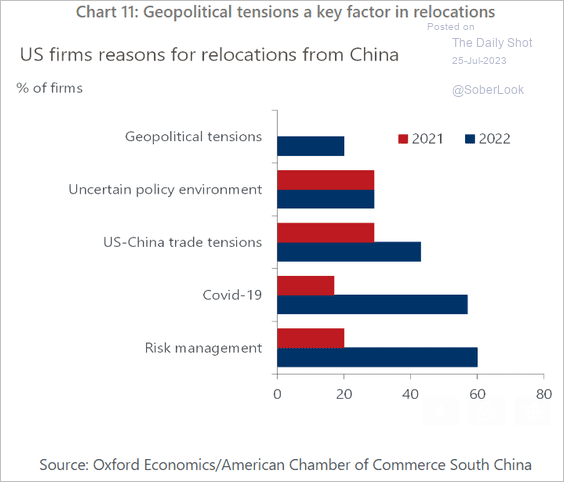 Source: Oxford Economics
Back to Index
Cryptocurrency
1. So far, XRP is the top traded altcoin this year based on trading volume.
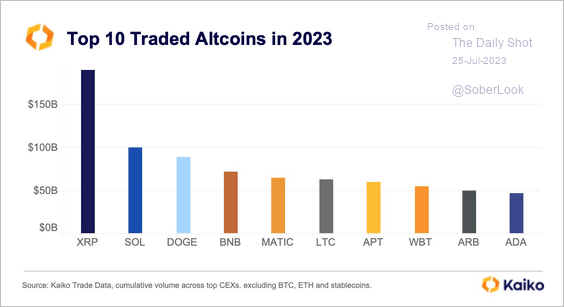 Source: @KaikoData
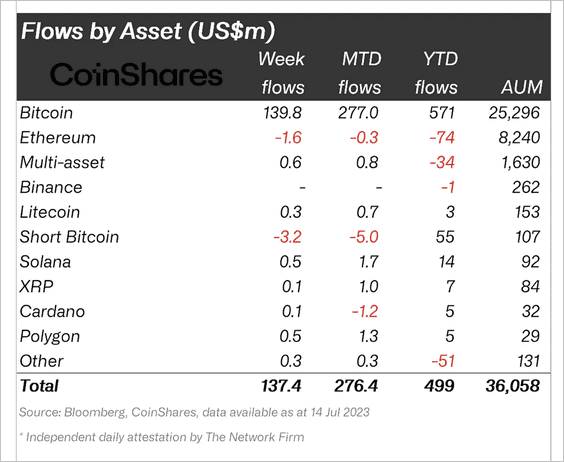
2. Crypto funds saw another week of inflows led almost entirely by long-bitcoin products. Investors continued to exit short-bitcoin funds for the 12th straight week. (2 charts)
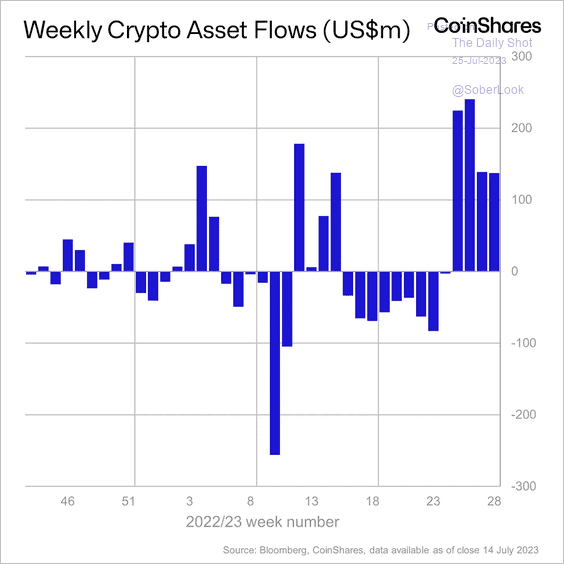 Source: CoinShares Read full article
 Source: CoinShares Read full article
——————–
3. Binance’s share of the US crypto market has collapsed.
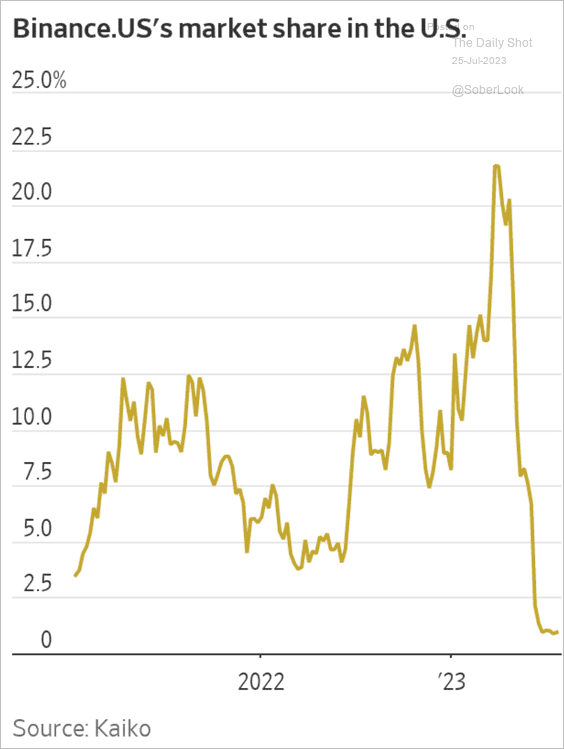 Source: @WSJ Read full article
Back to Index
Commodities
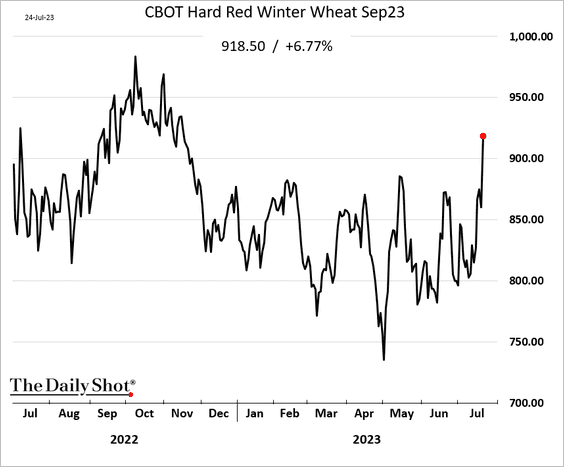
1. High-protein wheat (used to make bread and pasta) was up almost 7% on Monday in response to the Ukraine situation.
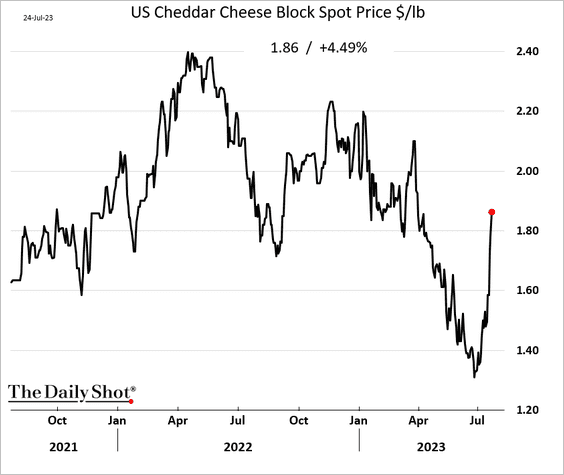
2. Wholesale cheddar cheese prices are surging.
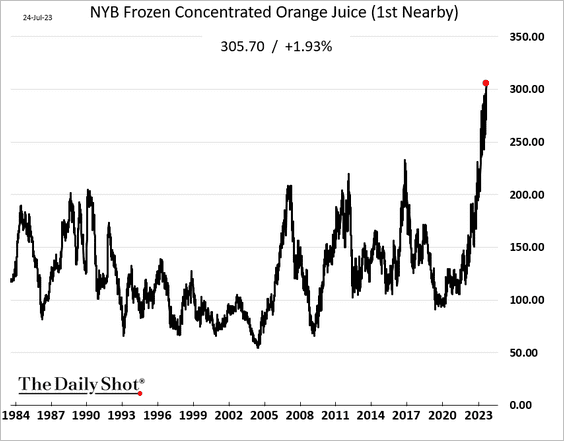
3. Orange juice futures hit a record high.
 Source: @markets Read full article
——————–
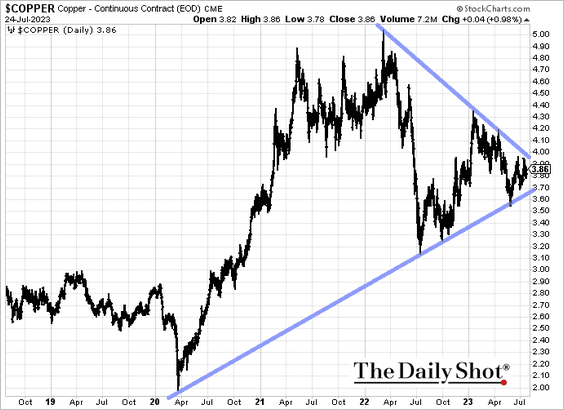
4. Is copper ready for a breakout?
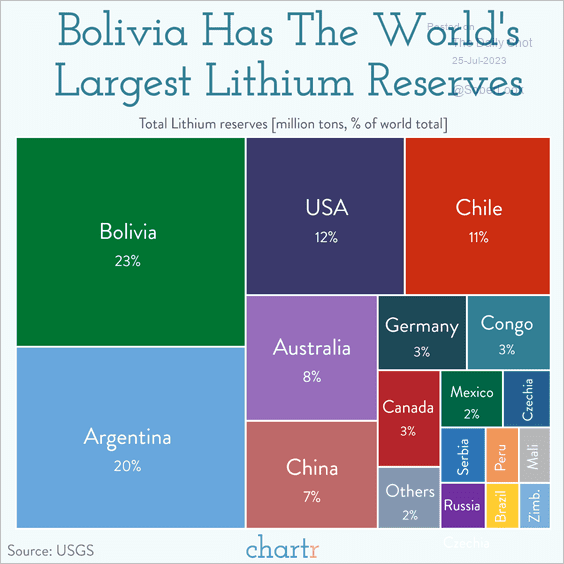
5. Here is a look at lithium reserves by country.
 Source: @chartrdaily
Back to Index
Energy
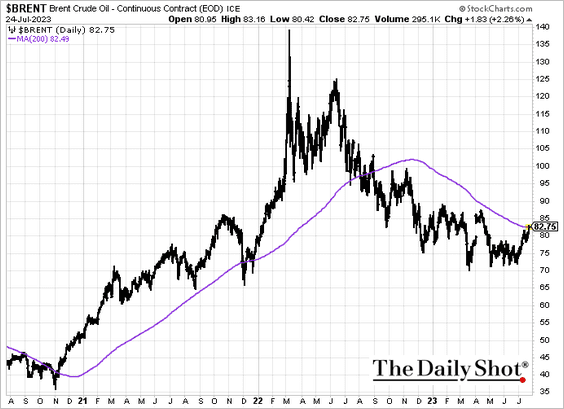
1. Brent is testing resistance at the 200-day moving average.
 Source: Reuters Read full article
——————–
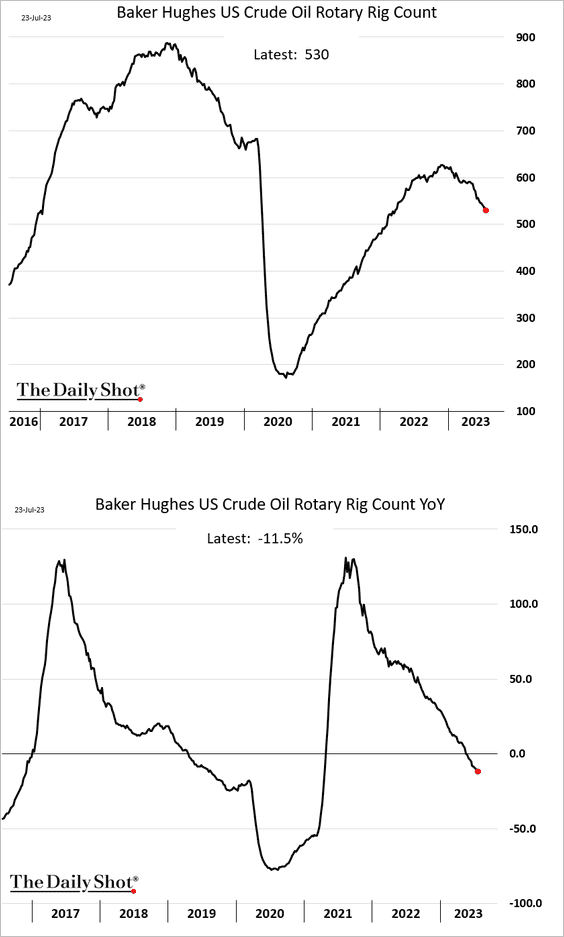
2. US rig count keeps moving lower.
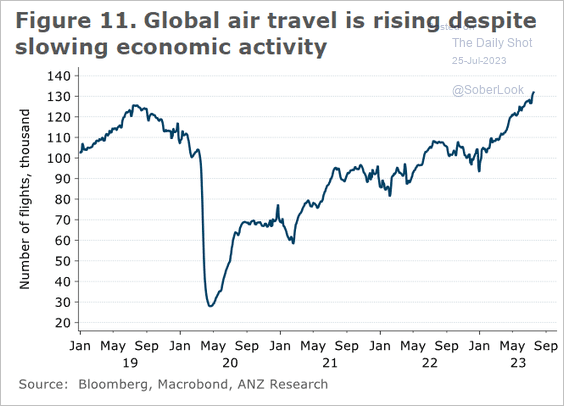
3. Air travel continues to grow.
 Source: @ANZ_Research
Back to Index
Equities
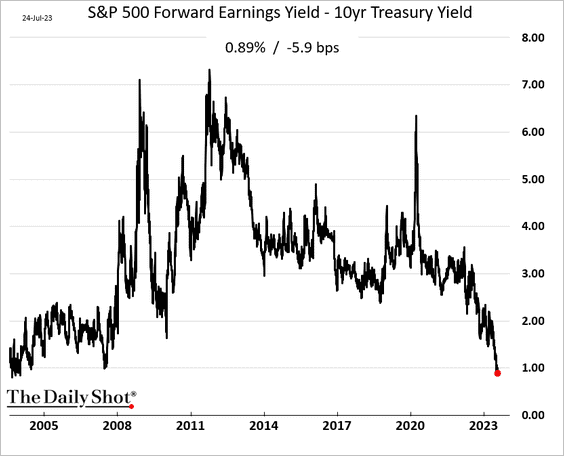
1. The S&P 500 risk premium hit the lowest level in two decades, which will be a headwind for longer-term returns.
• The S&P 500 PE ratio has diverged from real yields.
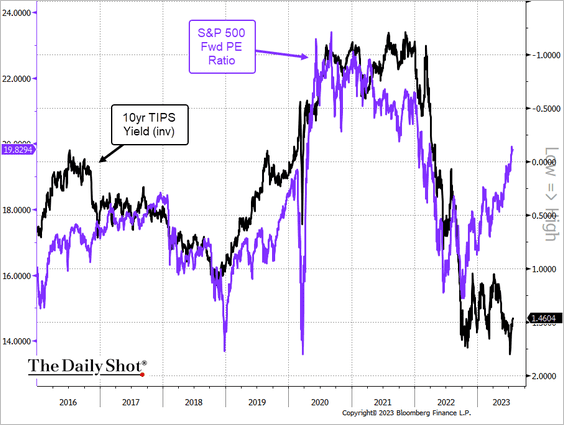 Source: @TheTerminal, Bloomberg Finance L.P.
——————–
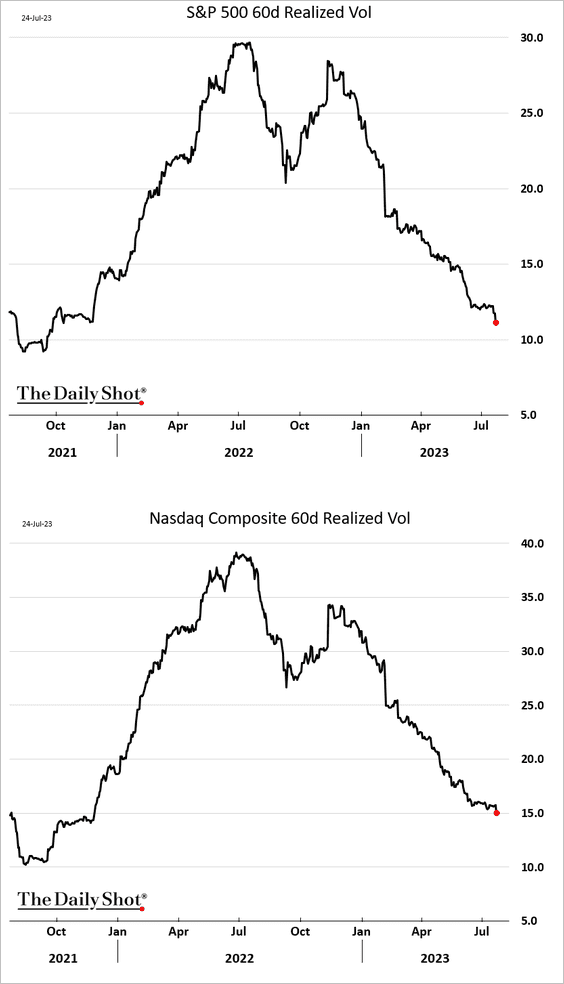
2. Realized volatility in the S&P 500 and Nasdaq has plummeted to its lowest level since 2021.
3. Stock prices have diverged from other leading indicators.
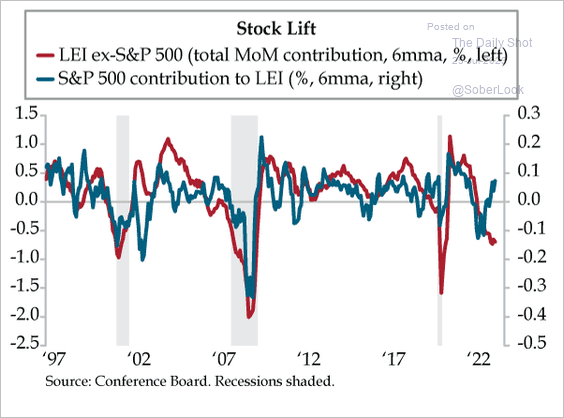 Source: Quill Intelligence
4. The S&P 500 has retraced roughly 78% of its peak-to-trough decline, which historically preceded the start of a new uptrend. (2 charts)
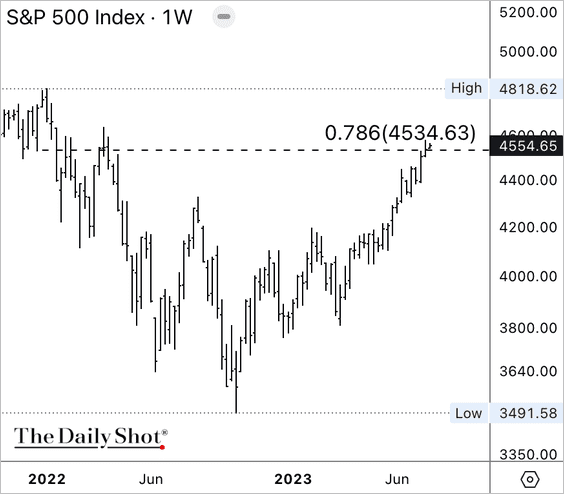
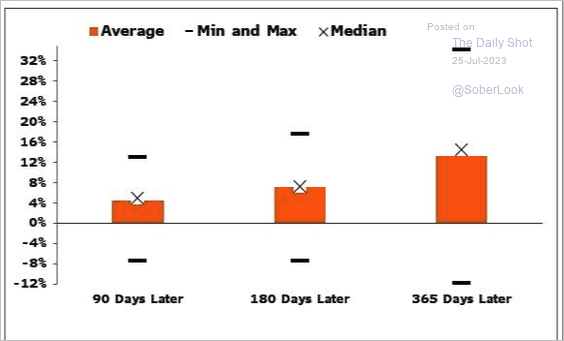 Source: @GinaMartinAdams
——————–
5. The S&P 500 concentration surged in recent months.
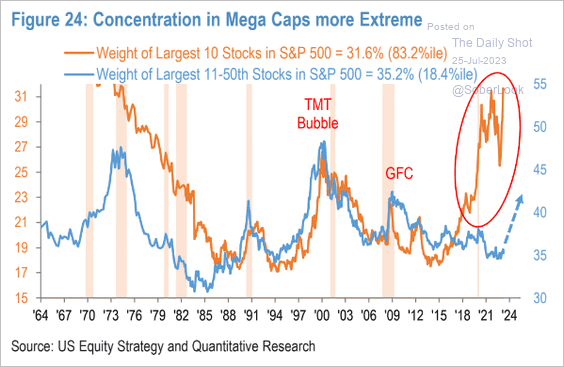 Source: Morgan Stanley Research; @dailychartbook
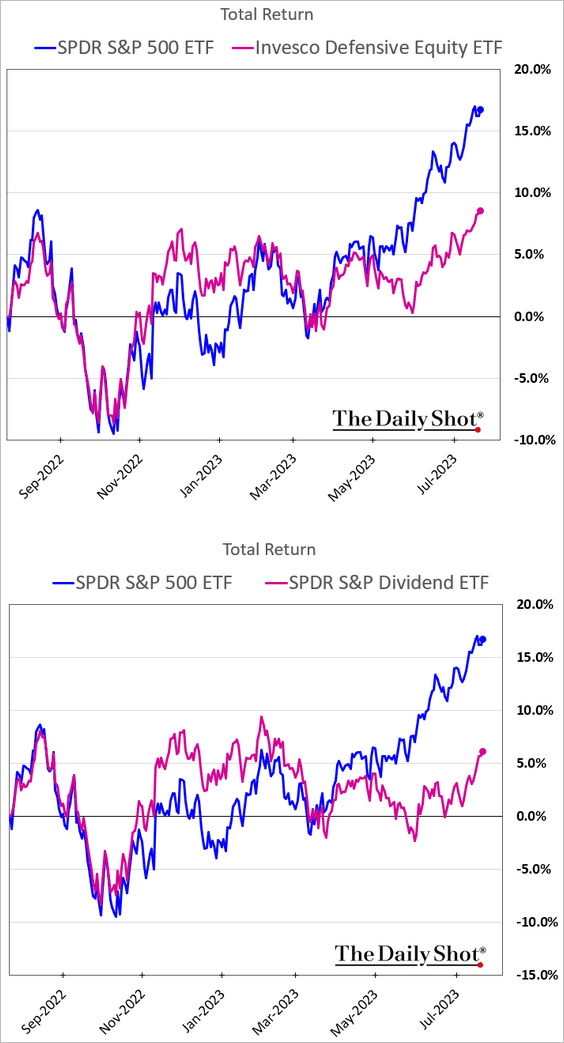
6. Defensives continue to lag.
7. Earnings revisions breadth has turned lower.
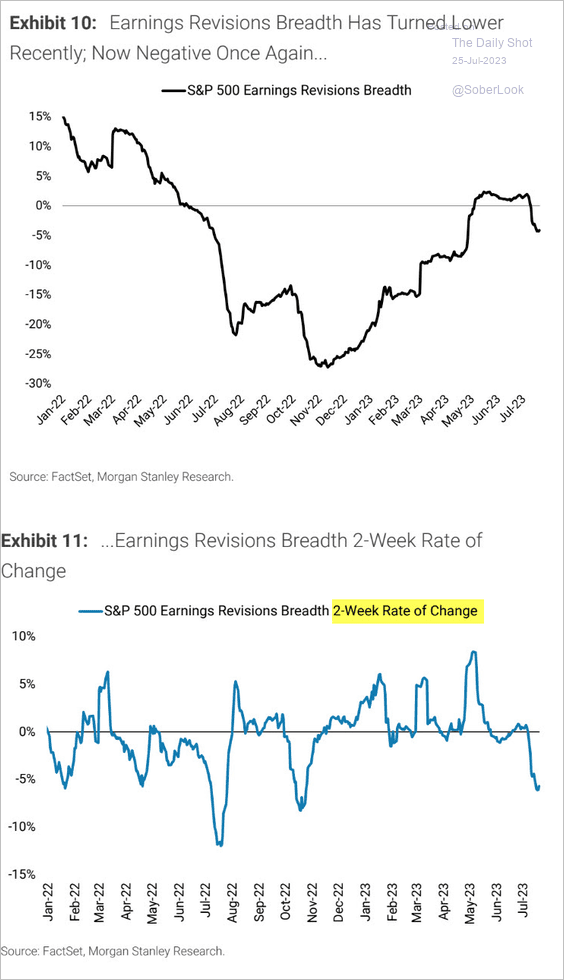 Source: Morgan Stanley Research; h/t @dailychartbook
8. This figure shows the average real and nominal return of a 60/40 equity/bond portfolio across inflation regimes between 1875-2021…
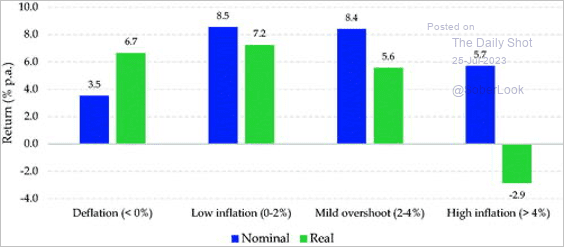 Source: CFA Institute Read full article
…and global factor premiums.
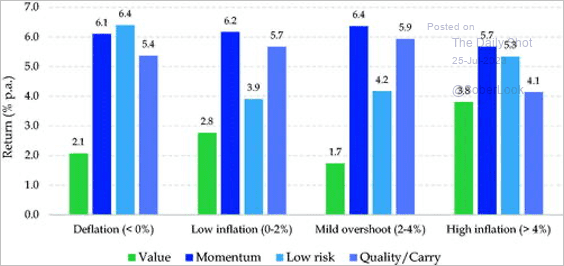 Source: CFA Institute Read full article
——————–
9. The semiconductor rally is not yet supported by chip sales.
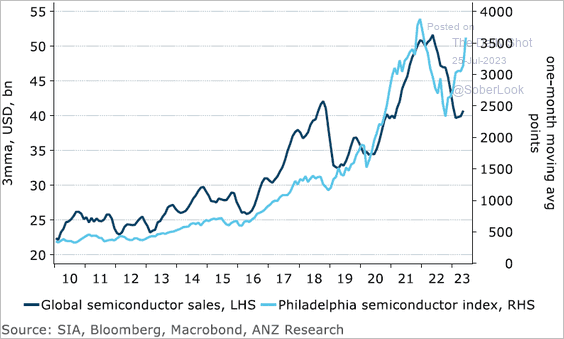 Source: @ANZ_Research
10. Previous stock market rallies during a recession occurred after low initial valuations, especially post-war, or in the formation of a bubble. (2 charts)
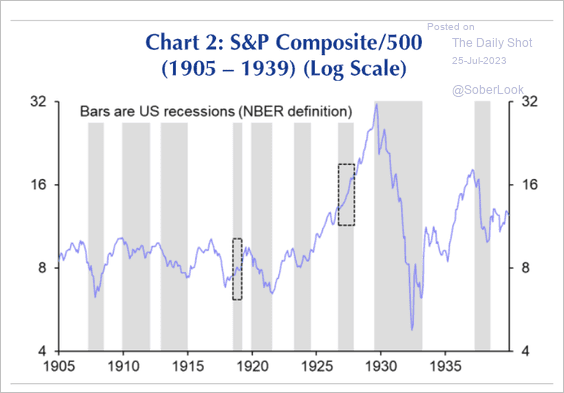 Source: Capital Economics
 Source: Capital Economics
Back to Index
Credit
1. US high-yield market maturities continue to shorten as issuance (refi) remains weak.
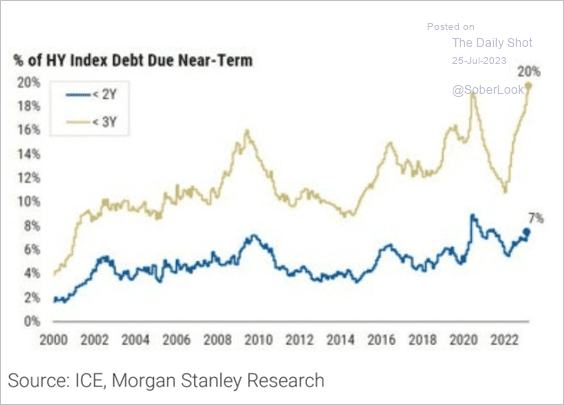 Source: Morgan Stanley Research
2. This is the first US non-revolving debt contraction in 12 years, underpinned by tighter lending standards.
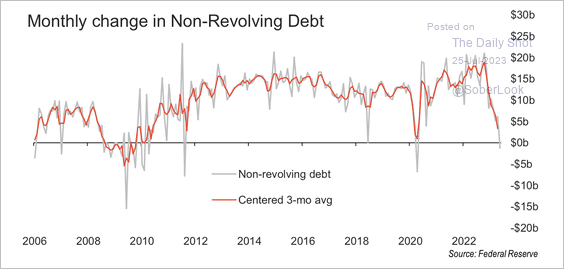 Source: FHN Financial
3. Here is the upgrade-to-downgrade ratio.
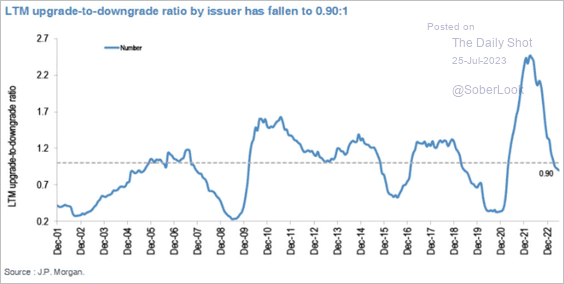 Source: JP Morgan Research; @dailychartbook
Back to Index
Rates
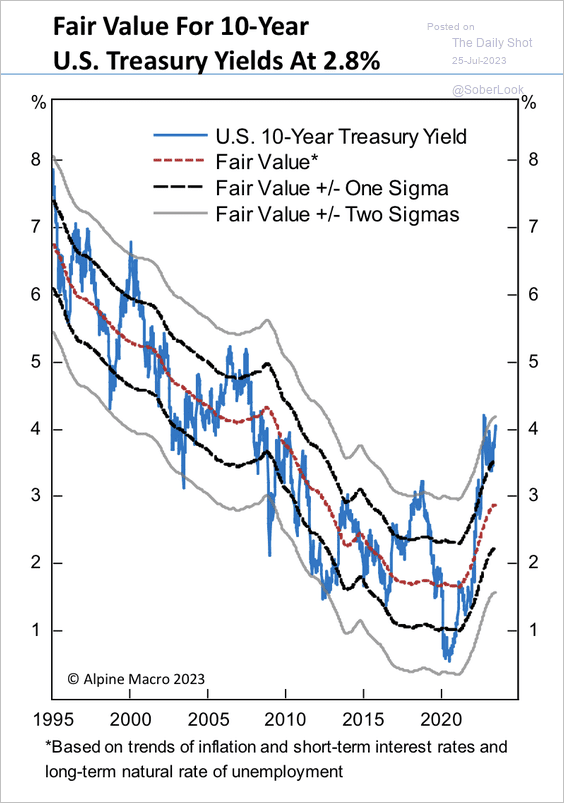
1. Alpine Macro has a fair value estimate at 2.8% for the 10-year Treasury yield.
 Source: Alpine Macro
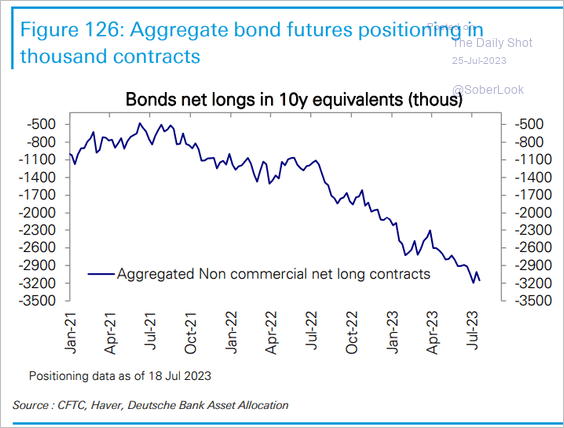
2. Speculative positioning in Treasury futures remains extremely bearish.
 Source: Deutsche Bank Research
——————–
Food for Thought
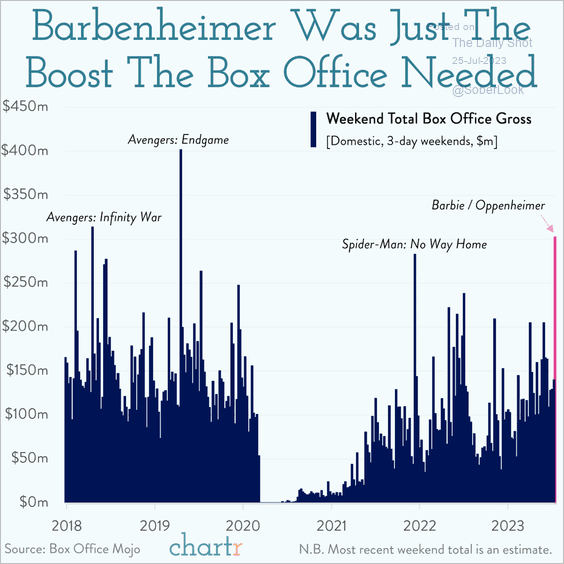
1. Weekend box office gross proceeds:
 Source: @chartrdaily
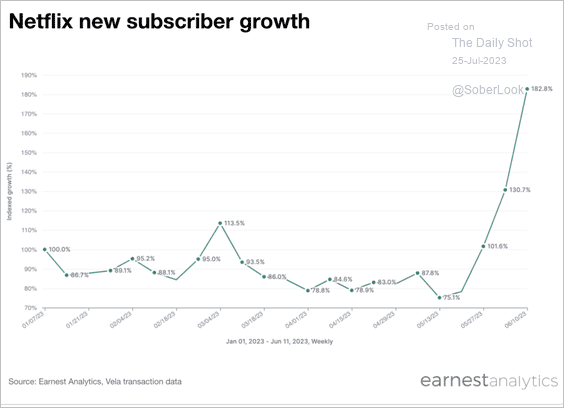
2. Netflix subscriber growth:
 Source: Earnest Analytics Read full article
3. Participation in sports:
 Source: Statista
4. Practicing yoga:
 Source: Statista
5. Melanoma in Florida:
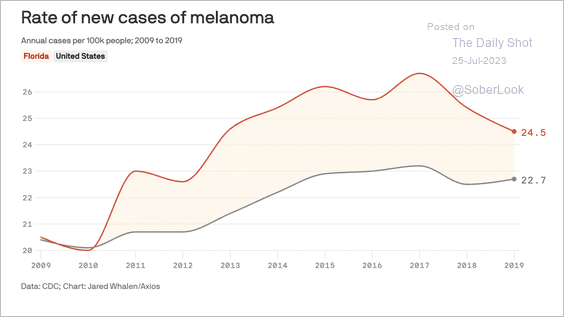 Source: @axios Read full article
6. Border Patrol apprehensions at the US southwest border:
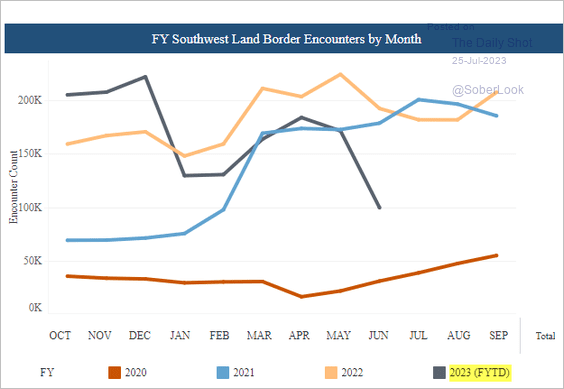 Source: CBP
7. A look at political polarization around the world:
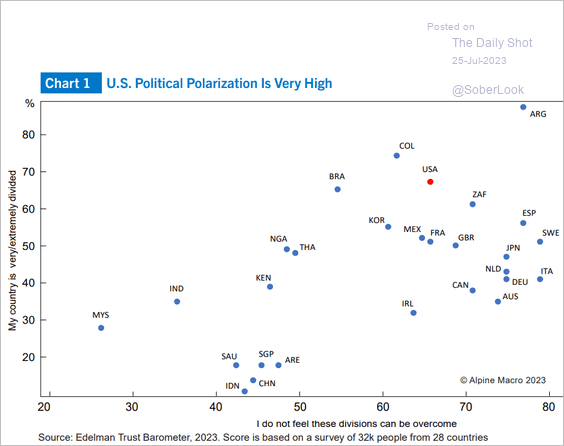 Source: Alpine Macro
8. GOP candidates campaigning in Iowa and New Hampshire:
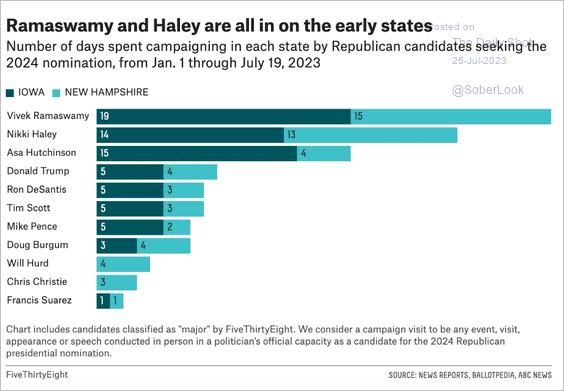 Source: FiveThirtyEight Read full article
9. Planning a trip:
 Source: LendingTree Read full article
——————–
Back to Index