
The Daily Shot: 10-Aug-23
• The United States
• The United Kingdom
• Japan
• China
• Emerging Markets
• Cryptocurrency
• Commodities
• Energy
• Equities
• Alternatives
• Rates
• Global Developments
• Food for Thought
The United States
1. Let’s begin with the housing market.
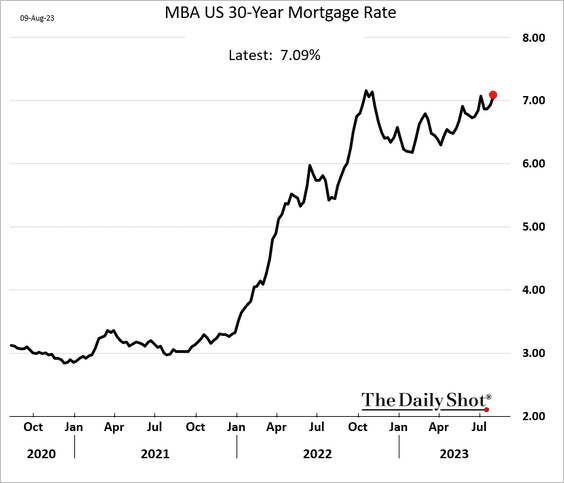
• Mortgage applications continue to weaken, …
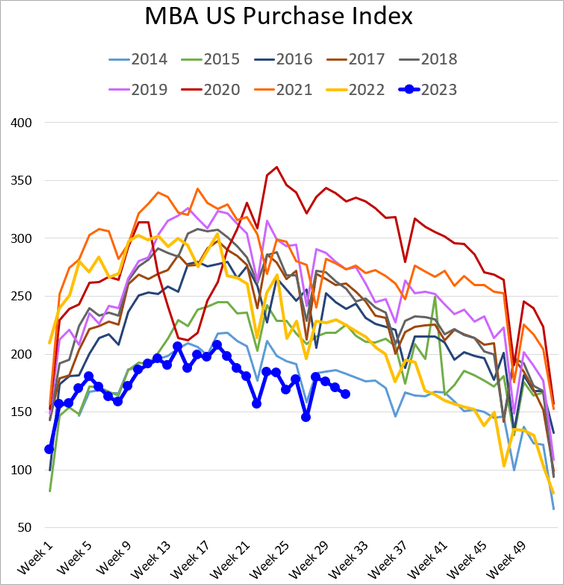
… as mortgage rates climb.
 Source: Reuters Read full article
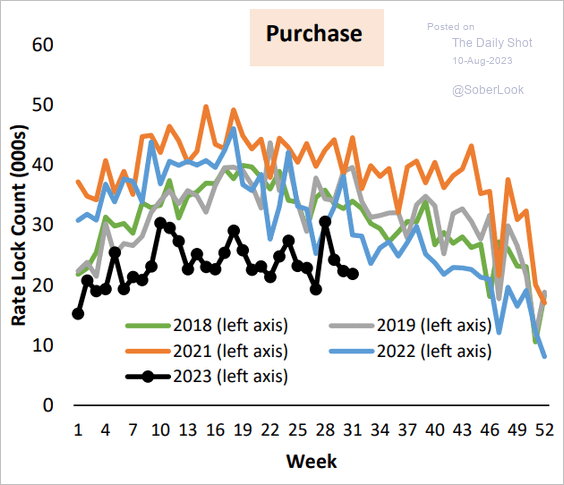
Here is the rate-lock count.
 Source: AEI Housing Center
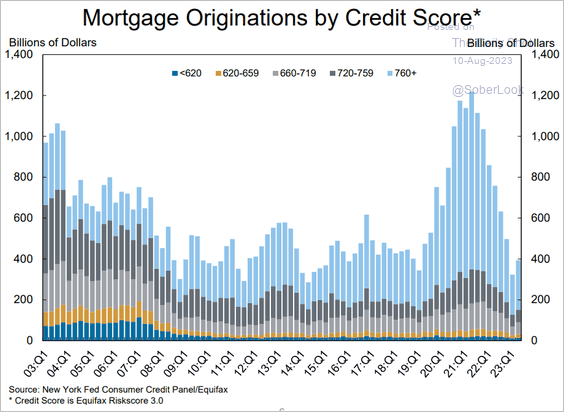
• This chart shows mortgage originations by credit score.
 Source: Federal Reserve Bank of New York
• The debt/income ratio for homebuyers is above the 2006-2007 highs.
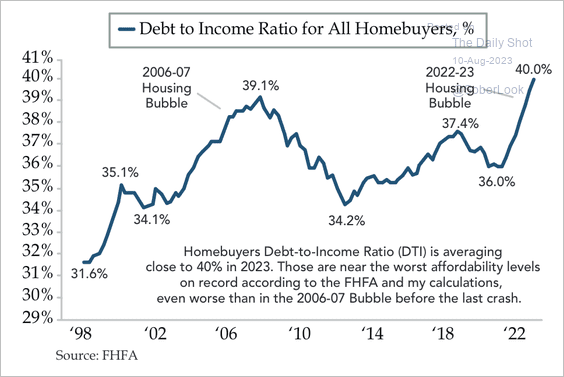 Source: Quill Intelligence
• Inventories of homes for sale remain depressed.
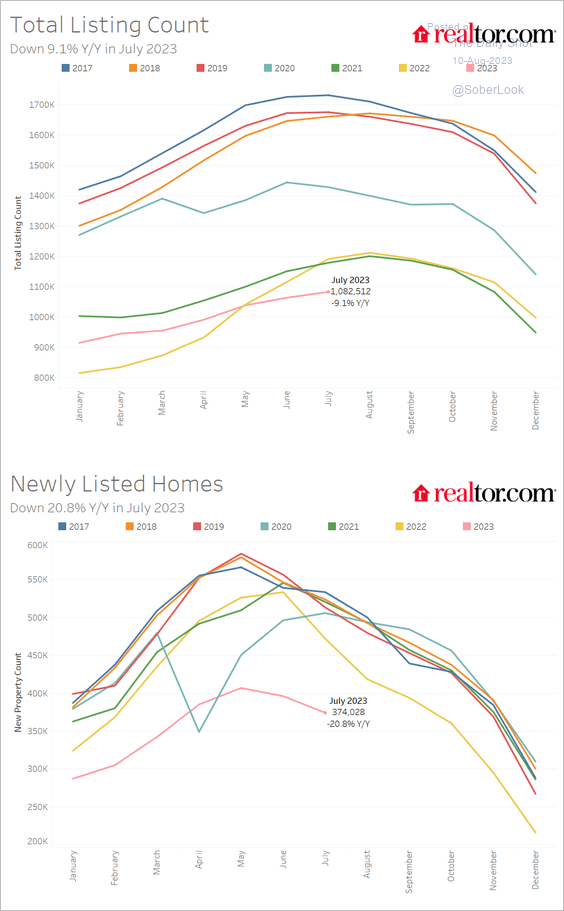 Source: realtor.com
• Homes are still selling faster than they did before the pandemic.
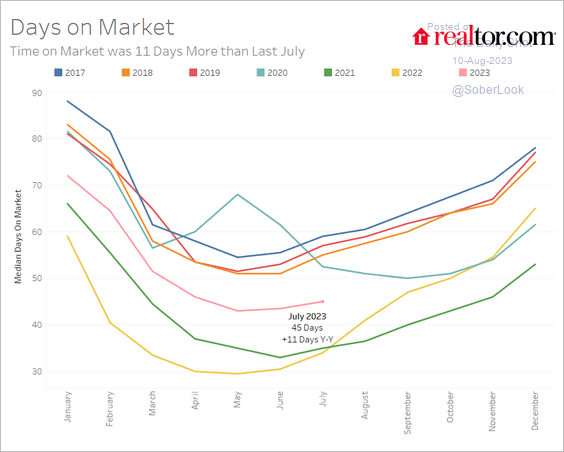 Source: realtor.com
• How do foreign purchasers of US residential properties intend to use them?
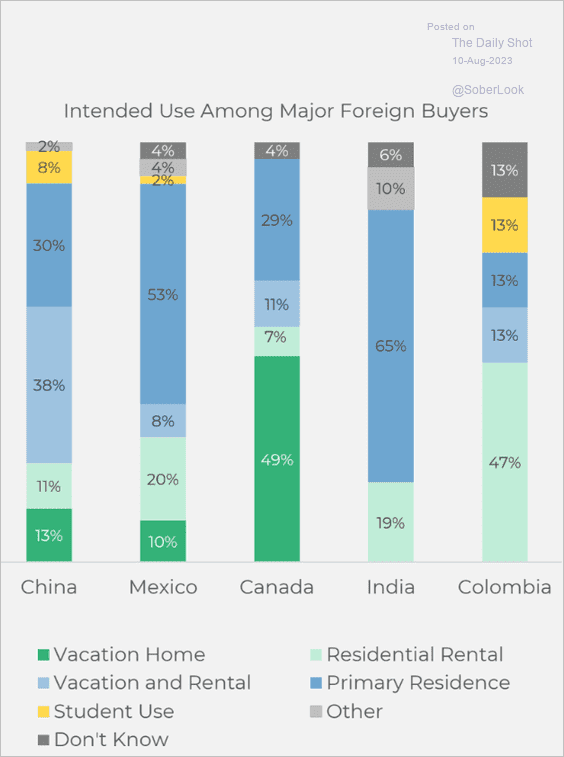 Source: National Association of REALTORS
• Shares of homebuilders continue to outperform.
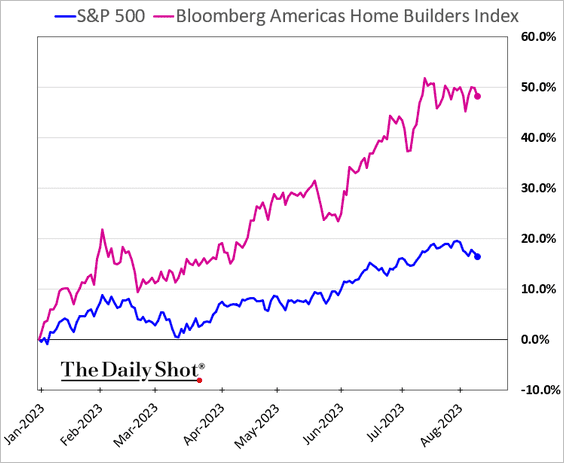 Source: Bloomberg
——————–
2. The year-over-year changes in the CPI are anticipated to halt their long streak of consecutive declines.
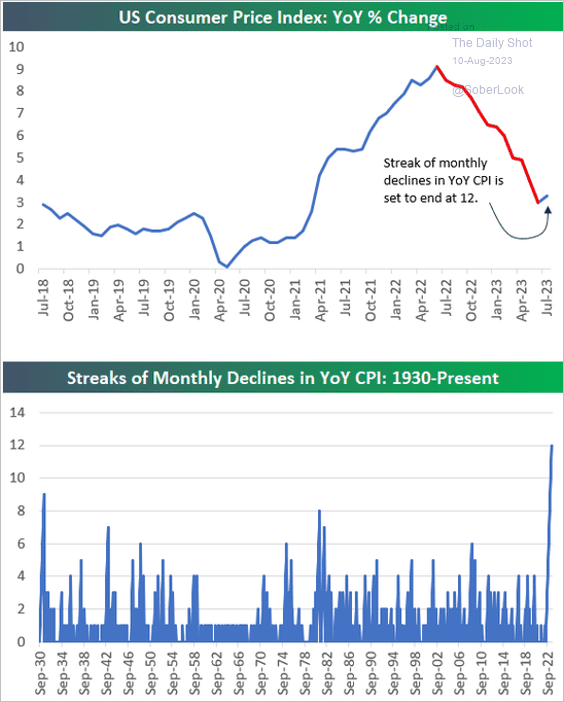 Source: @bespokeinvest Read full article
3. LinkedIn’s indicator of hiring is now well below pre-COVID levels.
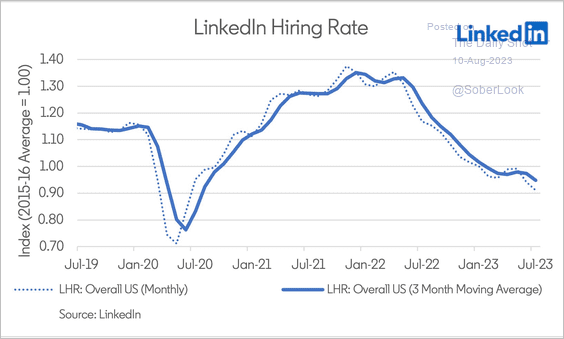 Source: @EconBerger, @LinkedIn
4. “Soft landing” mentions in news stories have surged recently.
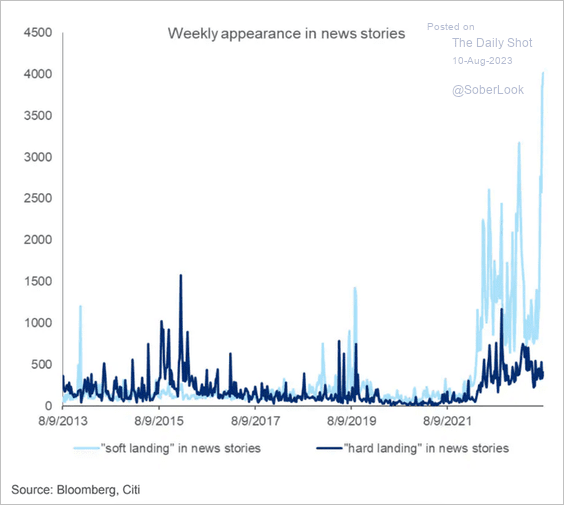 Source: @AyeshaTariq
5. Will rising real wages force companies to boost productivity?
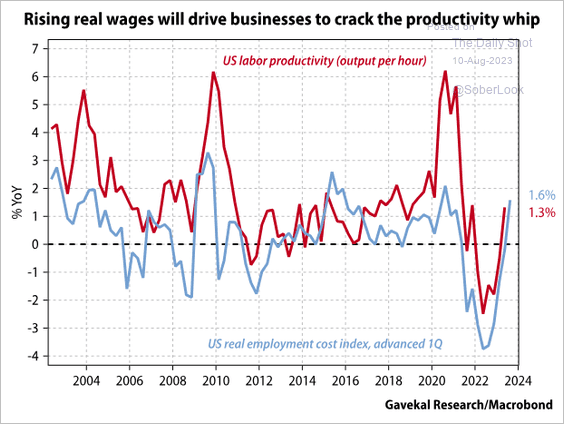 Source: Gavekal Research
Back to Index
The United Kingdom
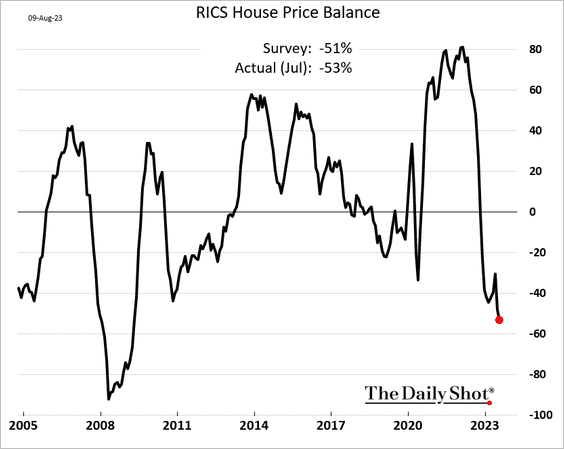
1. The RICS report shows broad declines in home prices.
 Source: Reuters Read full article
——————–
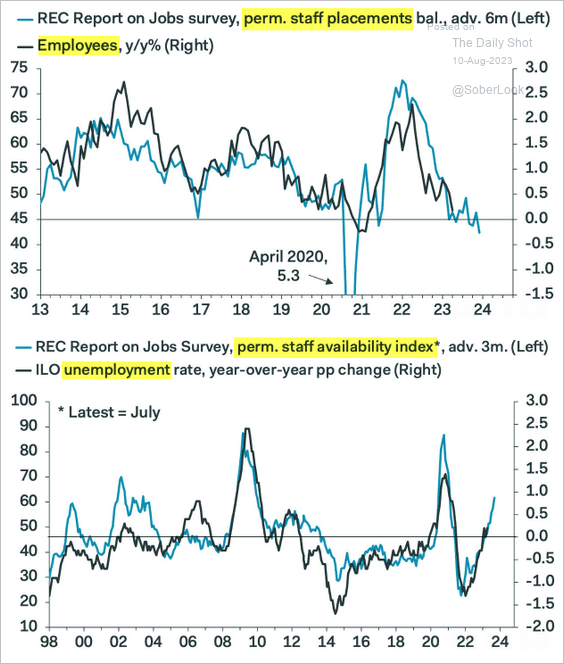
2. Survey indicators point to a looser labor market in the UK.
 Source: Pantheon Macroeconomics
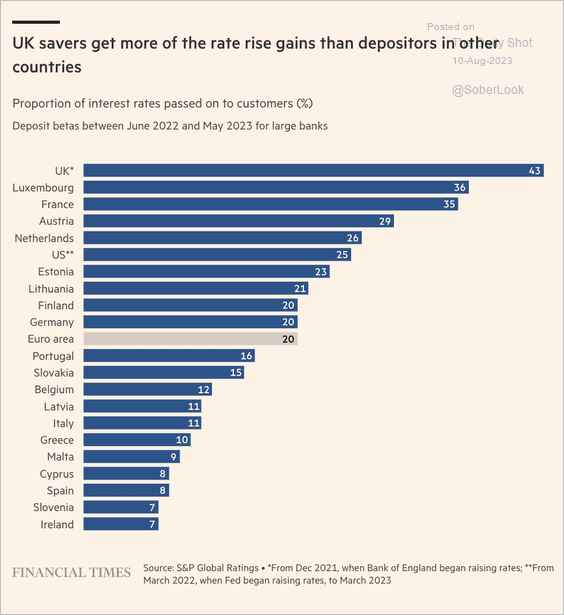
3. UK savers keep a larger share of the interest from bank deposits than Eurozone and US peers.
 Source: @financialtimes Read full article
Back to Index
Japan
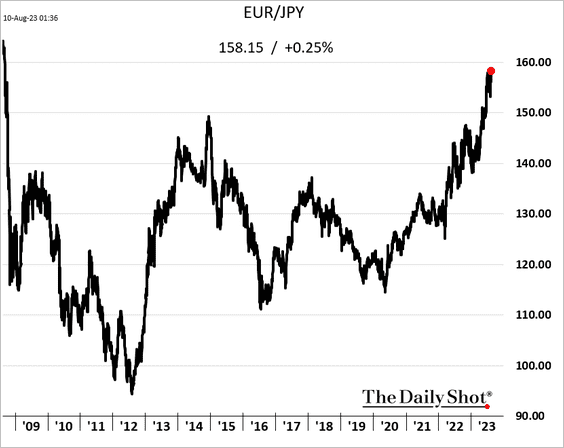
1. The yen has reached its weakest level against the euro since 2008.
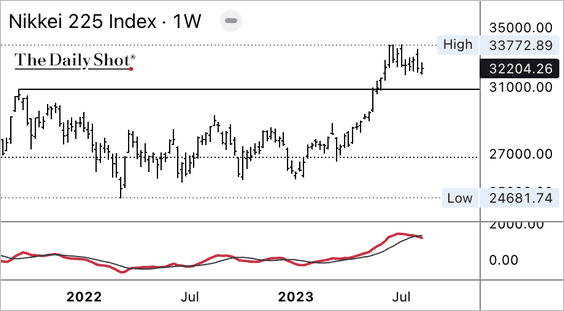
2. Intermediate-term momentum is fading behind the Nikkei 225 Index.
3. As yields rise, Japanese banks are outperforming due to the benefit to their net interest margins. (2 charts)
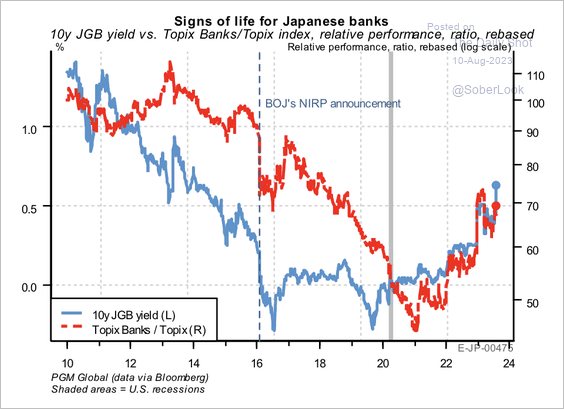 Source: PGM Global
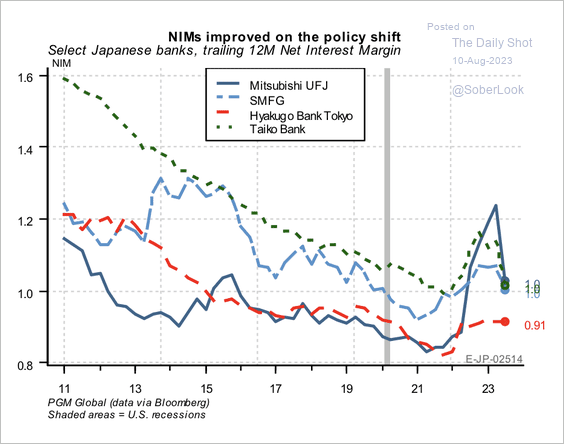 Source: PGM Global
——————–
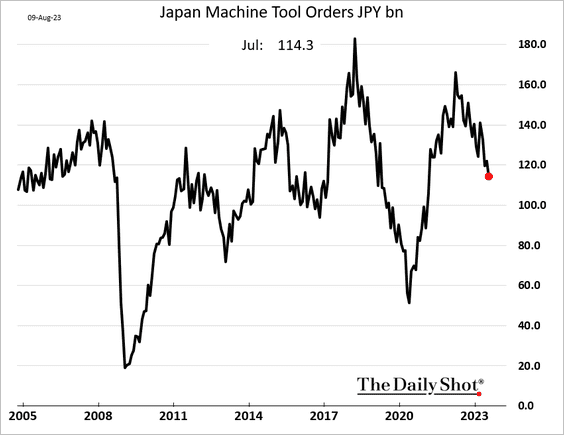
4. Machine tool orders continue to sink.
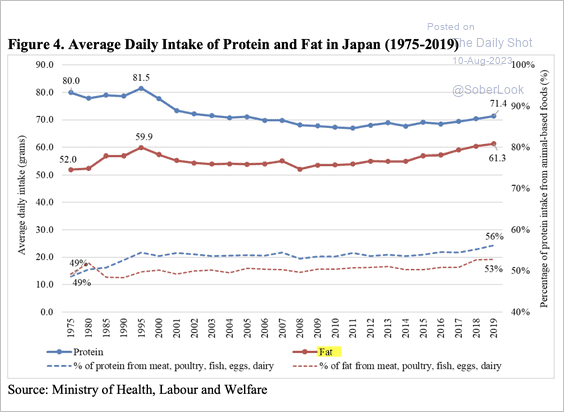
5. Daily fat consumption in Japan has been increasing.
 Source: USDA Read full article
Back to Index
China
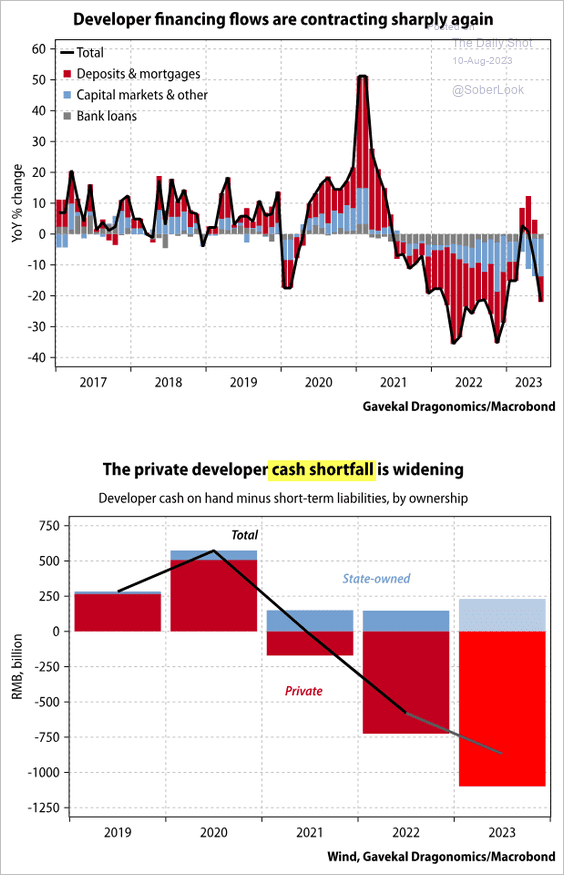
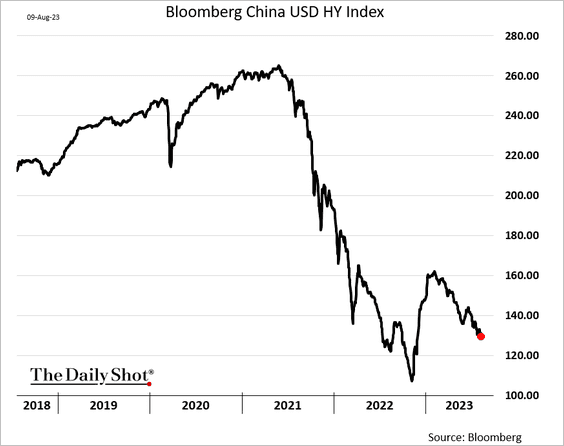
1. Property developers’ shares continue to languish, …
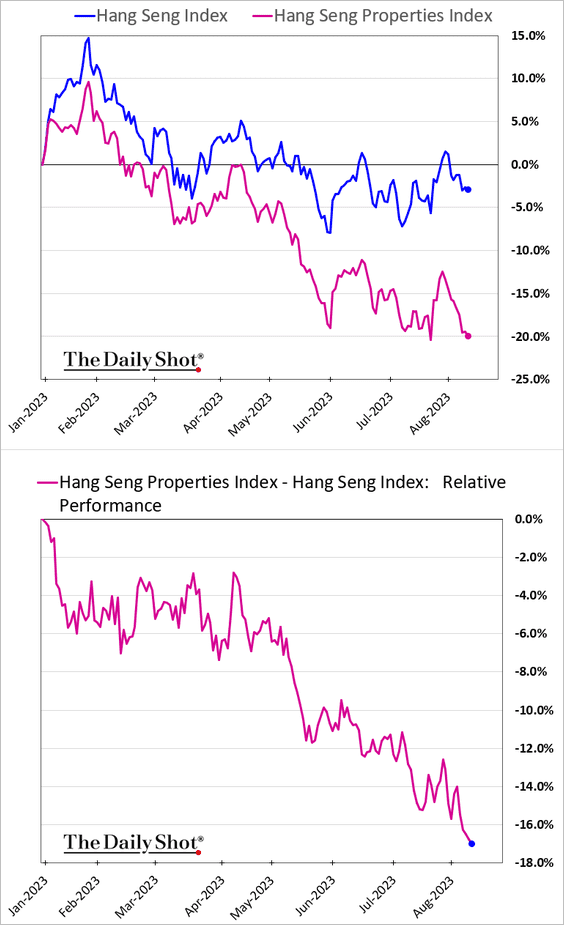
… amid widening cash shortfall.
 Source: Gavekal Research
• Here is Bloomberg’s index of USD-denominated HY bonds (mostly developers).
• Residential realtors saw better sales and pricing power last month as mortgage rates declined.
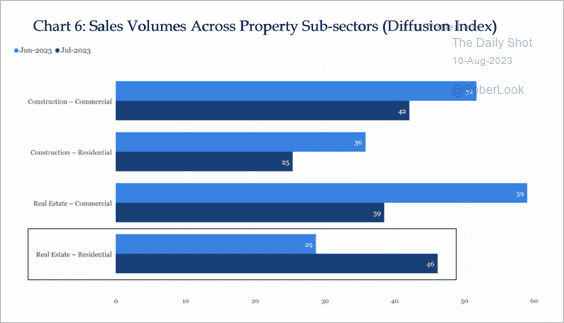 Source: China Beige Book
——————–
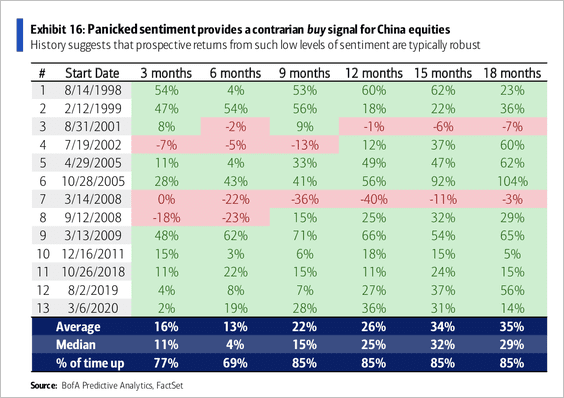
2. According to BofA, investor sentiment on Chinese equities plunged toward panic levels, which typically precede positive returns. (2 charts)
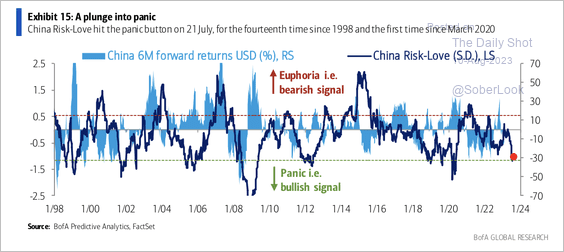 Source: BofA Global Research
 Source: BofA Global Research
——————–
3. China’s consumption share of GDP remains low relative to other large economies.
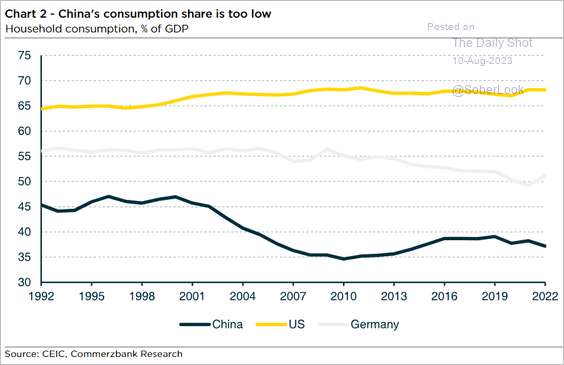 Source: Commerzbank Research
4. This chart shows China’s imports of semiconductor equipment by source.
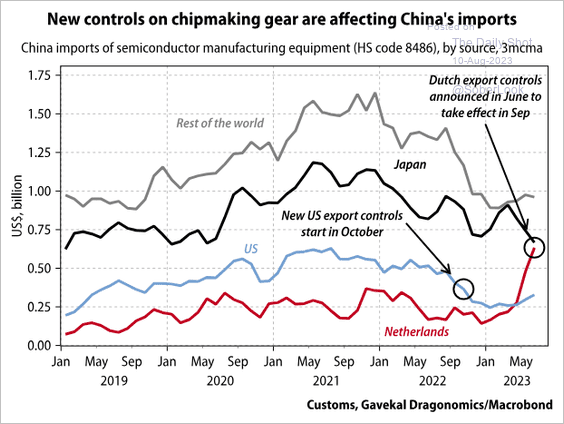 Source: Gavekal Research
5. China’s youth unemployment is higher than in G7 economies.
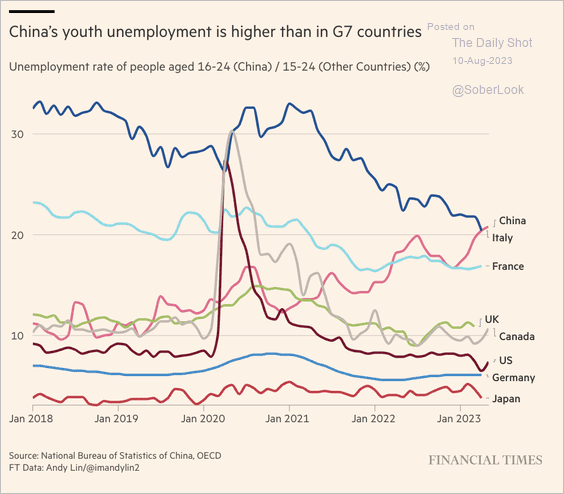 Source: @financialtimes Read full article
6. Next, we have some updates on the automotive industry.
• Car sales are running below last year’s levels.
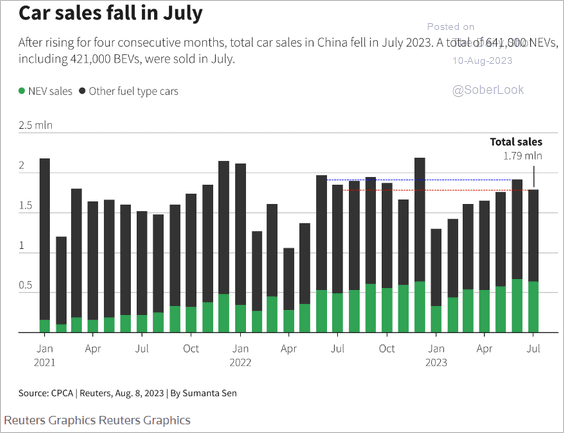 Source: Reuters Read full article
• The EV sector is booming.
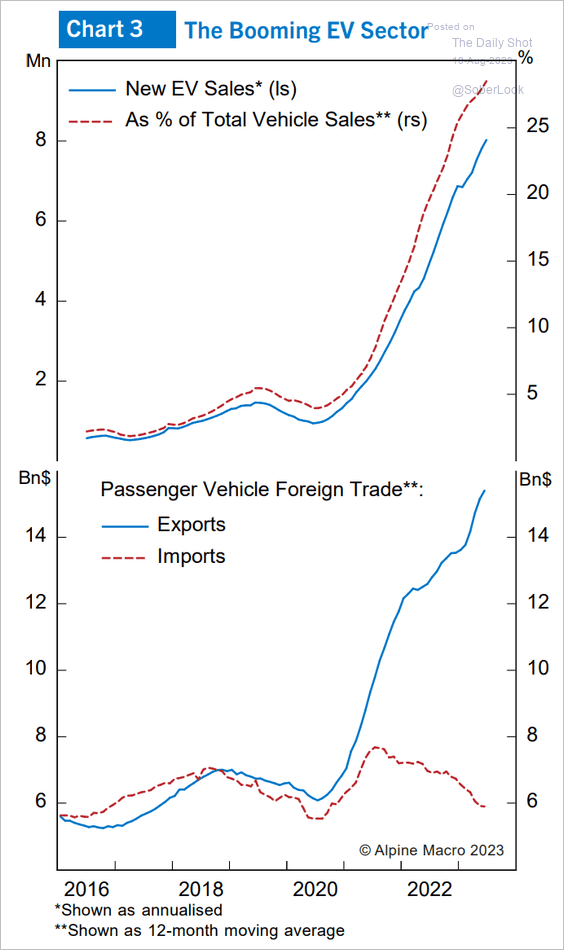 Source: Alpine Macro
• Strong car exports failed to offset weaker demand elsewhere.
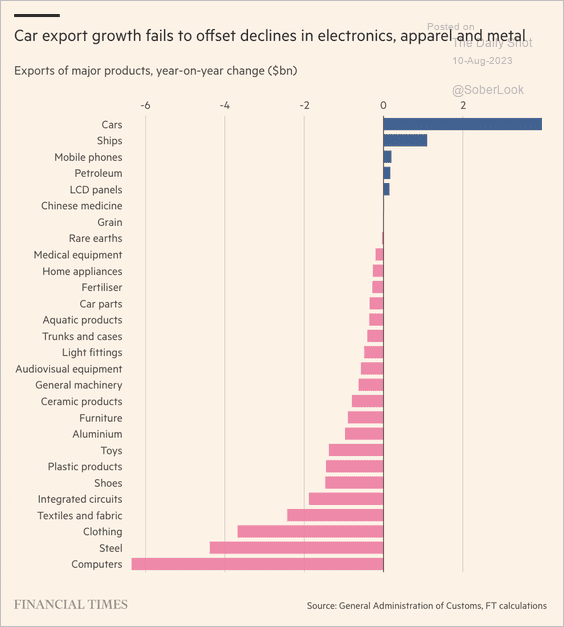 Source: @financialtimes Read full article
• Japanese automakers are losing market share in China.
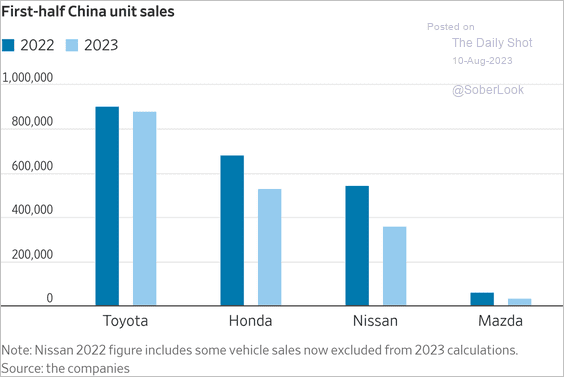 Source: @WSJ Read full article
Back to Index
Emerging Markets
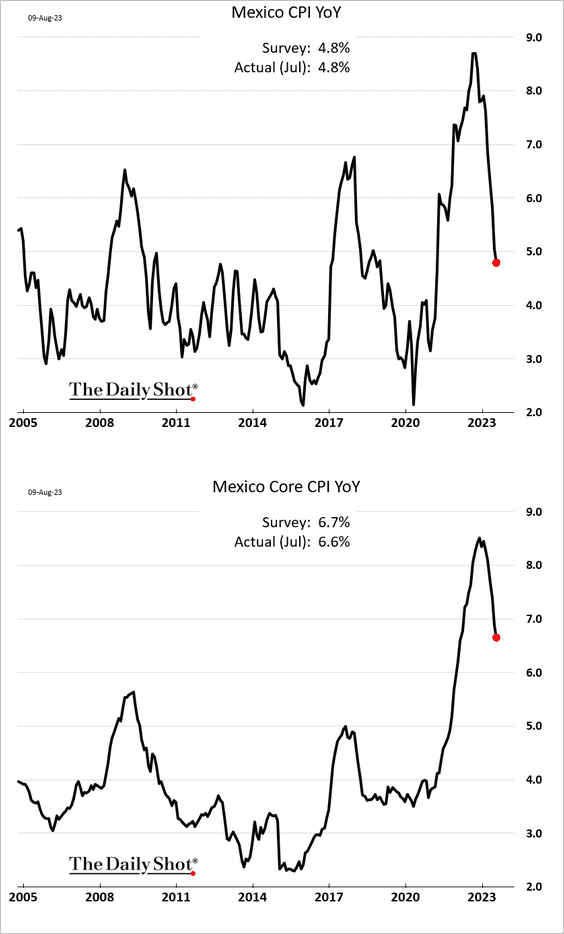
1. Mexico’s inflation continues to ease.
• The nation’s GDP underperformed other EM economies over the past two decades.
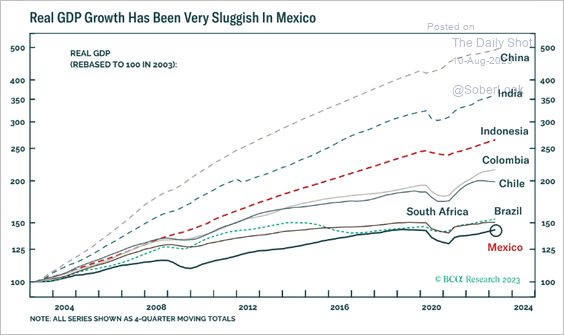 Source: BCA Research
——————–
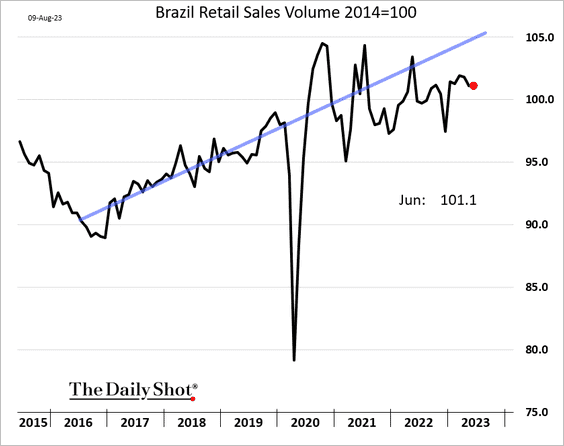
2. Brazil’s real retail sales are holding up well but are running below the pre-COVID trend.
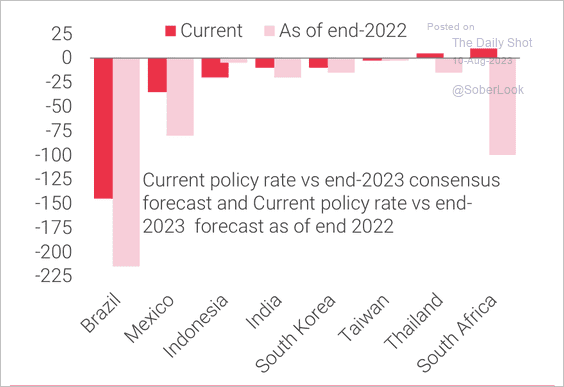
3. LatAm countries have the highest policy rates across EM and the most scope for rate cuts.
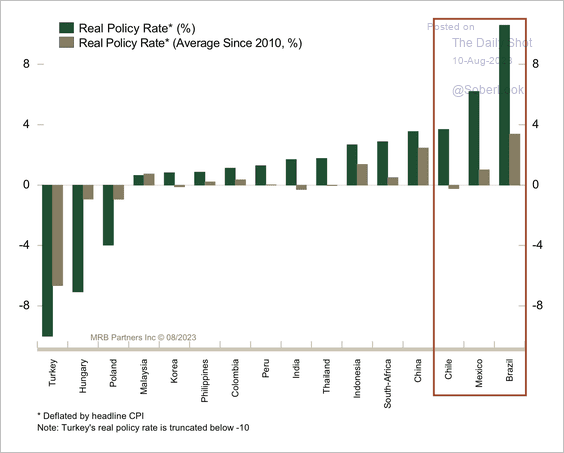 Source: MRB Partners
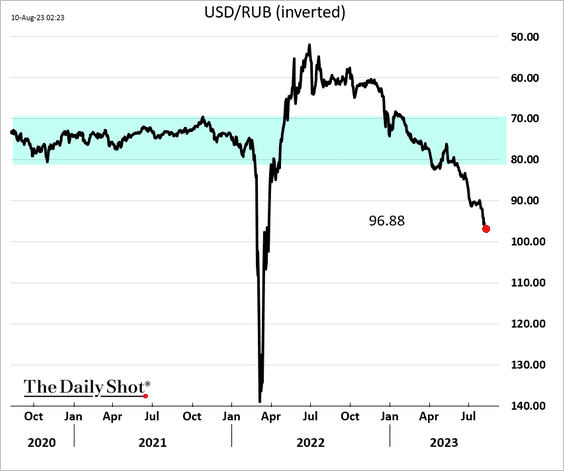
4. The ruble selloff continues.
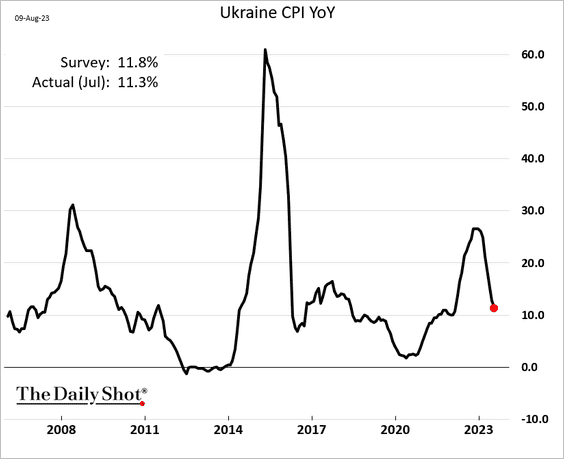
5. Ukraine’s inflation is moderating.
6. Analysts have scaled back their rate-cut outlooks.
 Source: TS Lombard
7. Improving growth differentials could benefit EM assets.
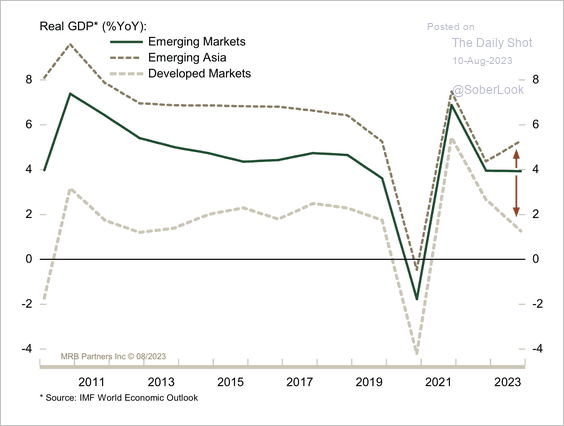 Source: MRB Partners
8. This chart shows the weight of food in each country’s inflation basket.
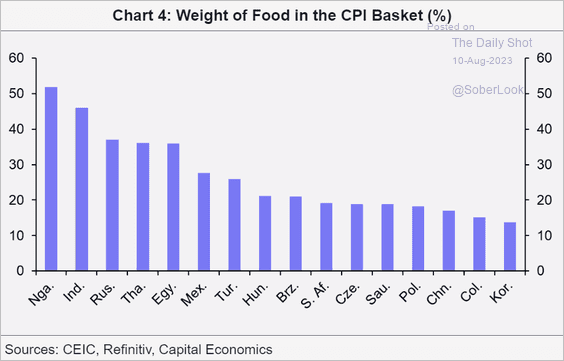 Source: Capital Economics
9. Here is a look at the US vs. China export share to EM economies.
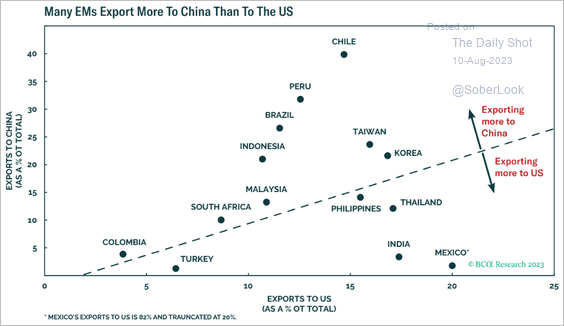 Source: BCA Research
Back to Index
Cryptocurrency
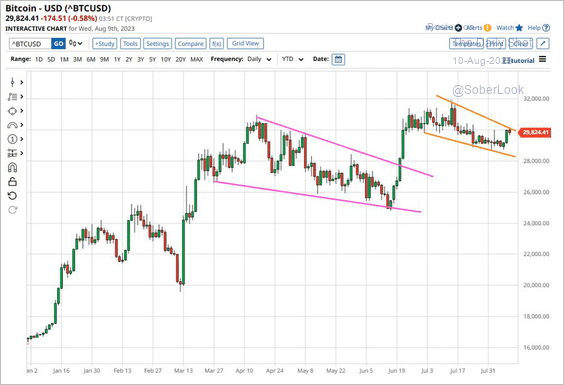
Another breakout ahead for Bitcoin?
 Source: @Barchart
Back to Index
Commodities
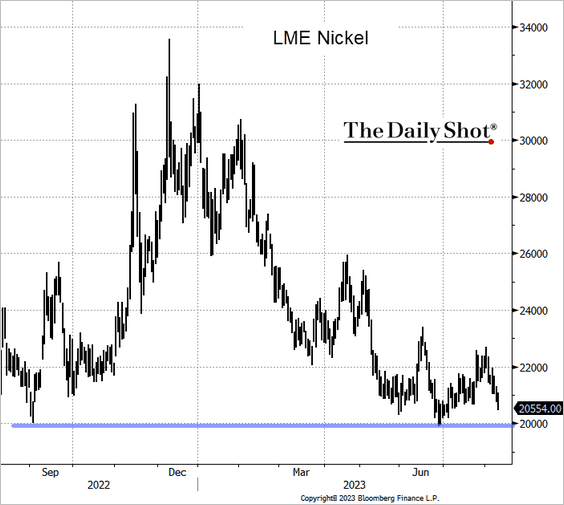
1. LME nickel is nearing support at $20k/MT.
 Source: @TheTerminal, Bloomberg Finance L.P.
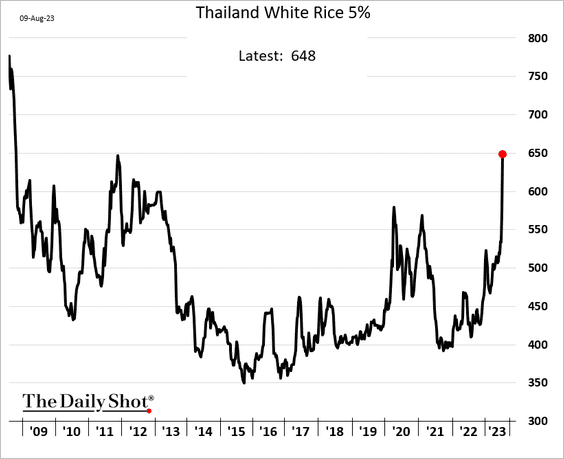
2. Rice futures in Asia surged this week.
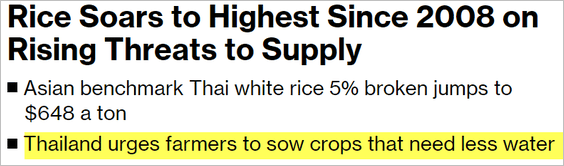 Source: @markets Read full article
——————–
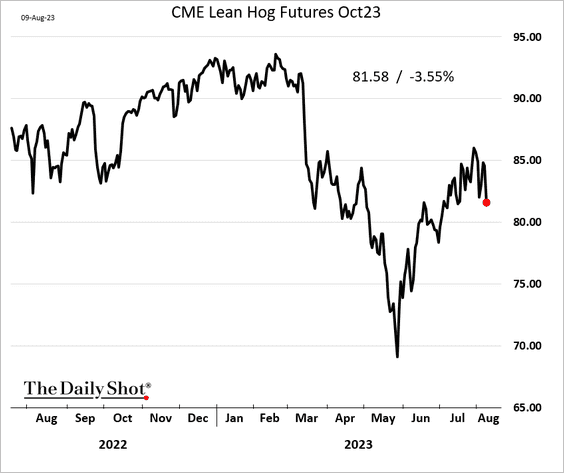
3. The rally in hog futures is fading.
Back to Index
Energy
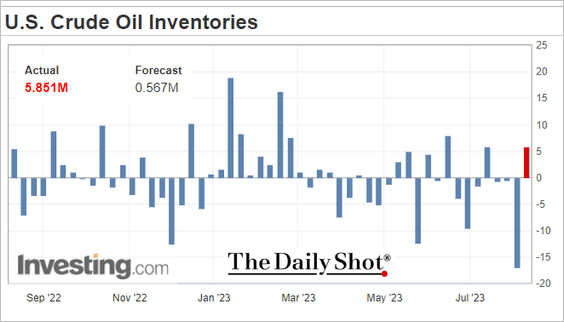
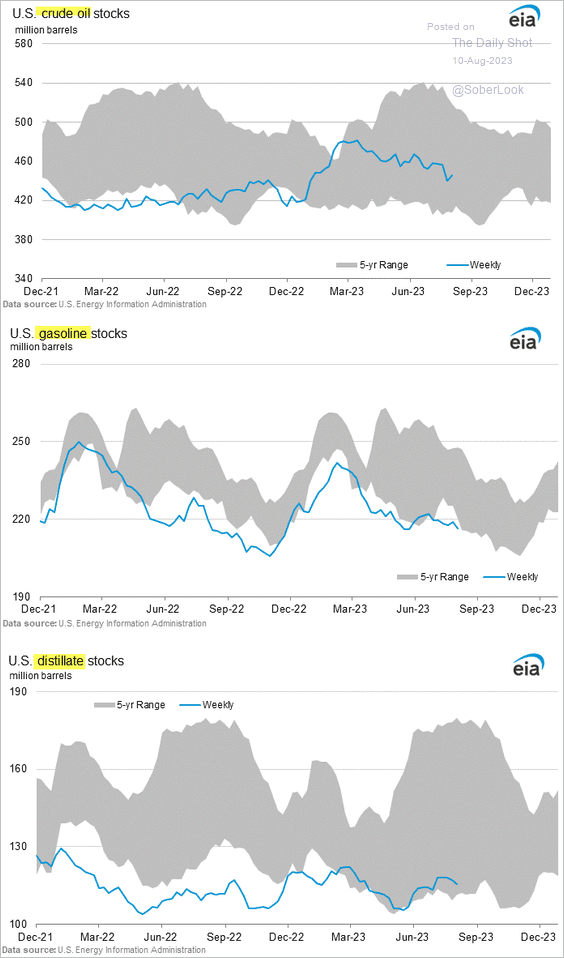
1. US oil inventories increased last week, …
… but refined product stockpiles dropped.
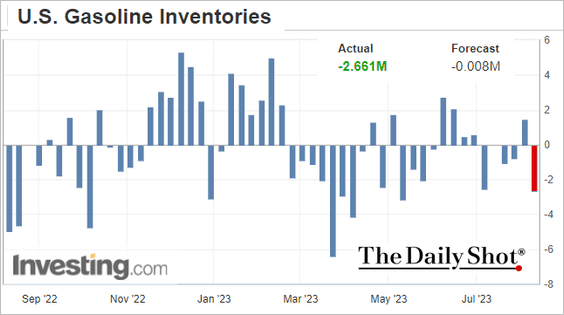
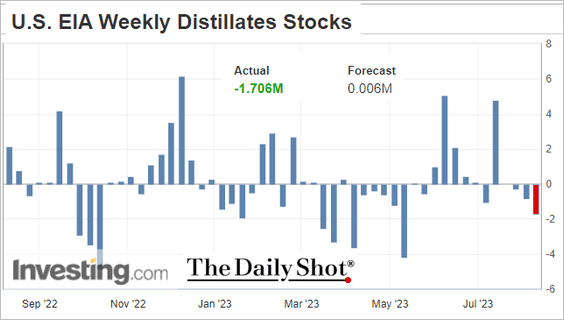
Here are the inventory levels.
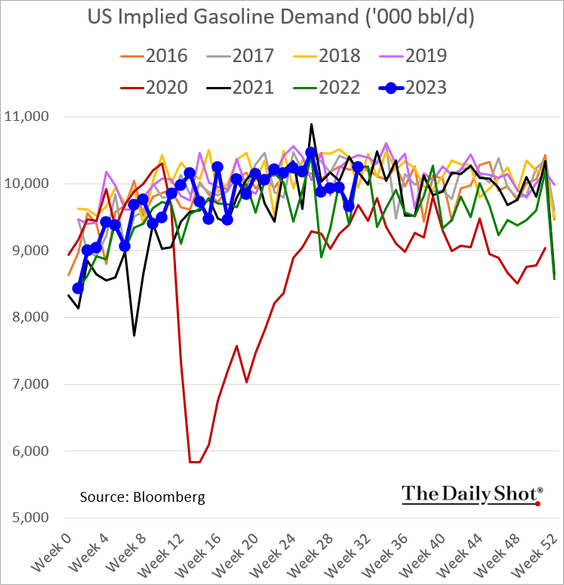
• Gasoline demand rebounded.
– Gasoline futures are surging.
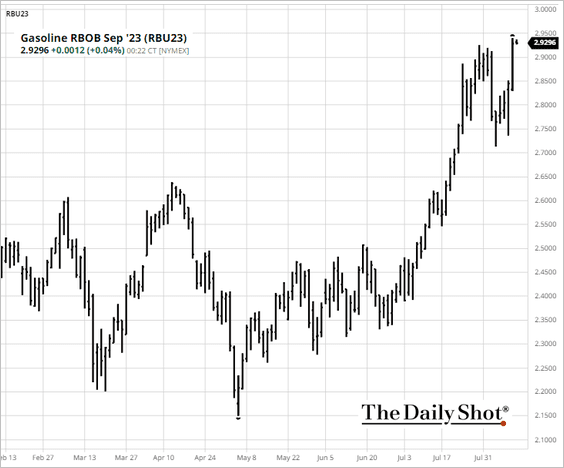 Source: barchart.com
• US refinery utilization is holding up well despite the heat wave.
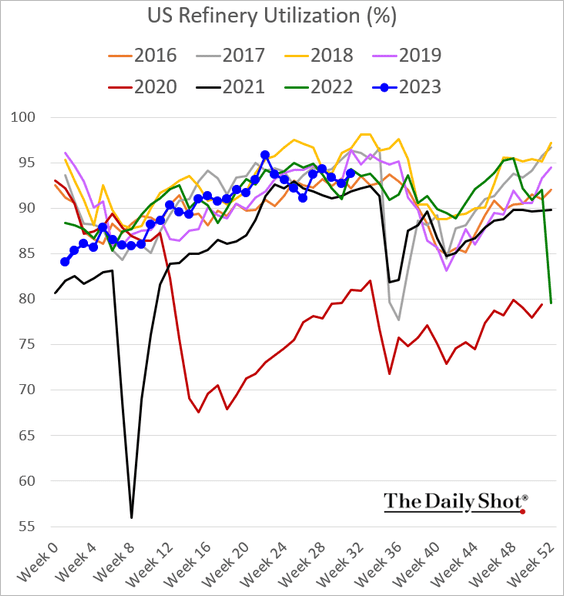
 Source: Reuters Read full article
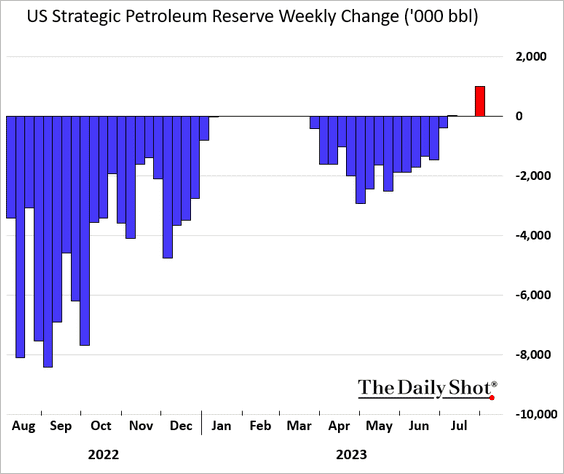
• The US increased the Strategic Petroleum Reserve last week.
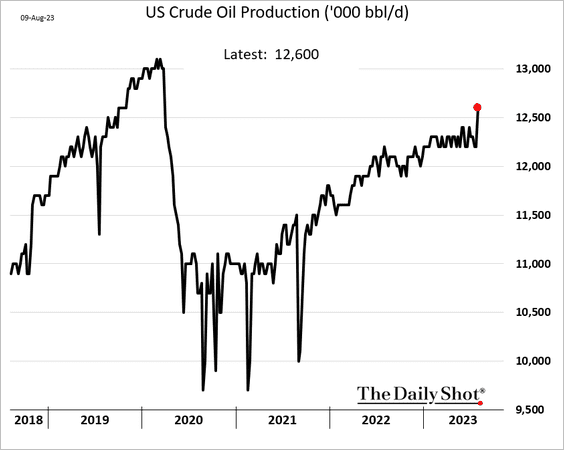
• US oil production hit the highest level since the 2020 COVID shock.
——————–
2. Crude oil continues to rally.
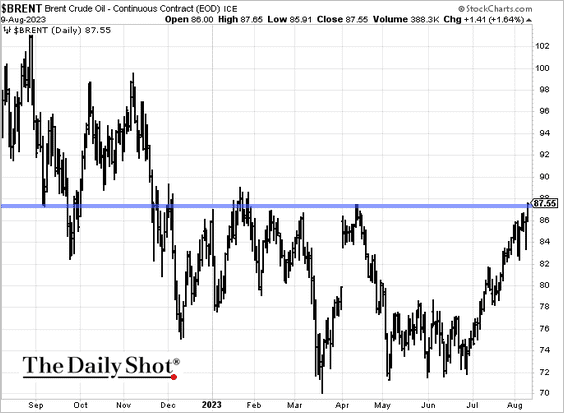
 Source: Reuters Read full article
——————–
3. Here is a look at China’s oil imports by source.
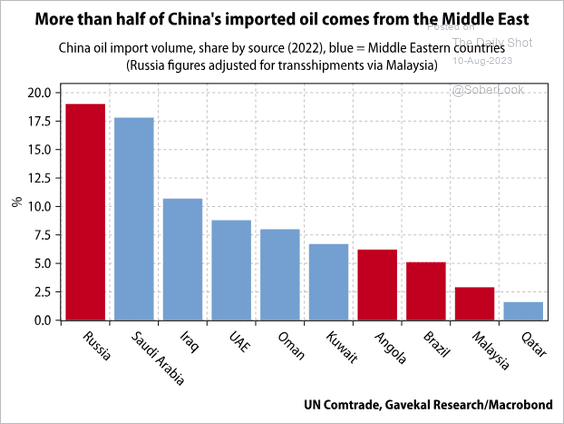 Source: Gavekal Research
4. Next, we have some updates on natural gas.
• Concerns about a strike at Australian LNG facilities drove a surge in European natural gas prices on Wednesday.
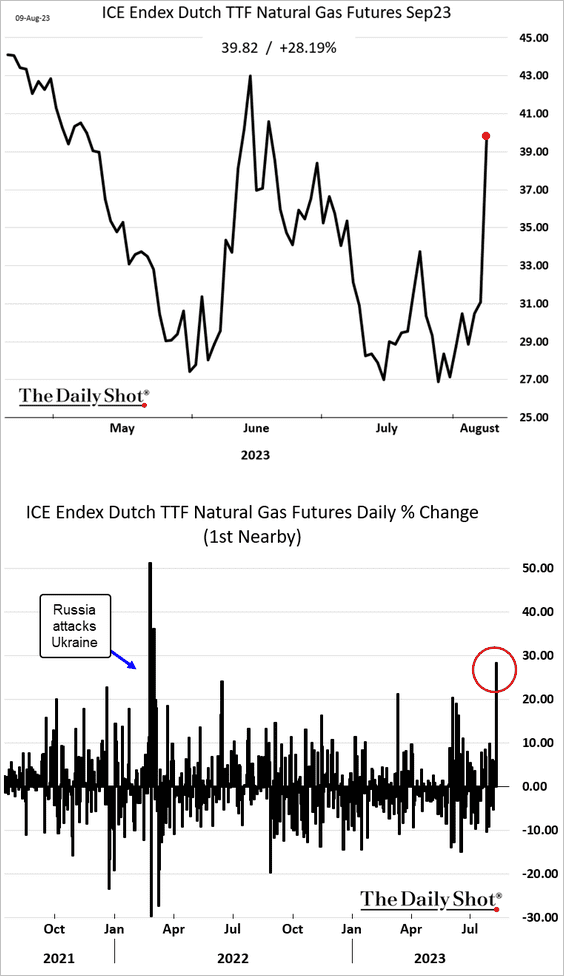
 Source: Reuters Read full article
– For now, European natural gas levels in storage are very high.
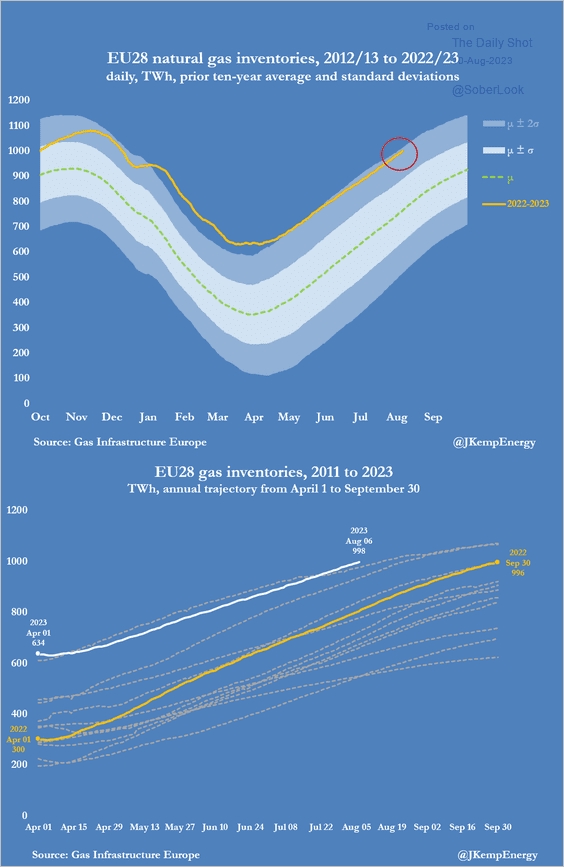 Source: @JKempEnergy
• US natural gas prices also climbed this week, boosted by the heatwave.
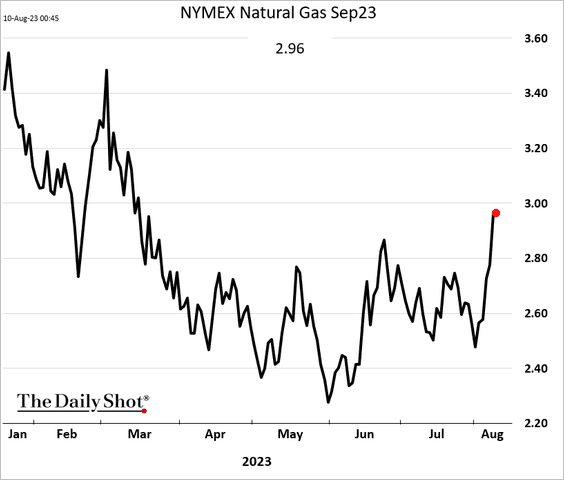
 Source: barchart.com Read full article
 Source: NOAA
Back to Index
Equities
1. Here is a look at the S&P 500 adjusted for inflation (relative to its peak).
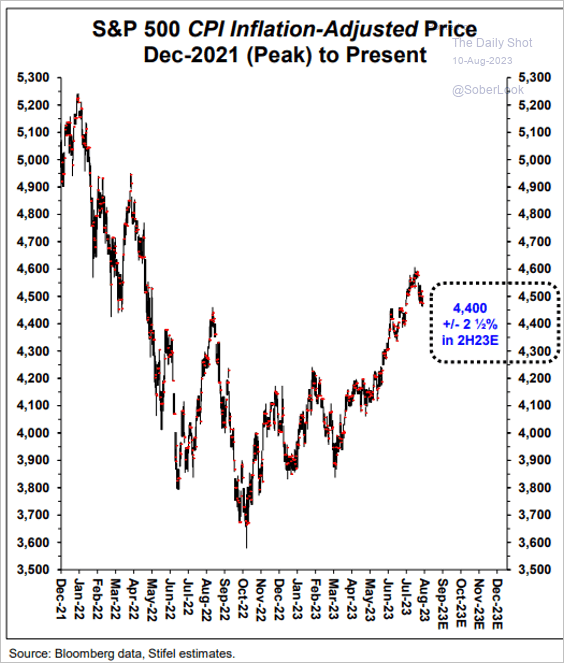 Source: Stifel
2. Corporate cash levels have been declining, driven mostly by smaller firms in the S&P 500.
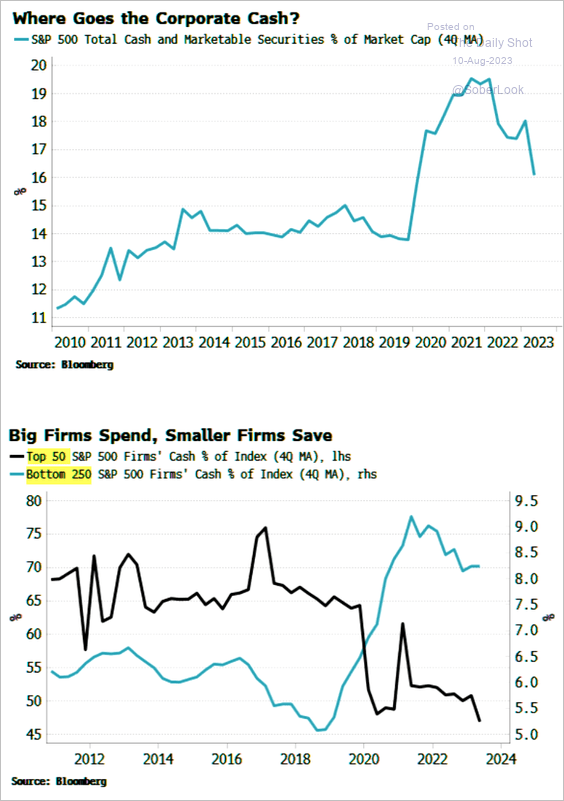 Source: Simon White, Bloomberg Markets Live Blog
3. Institutional outflows from equities slowed last month.
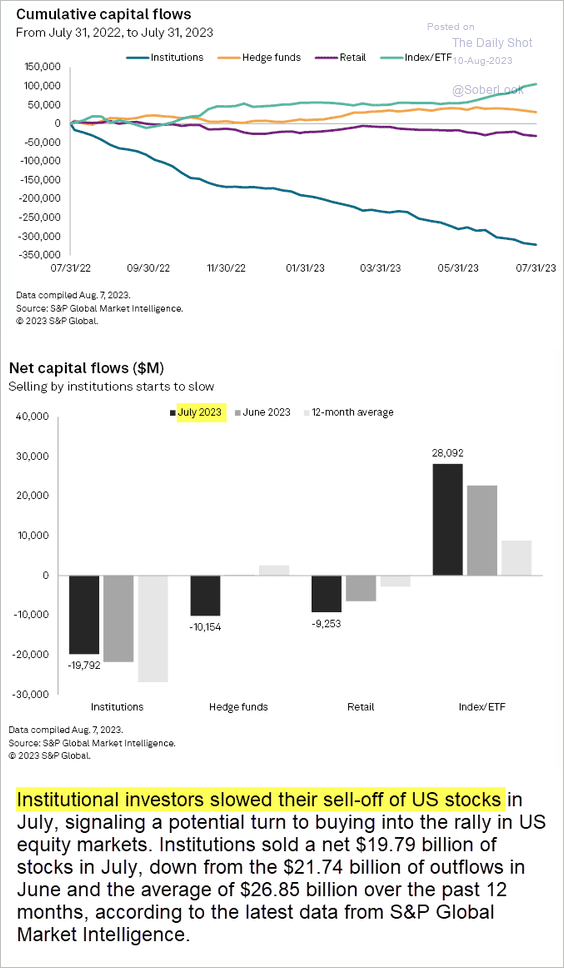 Source: S&P Global Market Intelligence
4. Seasonals suggest the S&P 500 could enter a choppy trading range.
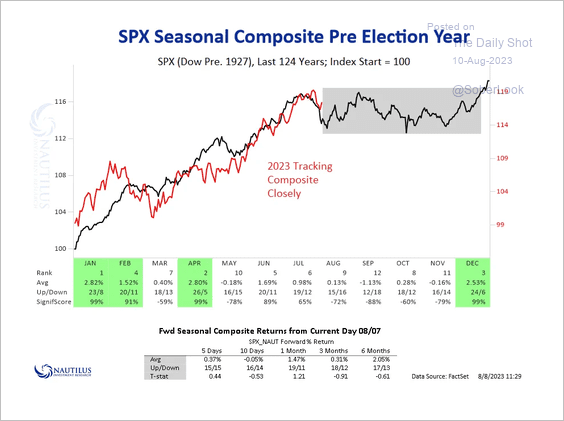 Source: @NautilusCap
5. Retail share of options trading remains elevated.
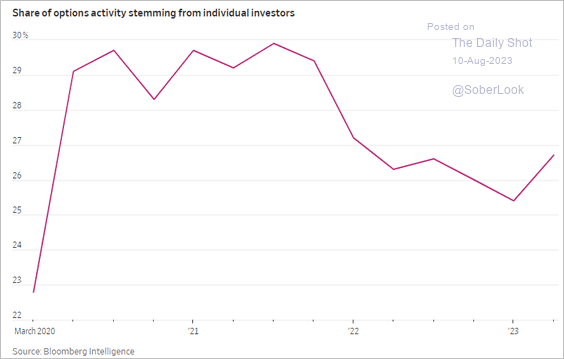 Source: @WSJ Read full article
Trading in options maturing in less than 24 hours hit a record high.
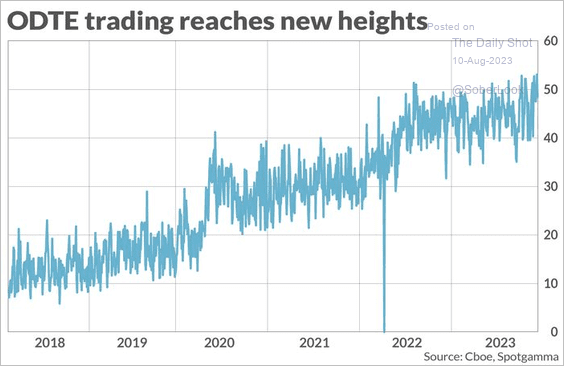 Source: MarketWatch Read full article
——————–
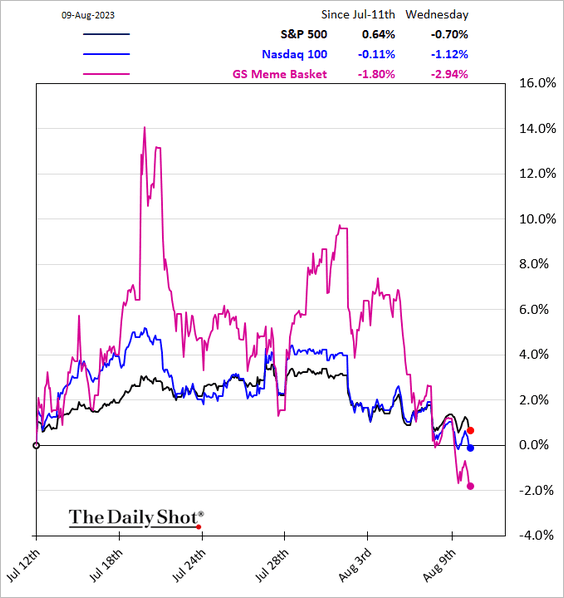
6. The Reddit crowd is turning cautious.
7. Value stocks look attractive.
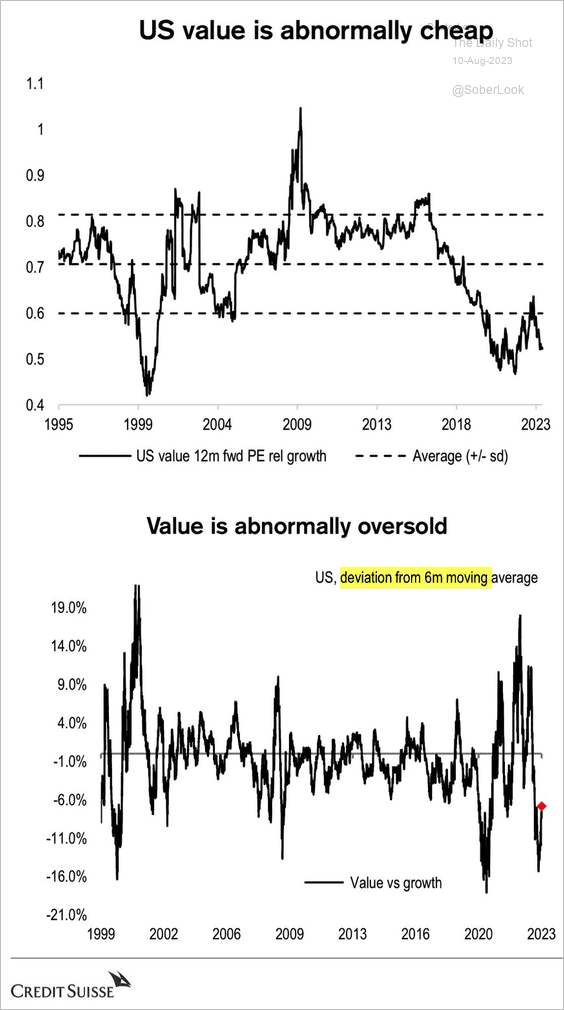 Source: Credit Suisse; @WallStJesus
8. This chart shows the size distribution for US public companies over time.
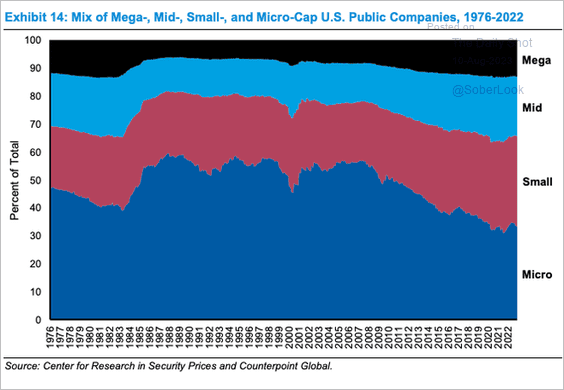 Source: @KoyfinCharts; h/t @dailychartbook
Back to Index
Alternatives
1. PE dry powder hit a new high this year.
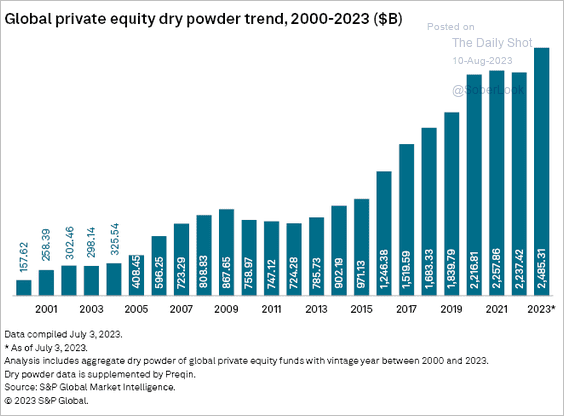 Source: S&P Global Market Intelligence
2. Private debt fundraising slowed in the first half of the year.
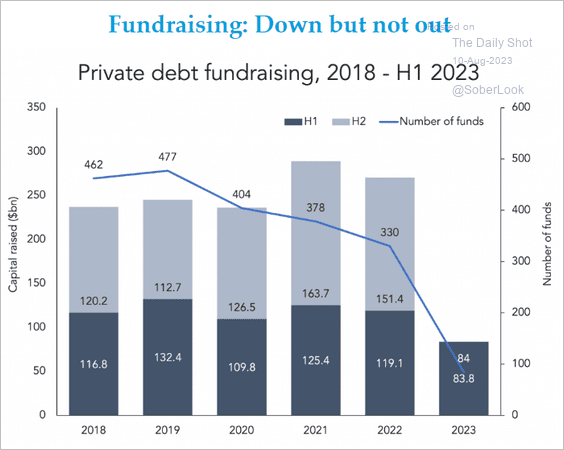 Source: @theleadleft
3. Here is a look at sponsored middle-market direct lending activity.
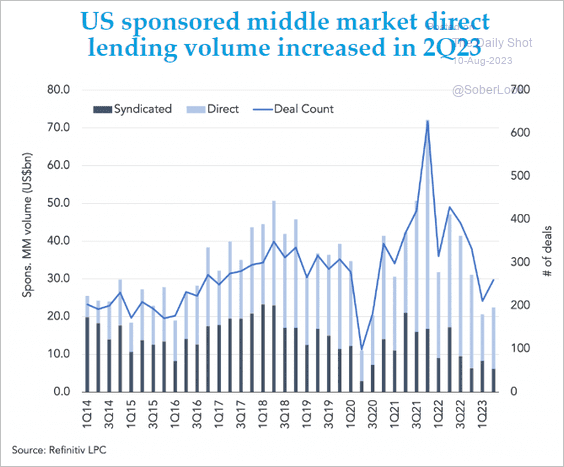 Source: @theleadleft
4. Next, we have a couple of VC investment trends.
• Defense tech:
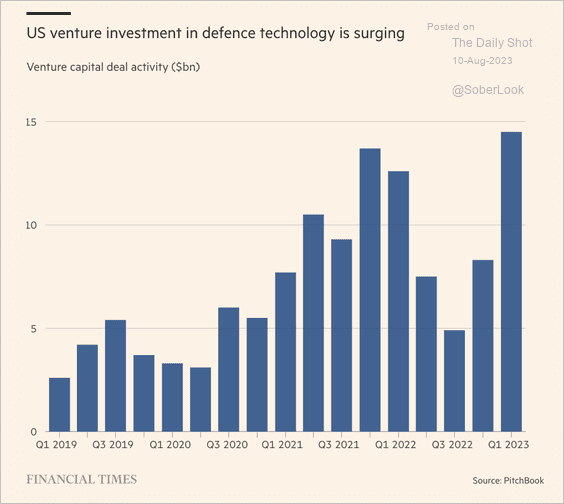 Source: @financialtimes Read full article
• Generative AI:
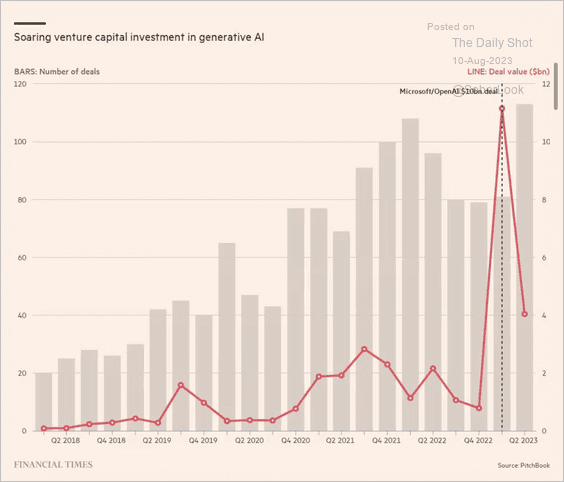 Source: @financialtimes Read full article
——————–
5. US emerging managers (niche firms that have launched fewer than four funds) are on track for their worst fundraising performance in seven years.
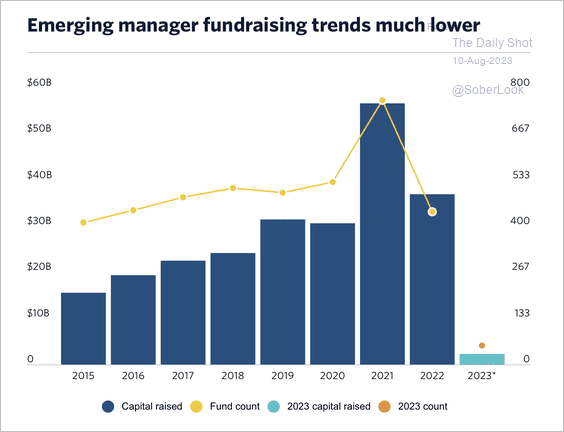 Source: PitchBook
6. US growth equity is on track to make up a larger share of private equity deal-making and could outnumber leveraged buyouts this year. According to PitchBook, firms are turning to strategies that require smaller check sizes and less leverage.
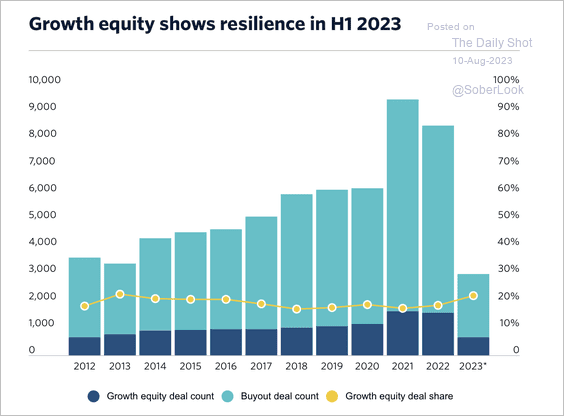 Source: PitchBook
7. US private equity funds continue to mark down the value of their portfolios, which began around the second half of 2022. According to PitchBook, fewer exit opportunities means fewer chances to mark up portfolios through realized returns.
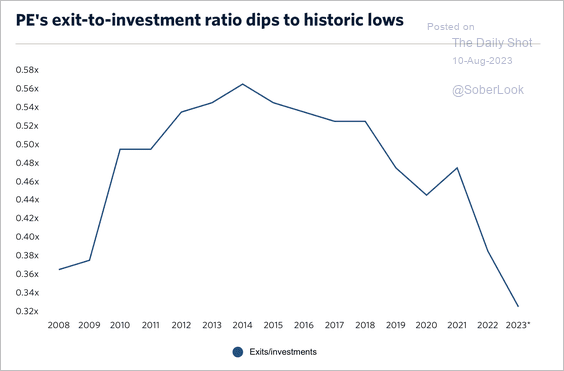 Source: PitchBook Read full article
 Source: CLSA
Back to Index
Rates
1. Treasury auction demand signals concerns about the yield curve steepening.
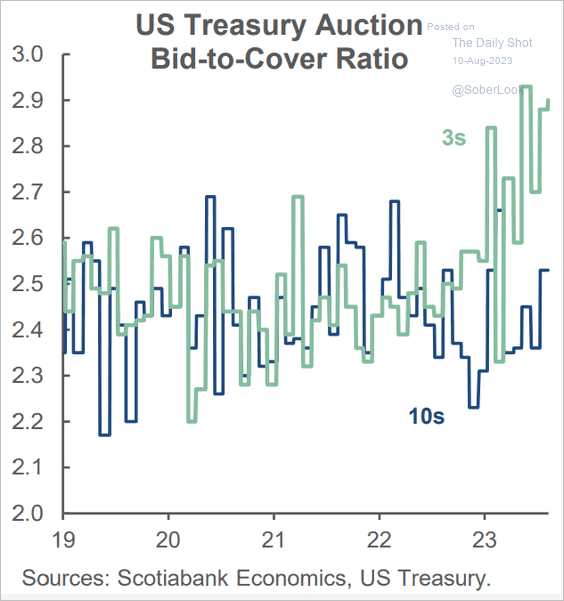 Source: Scotiabank Economics
2. Real rate curves remain heavily inverted.
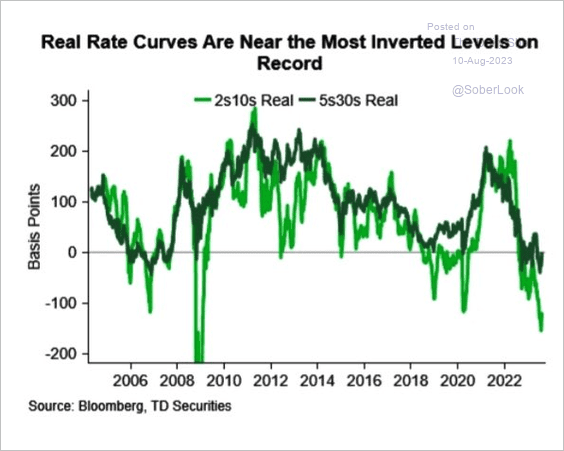 Source: TD Securities
3. Treasury term premia are still broadly in line with levels observed in 2015-2019 when core inflation was comfortably below target. The dislocation with forward breakevens suggests further scope for upside in term premia.
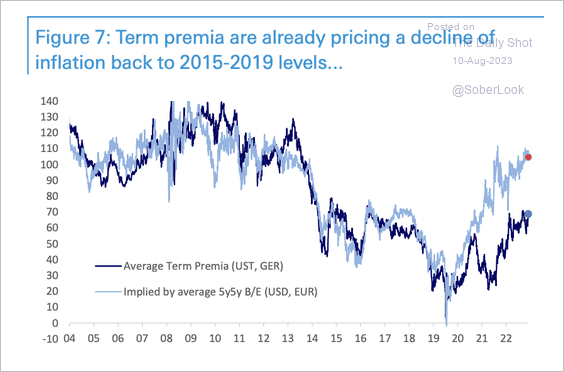 Source: Deutsche Bank Research
Back to Index
Global Developments
1. According to Capital Economics, financial conditions remain tight across advanced economies.
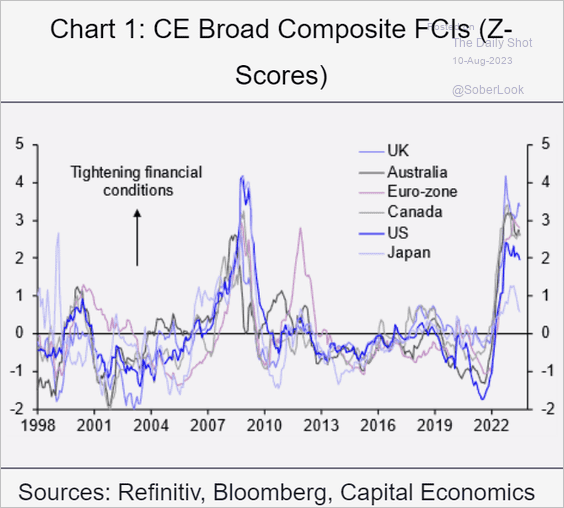 Source: Capital Economics
2. This chart shows the market cap of domestic companies as a share of each country’s GDP.
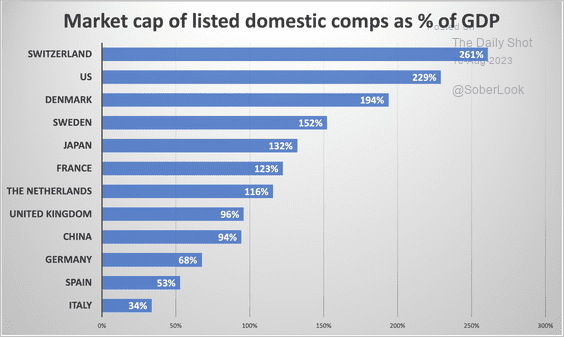 Source: @Schuldensuehner
3. Here is a comparison of the office real estate cycle positioning by region, according to Morgan Stanley.
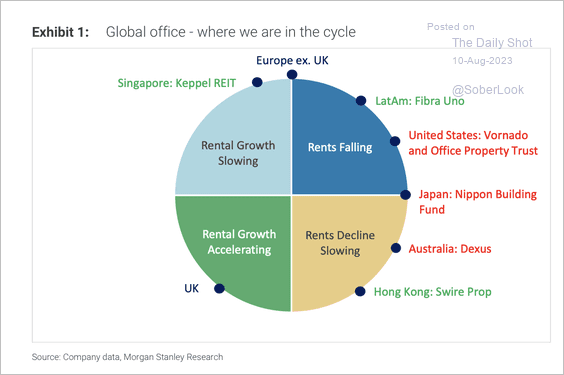 Source: Morgan Stanley Research
4. India’s and China’s share of trade in digital services continues to rise.
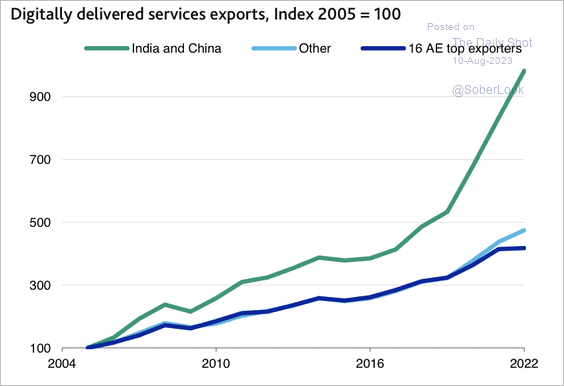 Source: Moody’s Investors Service
——————–
Food for Thought
1. US Manufacturing employment.
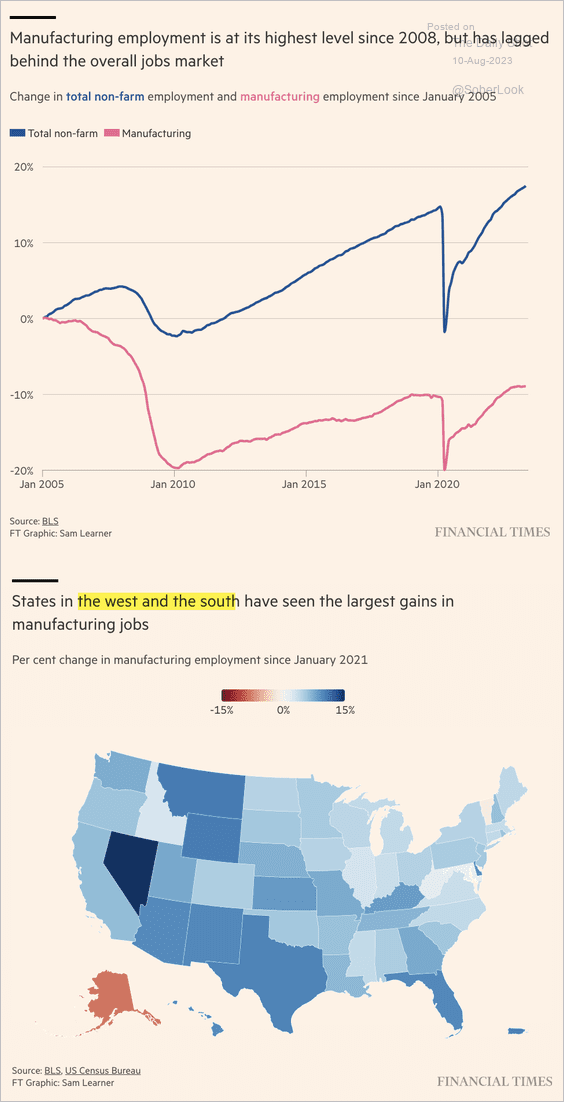 Source: @financialtimes Read full article
2. Americans with no religious affiliation:
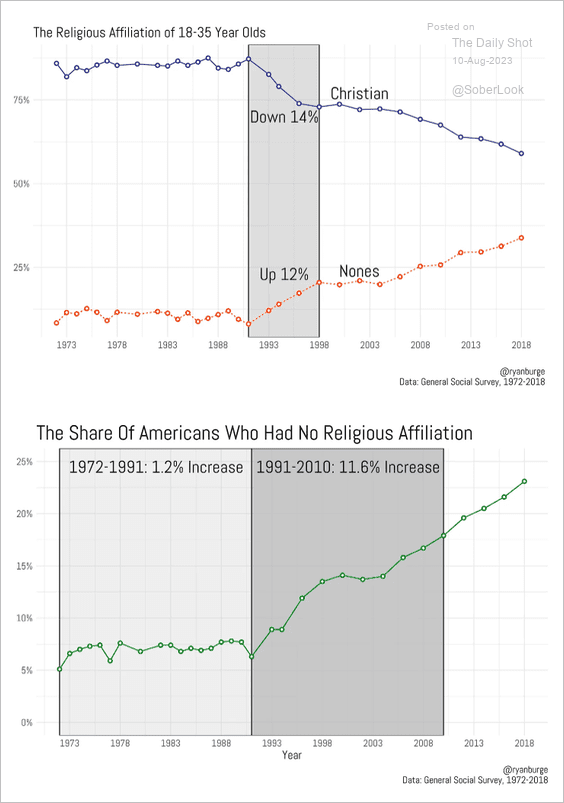 Source: @ryanburge
3. How old should the US president be?
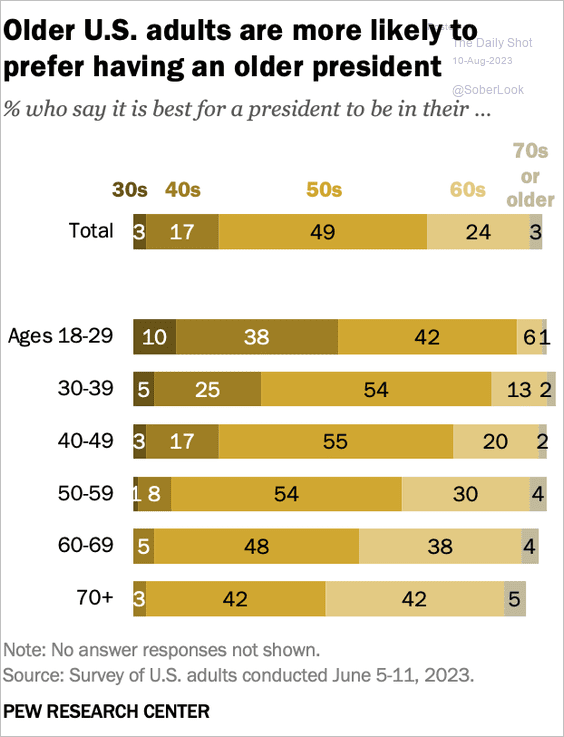 Source: Pew Research Center Read full article
4. Proportion of foreign-born individuals in the population:
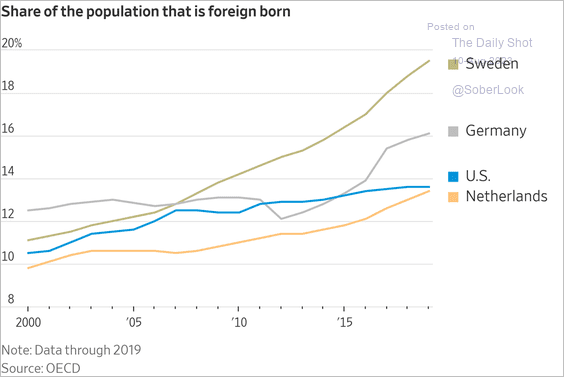 Source: @WSJ Read full article
5. Experiencing or witnessing pedestrian-vehicle interactions:
 Source: @CivicScience Read full article
6. Beneficiaries of the student loan forbearance program by income percentile:
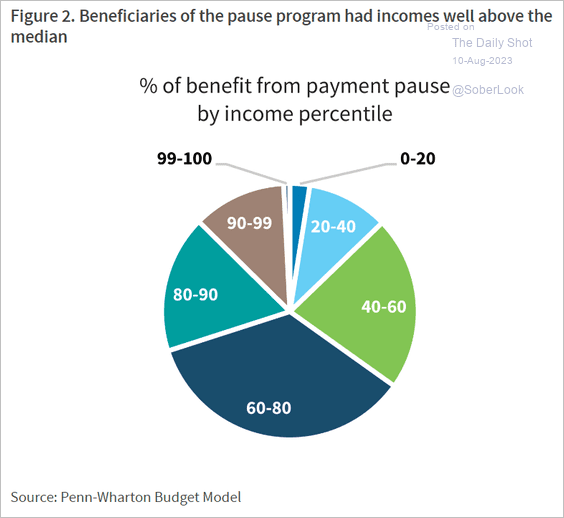 Source: Barclays Research
7. Credit card delinquencies by age:
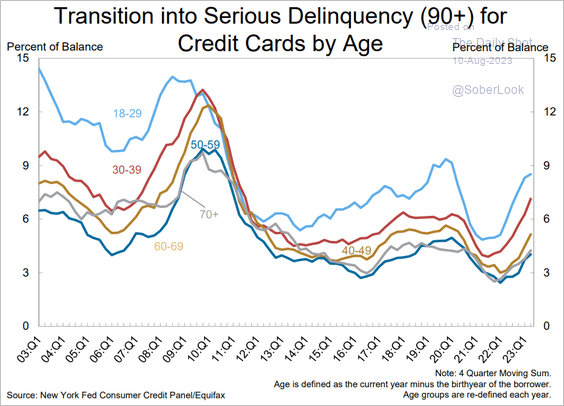 Source: Federal Reserve Bank of New York
8. Ticketmaster’s dominance:
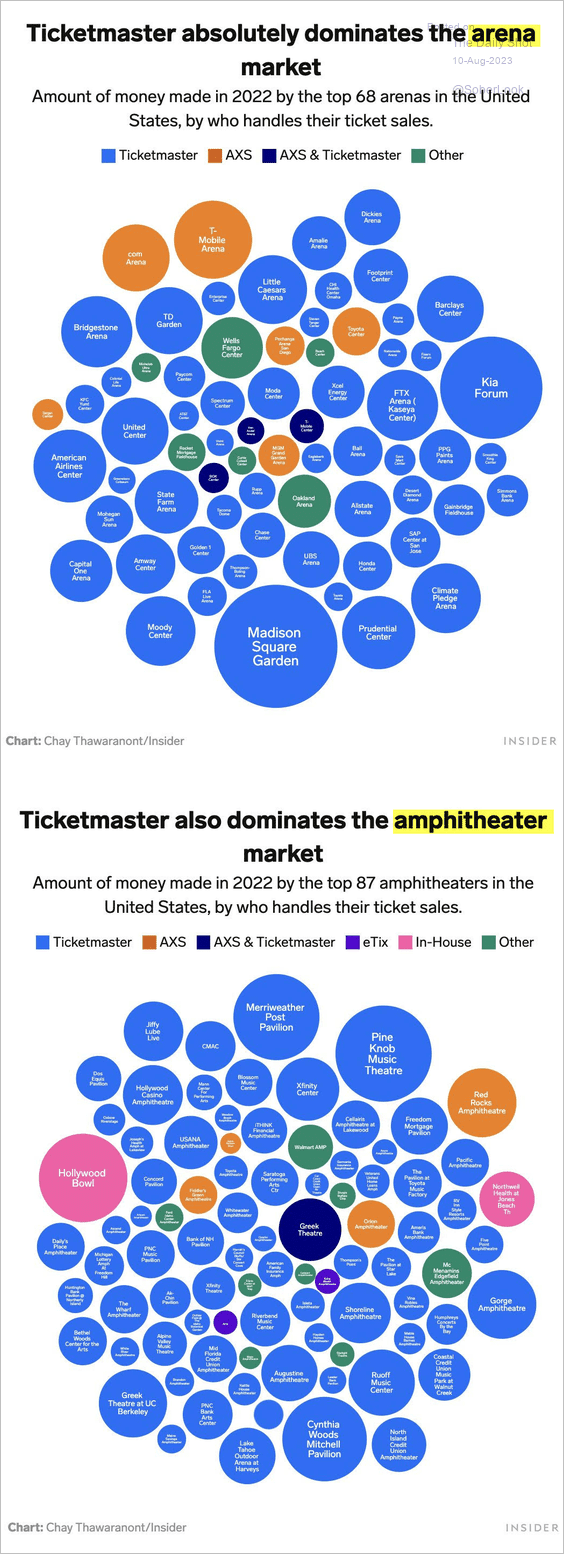 Source: Insider Read full article
——————–
Back to Index