
The Daily Shot: 14-Aug-23
• The United States
• The United Kingdom
• Europe
• Japan
• China
• Emerging Markets
• Cryptocurrency
• Commodities
• Energy
• Equities
• Credit
• Rates
• Global Developments
• Food for Thought
The United States
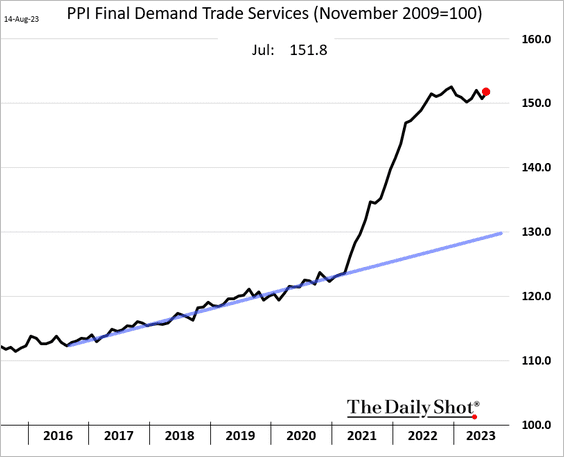
1. Producer prices increased more than expected last month, …
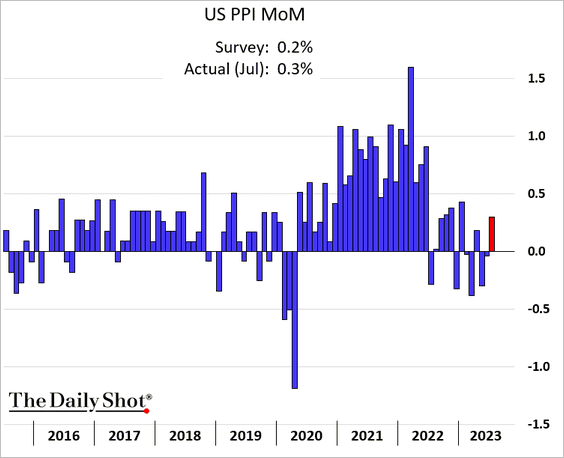
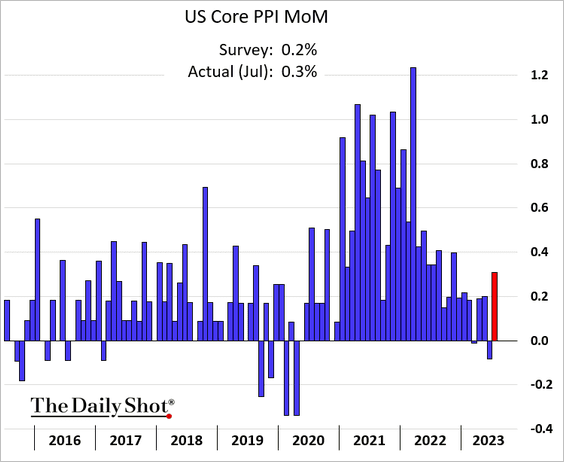
… boosted by services. Here are the annualized 6-month changes in the PPI components.
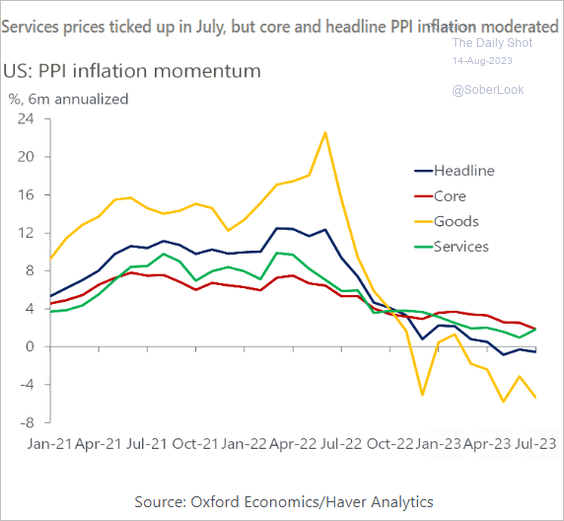 Source: Oxford Economics
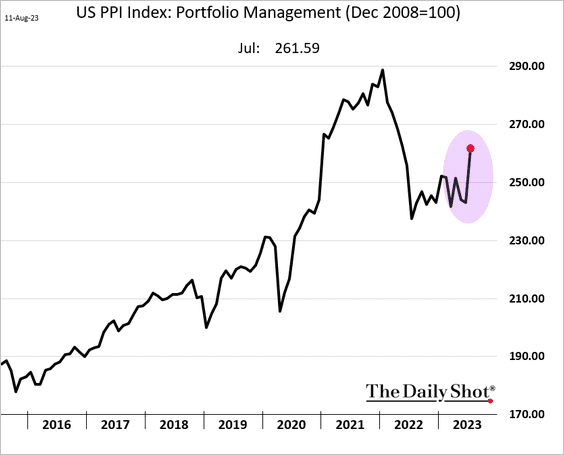
• One driver of the services PPI gains was a sharp increase in portfolio management fees. Stock market gains boosted the dollar amount charged for asset management.
 Source: MarketWatch Read full article
• Another driver was trade services, a measure of business markups (gross margins).
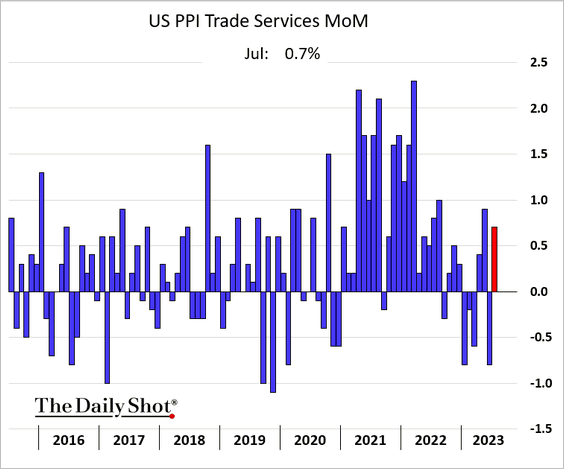
Despite signs of softer demand, corporate margins are not budging.
The S&P 500 ex-energy margins have been rising.
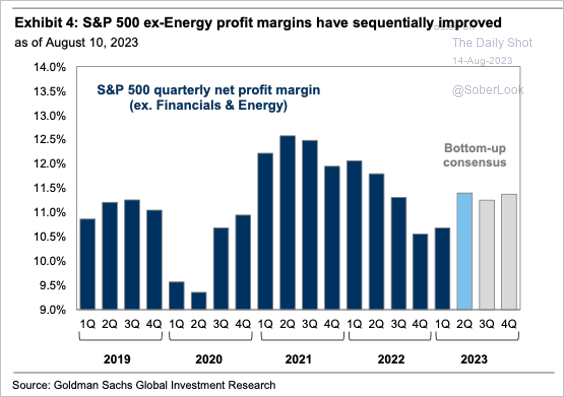 Source: Goldman Sachs; @SamRo Read full article
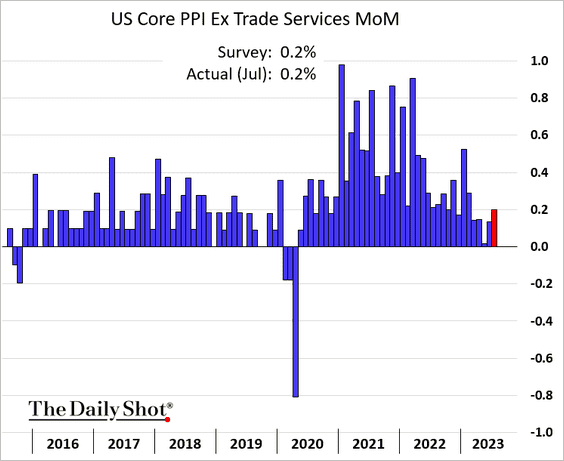
• Here is the core PPI excluding trade services.
——————–
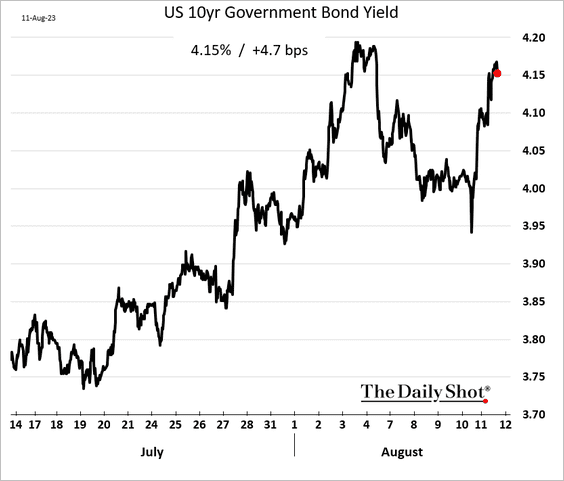
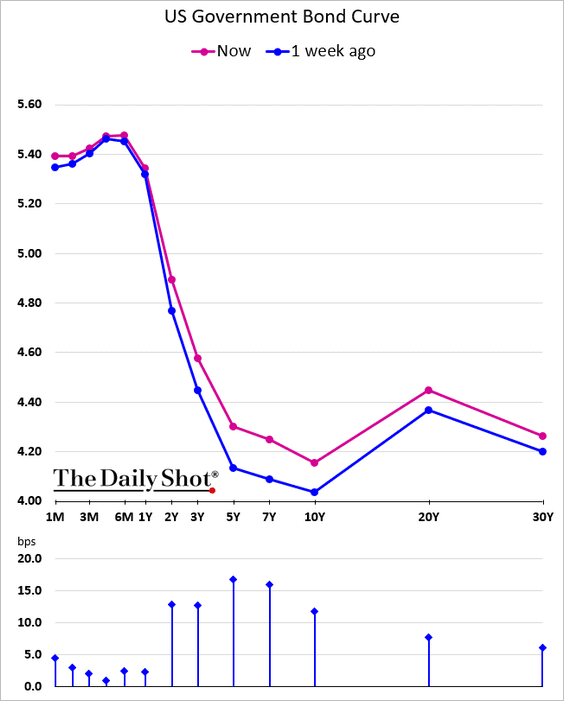
2. Treasury yields climbed further in response to the PPI report.
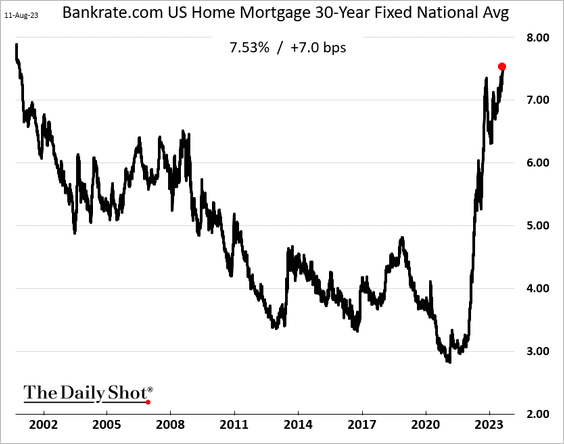
• According to Bankrate.com, the 30-year mortgage rate hit the highest level since 2001.
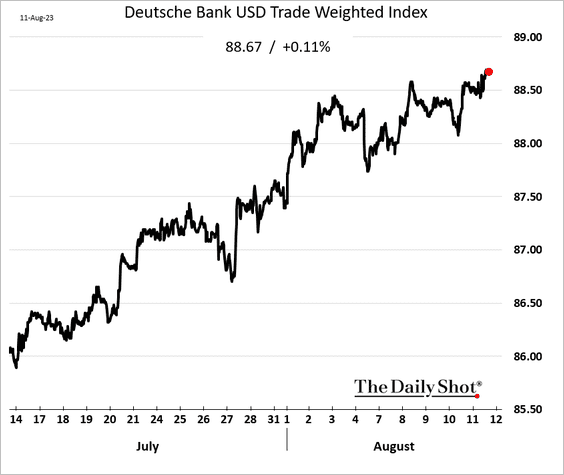
• The US dollar continues to grind higher.
——————–
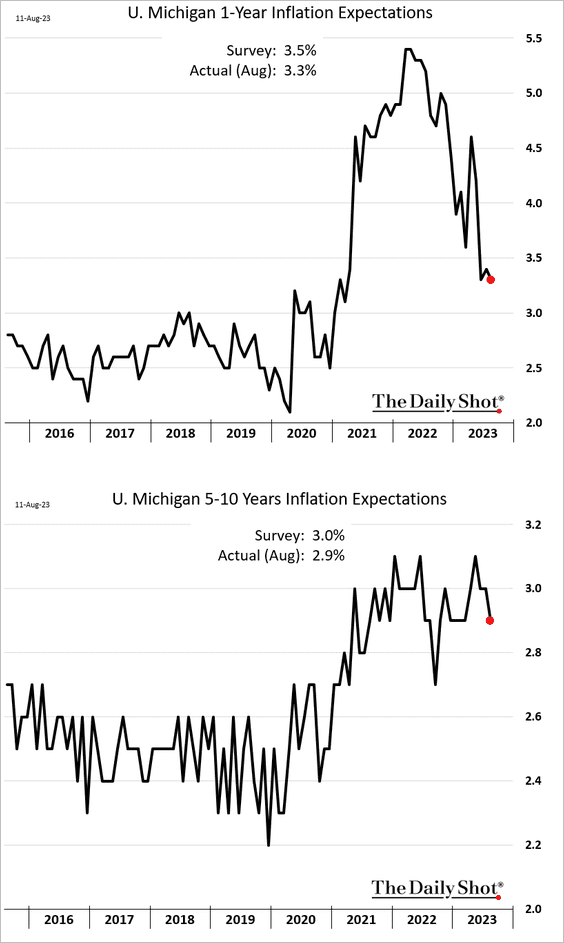
3. Next, we have some additional updates on inflation.
• Despite higher gasoline prices, consumer inflation expectations eased this month.
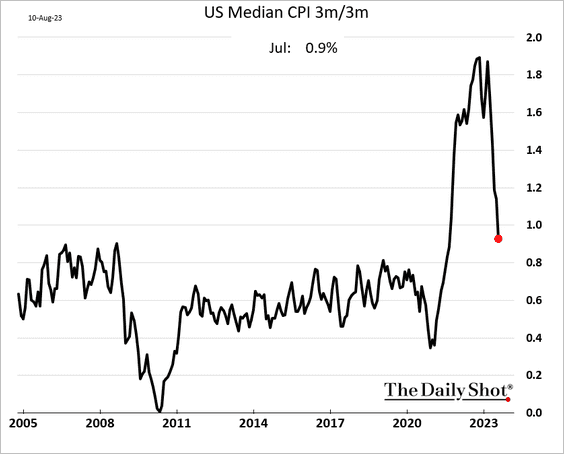
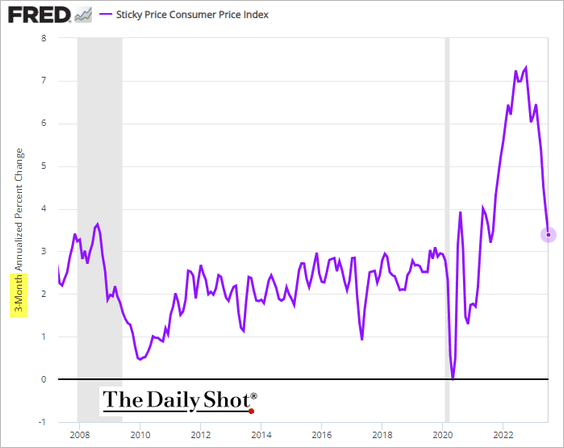
• Alternate measures of core inflation are moderating quickly.
– Median CPI (3-month change):
– Sticky inflation (3-month change, annualized):
• This chart shows price gains for items consumers buy every day.
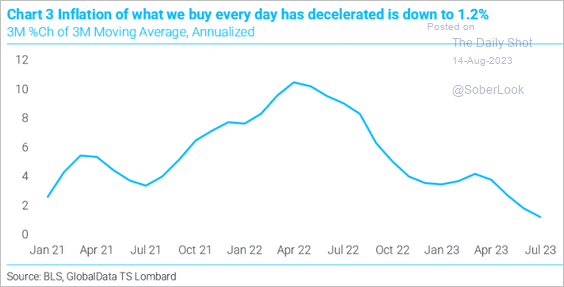 Source: TS Lombard
• Airline fares have been falling, …
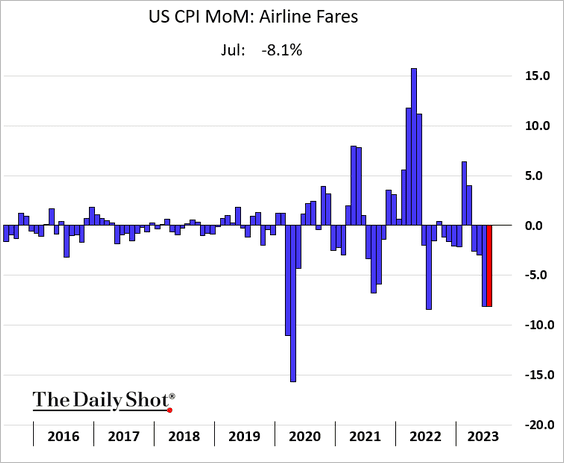
… but that’s about to reverse.
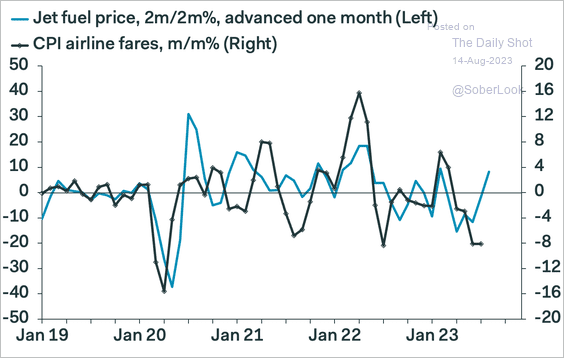 Source: Pantheon Macroeconomics
• Inflation has been cooling, and labor productivity showed improvement – an “orderly disinflation?”
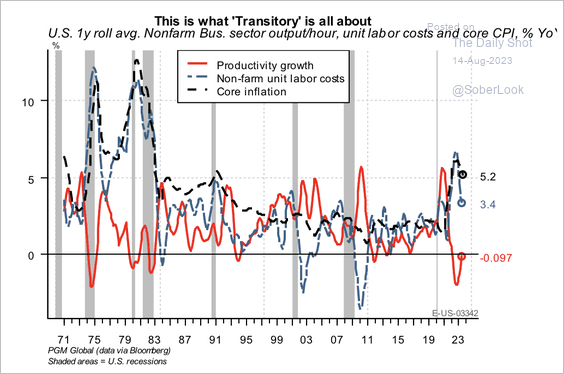 Source: PGM Global
——————–
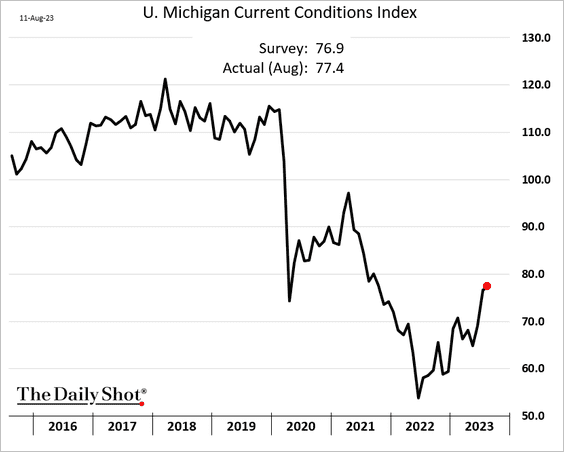
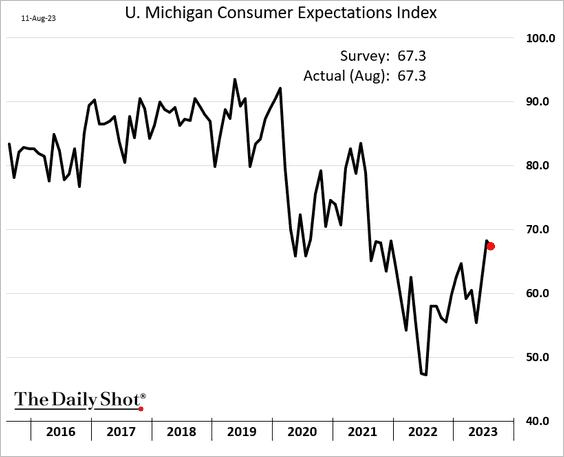
3. The U. Michigan index of consumer sentiment was roughly flat this month.
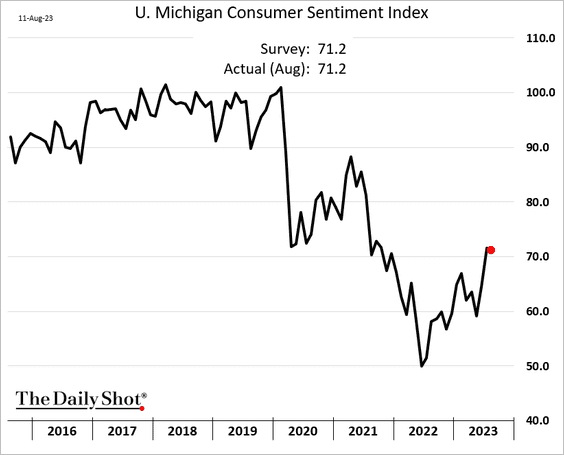
– The indicator of current conditions ticked up.
– The expectations index edged lower.
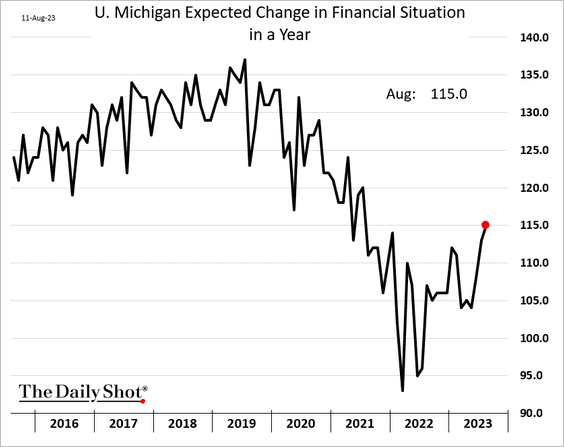
– Stock market gains boosted the expected changes in households’ financial situation.
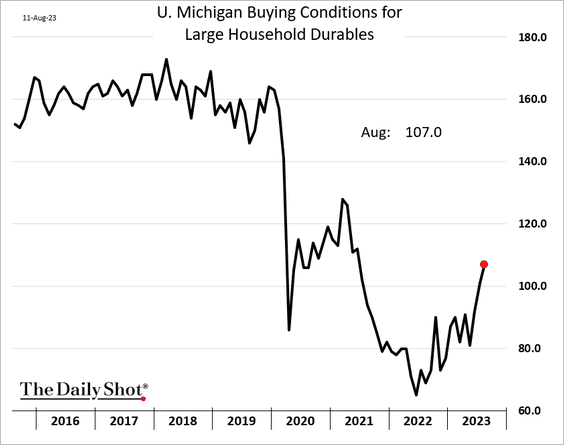
– Buying conditions for household durables improved again.
Back to Index
The United Kingdom
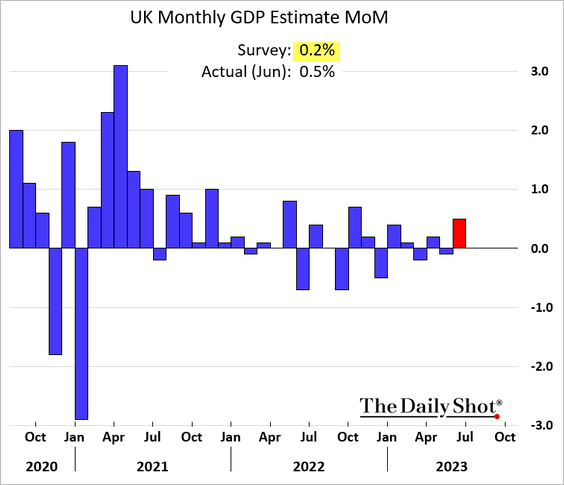
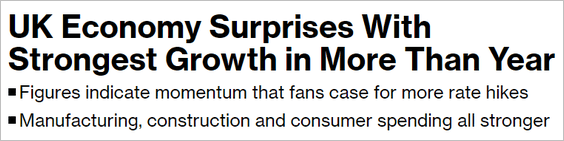
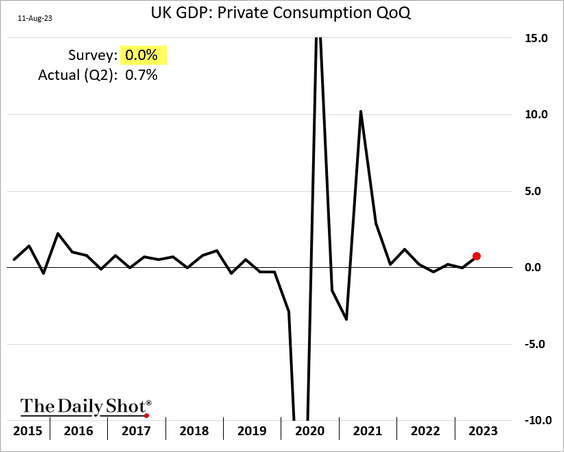
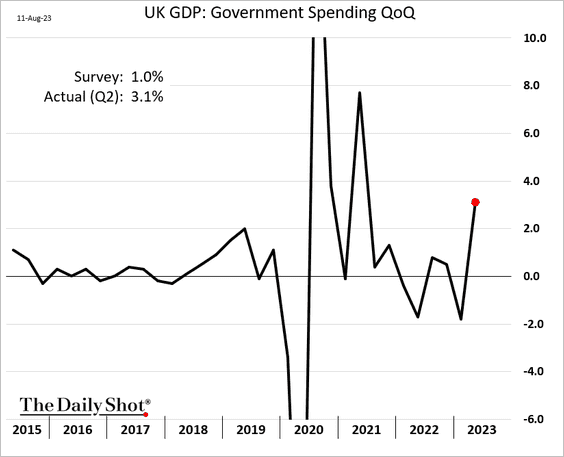
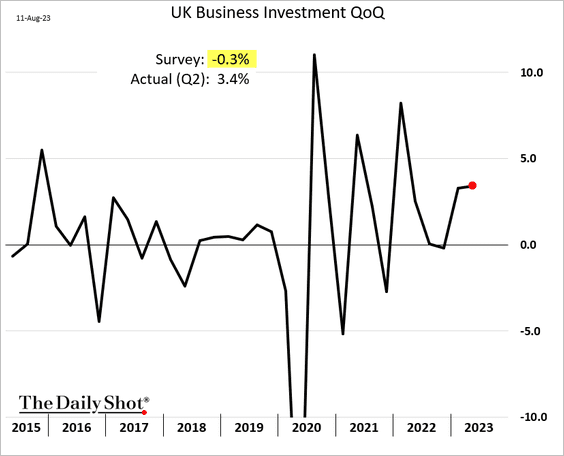
1. The GDP report surprised to the upside, …
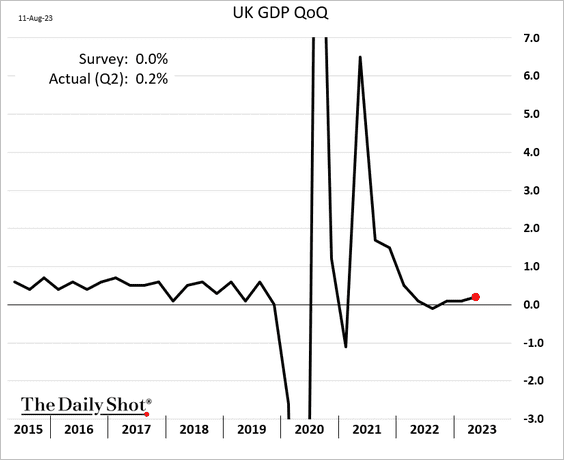
… with robust gains in June.
 Source: @economics Read full article
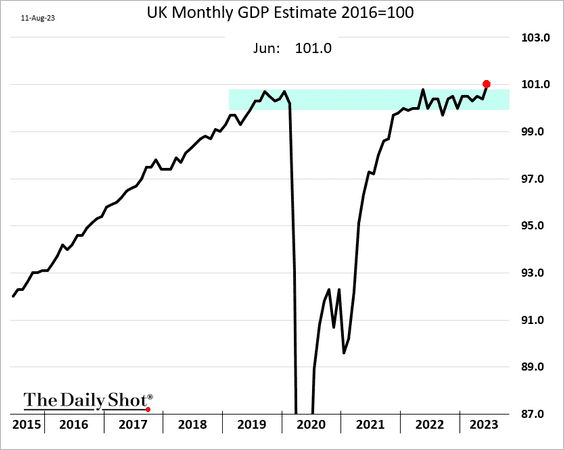
Here is the GDP level.
• Private consumption topped expectations.
• And so did government spending …
… and business investment.
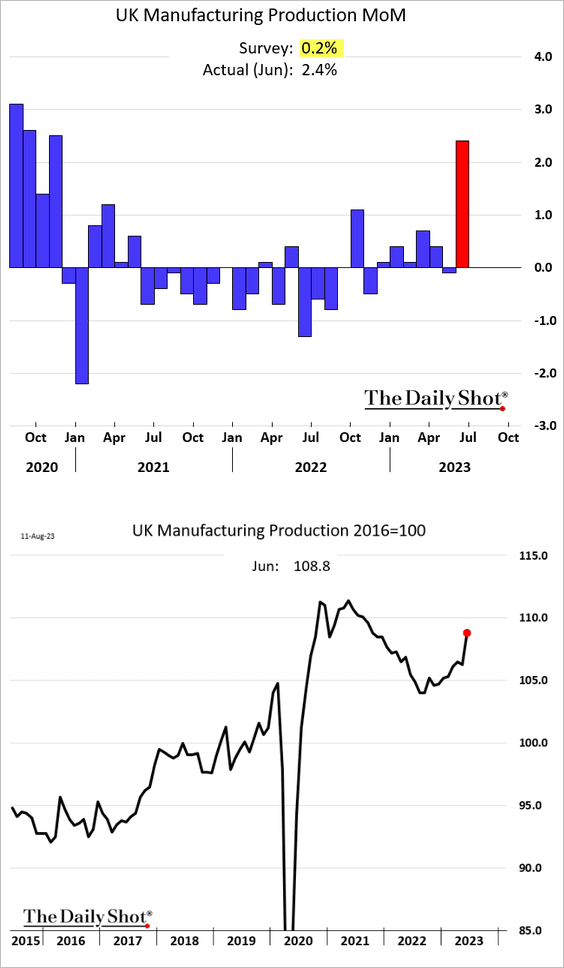
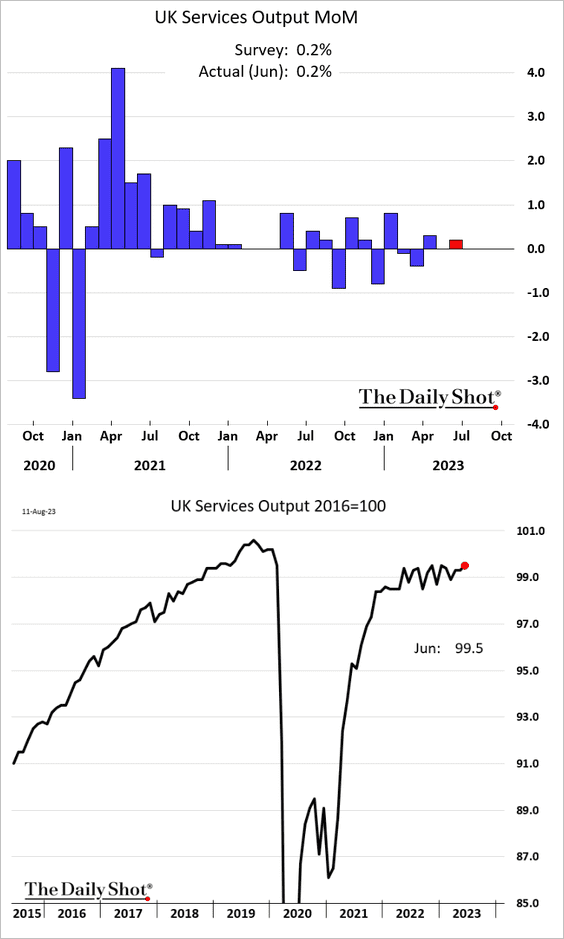
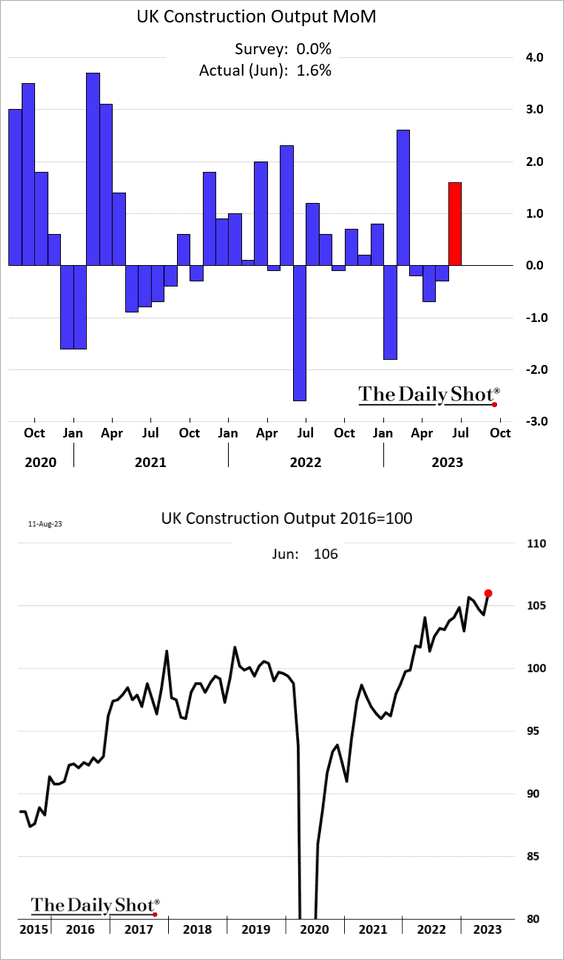
2. Production indicators all increased.
• Manufacturing:
• Services:
• Construction:
——————–
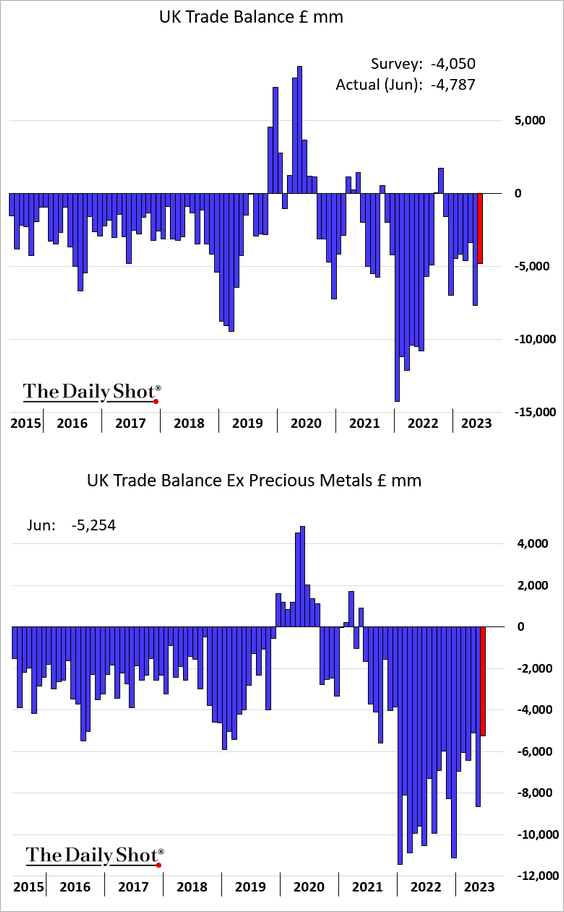
3. Exports continue to slow.
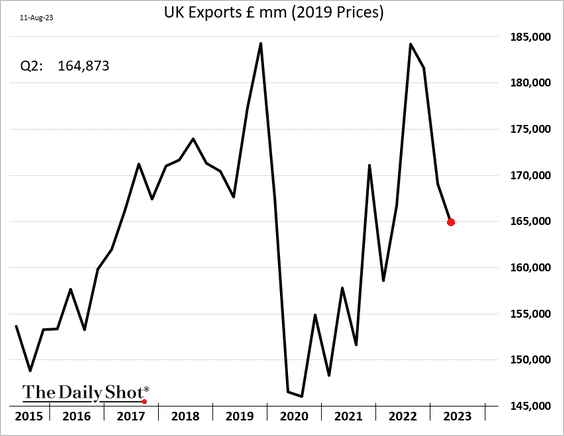
Here is the trade balance.
——————–
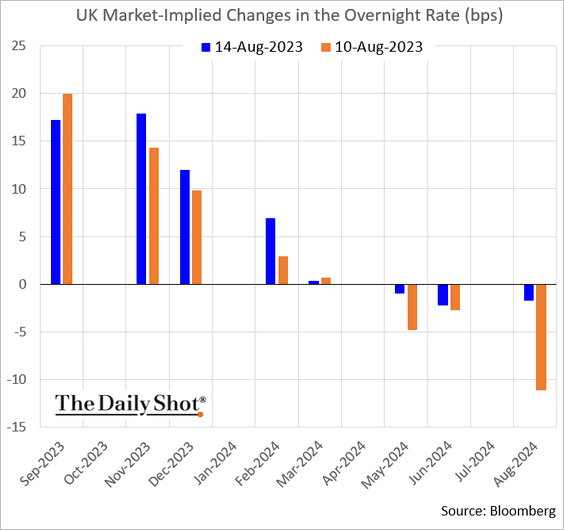
4. Gilt yields climbed in response to the GDP surprise.
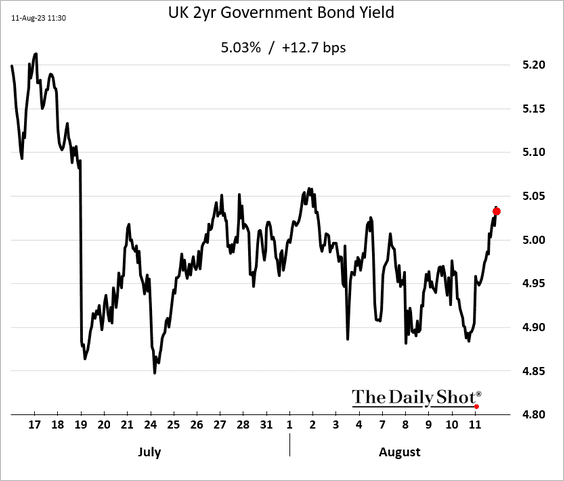
Another two rate hikes look likely.
Back to Index
Europe
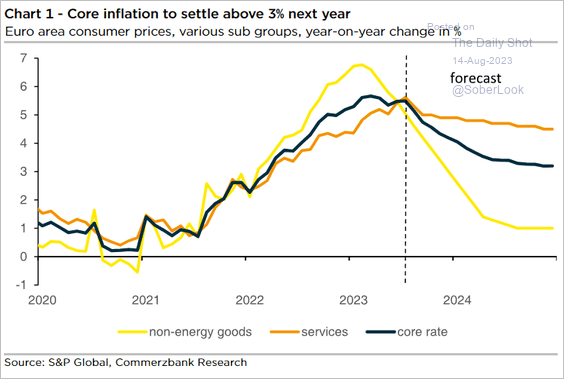
1. With the euro-area services inflation expected to remain stubbornly high, …
 Source: Commerzbank Research
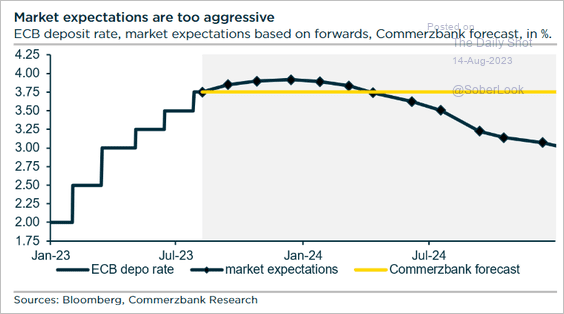
… Commerzbank Research projects the ECB will keep rates elevated for some time.
 Source: Commerzbank Research
——————–
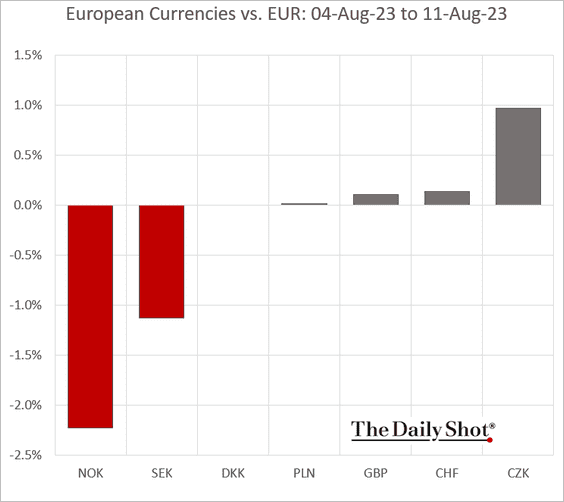
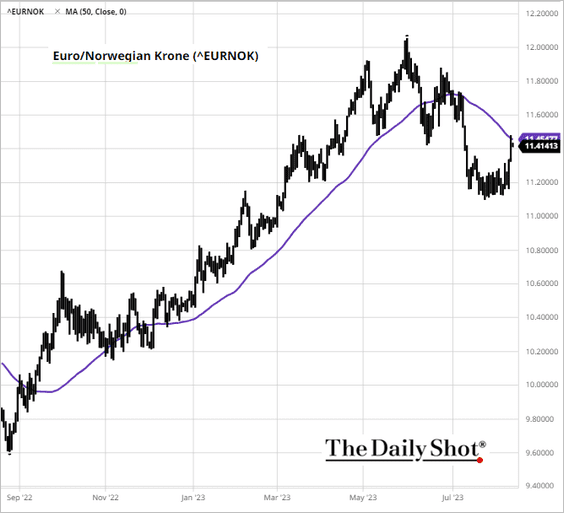
2. The Norwegian krone took a hit last week.
EUR/NOK is testing resistance at the 50-day moving average.
——————–
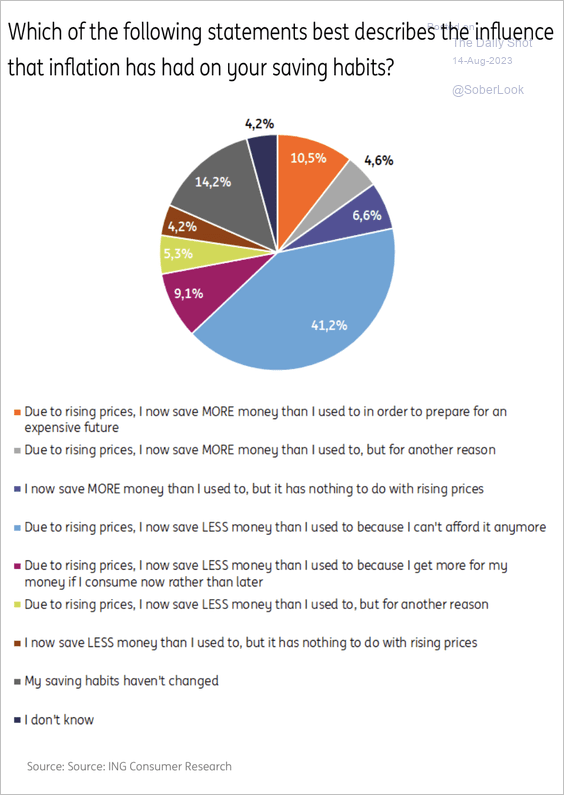
3. Households across Europe expect to save less and spend more due to high inflation, according to a survey by ING. (2 charts)
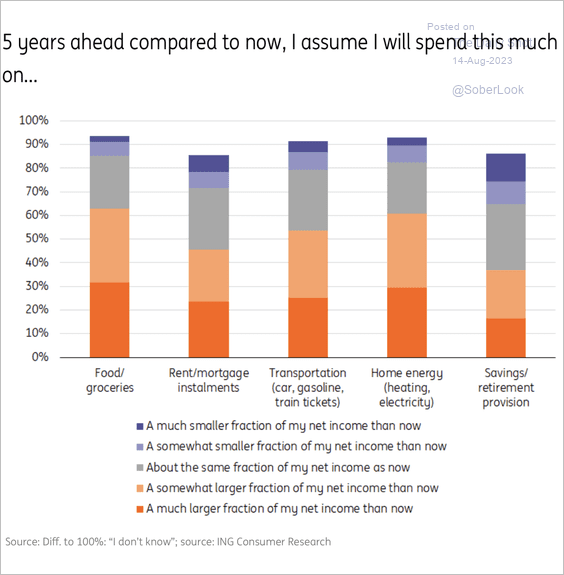 Source: ING
 Source: ING
Back to Index
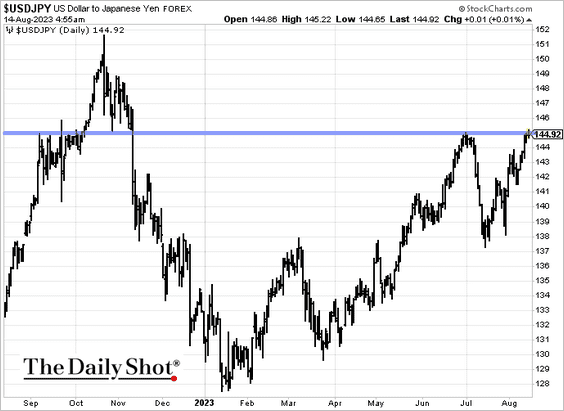
Japan
Dollar-yen is testing resistance at 145.
Back to Index
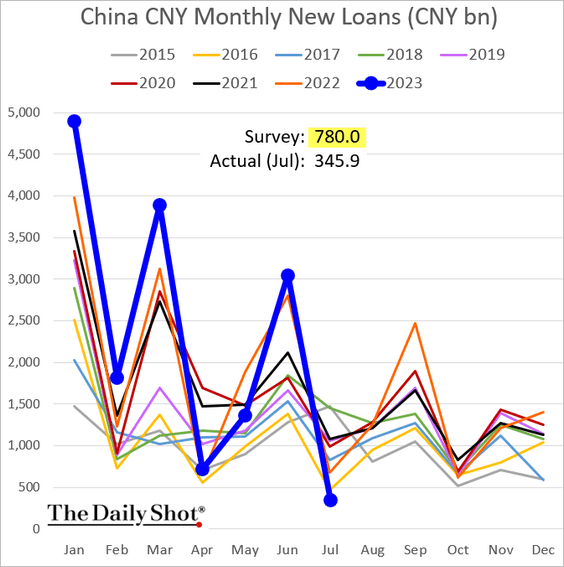
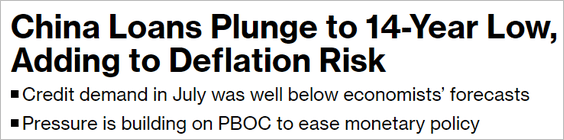
China
1. Loan growth hit a multi-year low.
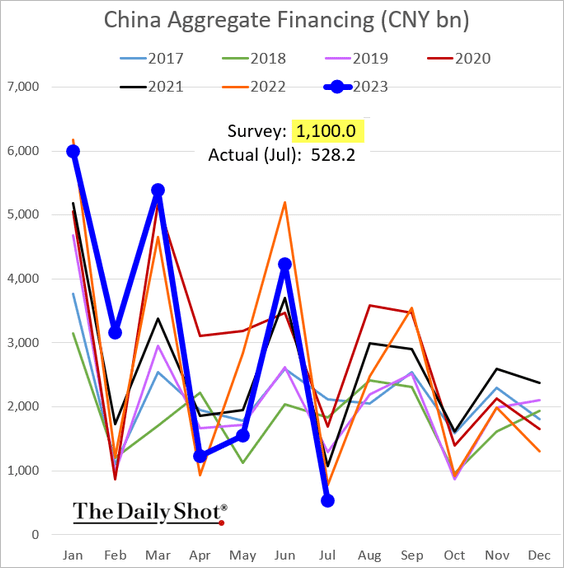
• Here is aggregate financing (record low for this index).
• This chart shows the year-over-year changes.
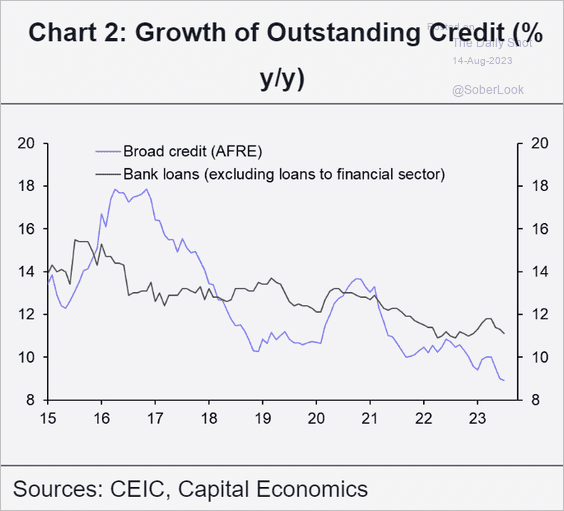 Source: Capital Economics
 Source: @markets Read full article
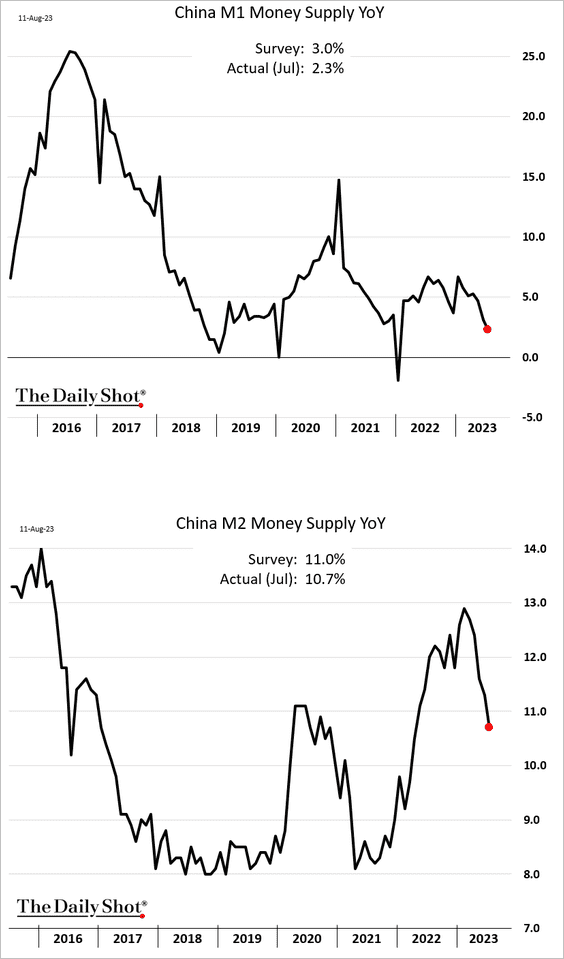
• Money supply growth slowed.
——————–
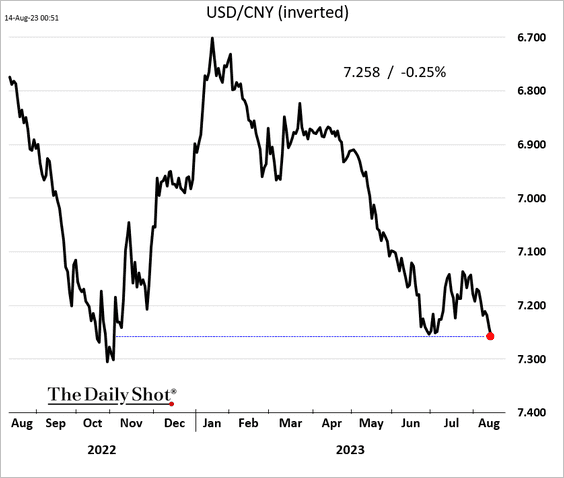
2. The renminbi hit the lowest level vs. USD since November of last year.
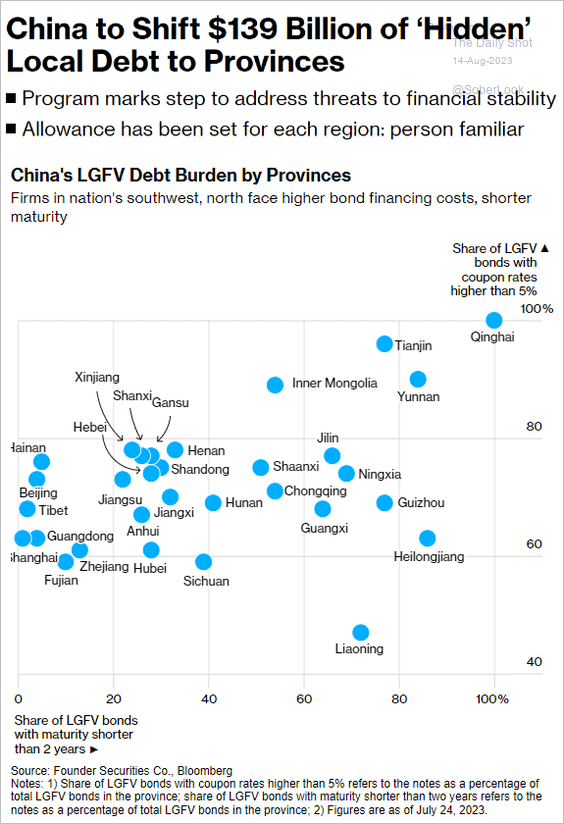
3. Beijing is asking the provinces to refinance some of their LGFV (local government financing vehicles) debt via the bond market.
 Source: @markets Read full article
4. Here are the drivers of deflation.
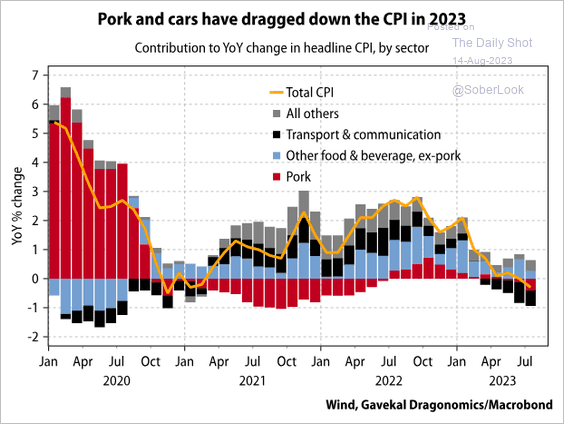 Source: Gavekal Research
Back to Index
Emerging Markets
1. India’s industrial production was softer than expected.
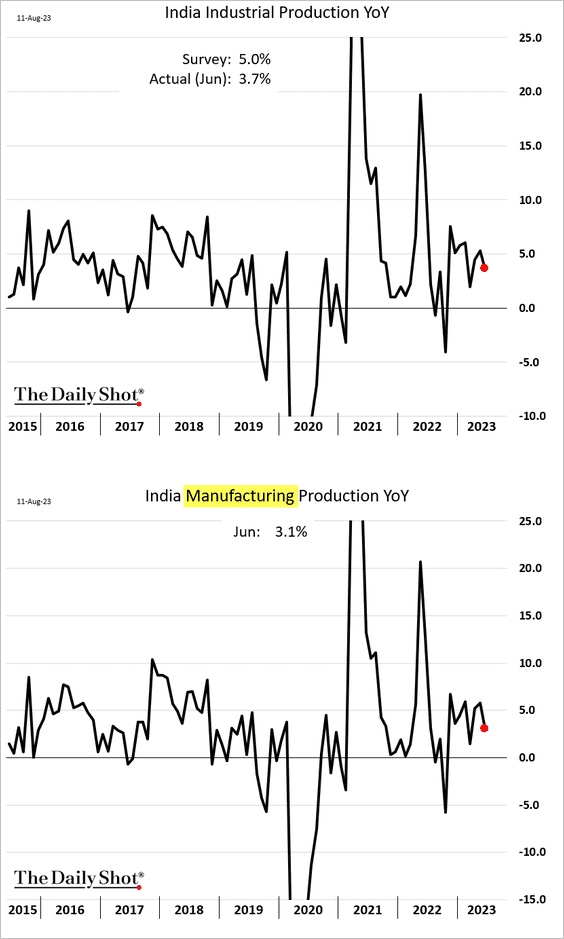
 Source: Reuters Read full article
——————–
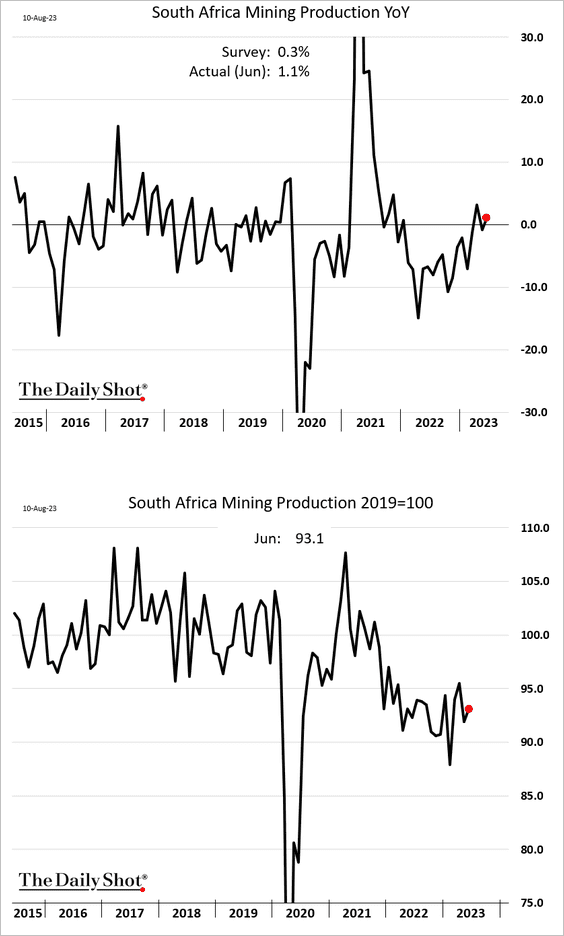
2. South Africa’s manufacturing production topped expectations.
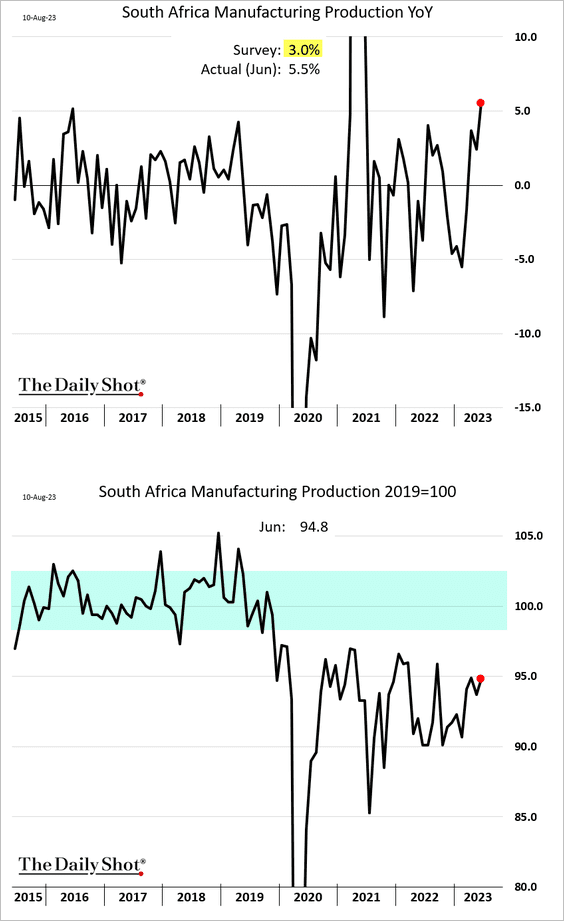
And so did the nation’s mining output.
——————–
3. Turkey’s current account swung into surplus in June.
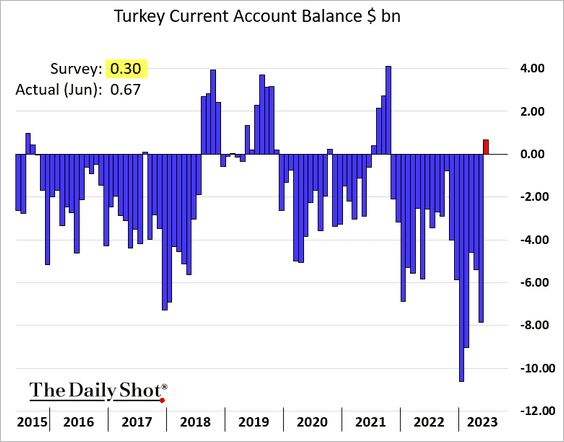
 Source: @economics Read full article
——————–
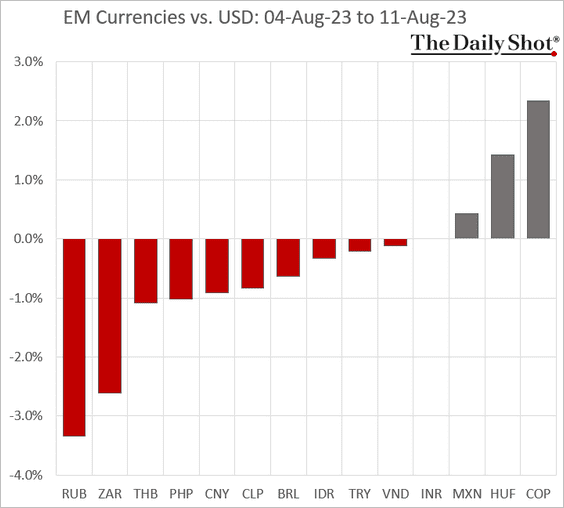
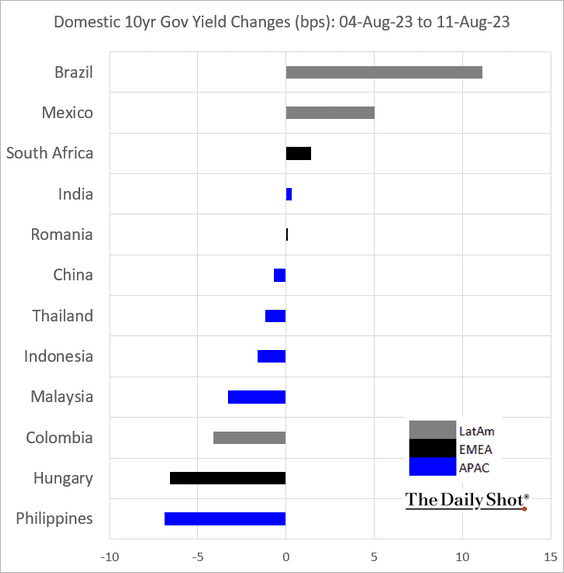
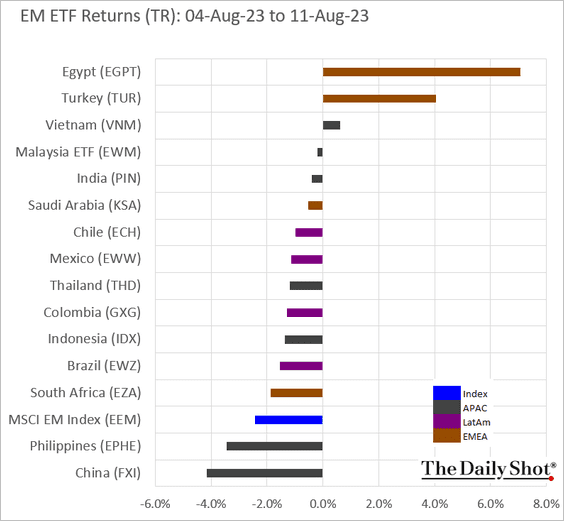
4. Finally, we have last week’s performance data.
• Currencies:
• Bond yields:
• Equity ETFs:
Back to Index
Cryptocurrency
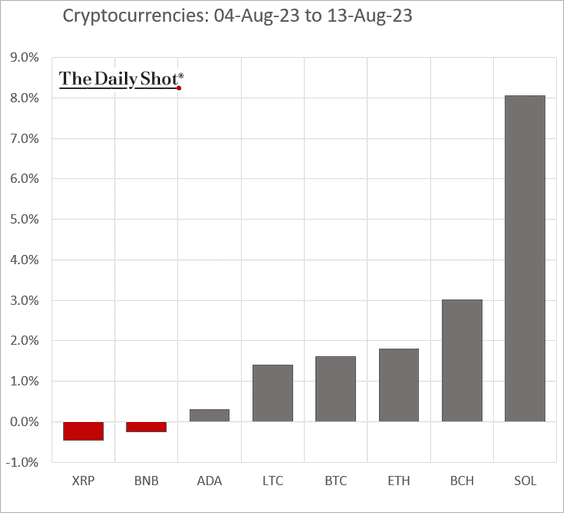
1. Let’s begin with last week’s performance.
——————–
2. The Crypto Fear & Greed Index was stuck in neutral over the past week after reaching greed territory last month.
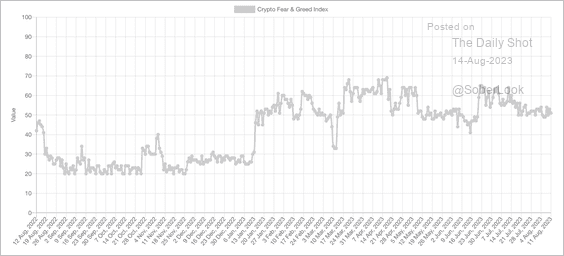 Source: Alternative.me
3. Bitcoin’s implied volatility is starting to rise from historically low levels.
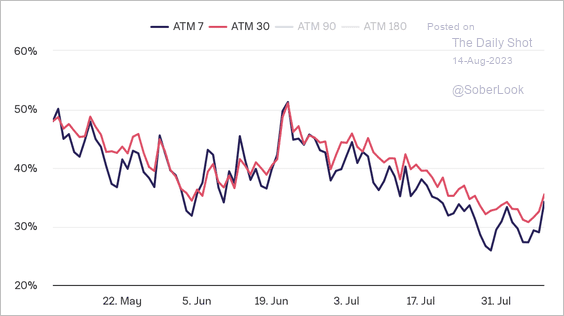 Source: The Block Research
4. Bitcoin’s put/call ratio ticked higher over the past week.
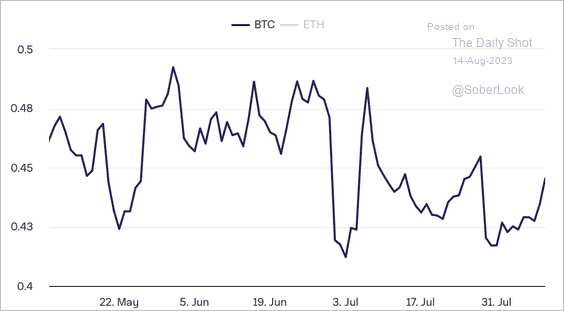 Source: The Block Research
5. BTC’s open interest is rising despite stagnant price returns.
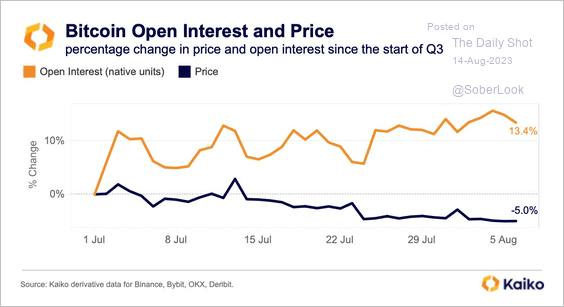 Source: @KaikoData
6. Bittrex settled with the SEC after being charged for operating as an unregistered exchange.
 Source: The Block Read full article
Back to Index
Commodities
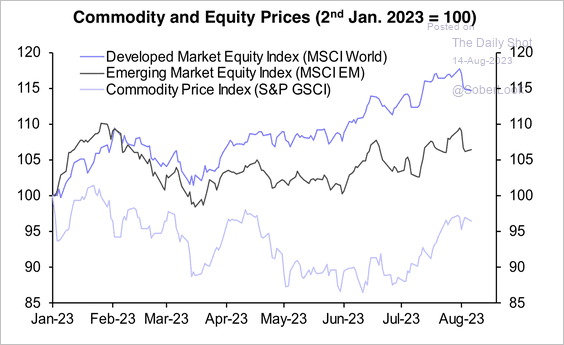
1. Commodities have underperformed equities since the start of this year.
 Source: Capital Economics
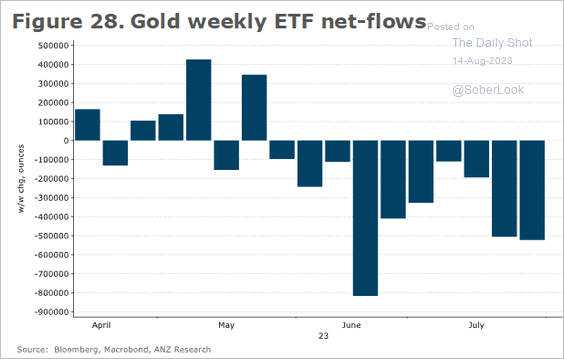
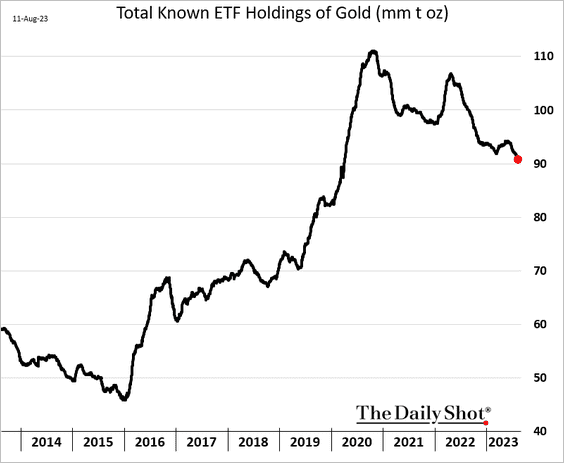
2. Next, we have some updates on precious metals.
• Gold fund flows:
 Source: @ANZ_Research
• ETF holdings of gold:
• Gold vs. real rates:
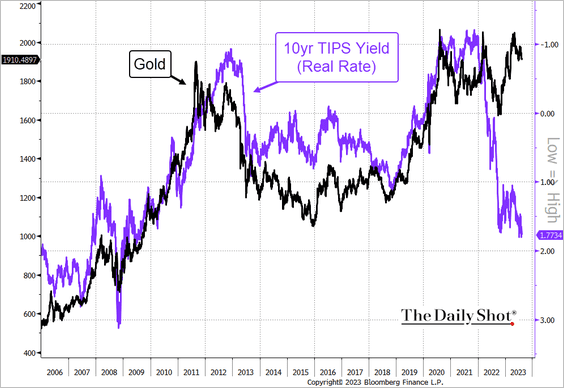 Source: @TheTerminal, Bloomberg Finance L.P.
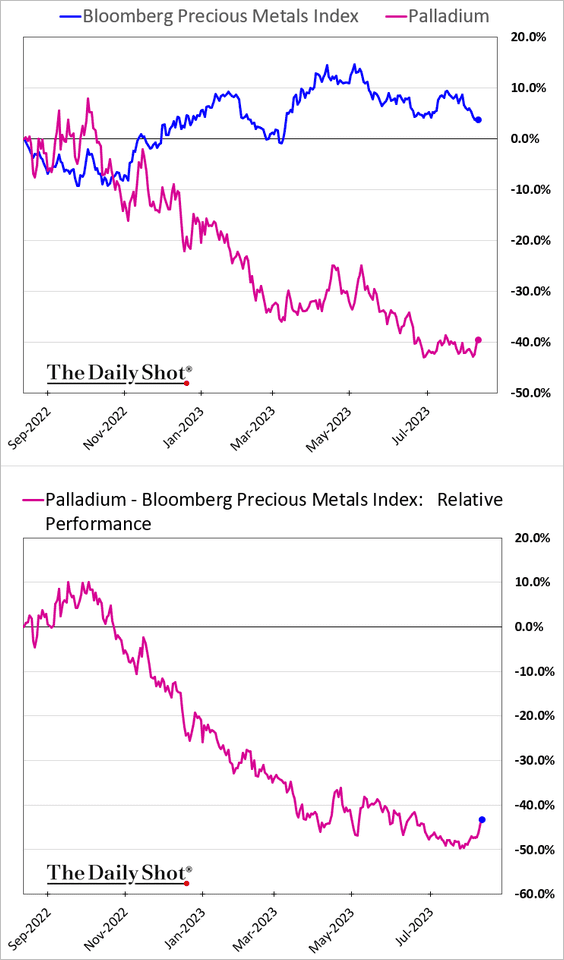
• Speculators are massively short palladium.
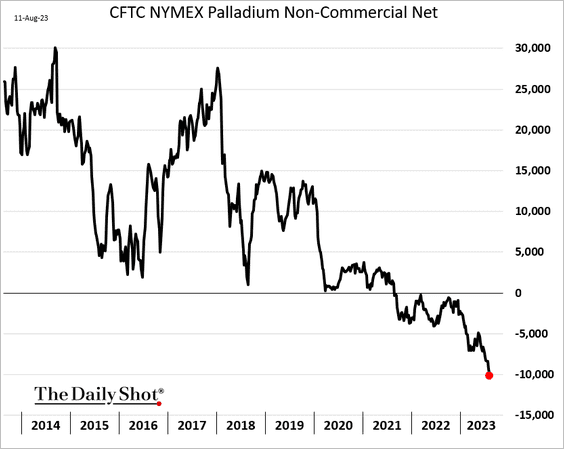
Is palladium’s underperformance over?
——————–
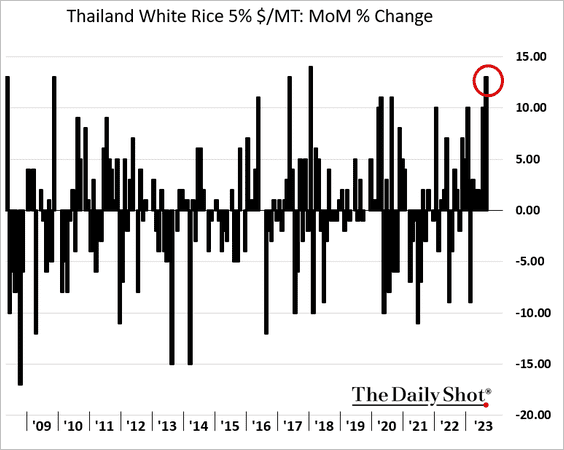
3. It has been a strong month so far for Asian rice prices.
4. El Niño is here.
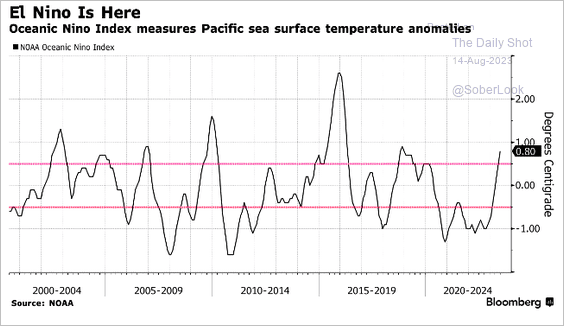 Source: Simon White, Bloomberg Markets Live Blog
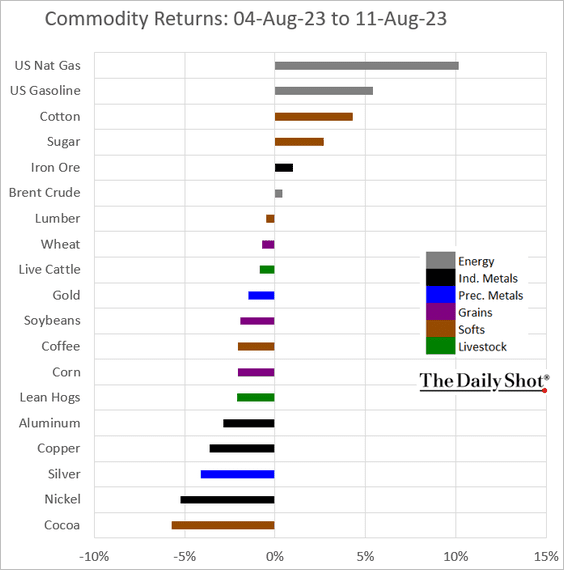
5. Below is last week’s performance across key commodity markets.
Back to Index
Energy
1. Oil service companies’ shares have been surging.
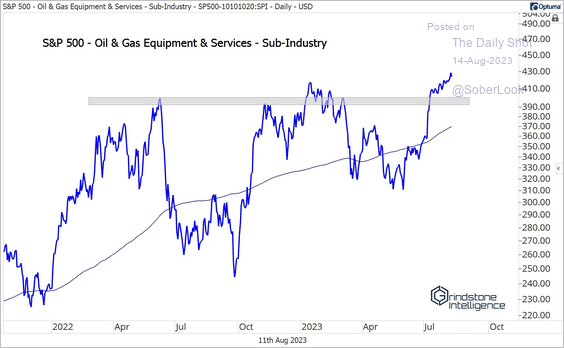 Source: @meanstoatrend
——————–
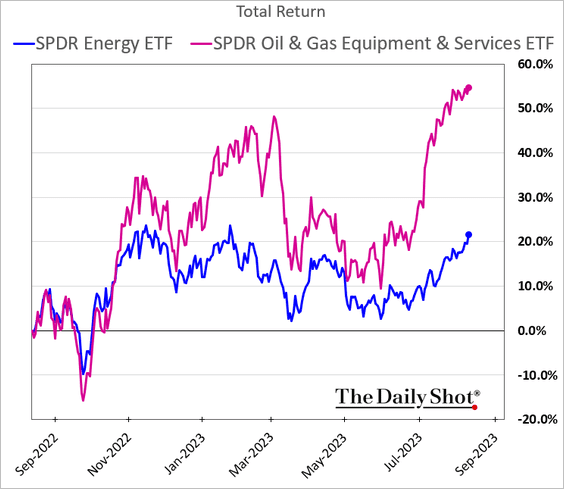
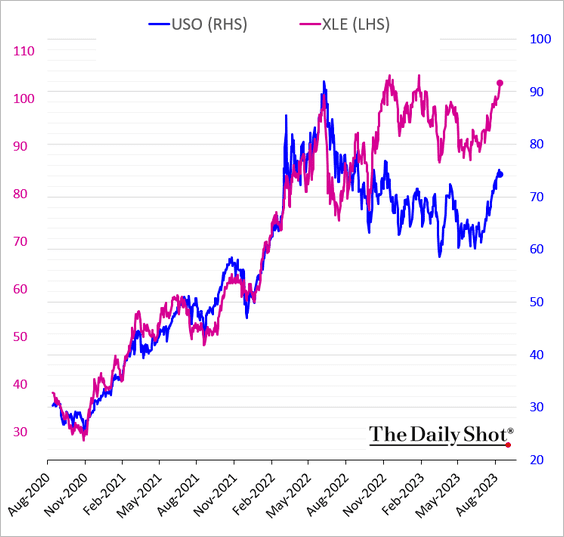
2. Energy shares continue to outperform oil prices.
3. CTAs are boosting exposure to oil.
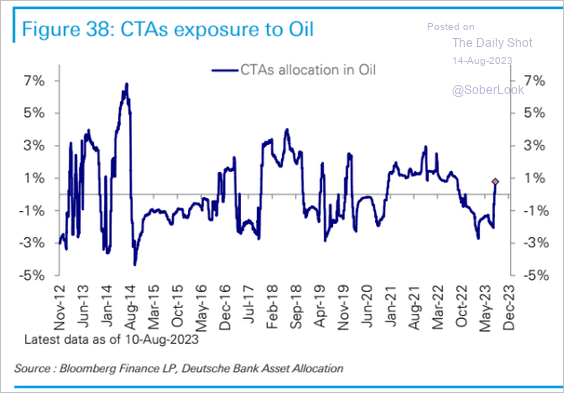 Source: Deutsche Bank Research
Back to Index
Equities
1. S&P 500 breadth appears stretched on the industry level.
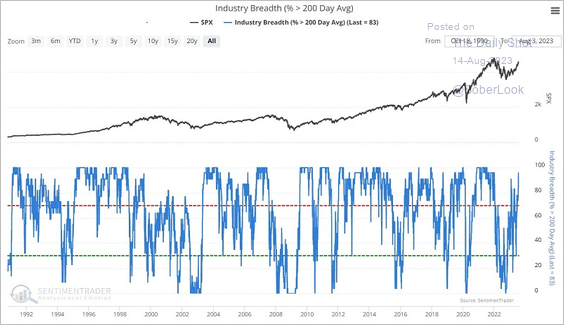 Source: SentimenTrader
2. Discretionary investors reduced exposure in recent weeks.
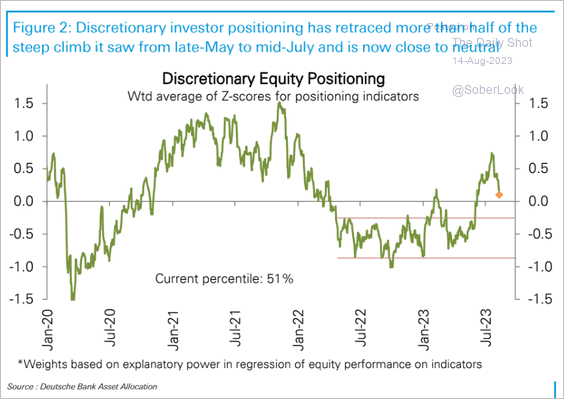 Source: Deutsche Bank Research
3. BofA’s private clients have been dumping growth stocks.
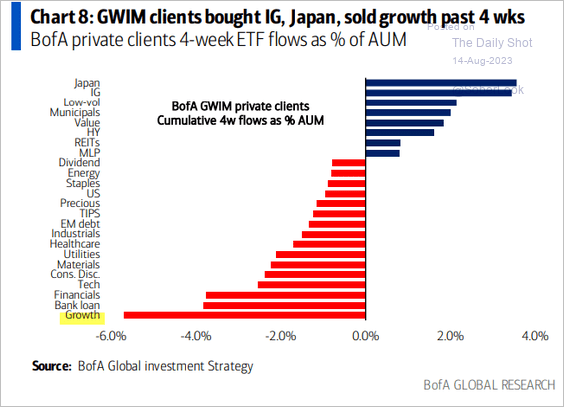 Source: BofA Global Research
4. This chart shows the global dividend growth trend.
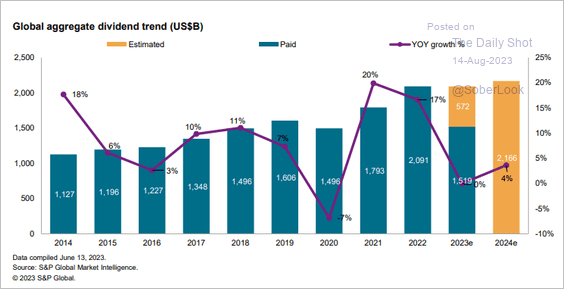 Source: S&P Global Market Intelligence
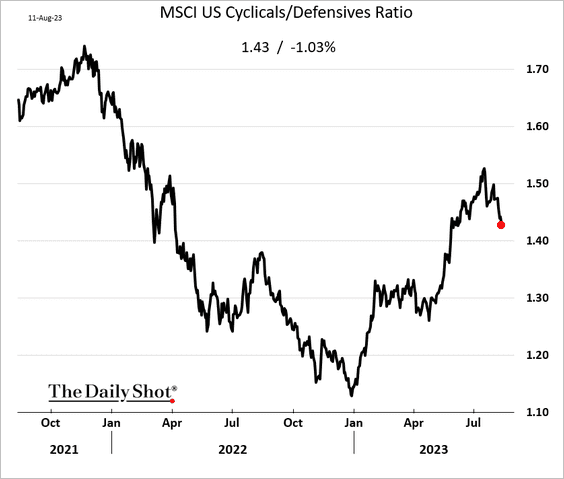
5. Cyclical stocks are underperforming again.
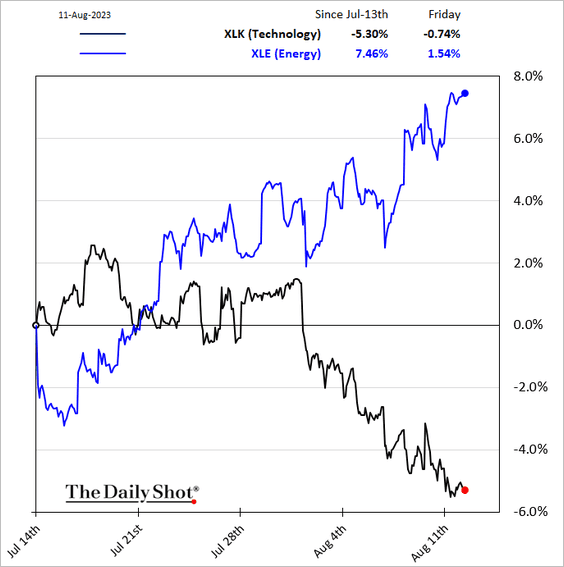
6. Next, let’s take a look at some performance trends over the past 30 days.
• Energy vs. tech:
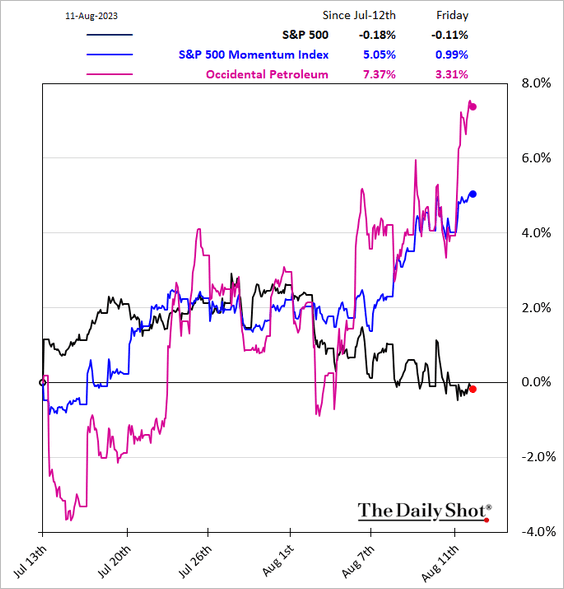
• Momentum factor outperformance (related to the above trend):
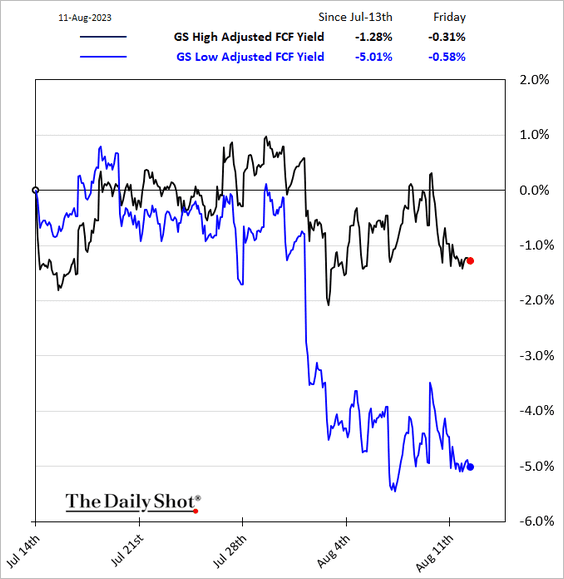
• Free cash flow is important again:
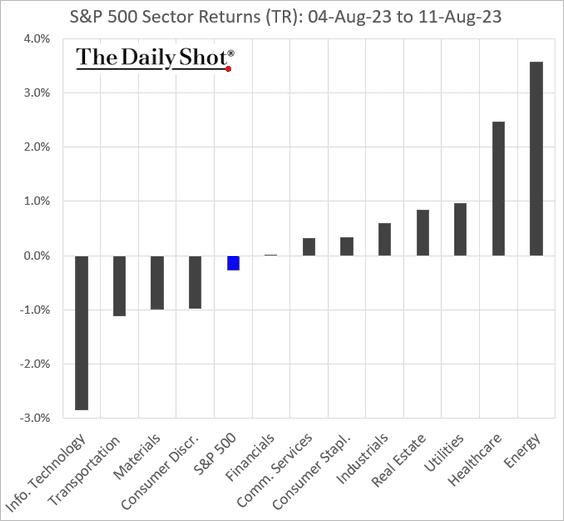
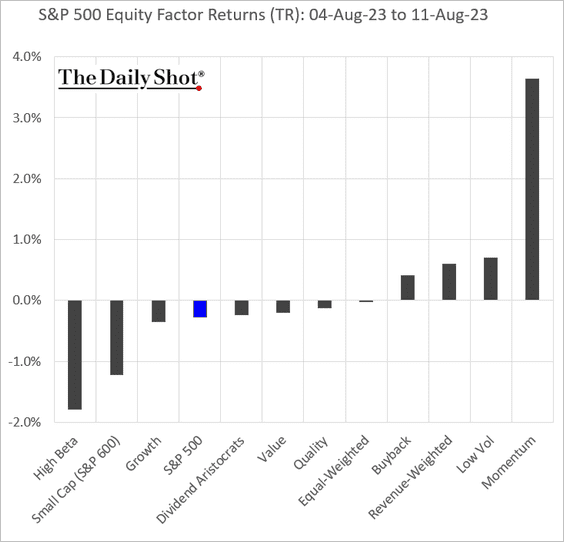
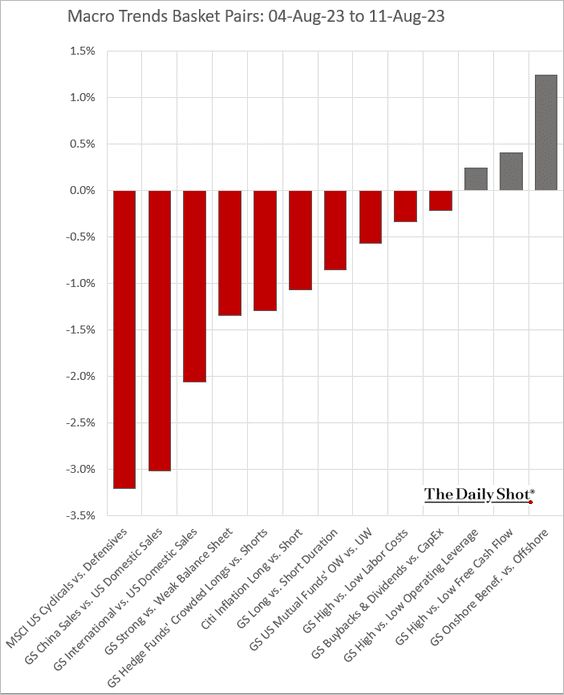
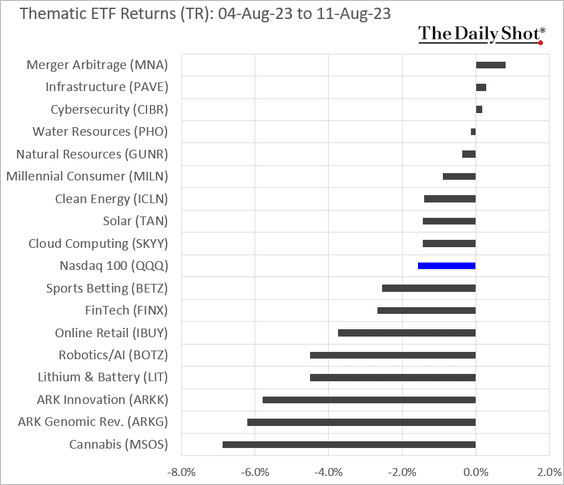
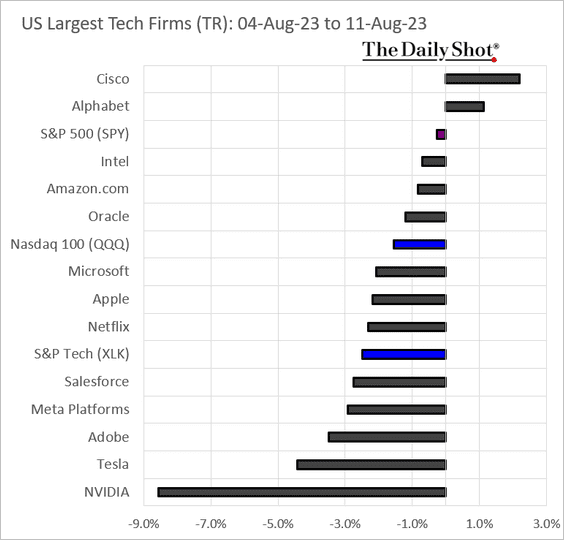
7. Finally, let’s take a look at last week’s performance data.
• Sectors:
• Equity factors:
• Macro basket pairs’ relative performance:
• Thematic ETFs:
• Largest US tech firms:
Back to Index
Credit
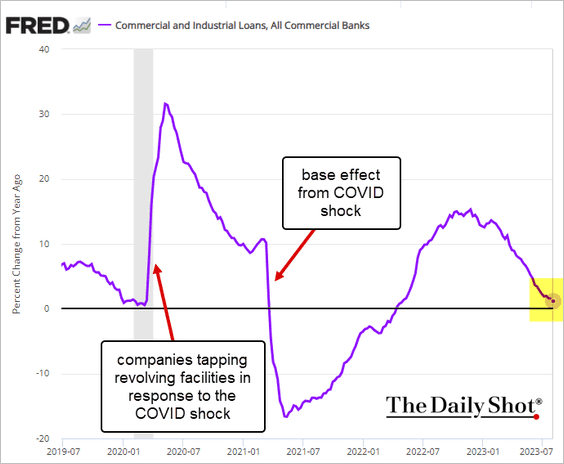
1. US business loan growth is slowing.
2. Money-market funds’ AUM continues to climb.
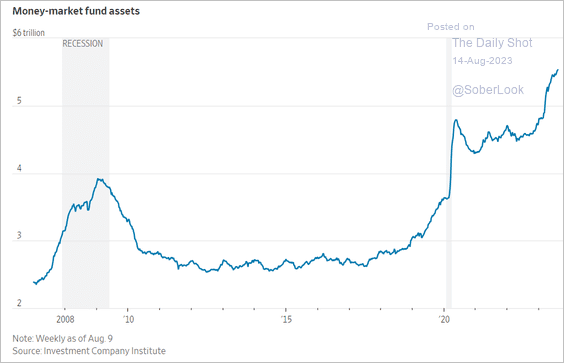 Source: @WSJ Read full article
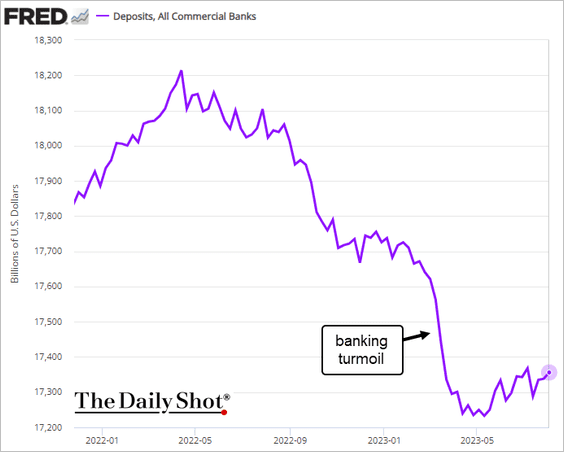
3. Bank deposits have been gradually trending higher.
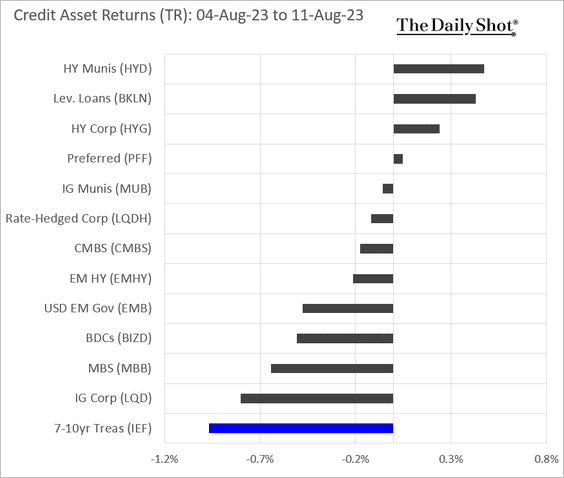
4. Here is last week’s performance by asset class.
Back to Index
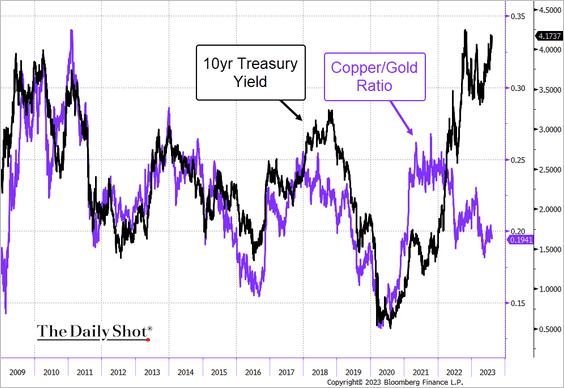
Rates
1. Treasury yields have diverged further from the copper/gold ratio.
 Source: @TheTerminal, Bloomberg Finance L.P.
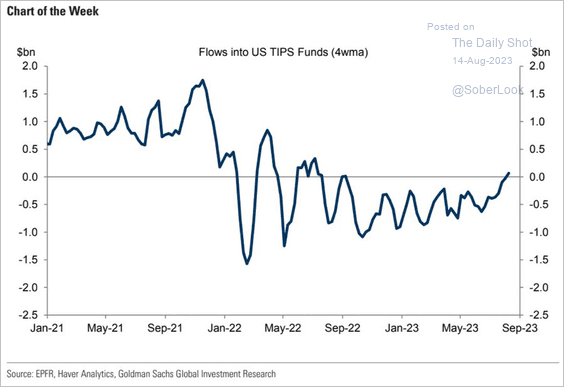
2. TIPS flows are rebounding.
 Source: Goldman Sachs; @AyeshaTariq
Back to Index
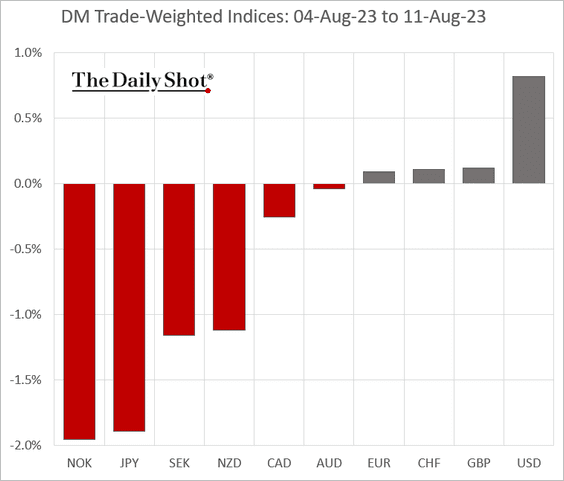
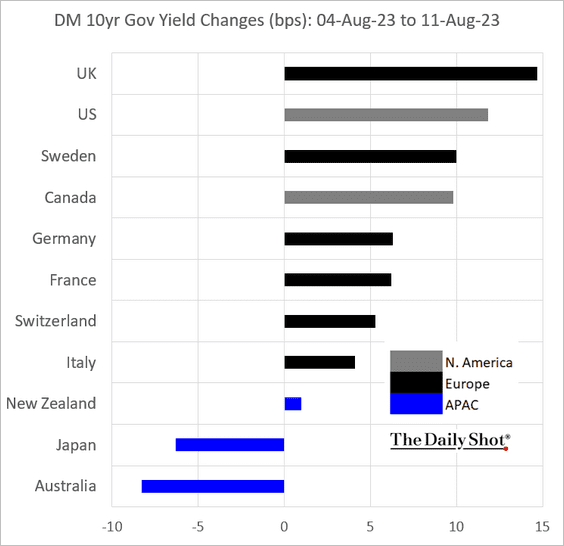
Global Developments
Here is last week’s performance data for advanced economies.
• Currencies:
• Bond yields:
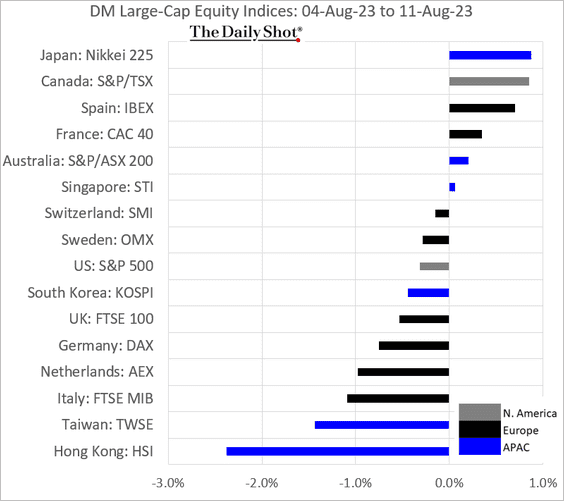
• Equities:
——————–
Food for Thought
1. Opening weekends for films and box-office revenue:
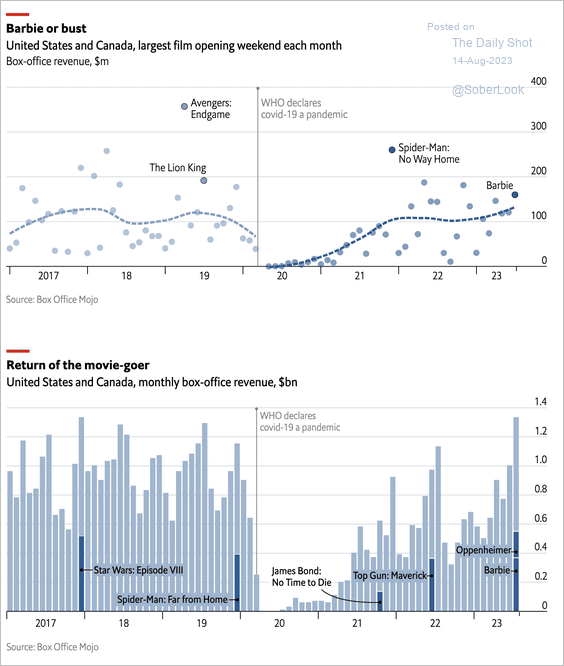 Source: The Economist Read full article
2. E-commerce sales breakdown:
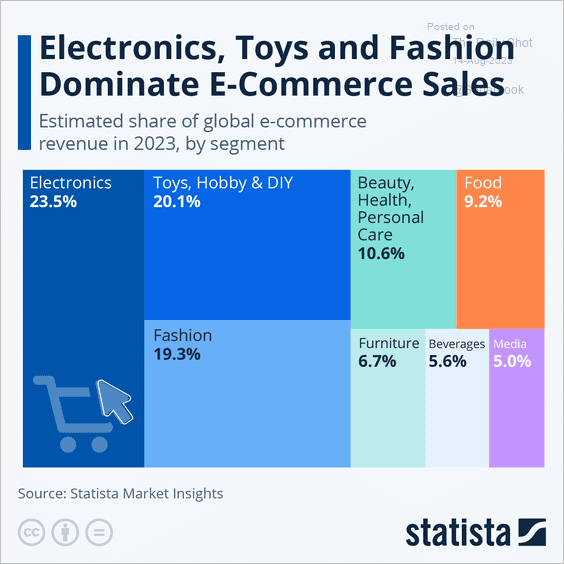 Source: Statista
3. New business applications by county:
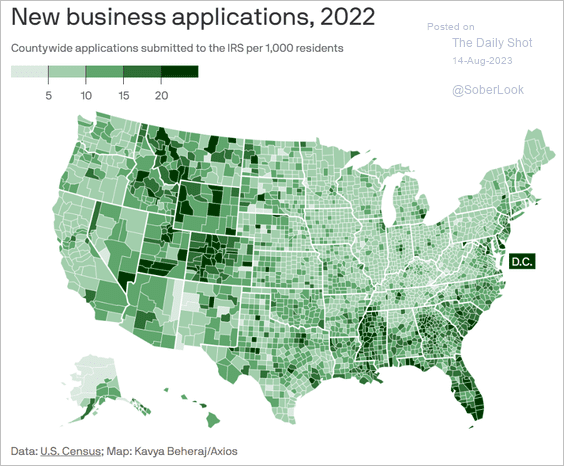 Source: @axios Read full article
4. Views on colleges taking race into account when making admissions decisions:
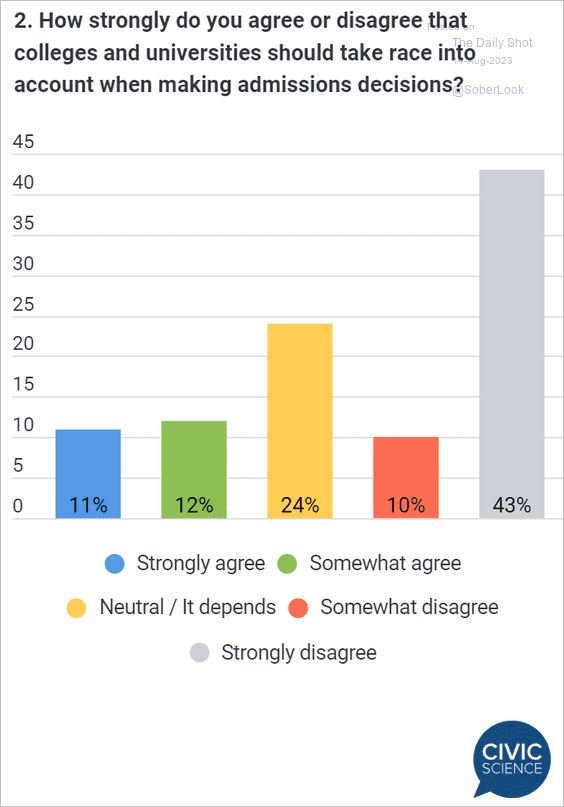 Source: @CivicScience Read full article
5. Changes in defense spending:
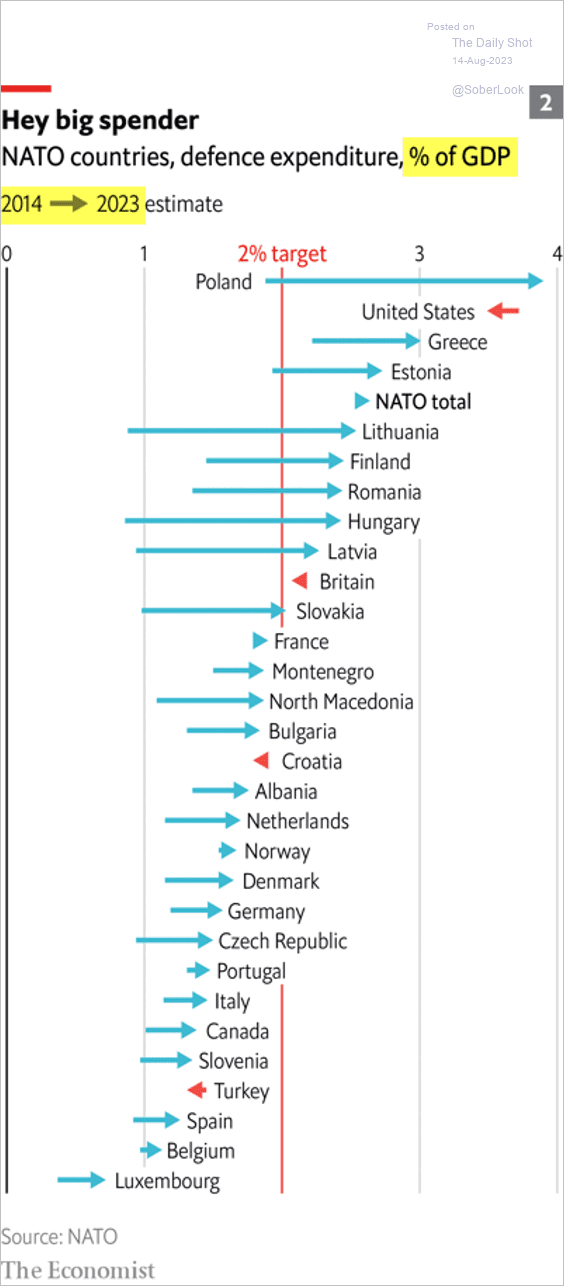 Source: The Economist Read full article
6. Views on NATO:
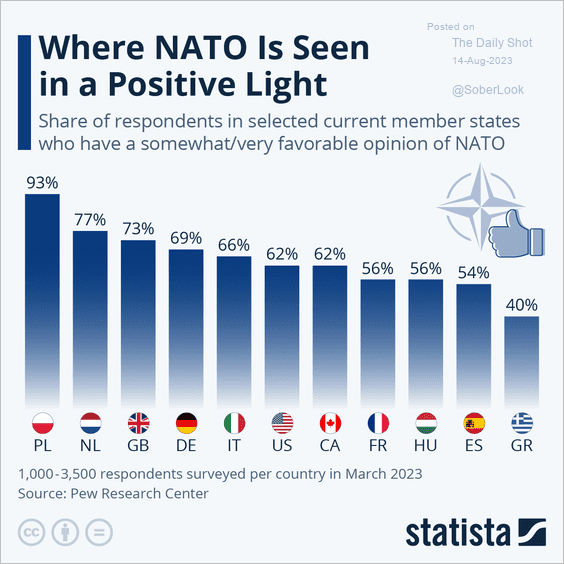 Source: Statista
7. COVID-related US hospital admissions:
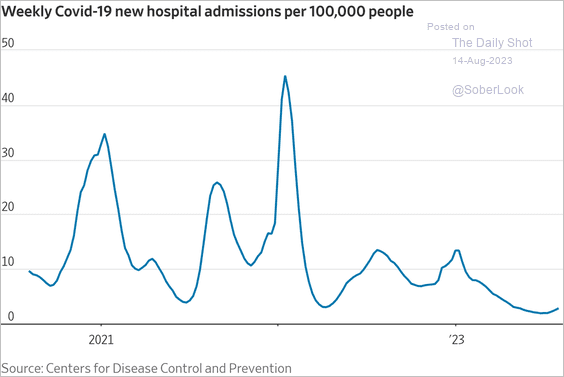 Source: @WSJ Read full article
8. The most dangerous cities in the US:
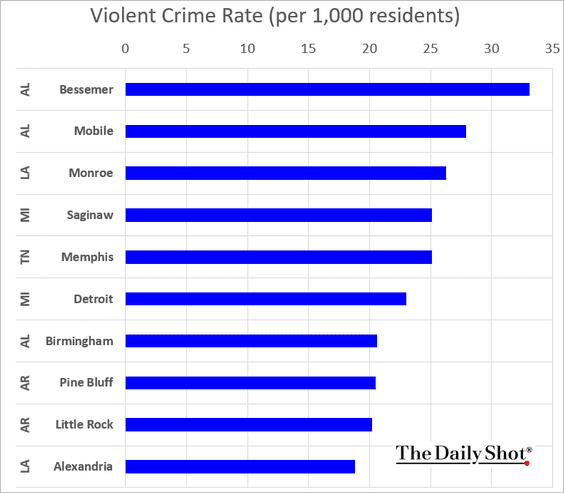 Source: Visual Capitalist Read full article
9. Child labor violations:
 Source: USAFacts
10. Tour de France cyclists’ nationality:
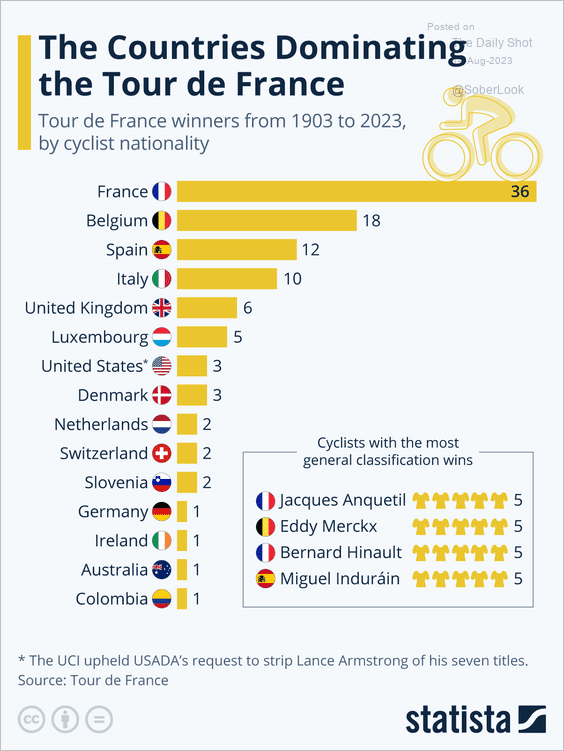 Source: Statista
——————–
Back to Index