
The Daily Shot: 15-Sep-23
• The United States
• The Eurozone
• Europe
• Japan
• China
• Emerging Markets
• Commodities
• Energy
• Equities
• Credit
• Rates
• Global Developments
• Food for Thought
The United States
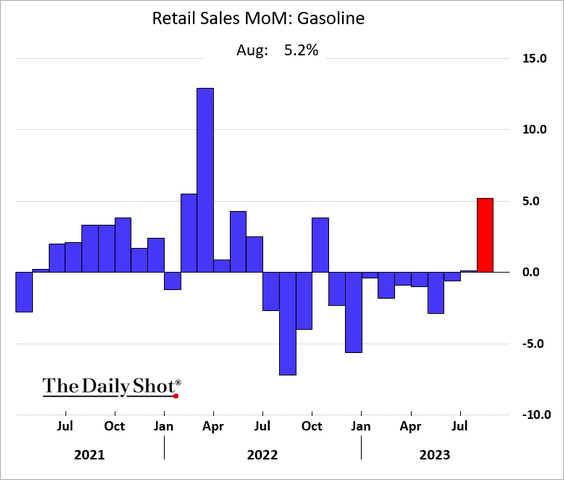
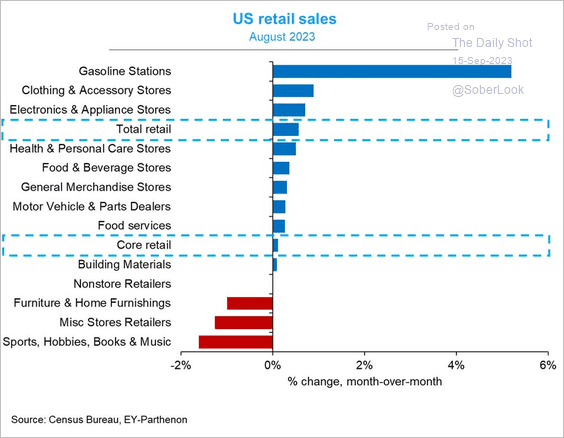
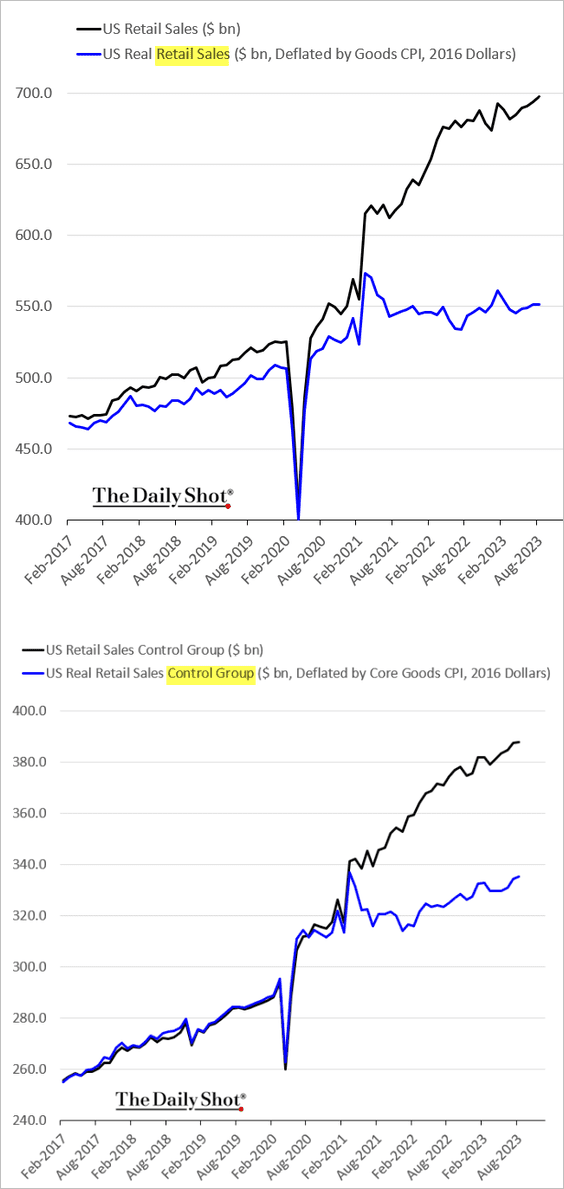
1. August retail sales topped expectations, …
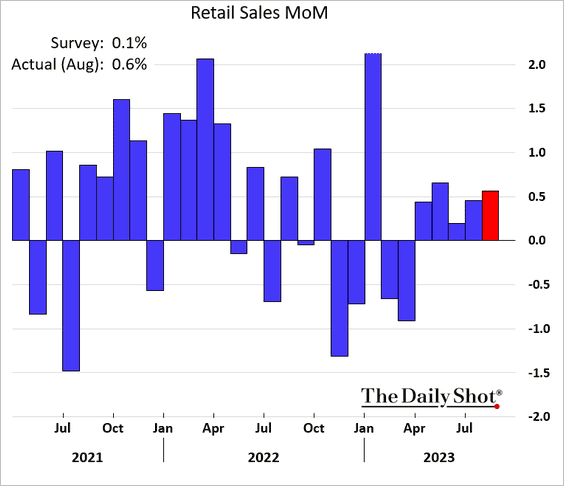
… boosted by increased spending on gasoline (2 charts).
 Source: @GregDaco
 Source: Reuters Read full article
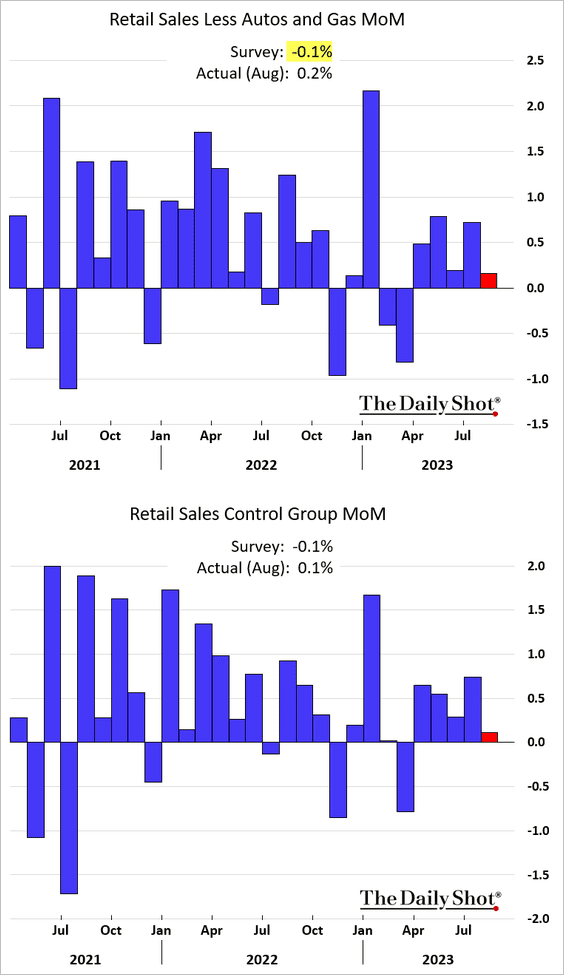
• Core retail sales registered a modest increase, also exceeding forecasts.
• Here is a look at real retail sales (levels).
——————–
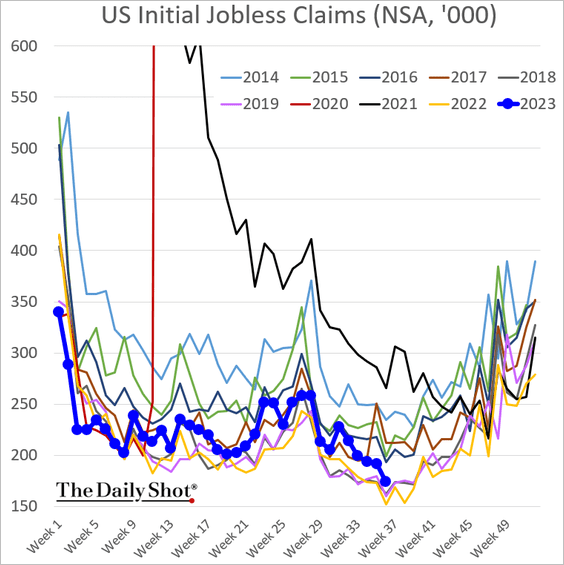
2. Next, we have some updates on the labor market.
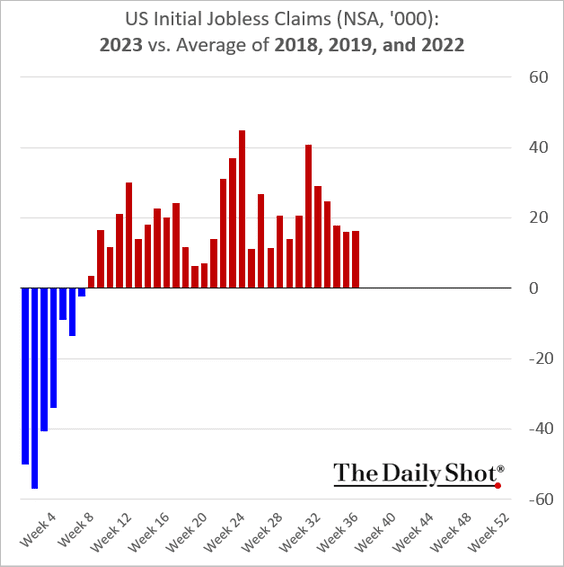
• Initial jobless claims have remained stable, hovering above the average levels seen in 2018, 2019, and 2022 – years that recorded some of the lowest claims.
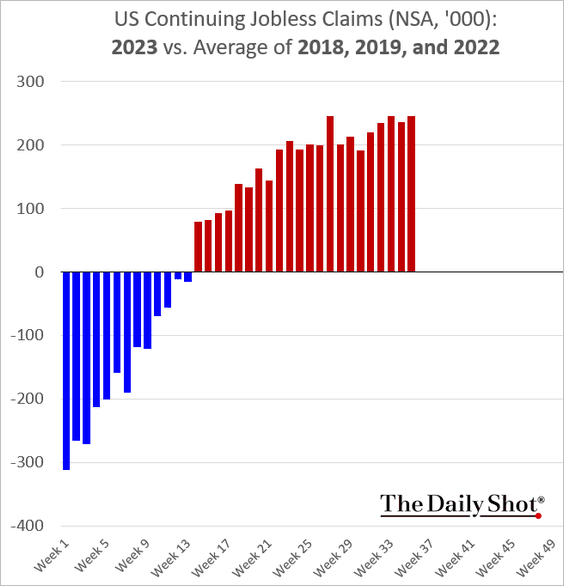
But continuing claims keep diverging from levels seen during those years.

• CEOs prepare for job cuts.
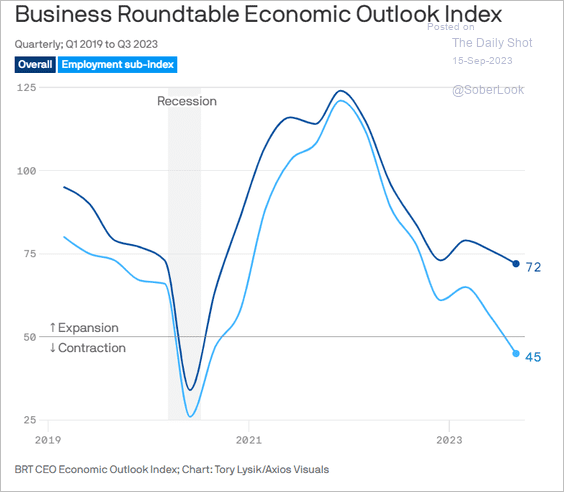 Source: @axios Read full article
——————–
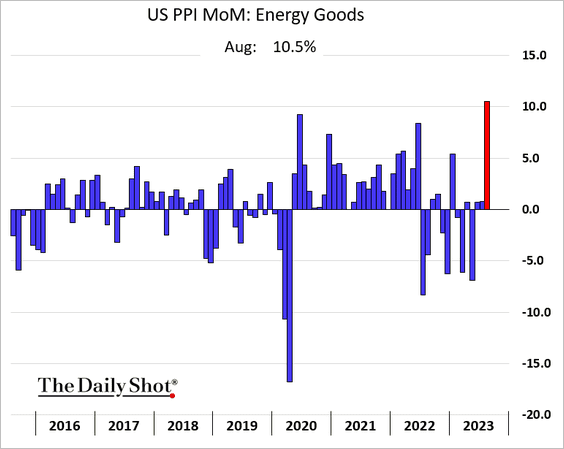
3. The PPI report surprised to the upside, …
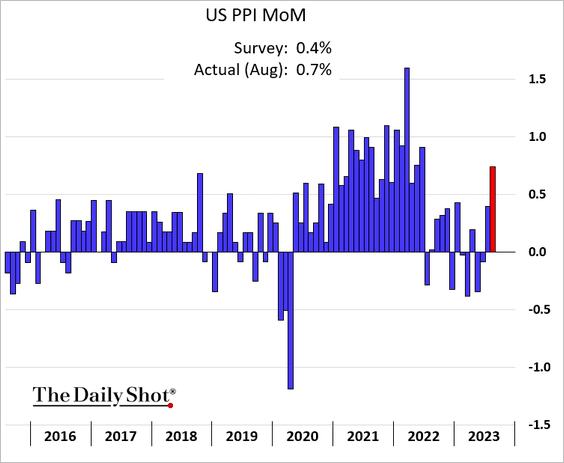
… boosted by energy prices.
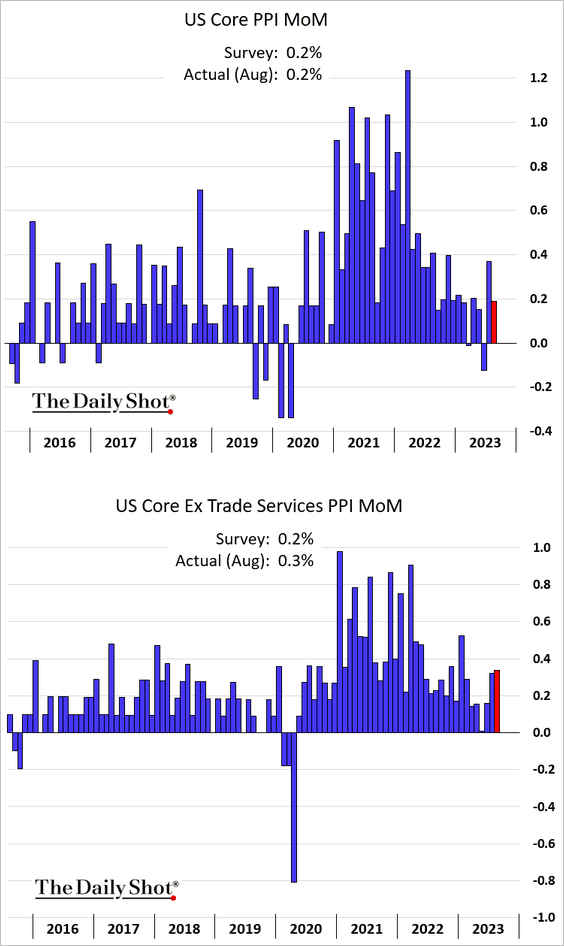
• Core producer prices were closer to expectations.
 Source: CNBC Read full article
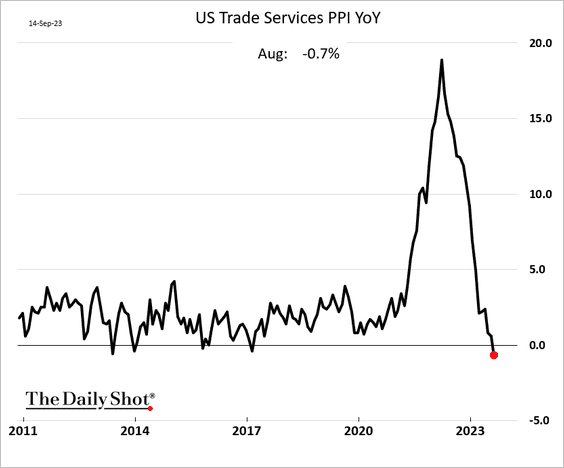
• On a year-over-year basis, the core PPI is approaching 2%, …
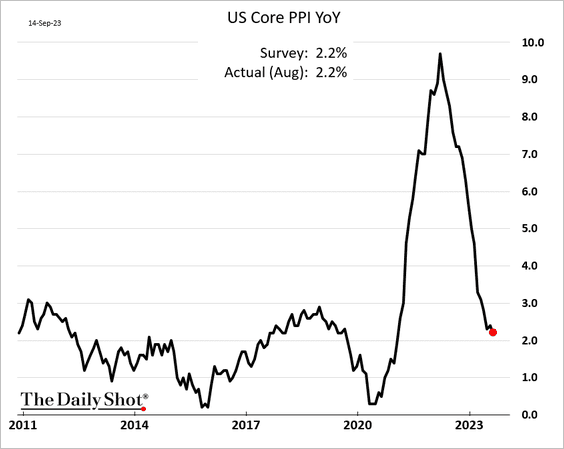
… pulled lower by smaller business markups. This trend suggests a pullback in corporate margins.
——————–
4. How much of the domestic vehicle production will be impacted by the UAW strike?
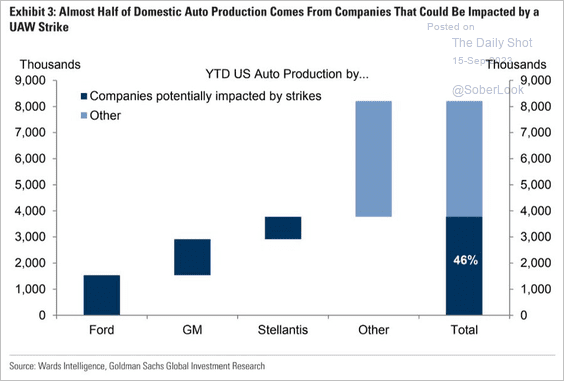 Source: Goldman Sachs; @dailychartbook
Back to Index
The Eurozone
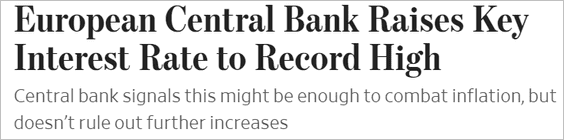
1. The ECB increased rates to an all-time high but signaled a pause.
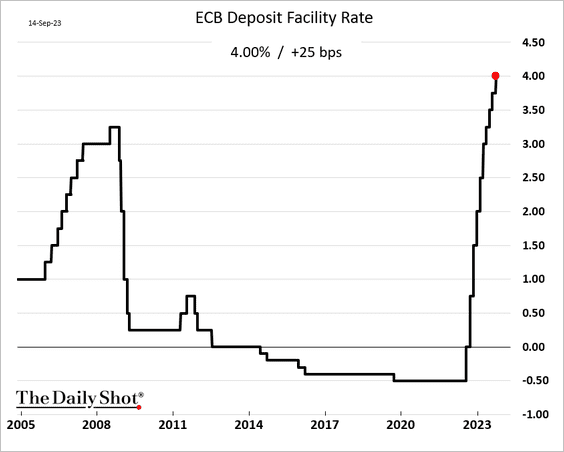
ECB: – Based on its current assessment, the Governing Council considers that the key ECB interest rates have reached levels that, maintained for a sufficiently long duration, will make a substantial contribution to the timely return of inflation to the target.
 Source: @WSJ Read full article
• The central bank lowered its projections for GDP growth and core inflation.
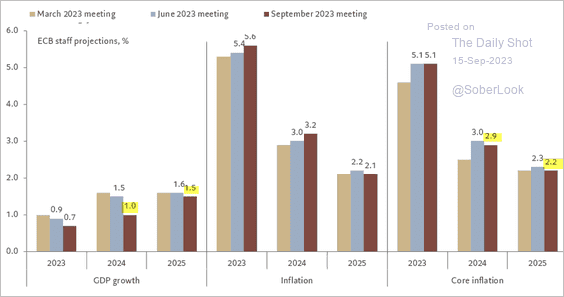 Source: @fwred
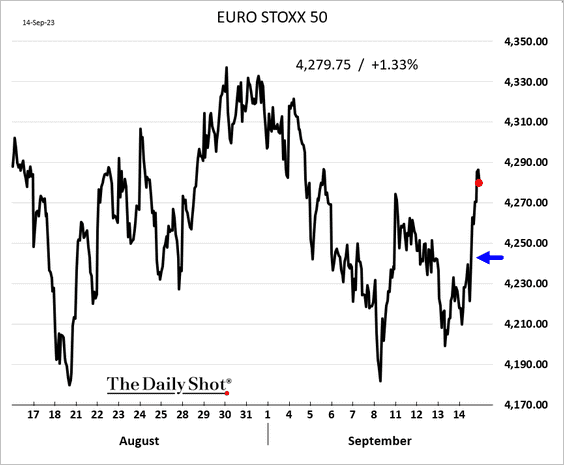
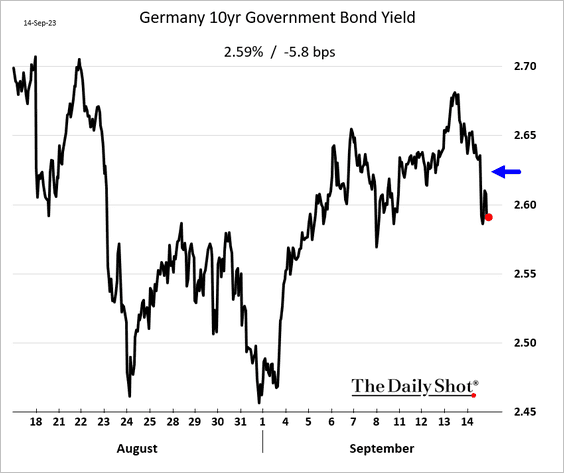
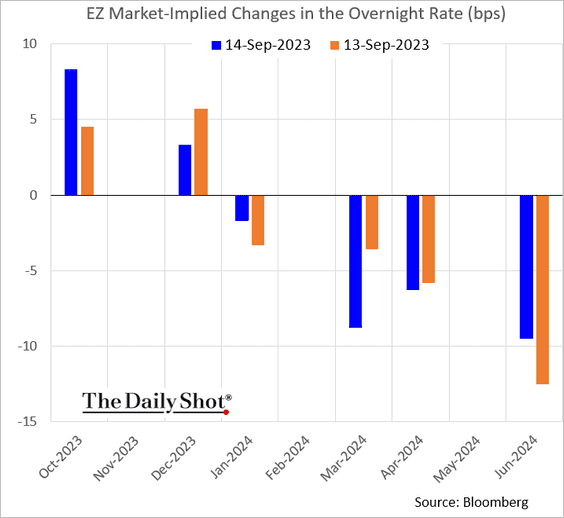
2. The markets cheered the ECB’s “dovish hike,” with stocks and bonds rising.
• The market is pricing a probability of under 50% for another rate hike in this cycle.
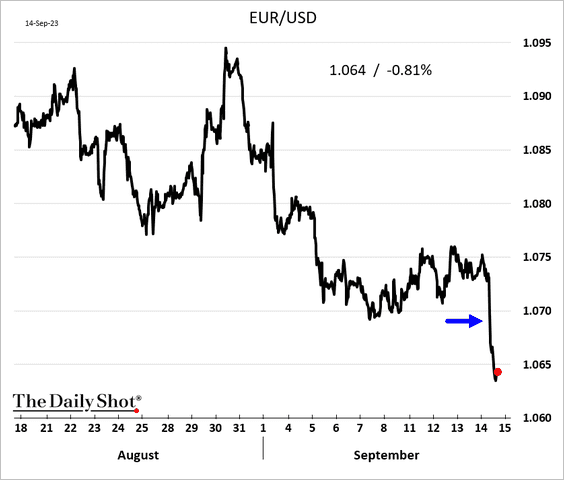
• The euro tumbled.
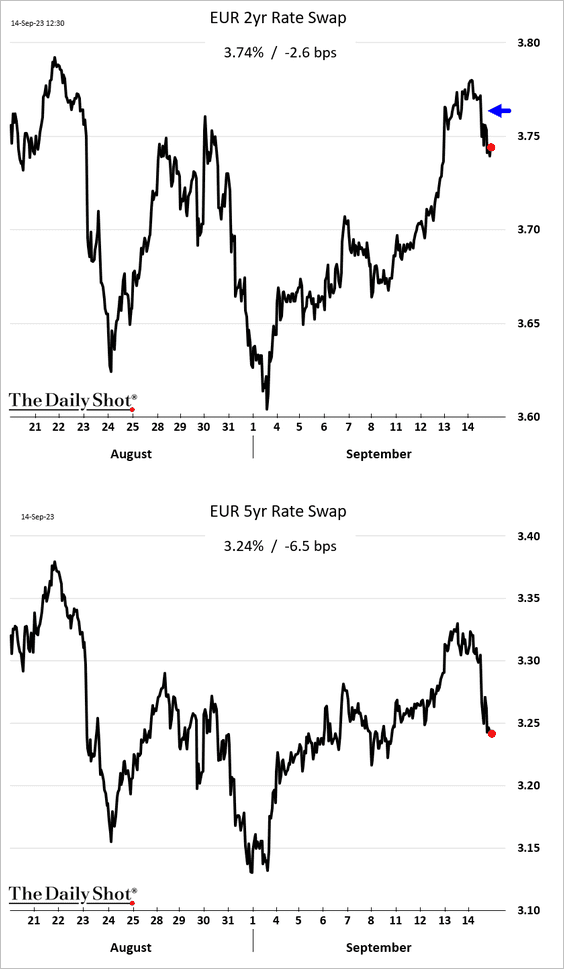
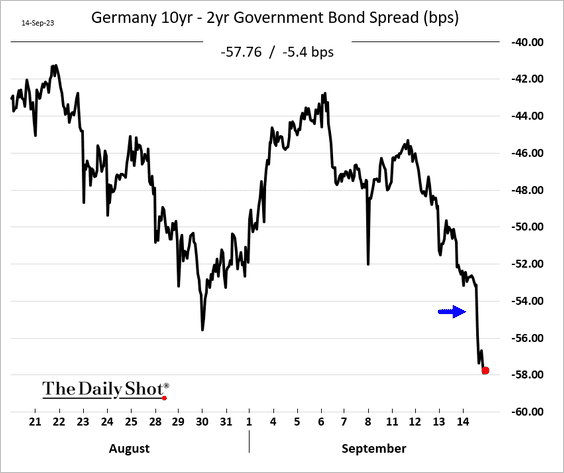
• Yields decreased for the majority of maturities, with the exception of the shortest durations.
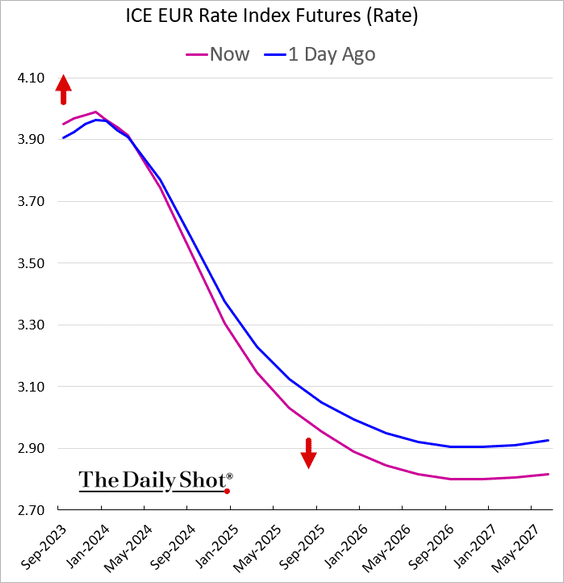
Here is the futures-implied rate trajectory.
The yield curve moved deeper into inversion territory.
——————–
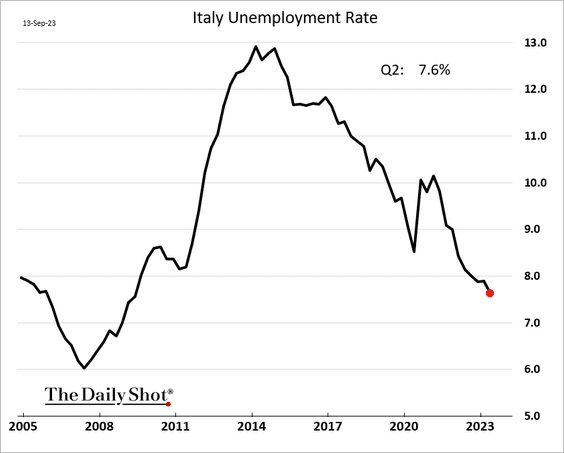
3. Italian unemployment hit the lowest level since 2009.
4. The rise in Spain’s consumer confidence could support consumption.
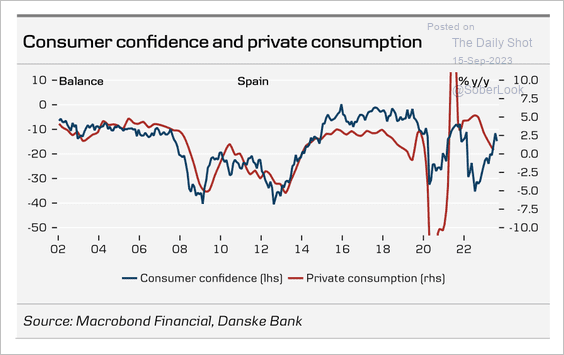 Source: Danske Bank
Wage growth in Spain remains elevated.
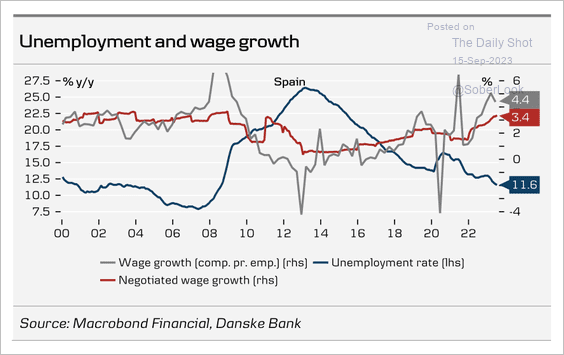 Source: Danske Bank
Back to Index
Europe
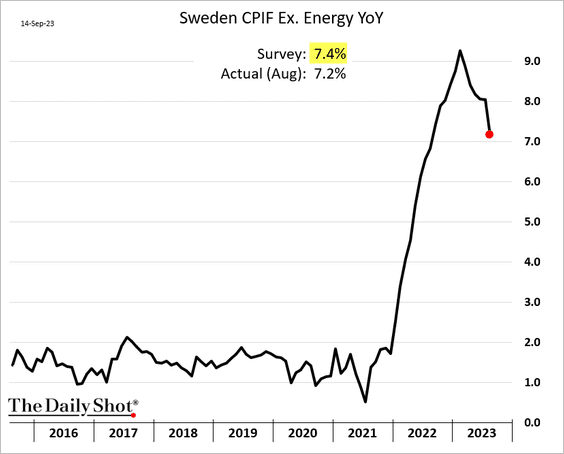
1. Sweden’s core inflation was lower than expected.
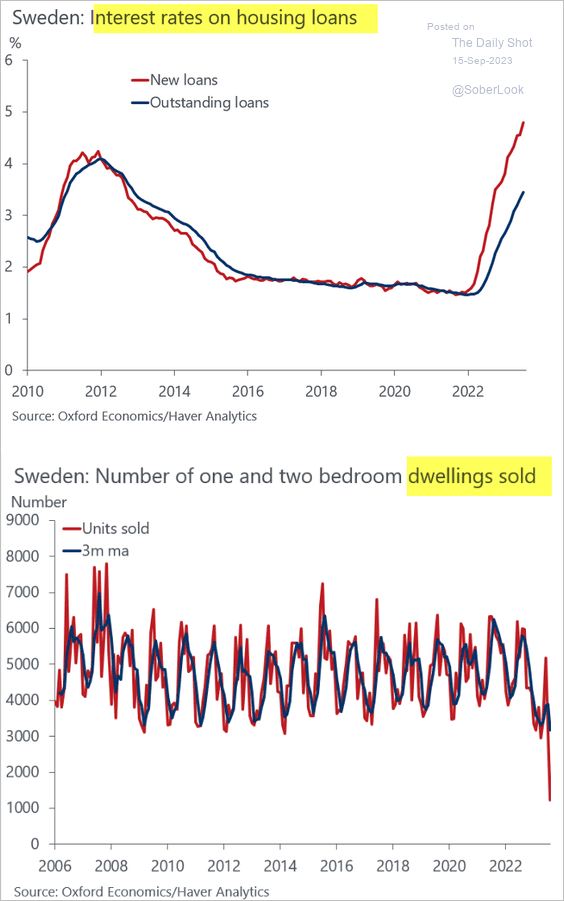
• Sweden’s housing sales have crashed as mortgage rates surge.
 Source: @DanielKral1
——————–
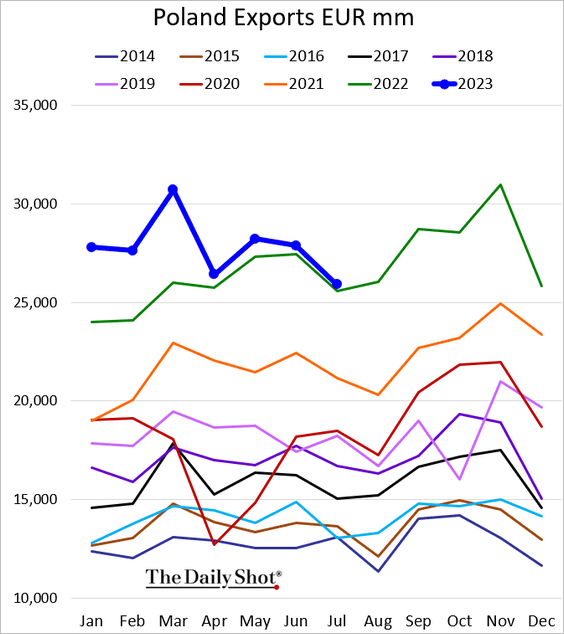
2. Poland’s exports are moderating.
——————–
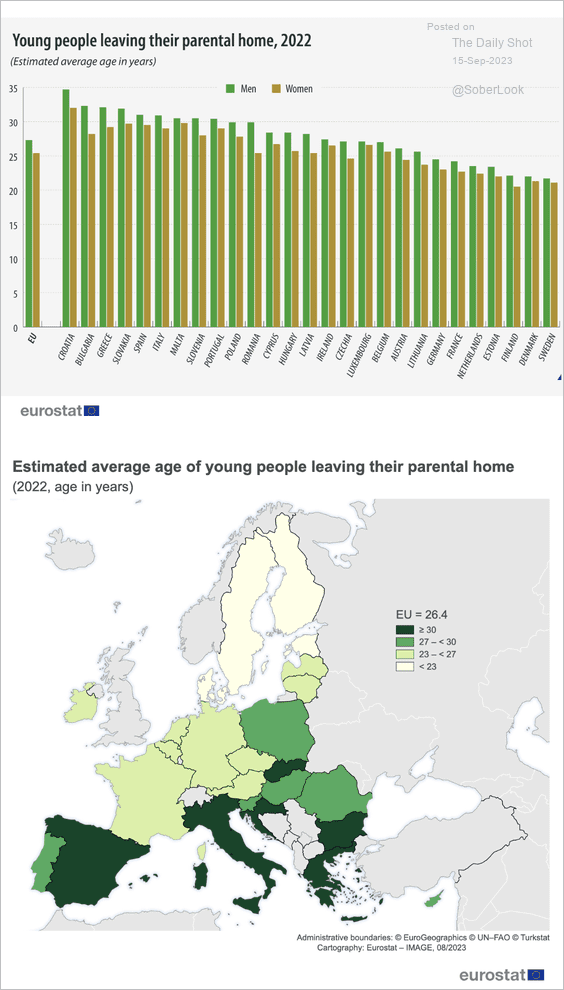
3. At what age do young people leave their parental home?
 Source: Eurostat Read full article
Back to Index
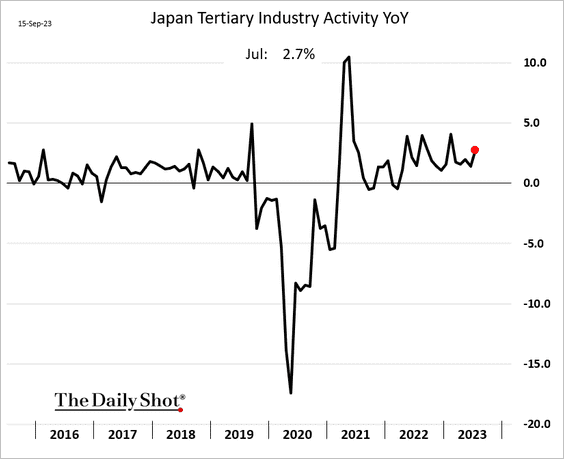
Japan
1. Services activity strengthened in July.
2. Corporations are increasingly sensitive to changes in the yen. Could we see an increase in yen buying to hedge portfolios?
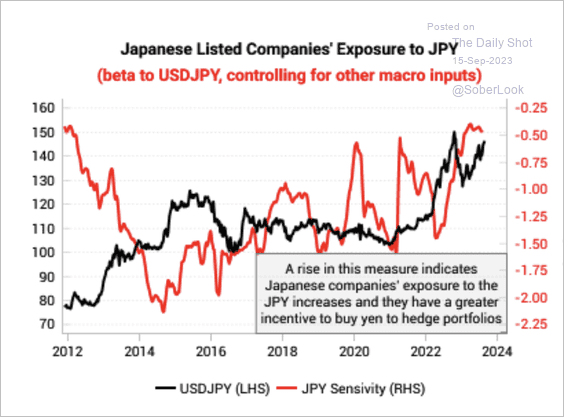 Source: Variant Perception
3. Companies have returned cash to shareholders through dividends and buybacks rather than increasing capital expenditures.
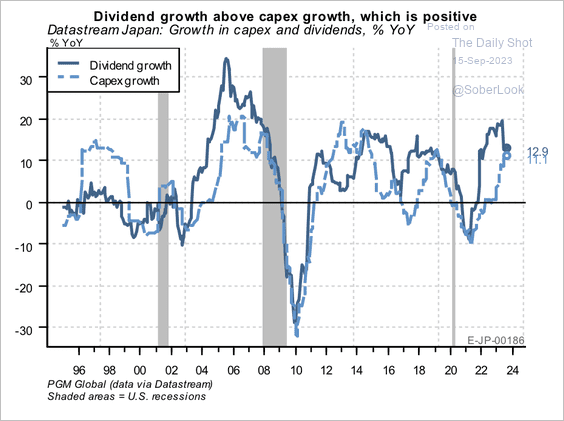 Source: PGM Global
Buybacks added about 7.8 percentage points to year-over-year earnings per share growth.
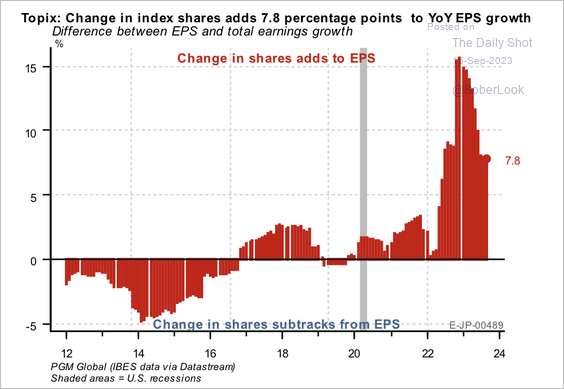 Source: PGM Global
Back to Index
China
1. The PBoC cut banks’ reserve requirements to stimulate growth.
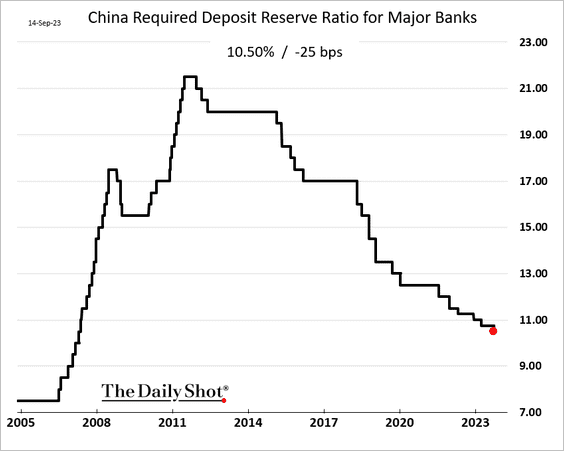
 Source: Reuters Read full article
——————–
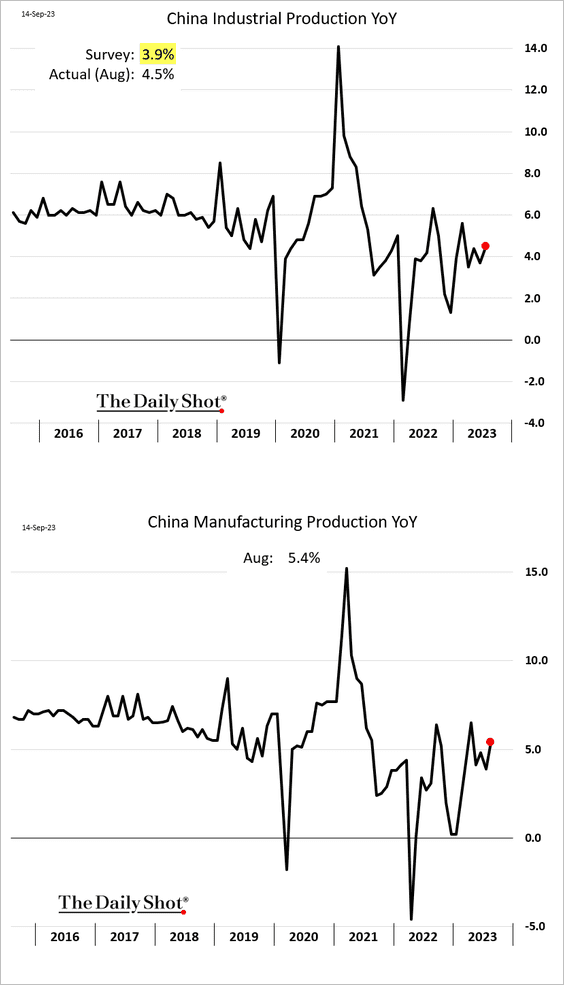
2. Last month’s economic activity topped expectations.
• Industrial production:
• Retail sales:

 Source: Reuters Read full article
——————–
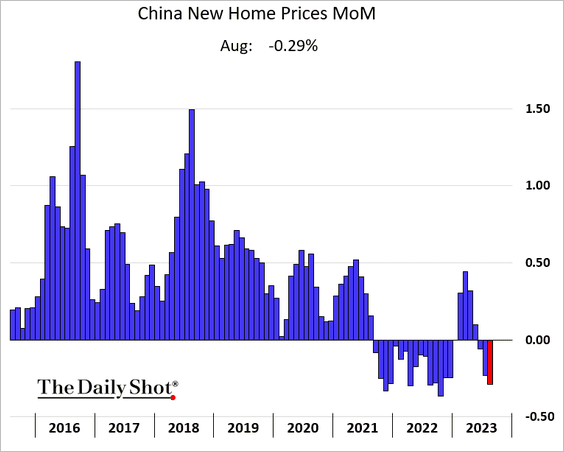
3. Home prices continue to fall.
4. This chart shows the value of property developers’ dollar-denominated bonds.
 Source: @axios Read full article
Back to Index
Emerging Markets
1. Let’s begin with India.
• Wholesale prices are starting to rebound.
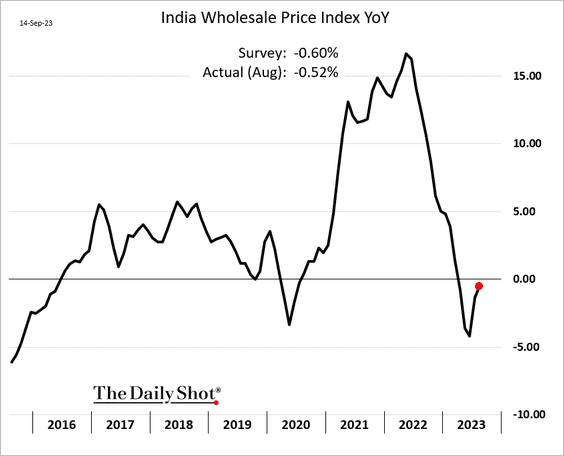
• The increase in energy and wholesale prices could keep policy rates elevated.
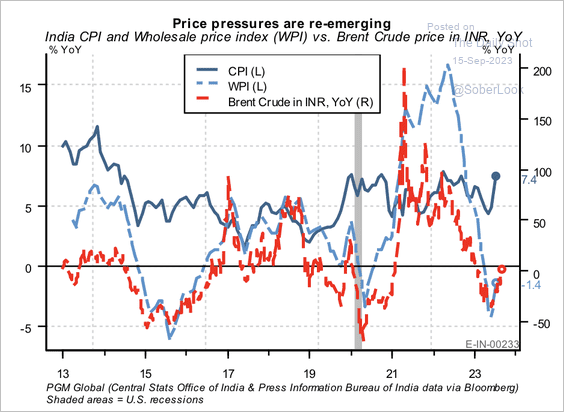 Source: PGM Global
• India’s relative valuations appear stretched compared to their historical average.
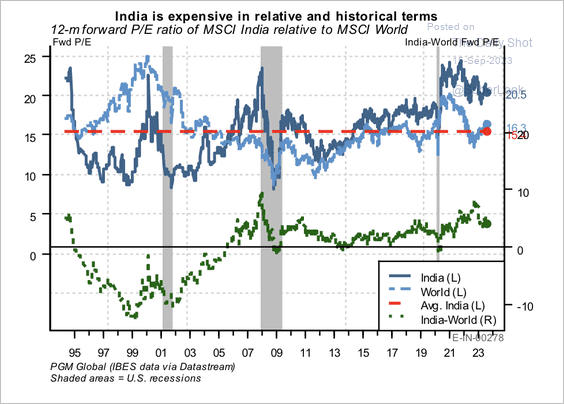 Source: PGM Global
Nevertheless, investors continue to flock to Indian equities.
 Source: PGM Global
——————–
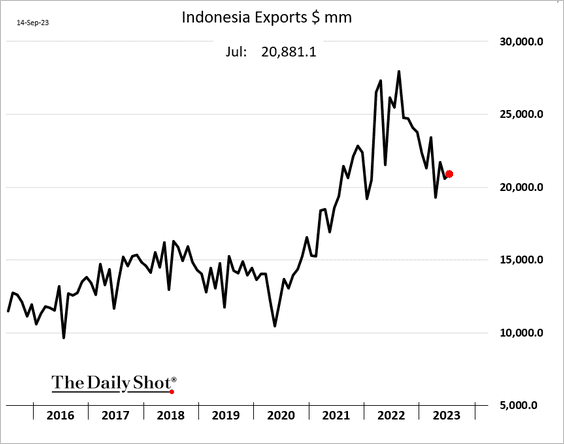
2. Indonesia’s exports are holding up.
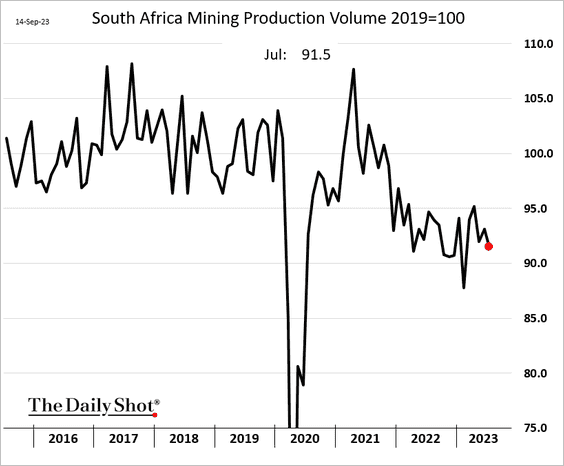
3. South Africa’s mining output continues to trend lower.
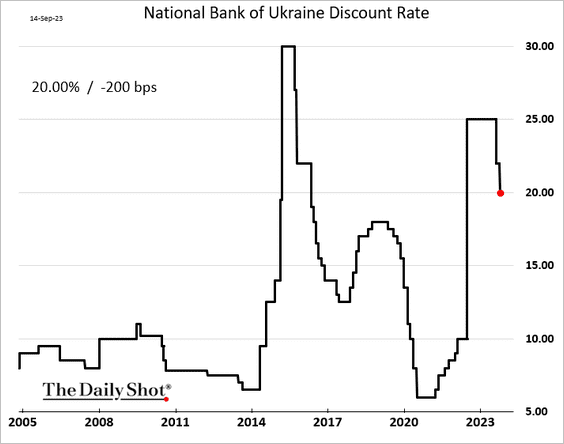
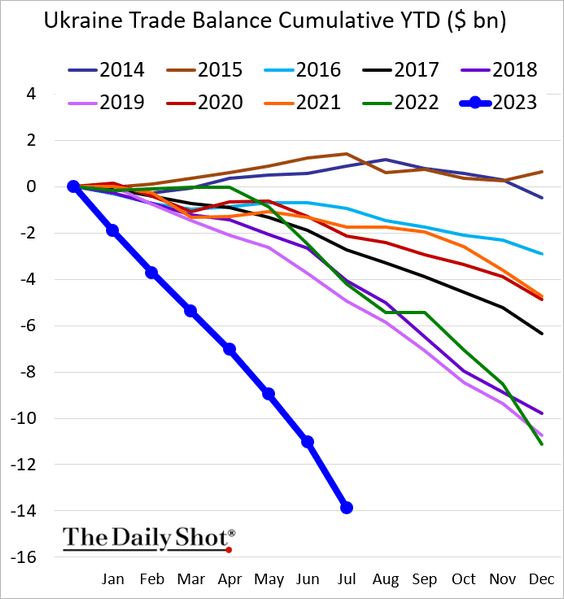
4. Ukraine’s central bank cut rates again.
The trade deficit has blown out.
——————–
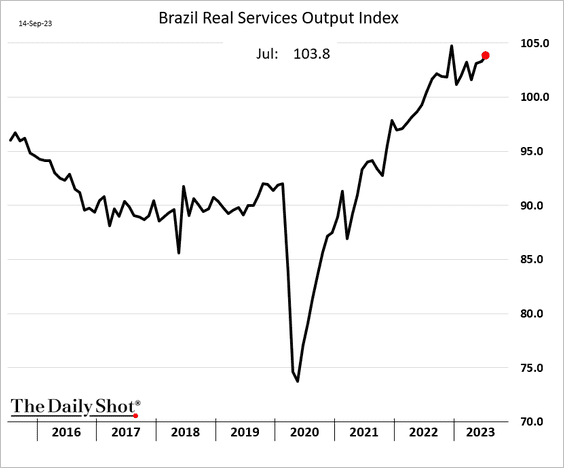
5. Brazil’s services output increased again in July.
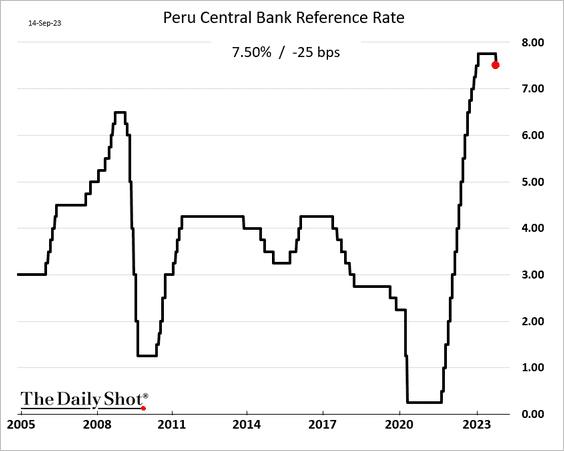
4. Peru’s central bank has started cutting rates.
Back to Index
Commodities
1. Bloomberg’s broad commodity index is at resistance.
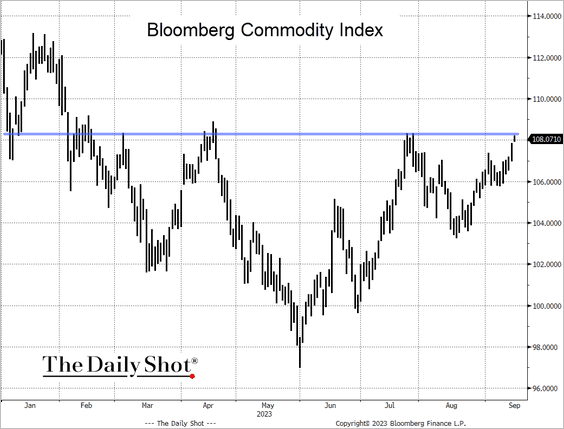 Source: @TheTerminal, Bloomberg Finance L.P.
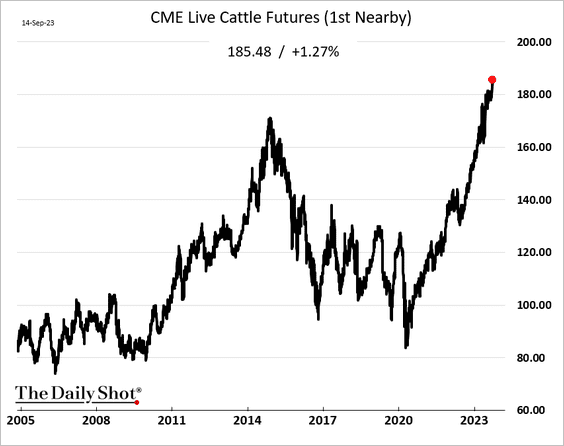
2. Chicago cattle futures hit a record high.
3. Drought in Spain devastated olive oil production, driving prices to unprecedented highs.

Back to Index
Energy
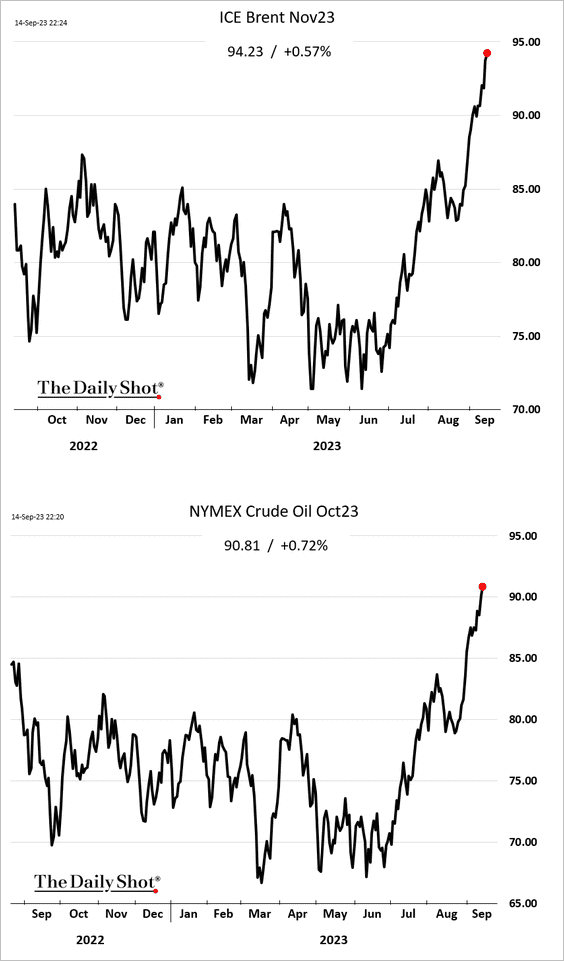
1. Crude oil prices continue to surge, with WTI soaring beyond $90/bbl.
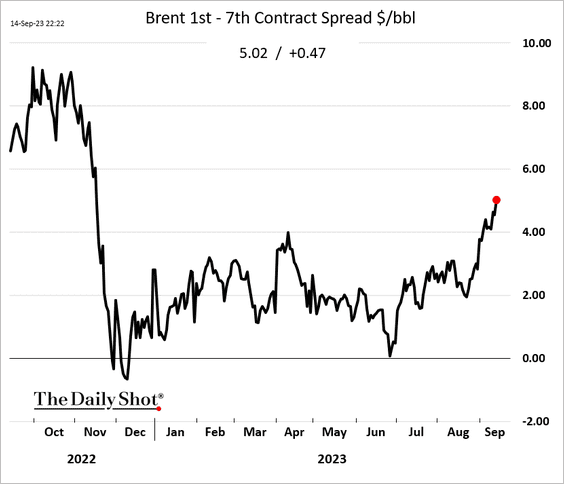
2. Backwardation keeps intensifying.
3. Capital spending remains very low relative to the rise in oil prices.
 Source: The Crude Chronicles
Back to Index
Equities
1. US households’ overweight equities exposure doesn’t bode well for longer-term returns.
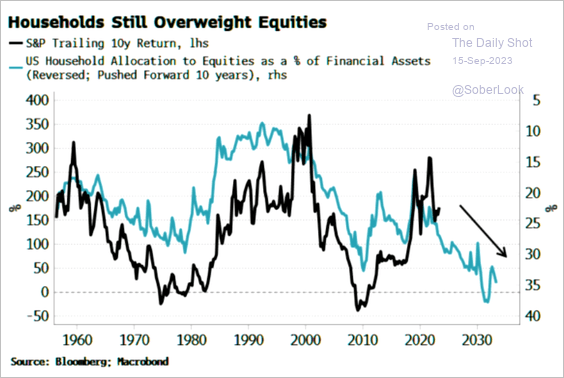 Source: Simon White, Bloomberg Markets Live Blog
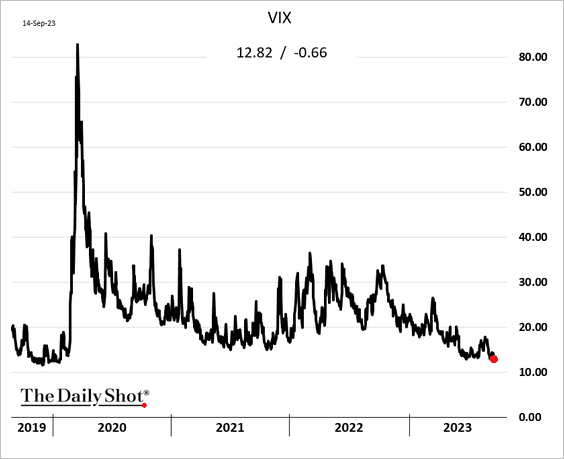
2. VIX hit the lowest level since 2019.
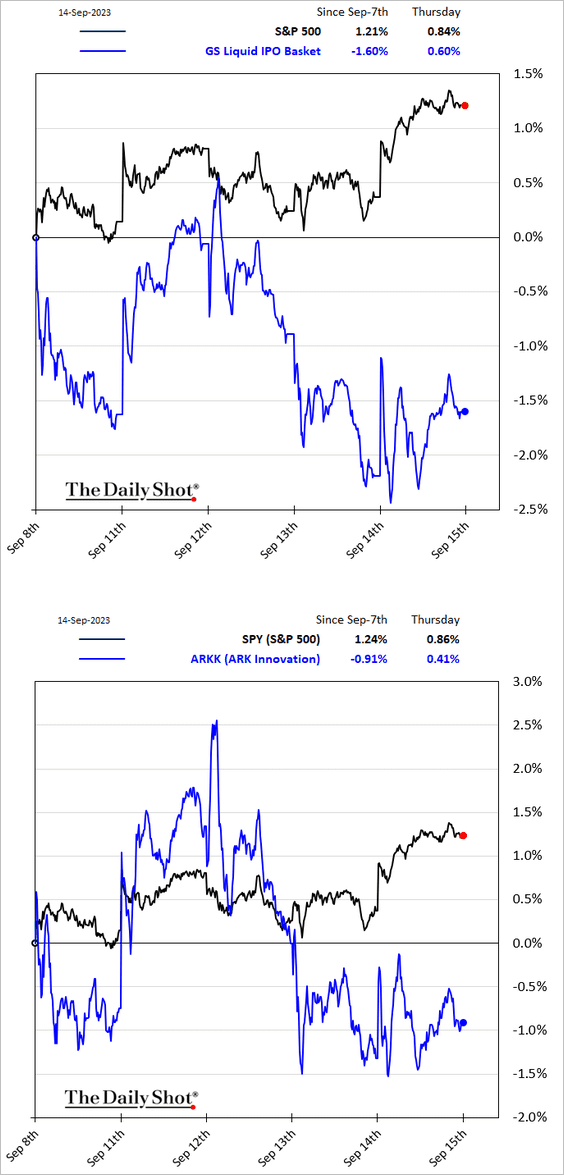
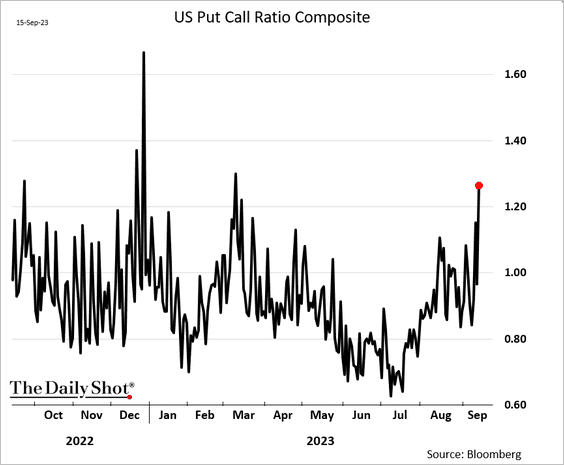
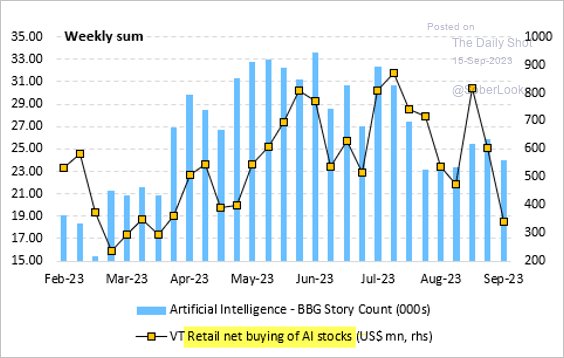
3. Despite the market rally, speculative activity remains subdued.
• Post-IPO stocks and ARK Innovation ETF:
• The put/call ratio:
• Retail stock purchases (2 charts):
 Source: Vanda Research
 Source: Vanda Research
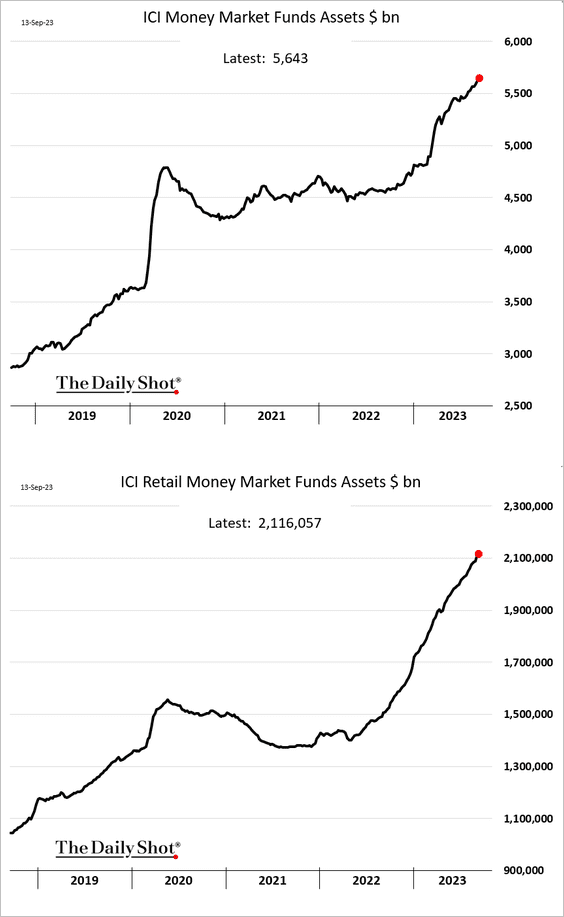
——————–
4. Money market fund assets are hitting record highs. With this much cash sitting on the sidelines, some have suggested that the market will keep climbing the “wall of worry.”
5. Historically, the S&P 500 performs well during periods of strong economic growth and rising rates, with cyclicals outperforming.
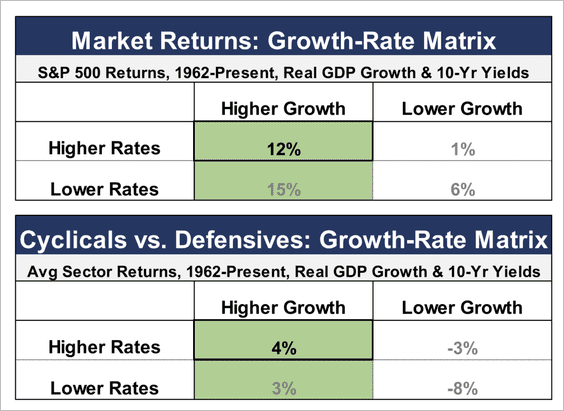 Source: Denise Chisholm; Fidelity Investments
Back to Index
Credit
1. US BBB-rated corporate bond spreads continue to narrow, which could support risk assets.
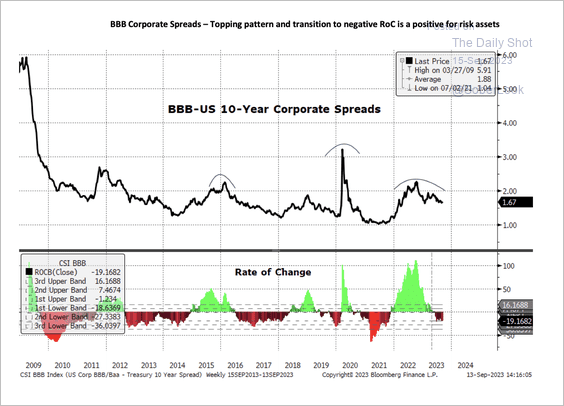 Source: Aazan Habib, Paradigm Capital
2. Interest coverage ratios have been declining.
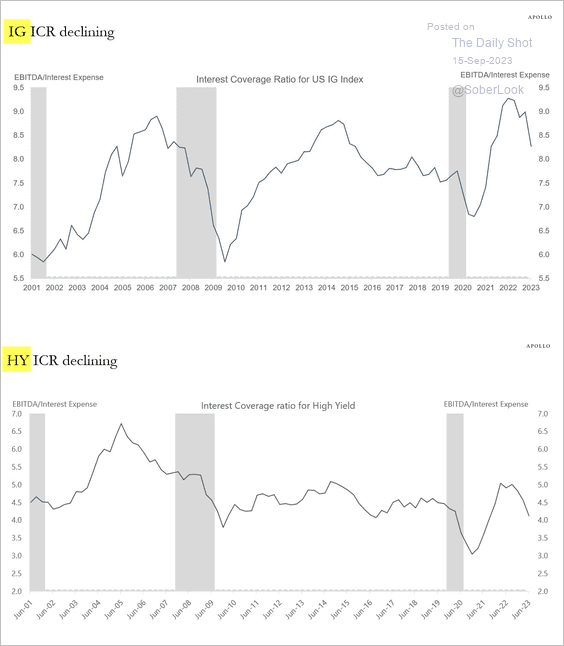 Source: Torsten Slok, Apollo
3. CMBS issuance remains tepid.
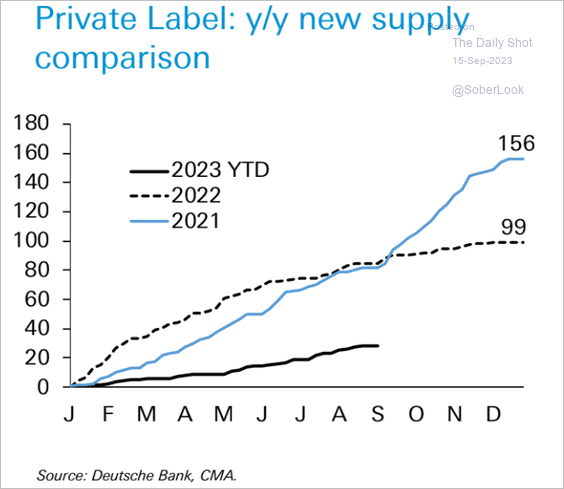 Source: Deutsche Bank Research
Back to Index
Rates
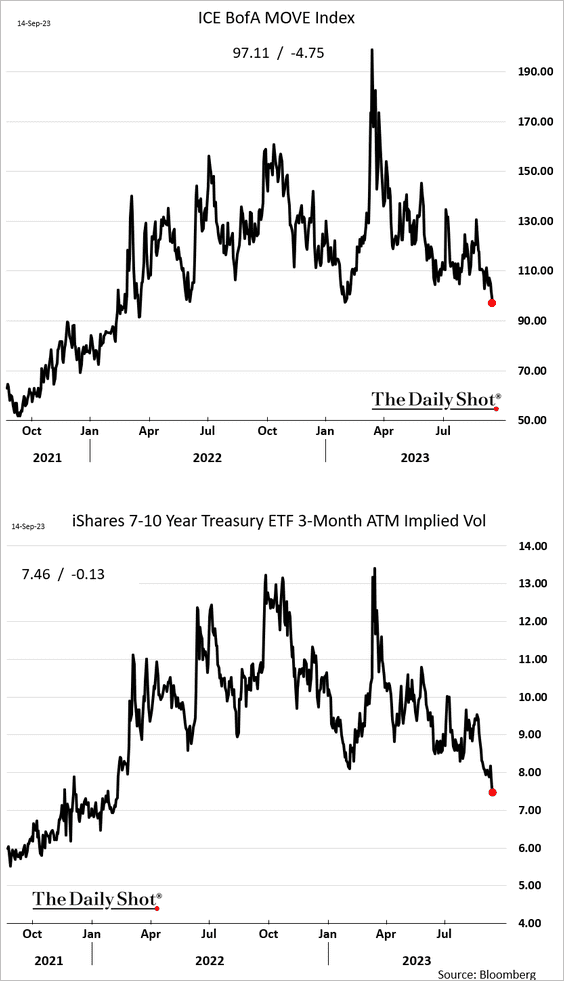
1. Treasury market implied vol continues to sink.
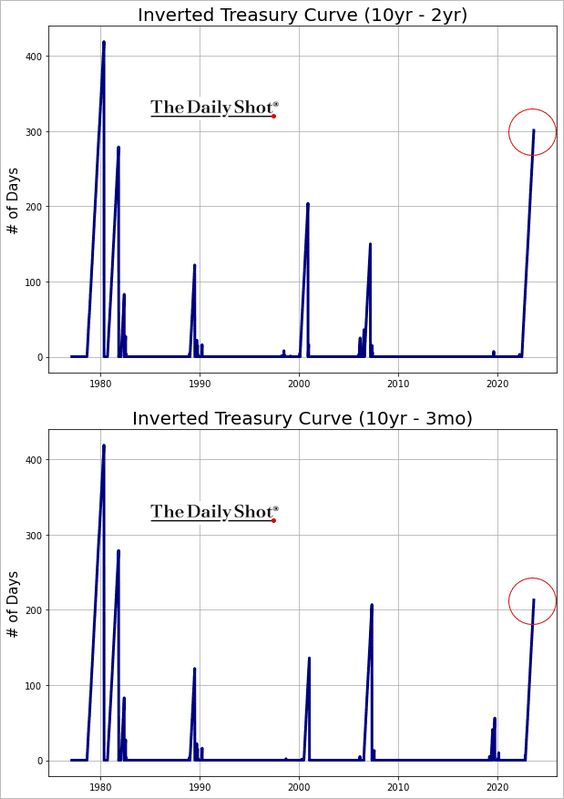
2. The Treasury curve has been inverted for a long time.
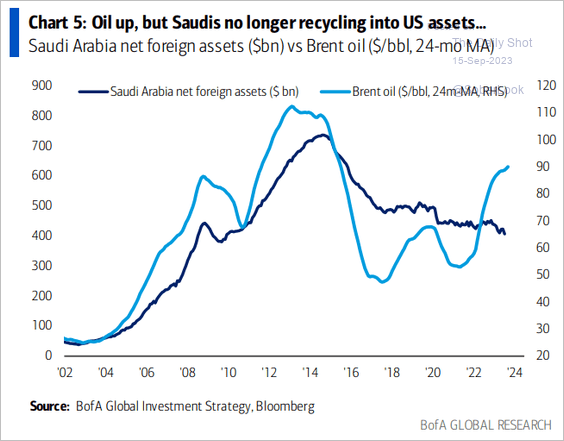
3. The Saudis are no longer plowing petrodollars into US Treasuries (2 charts).
 Source: BofA Global Research
 Source: BofA Global Research
Back to Index
Global Developments
1. G7 government bond yields remain in an uptrend. According to MRB Partners, markets are starting to unwind central bank rate-cut expectations amid sturdy global growth and sticky inflation.
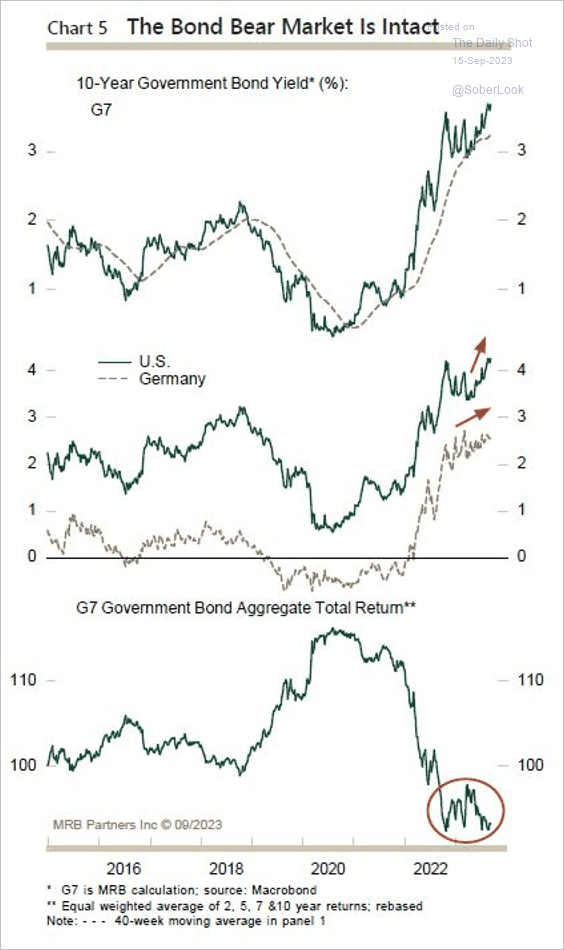 Source: MRB Partners
2. Barclays’ US dollar sentiment indicator is increasingly bullish.
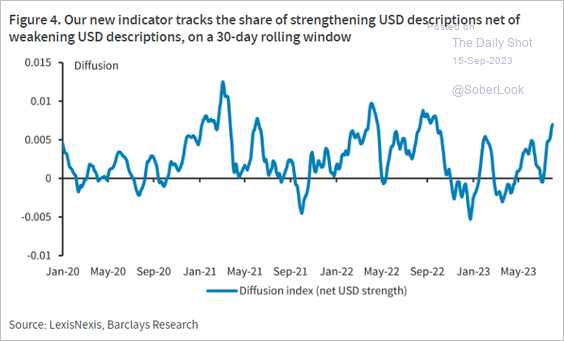 Source: Barclays Research
3. Is the decline in food prices over for now?
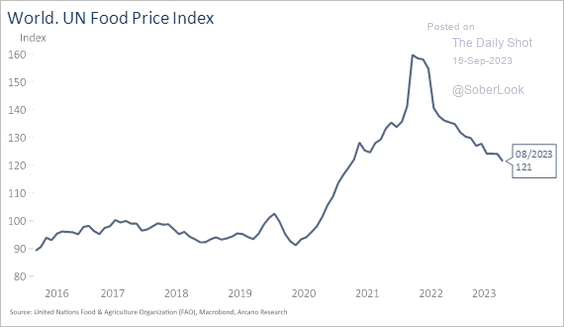 Source: Arcano Economics
4. This chart shows net importers and exporters as a percent of GDP.
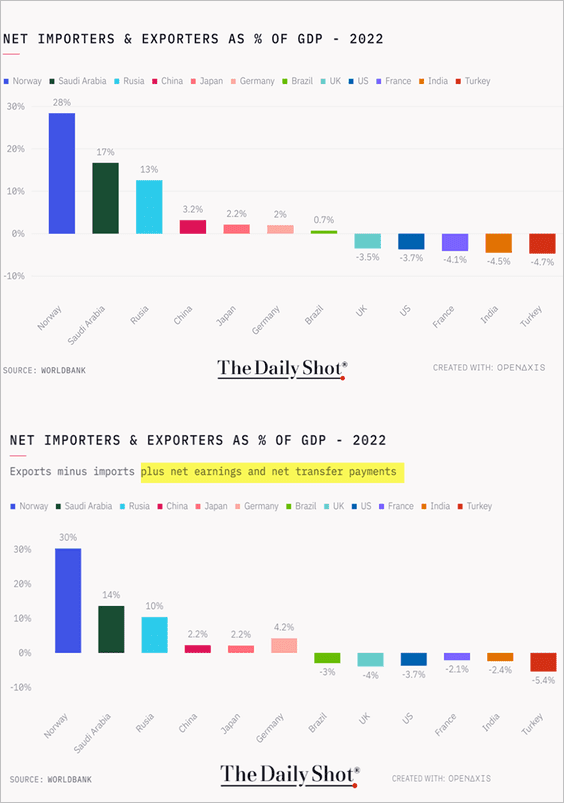 Source: @TheDailyShot
——————–
Food for Thought
1. In-person payments by type:
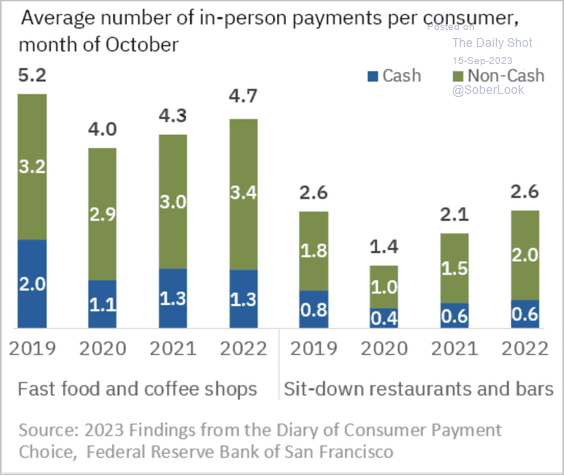 Source: Federal Reserve Bank of Atlanta Read full article
2. On-demand delivery services:
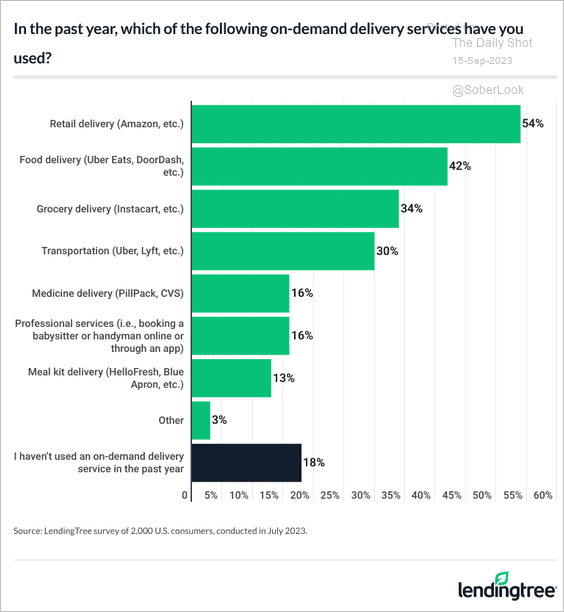 Source: LendingTree Read full article
3. Who is adding AI skills to their LinkedIn profiles?
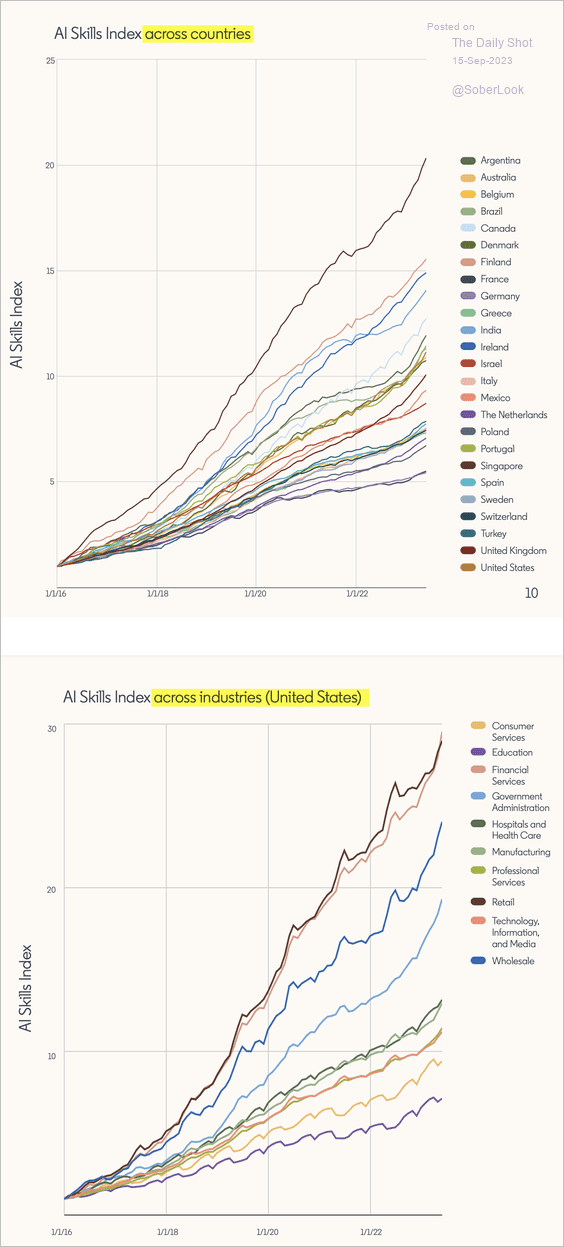 Source: LinkedIn Read full article
4. Dipping into retirement funds:
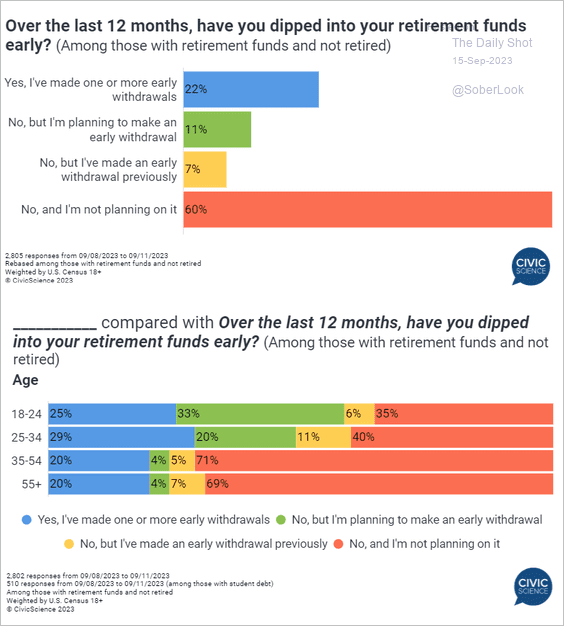 Source: @CivicScience Read full article
5. US wage growth and inflation in the 1970s:
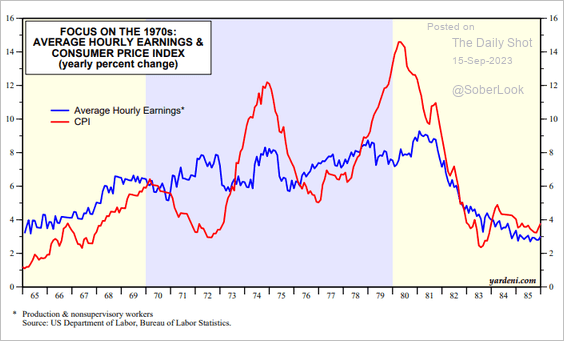 Source: Yardeni Research
6. Paying off student debt:
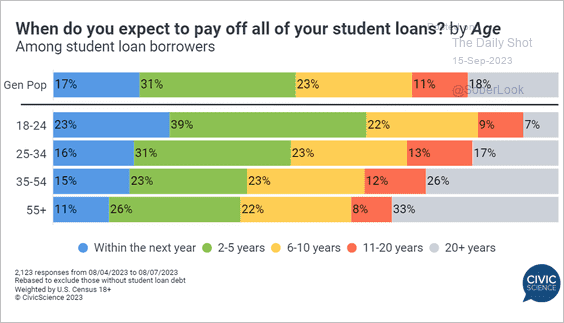 Source: @CivicScience Read full article
7. Preferred alcoholic beverages:
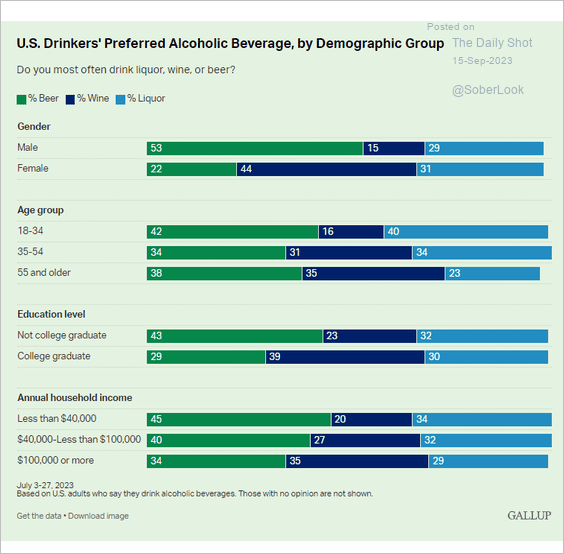 Source: Gallup Read full article
——————–
Have a great weekend!
Back to Index