
The Daily Shot: 06-Nov-23
• The United States
• Canada
• The Eurozone
• Asia-Pacific
• China
• Emerging Markets
• Commodities
• Energy
• Equities
• Credit
• Rates
• Global Developments
• Food for Thought
The United States
1. After consistently surpassing forecasts, last month’s US payrolls surprised to the downside, signaling a cooling labor market.

 Source: CNBC Read full article
• Here is the employment diffusion index, which measures the share of industries adding jobs.

• The unemployment rate, as well as underemployment, edged higher in October, …
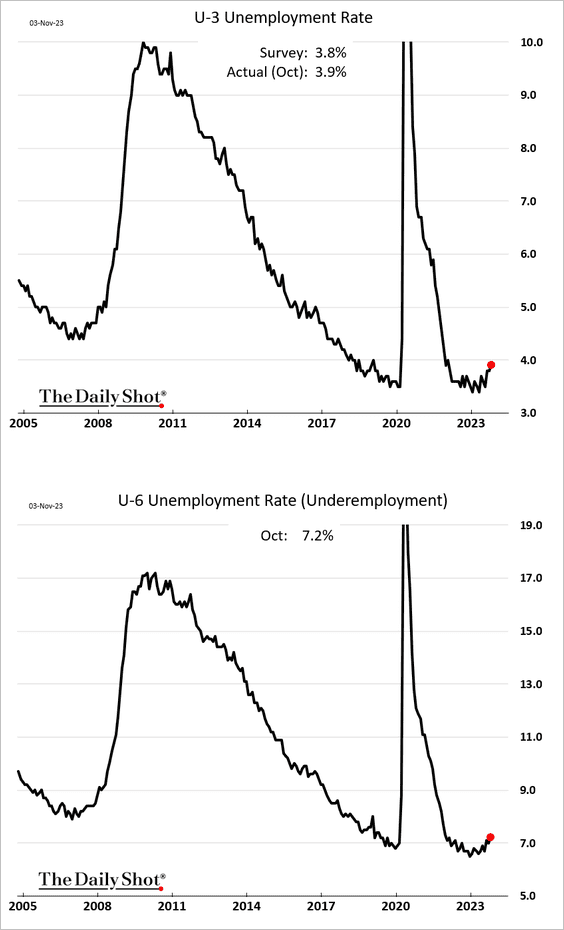
… with more job losses among full-time workers.
 Source: @WSJ Read full article
• The participation rate declined.
 Source: Chart and data provided by Macrobond
• Wage growth has been slowing.

• Healthcare (purple in the second panel below) remains a key driver of job gains.
 Source: @TheTerminal, Bloomberg Finance L.P.
– The healthcare sector registered two years of consecutive monthly employment gains.

• The UAW strike was a drag on job growth.

• Construction employment remains resilient.

——————–
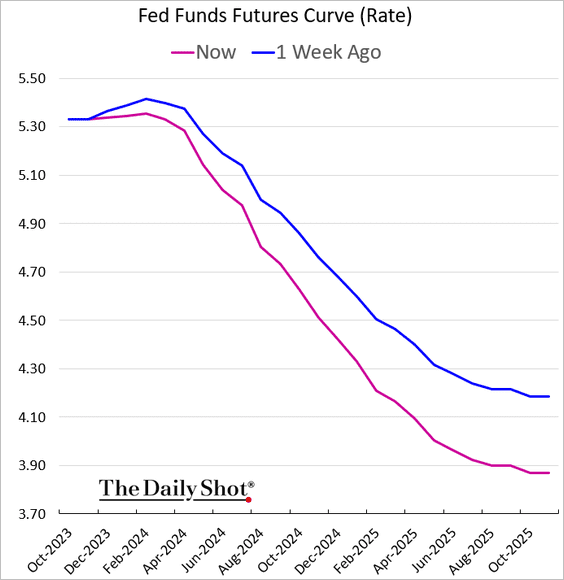
2. Markets now see very little chance of another Fed rate hike in this cycle.
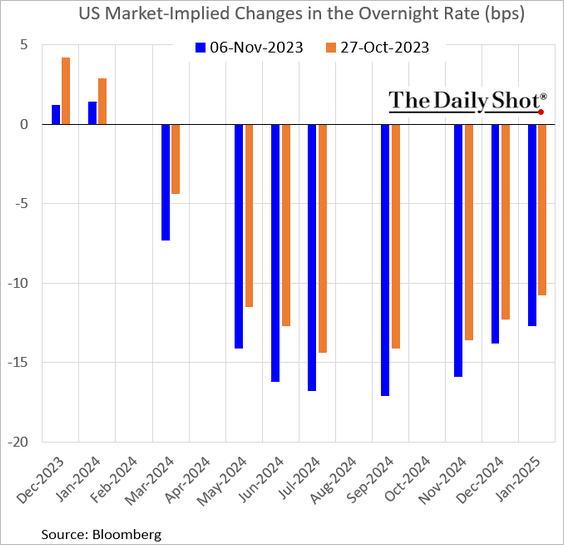
The terminal rate is closing in on the current fed funds rate of 5.33%, …

… and the market is pricing in deeper cuts over the next couple of years.
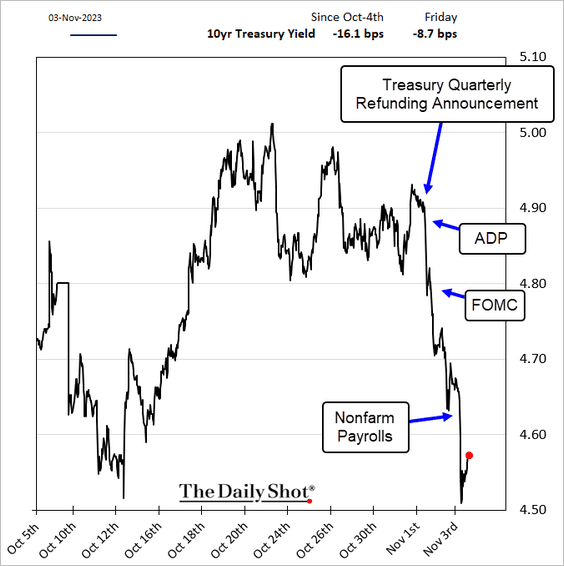
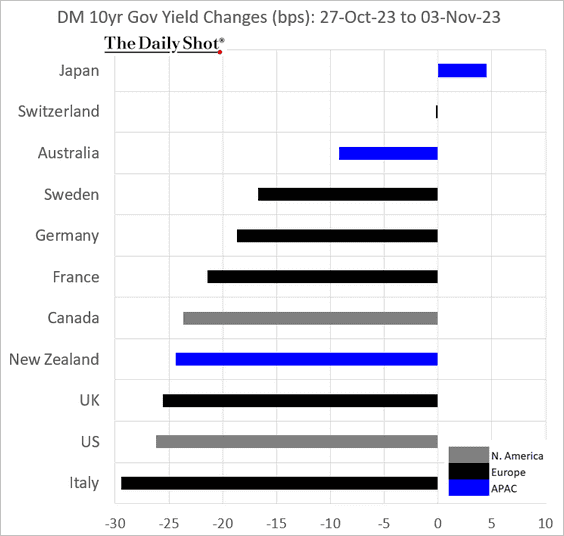
• Treasury yields tumbled.
– 10-year yield:

– 2-year yield:

– TIPS (real) yield:

• Risk assets had a great week.

• The US dollar took a hit.


——————–
3. The October ISM Services PMI was lower than expected, signaling slower growth in business activity.

• Hiring stalled.

• But demand appears to be holding up.

• Here is the ISM price index.

——————–
4. Student debt, credit cards, and auto loan payments are becoming a drag on consumer spending.
 Source: Economics and Strategy Group, National Bank of Canada
• The effects of monetary policy typically occur with a long lag.
 Source: Pantheon Macroeconomics
Back to Index
Canada
1. Similar to the US, Canada’s jobs report was softer than expected, …

… showing a small loss in full-time employment last month.

• The unemployment rate increased.

• Wage growth eased slightly.

• The participation rate held steady.

• Here are some trends by industry.
– Construction:

– Finance and real estate services:

– Manufacturing:

– Trade (mostly retail):

——————–
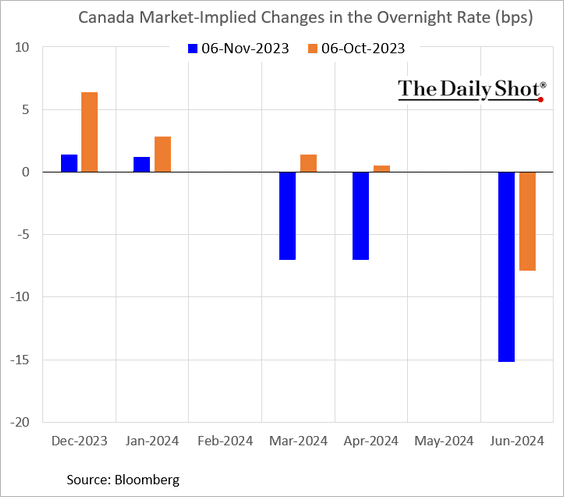
2. The market no longer sees additional BoC rate hikes in this cycle.
 Source: Reuters Read full article
Bond yields dropped sharply.


——————–
3. PMI reports show an ongoing contraction in business activity.

 Source: S&P Global PMI
The composite PMI signals a recession.
 Source: S&P Global PMI
Back to Index
The Eurozone
1. French manufacturing output eased again in September.

2. German exports have been rolling over.

3. Euro-area unemployment edged higher in September.

By the way, the Greek unemployment rate reached 10% – the lowest since 2009.

——————–
4. US and euro-area growth forecasts for 2024 are diverging.
 Source: @TheTerminal, Bloomberg Finance L.P.
Back to Index
Asia-Pacific
1. Asian currencies are surging after last week’s US economic data and the FOMC meeting.
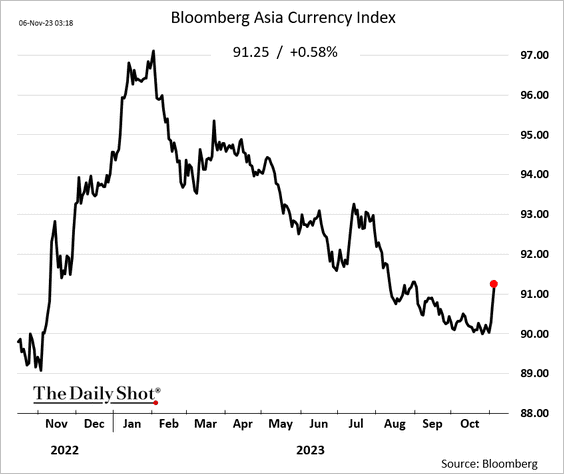
Here is the South Korean won.

——————–
2. Australia’s inflation indicator showed cooler price gains last month, but the index is still holding above 5%.

Back to Index
China
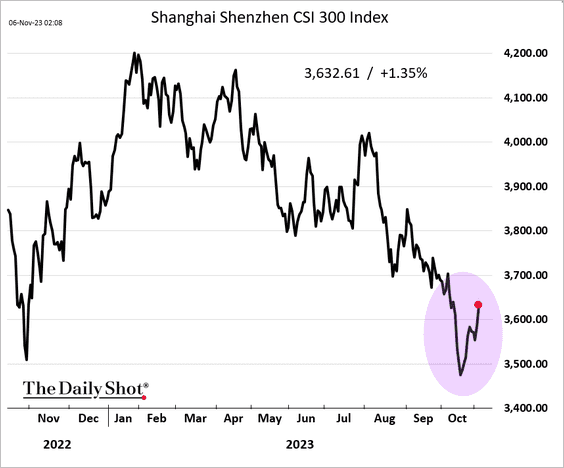
1. Stocks are higher after favorable US data and more stimulus news.
 Source: Reuters Read full article
 Source: Gavekal Research
——————–
2. Government debt growth is outpacing economic expansion.
 Source: Deutsche Bank Research
Back to Index
Emerging Markets
1. Mexican domestic vehicle sales declined last month, defying the typical seasonal trend.
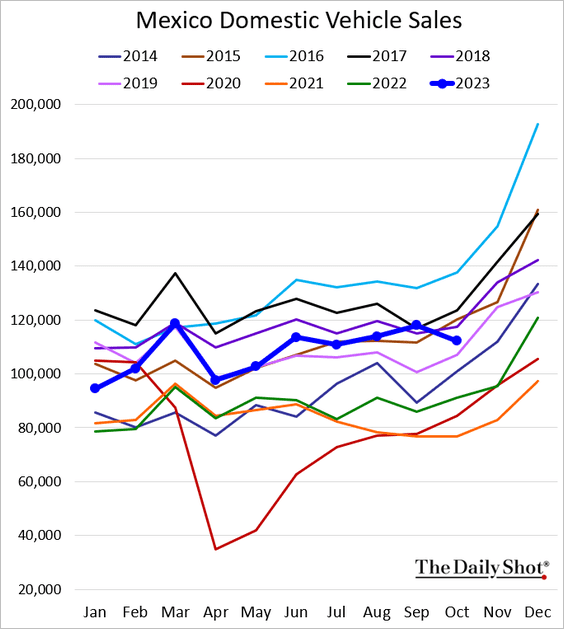
Business investment remains robust, boosted by US nearshoring.

——————–
2. Turkey’s CPI was lower than expected. Nonetheless, the core inflation is approaching 70%.

3. India’s services PMI remains very strong.
 Source: S&P Global PMI
• There has been a large valuation gap between Indian and Chinese equities since 2021, primarily driven by diverging multiples – the widest on record, according to Alpine Macro.
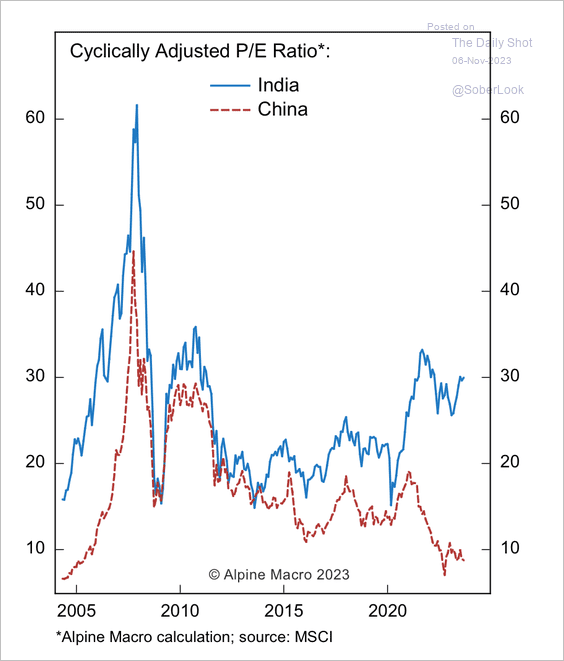 Source: Alpine Macro
——————–
4. Next, we have some performance data from last week.
• Currencies:

• Bond yields:

• Equity ETFs:

Back to Index
Commodities
1. Softs have been rallying (except for cotton).

• Cocoa (highest since the late 1970s):

• Coffee:

• Sugar:

 Source: @markets Read full article
——————–
2. Here is last week’s performance across key commodity markets.

Back to Index
Energy
1. European natural gas futures are falling again amid ample inventories.

2. Energy hedging activity has been decelerating. Since integrated energy firms typically have limited hedging needs, hedging volumes may decrease further due to the recent wave of M&A activity.
 Source: @markets Read full article
Back to Index
Equities
1. It was a good week for stocks (3 charts).


——————–
2. There was some short-covering last week.

3. The S&P 500 has been rebounding after a period of extreme bearish sentiment.
 Source: Aazan Habib, Paradigm Capital
• Here is the percentage of S&P 500 stocks trading above their 20-day moving average.
 $
$
——————–
4. Next, we have some updates on small caps.
• The Russell 2000 small-cap index experienced the longest streak below its one-year high since the financial crisis.
 Source: SentimenTrader
• The Russell 2000 (IWM ETF) is at its 50-day moving average.

——————–
5. Short-duration stocks have been outperforming recently.

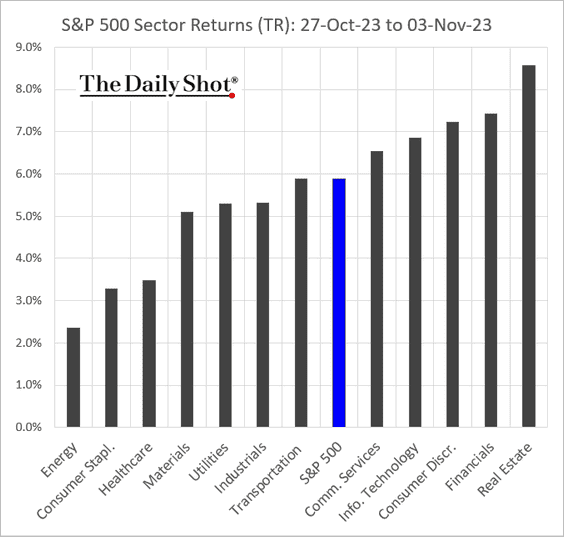
6. Finally, we have last week’s performance data.
• Sectors:
• Equity factors:


• Macro basket pairs’ relative performance:

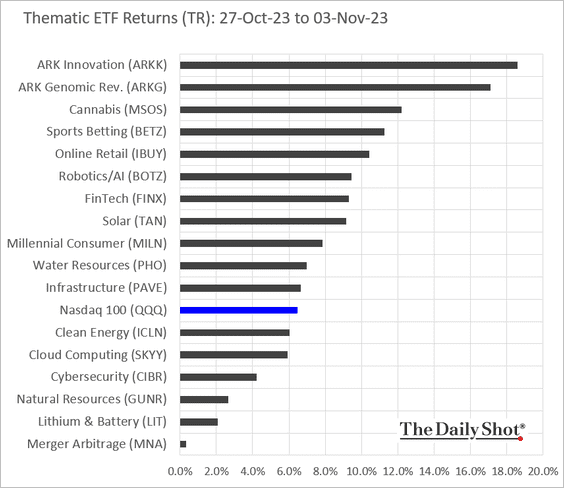
• Thematic ETFs:
• Largest US tech firms:

Back to Index
Credit
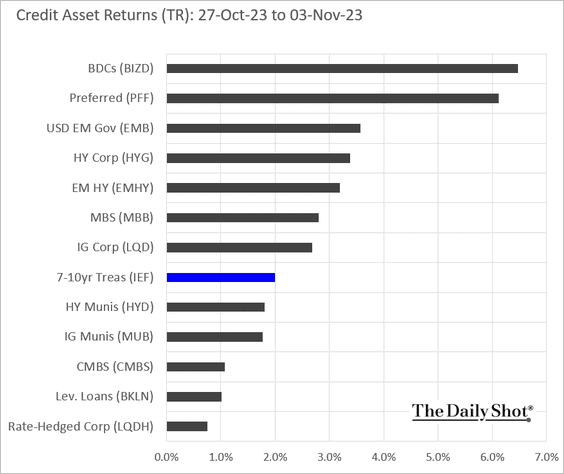
1. It was a good week for risk assets, including credit (2 charts).
 Source: @markets Read full article
——————–
2. High-yield bonds held up relatively well in October and year-to-date.
 Source: PitchBook
3. US leveraged loans outperformed the S&P 500, Treasuries, and corporate bonds during a volatile October.
 Source: PitchBook
4. Here is a look at asset yields vs. risk.
 Source: Truist Advisory Services
Back to Index
Rates
1. Last week’s rally forced some painful short-covering.
 Source: @markets Read full article
2. The largest T-bill ETF saw large inflows last week.
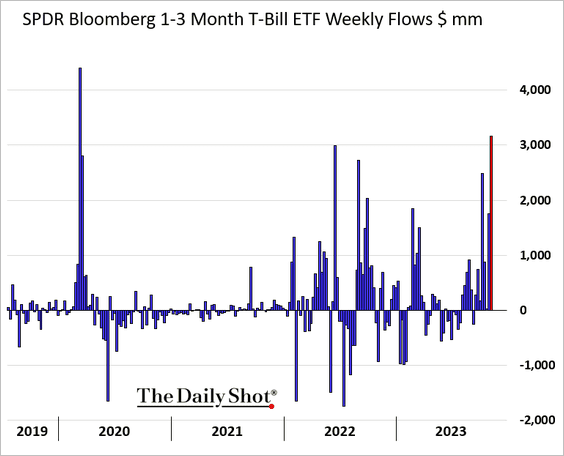
BofA’s clients have also been moving into T-bills.
 Source: BofA Global Research
——————–
3. Long-term Treasuries’ implied vol remains well above the equity-market equivalent.

Back to Index
Global Developments
1. Food prices continue to moderate.

2. Global manufacturing activity is contracting.
 Source: S&P Global PMI
Here is a look at manufacturing PMIs in October.
 Source: S&P Global PMI
——————–
3. Precious metals outperformed in October, while oil gave up earlier gains amid geopolitical risk. The Hang Seng Index extended its decline and is among the worst performers among major equity indices this year.
 Source: Deutsche Bank Research
4. Finally, we have some performance data from last week.
• Currencies:

• Bond yields:
• Equities:

——————–
Food for Thought
1. Paying for online news:
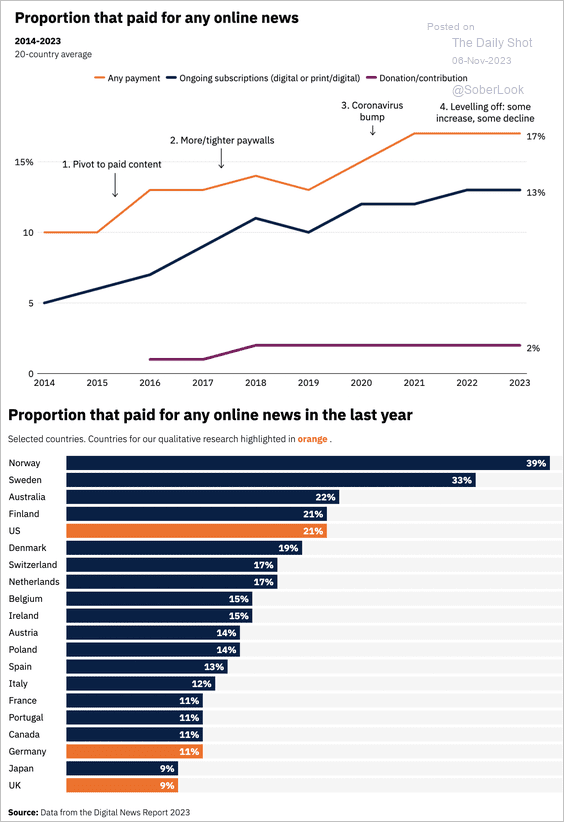 Source: Reuters Institute for the Study of Journalism Read full article
2. US largest retailers’ market share:
 Source: @financialtimes Read full article
3. Vacationing abroad:
 Source: @WSJ Read full article
4. Semiconductor sector employment:
 Source: Brookings Read full article
5. US households’ total balance sheet:
 Source: J.P. Morgan Asset Management
6. Living to 100:
 Source: The Economist Read full article
7. Popular vote or the Electoral College?
 Source: Pew Research Center Read full article
8. Toy brands’ social media presence:
 Source: @chartrdaily
• Lego’s revenues:
 Source: @chartrdaily
——————–
Back to Index