
The Daily Shot: 15-Nov-23
• The United States
• The United Kingdom
• The Eurozone
• Europe
• Japan
• Asia-Pacific
• China
• Emerging Markets
• Energy
• Equities
• Credit
• Rates
• Food for Thought
The United States
1. The October CPI report surprised to the downside. The headline price index was almost unchanged for the month, pulled lower by softer energy prices.
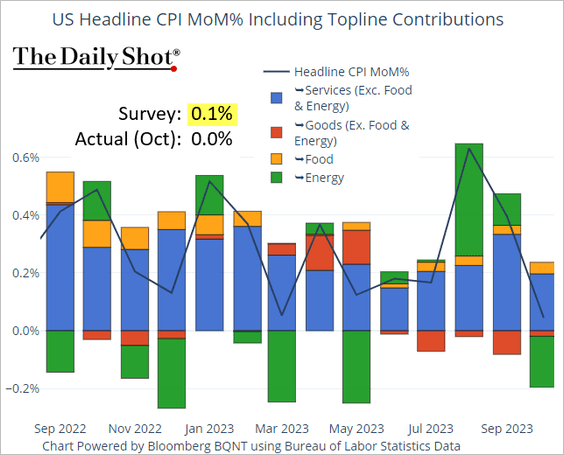 Source: @TheTerminal, Bloomberg Finance L.P.
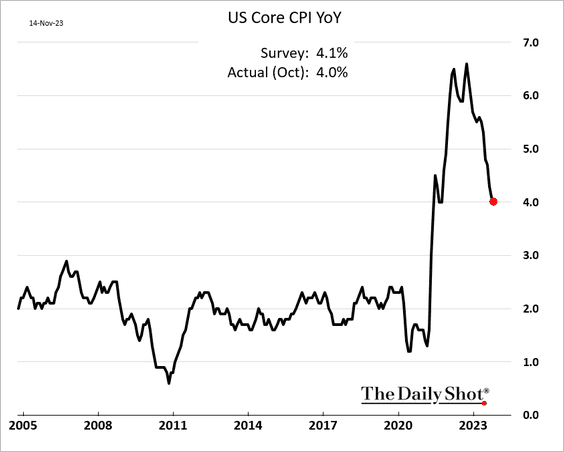
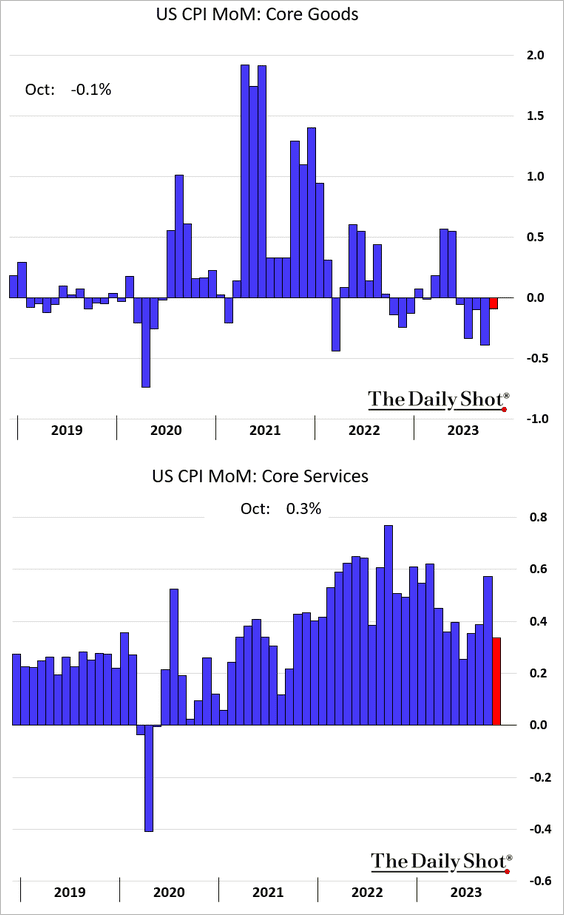
• The core CPI was also lower than expected.
– Month-over-month:
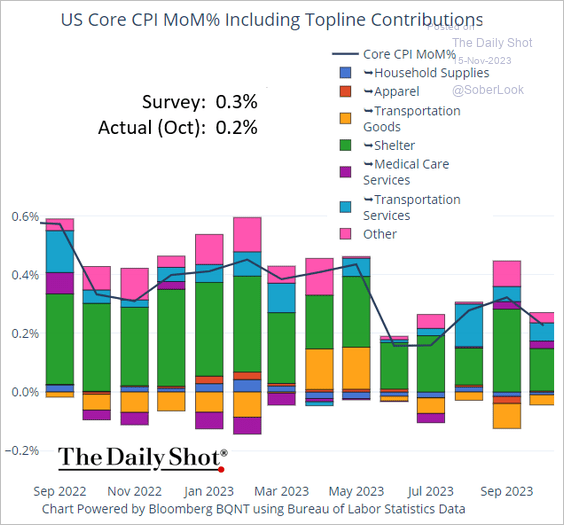 Source: @TheTerminal, Bloomberg Finance L.P.
– Year-over-year:
• The supercore CPI registered a 0.2% monthly increase, also below forecasts.
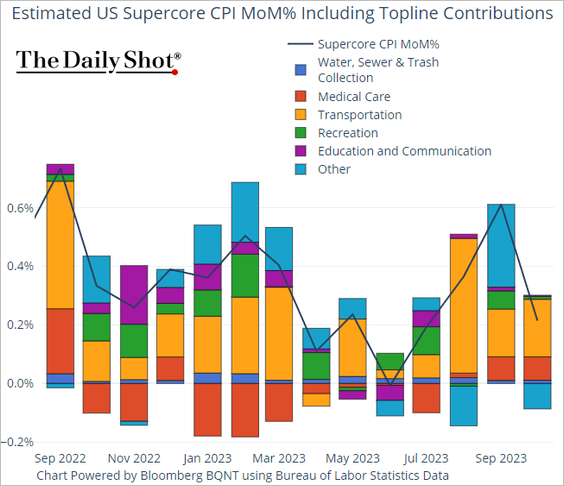 Source: @TheTerminal, Bloomberg Finance L.P.
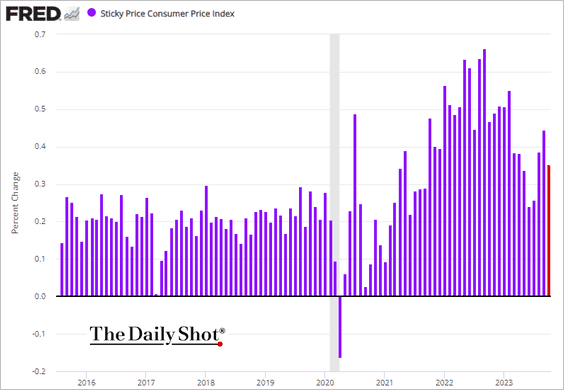
• The sticky CPI remains elevated.
• The core goods CPI declined for the 5th mont in a row.
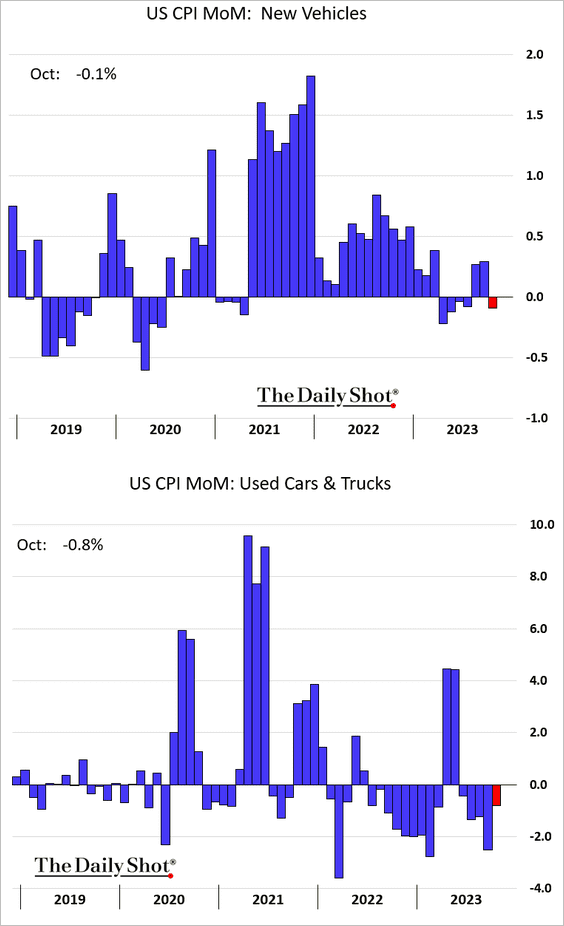
• Next, let’s take a look at some key CPI components.
– Vehicles (unexpected decline in new vehicle prices):
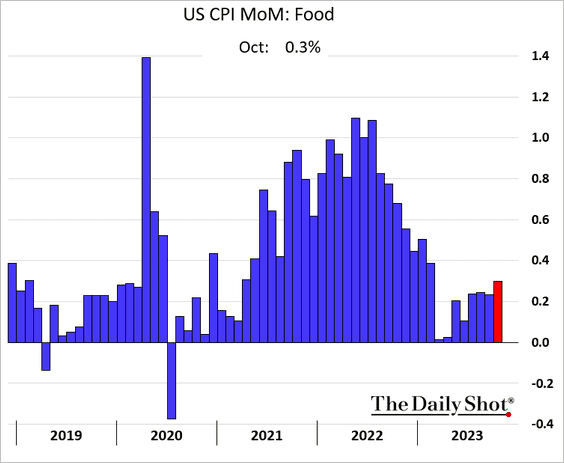
– Food:
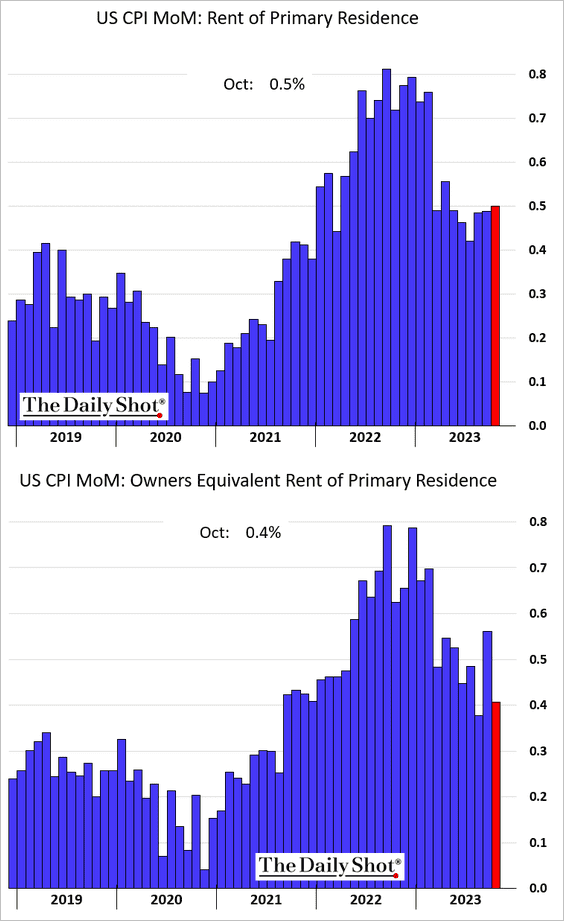
– Housing:
– Transportation services inflation (very high):
![]()
![]()
——————–
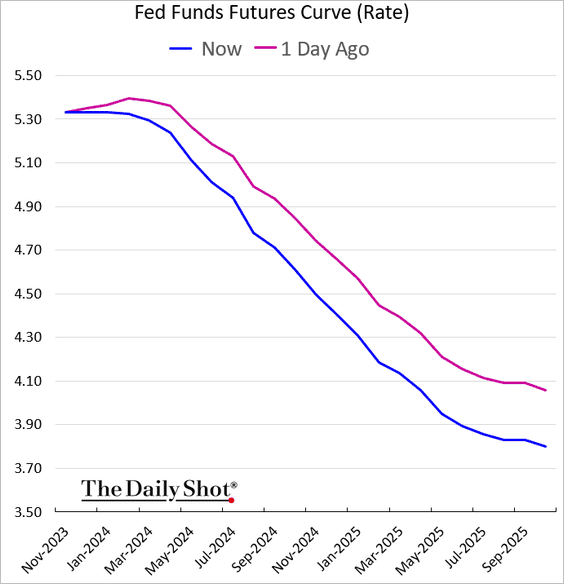
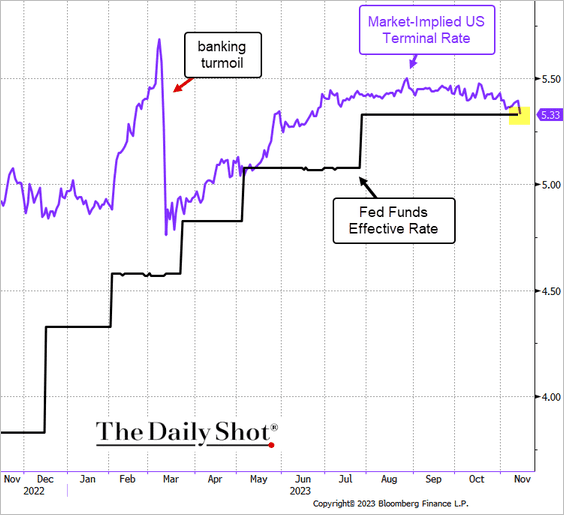
2. The market has now discounted any chance of another Fed rate hike in this cycle.
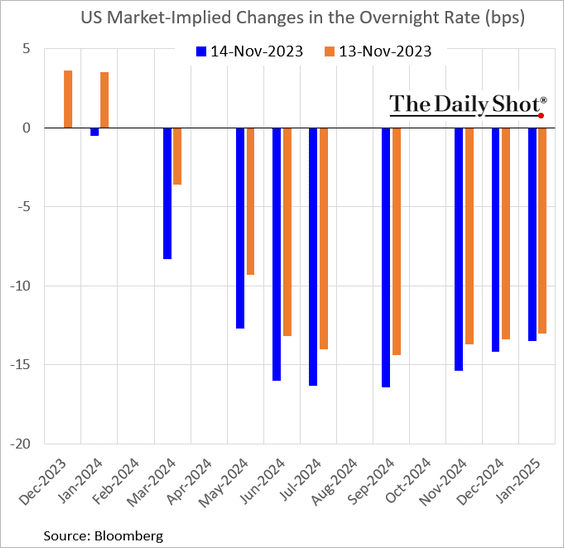
The terminal rate is now equal to the current fed funds rate (2 charts).
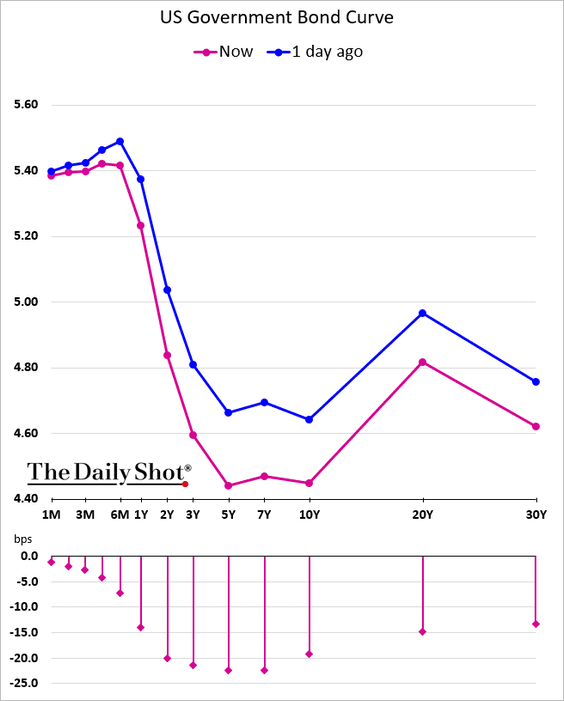
3. Bonds surged in response to the CPI surprise (3 charts).
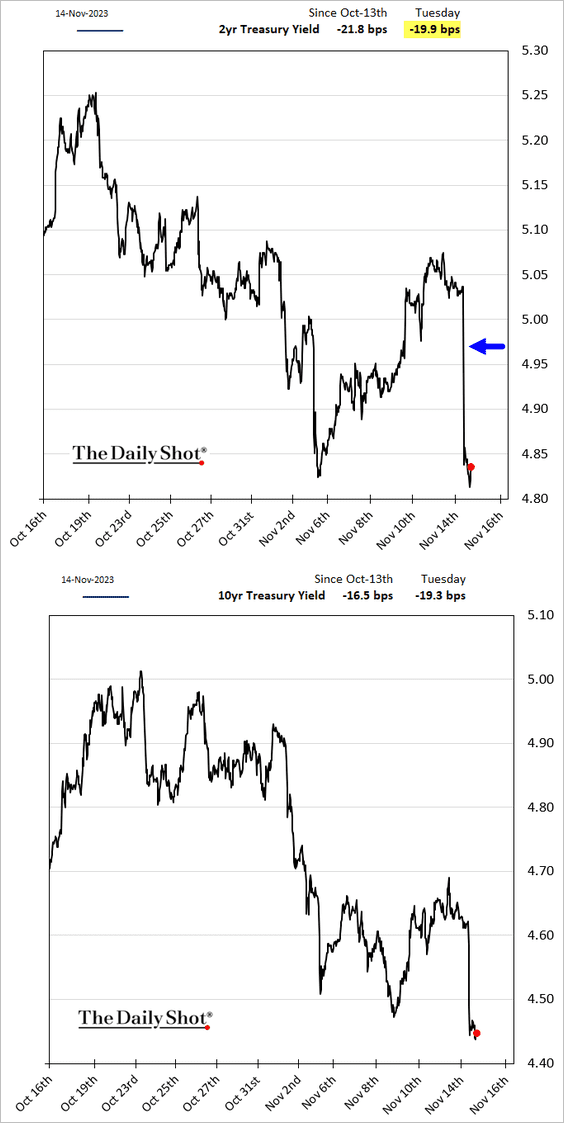
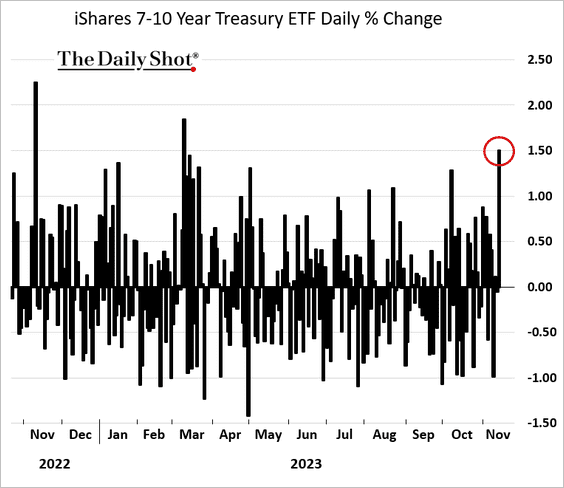
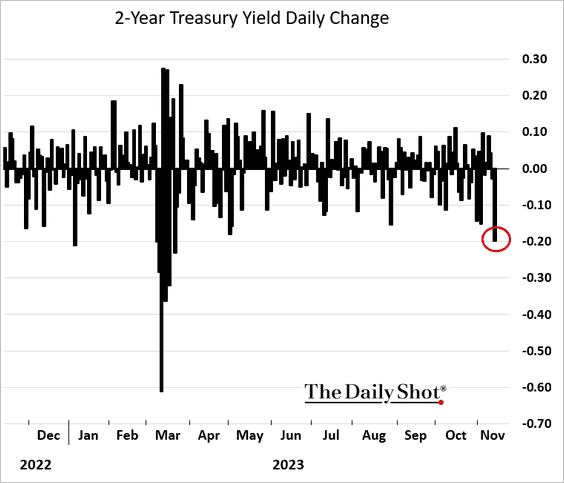
– The biggest rally was in the belly of the curve.
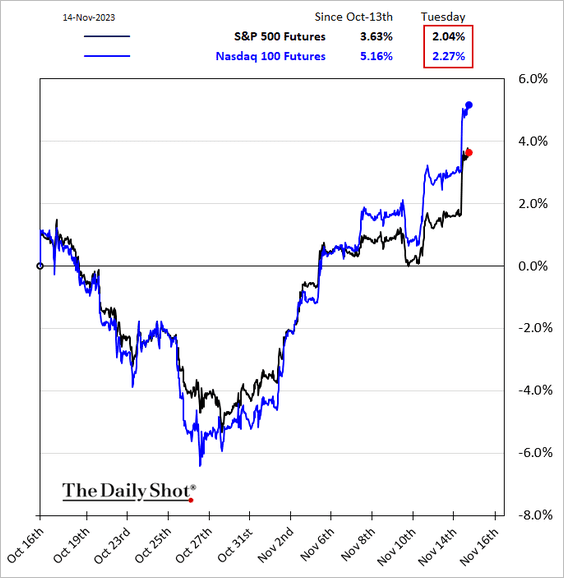
• Stocks had a very good day.
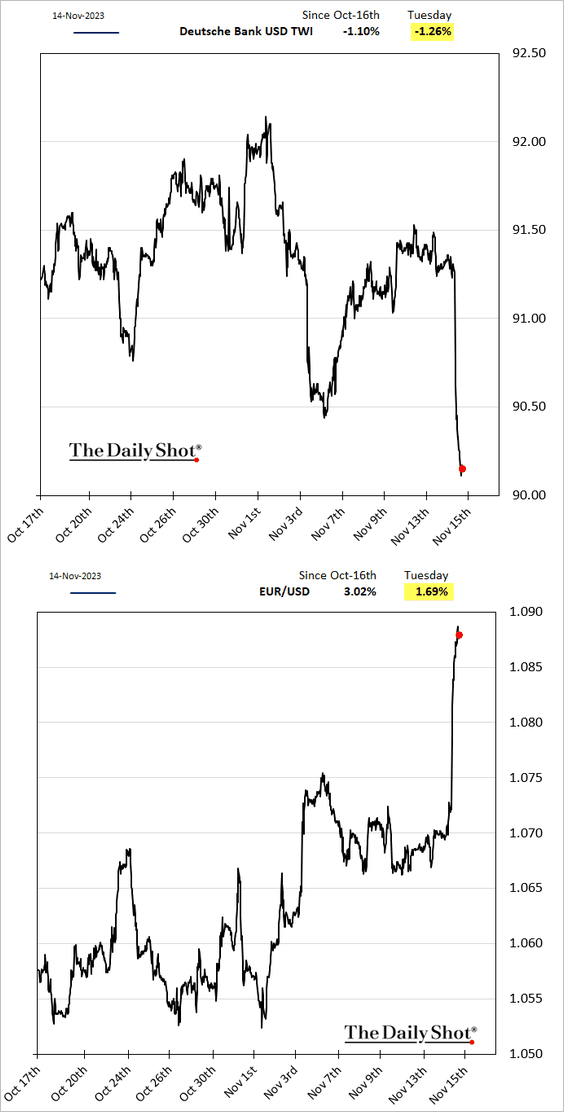
• The US dollar tumbled, …
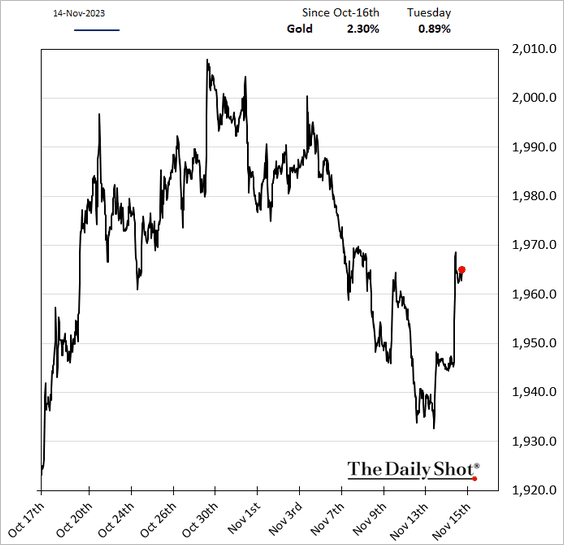
… sending gold higher.
——————–
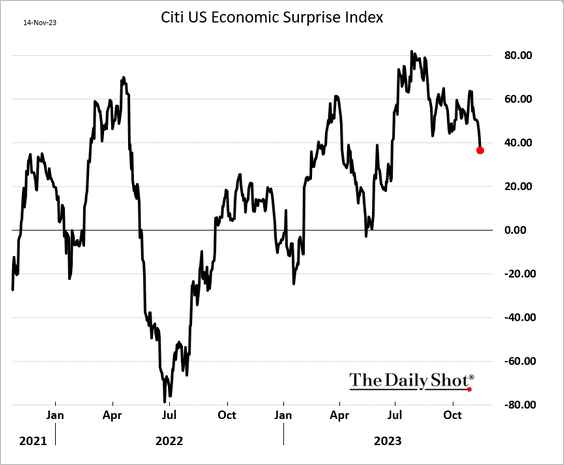
4. The Citi Economic Surprise Index appears to be rolling over.
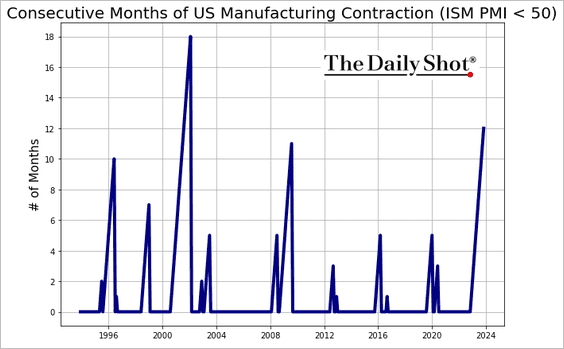
5. According to the ISM PMI, the nation’s manufacturing activity has been contracting for 12 months in a row.
6. Leading indicators continue to signal slowing business investment ahead. Here is Goldman’s CapEx tracker.
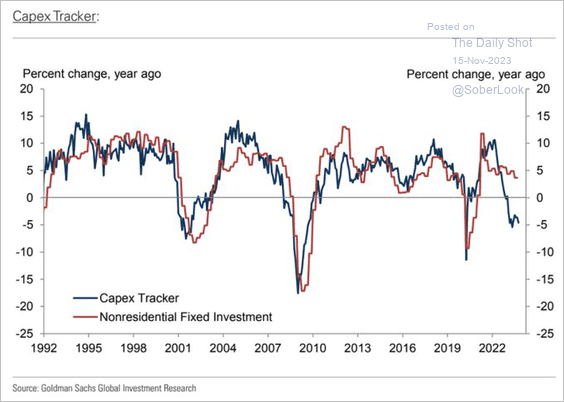 Source: Goldman Sachs; @AyeshaTariq
Back to Index
The United Kingdom
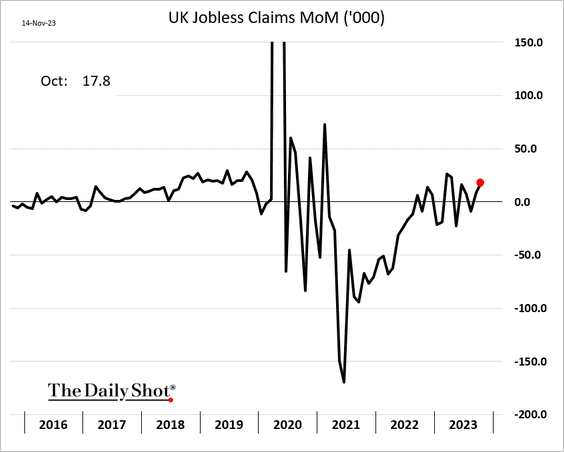
1. Jobless claims increased again in October.
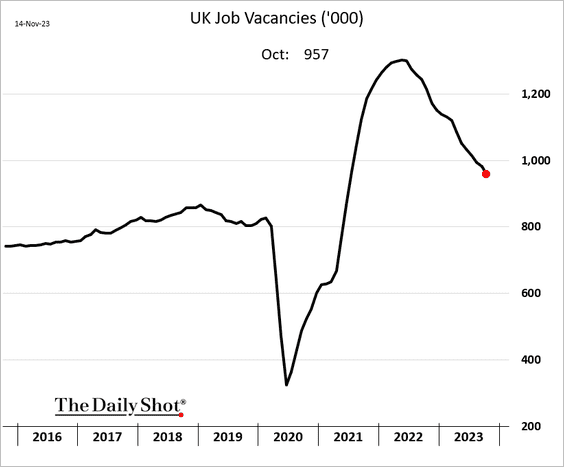
• Job openings continue to trend lower.
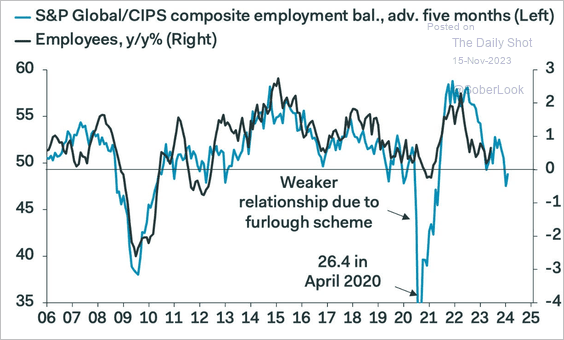
• The PMI data points to further weakness in the labor market.
 Source: Pantheon Macroeconomics
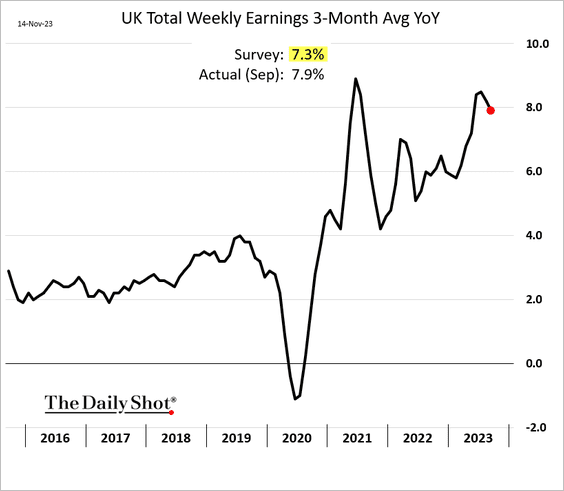
• Wage growth remains elevated.
——————–
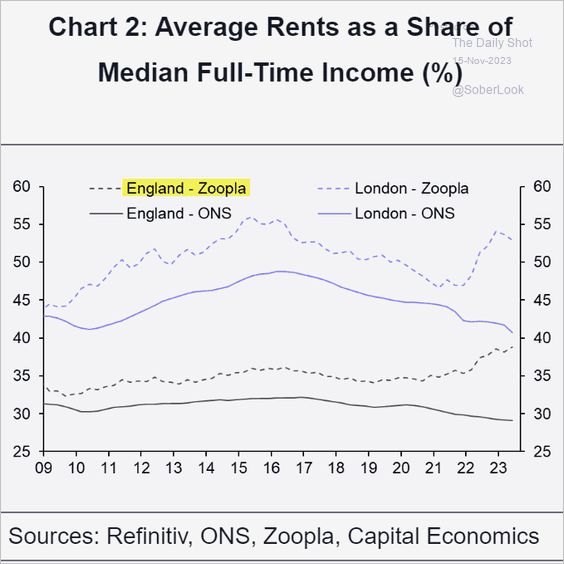
2. Rental affordability is much worse than the government data suggests.
 Source: Capital Economics
Back to Index
The Eurozone
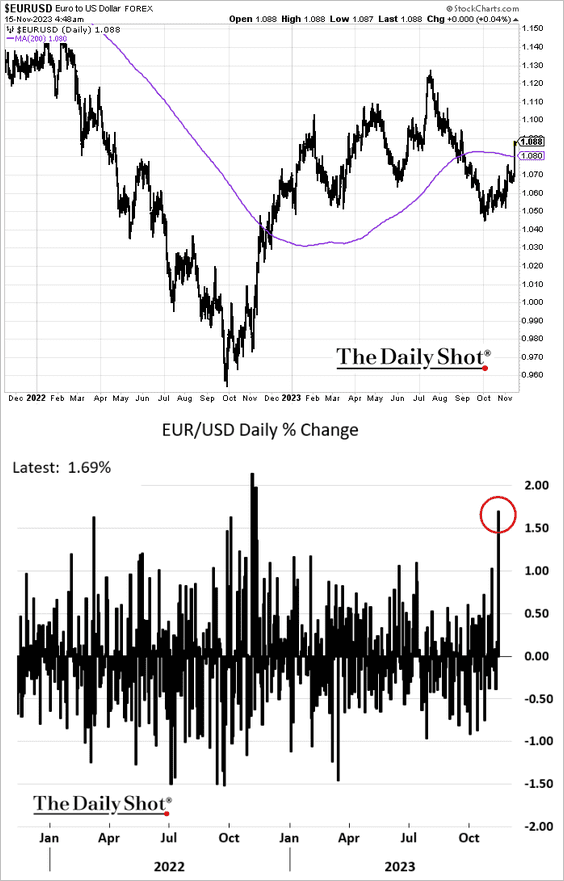
1. The euro surged in response to the tepid US CPI report, climbing above the 200-day moving average.
2. Germany’s ZEW indicator was stronger than expected this month.
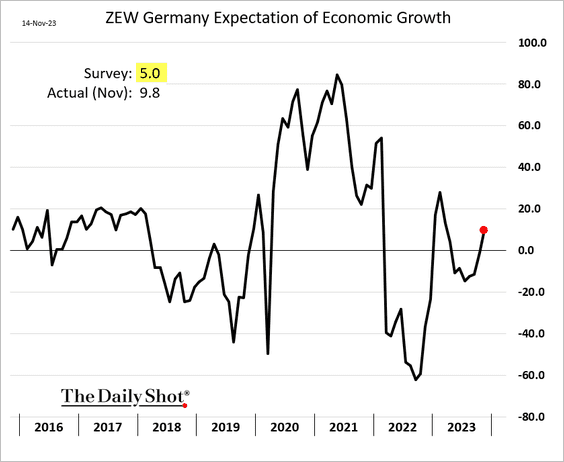
 Source: Reuters Read full article
3. The Dutch economy has contracted for three quarters in a row.
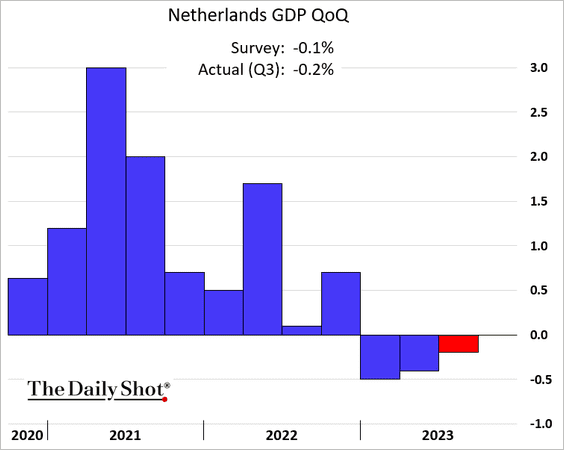
 Source: NL Times Read full article
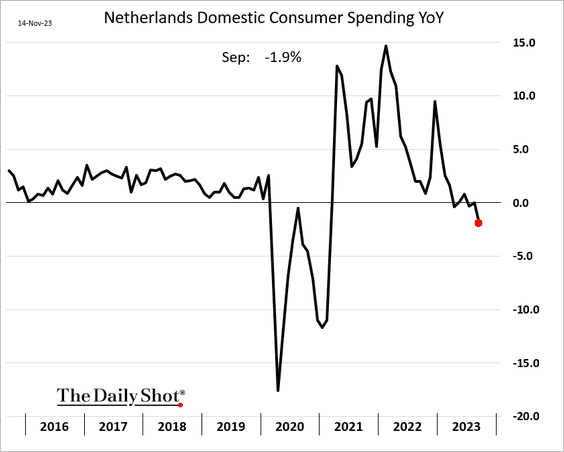
Consumer spending has been weakening.
——————–
4. House prices in the Eurozone are falling.
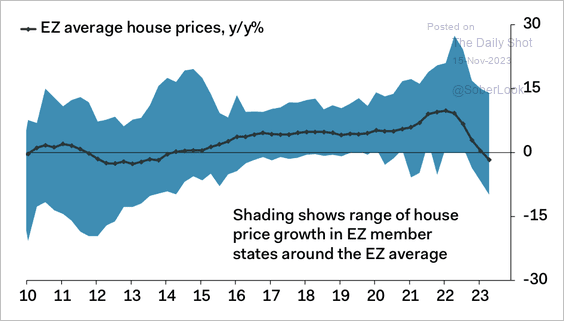 Source: Pantheon Macroeconomics
Back to Index
Europe
1. Sweden’s inflation surprised to the downside, …
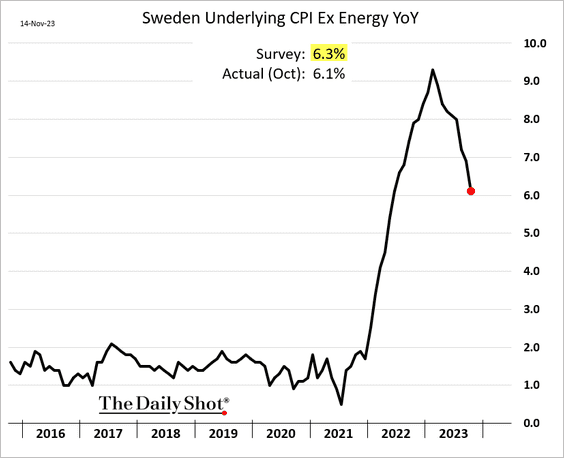
 Source: @economics Read full article
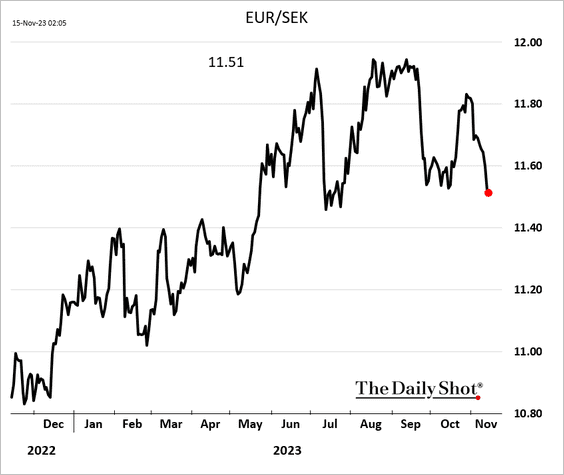
… sending bond yields sharply lower.
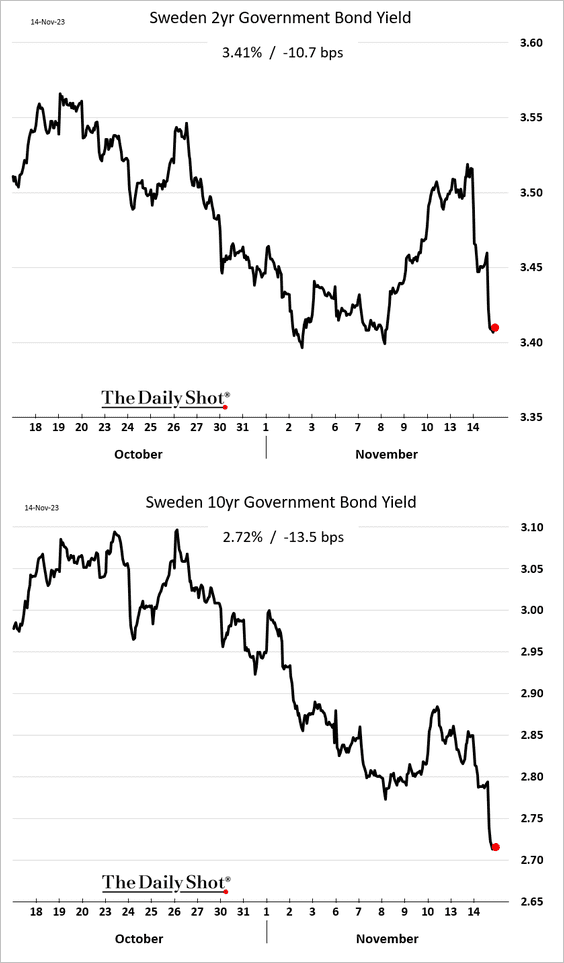
But the krona continues to strengthen.
——————–
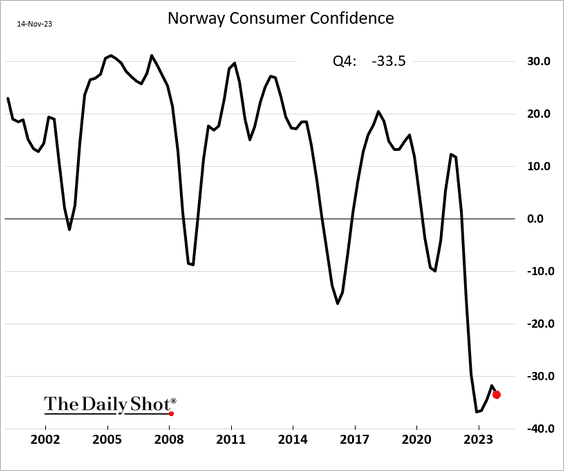
2. Norway’s consumer confidence remains depressed.
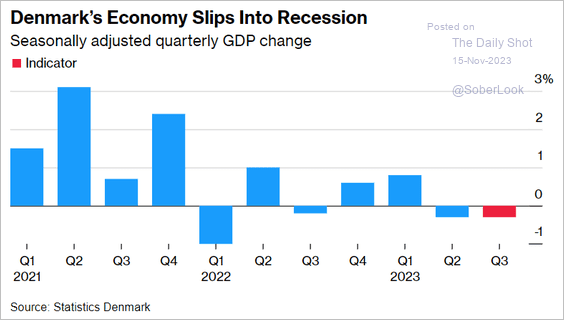
3. Denmark is in recession.
 Source: @economics Read full article
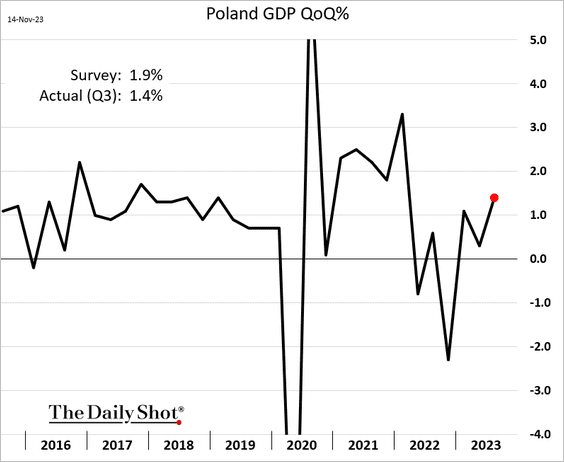
4. Poland’s GDP growth accelerated in Q3 but was below forecasts.
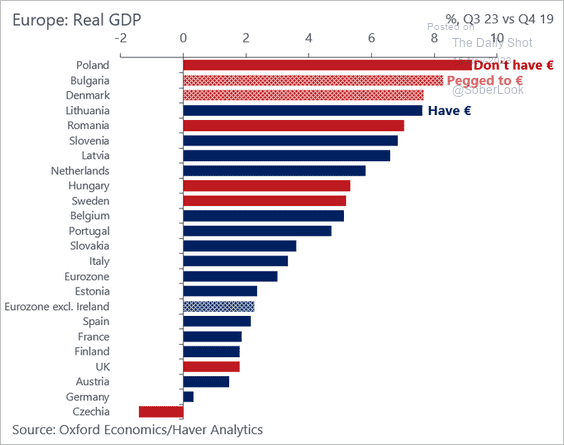
5. Here is a look at European GDP measures relative to pre-COVID levels.
 Source: @DanielKral1, @OxfordEconomics
Back to Index
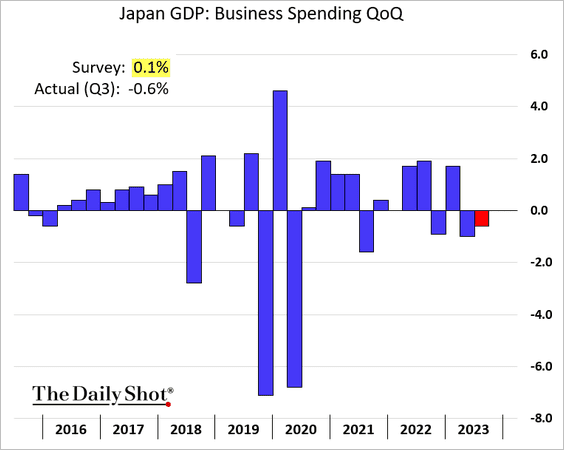
Japan
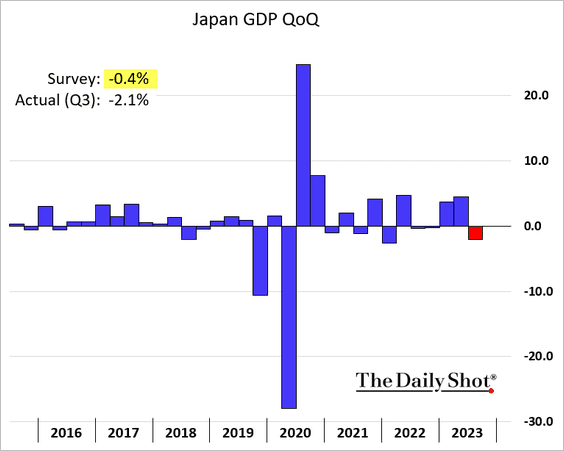
1. Japan’s GDP contracted in Q3.
 Source: CNBC Read full article
Business spending declined again.
——————–
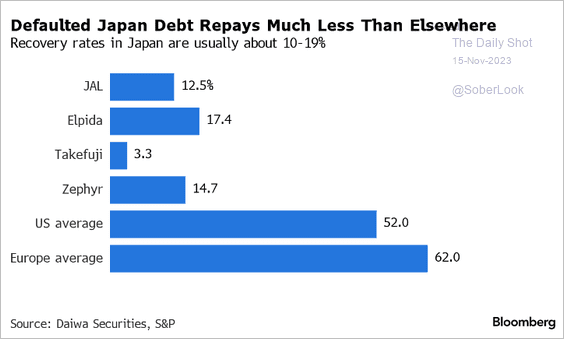
2. Japanese corporate debt is characterized by low recovery rates, largely attributed to the absence of robust covenant protections.
 Source: Bloomberg Law Read full article
Back to Index
Asia-Pacific
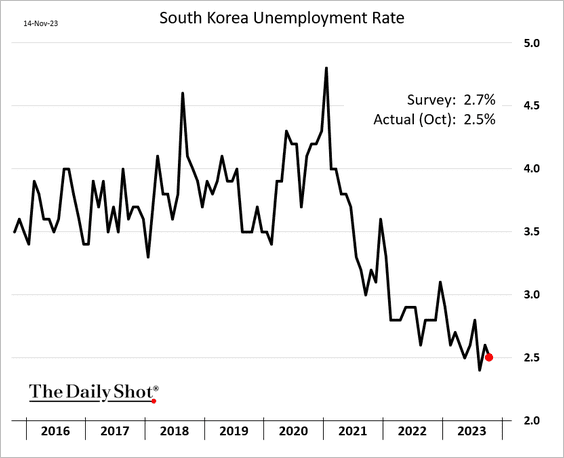
1. South Korea’s unemployment rate remains very low.
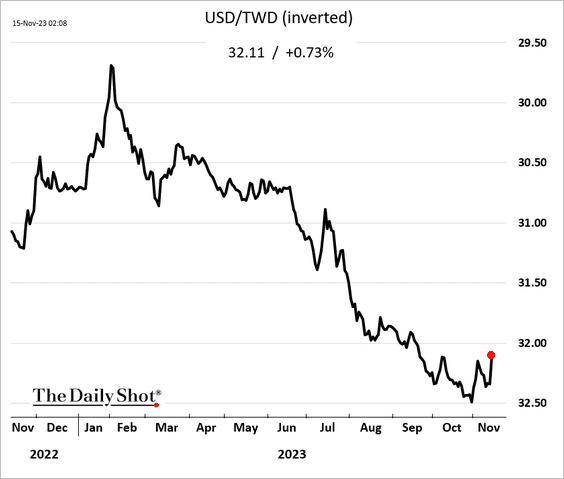
2. The Taiwan dollar appears to have bottomed.
3. Australian labor costs continue to surge.
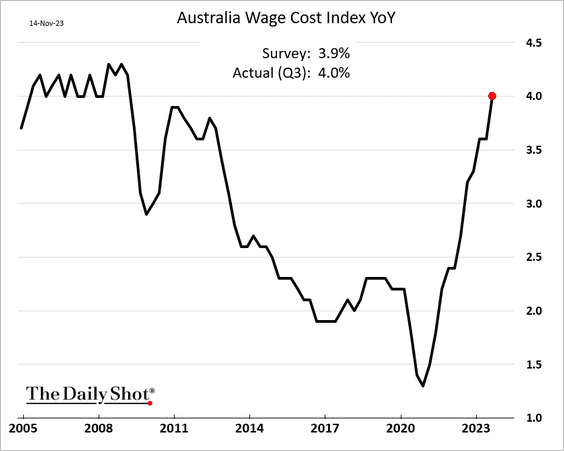
 Source: @WSJ Read full article
Back to Index
China
1. The PBoC injected a massive amount of liquidity into the market via the 1-year Medium-term Lending Facility.
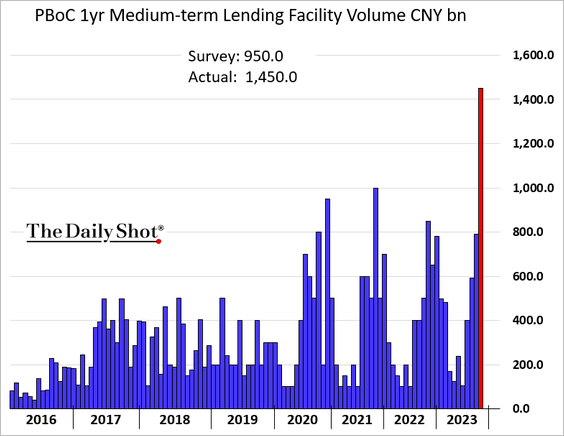
 Source: Reuters Read full article
——————–
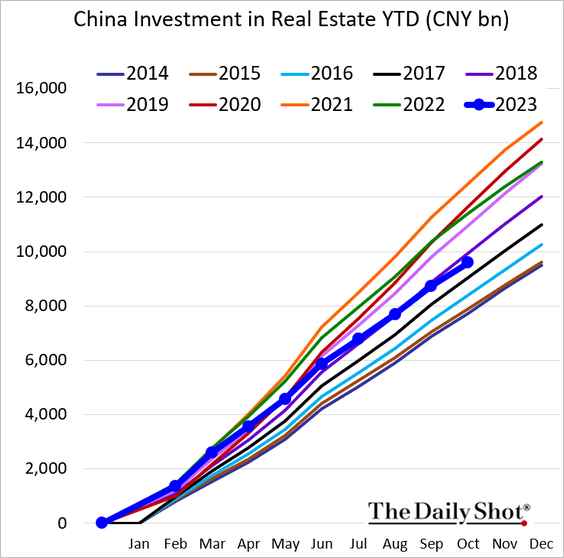
2. The October industrial production and retail sales figures were slightly better than expected.
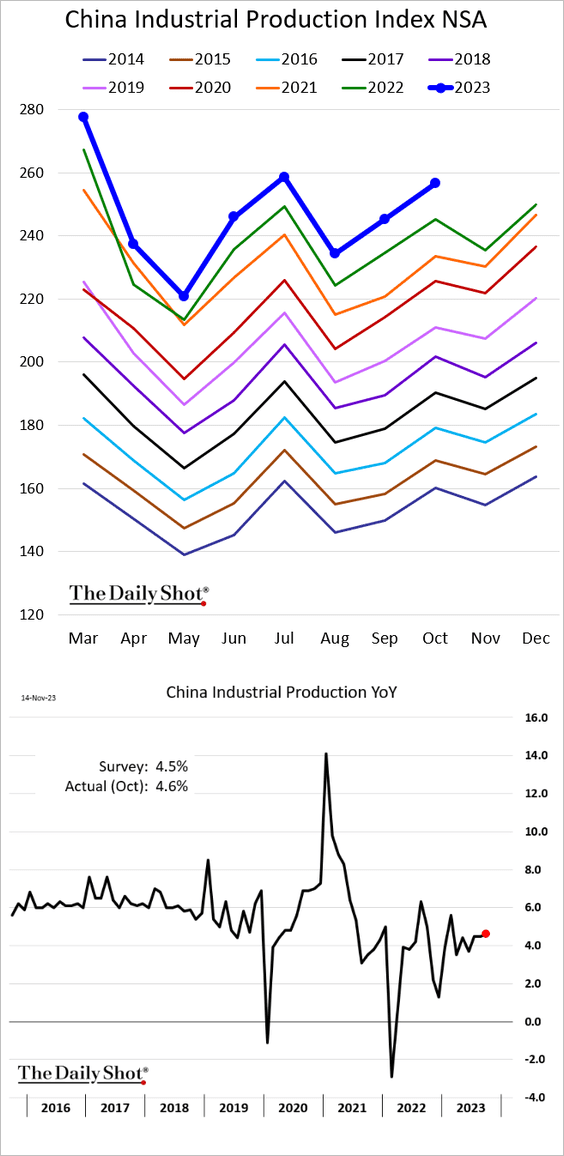
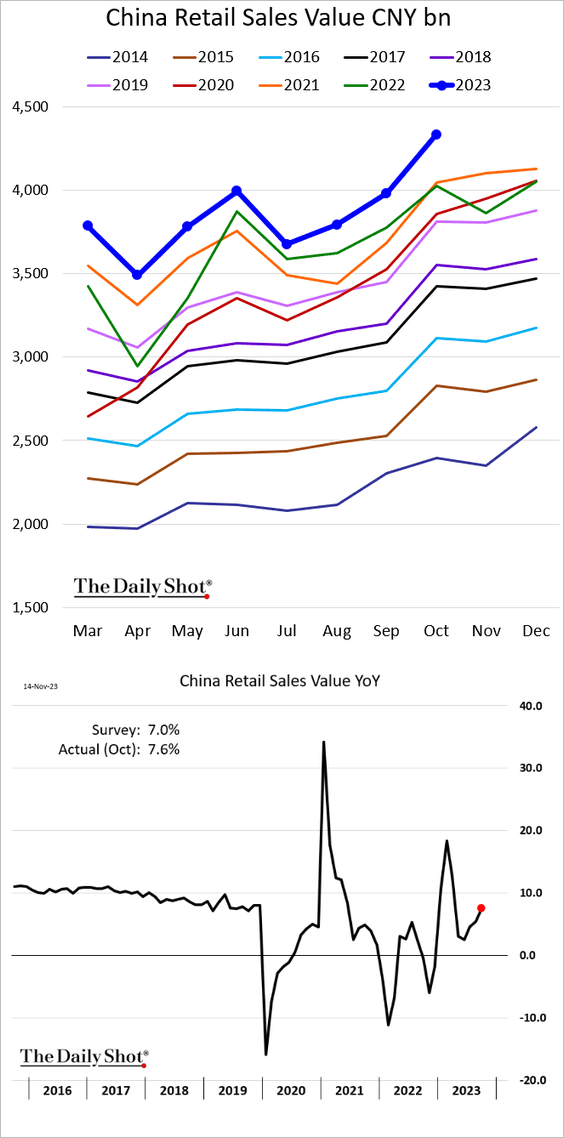
Real estate investment remains soft.
——————–
3. China-focused funds’ AUM has been declining.
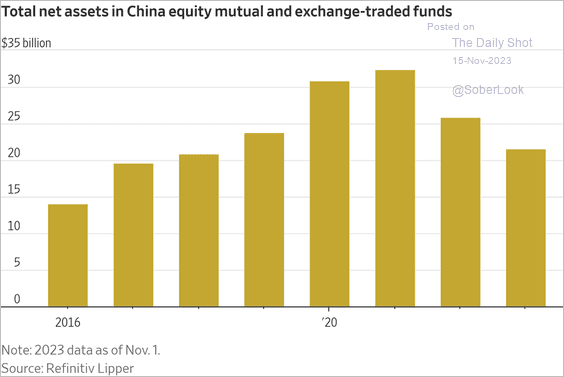 Source: @WSJ Read full article
Back to Index
Emerging Markets
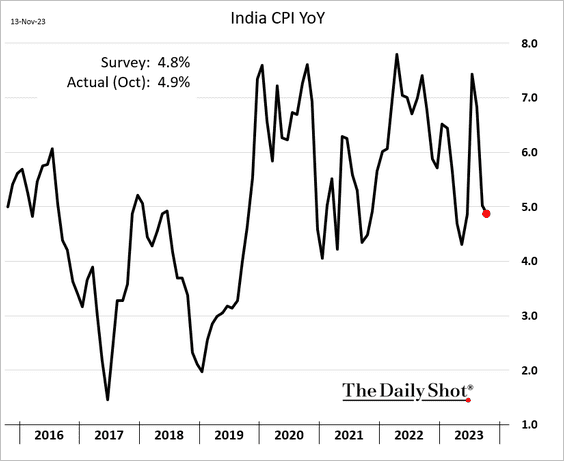
1. India’s CPI declined but was slightly above forecasts.
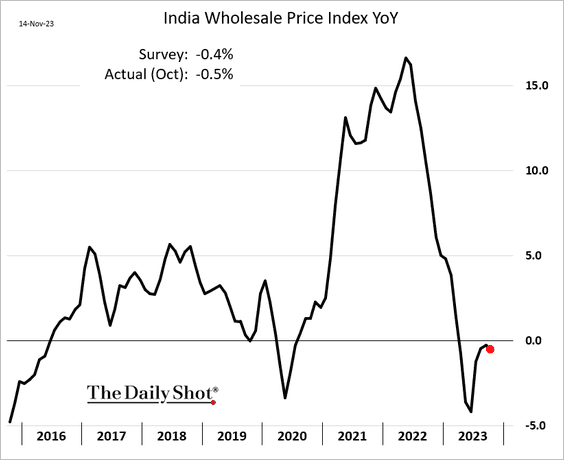
Wholesale prices continue to ease.
——————–
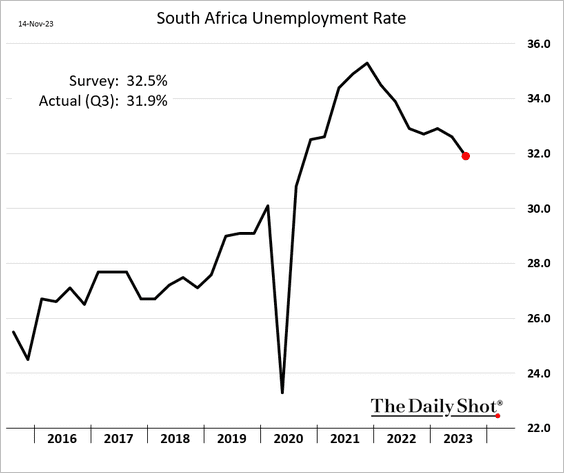
2. South Africa’s unemployment rate is trending lower.
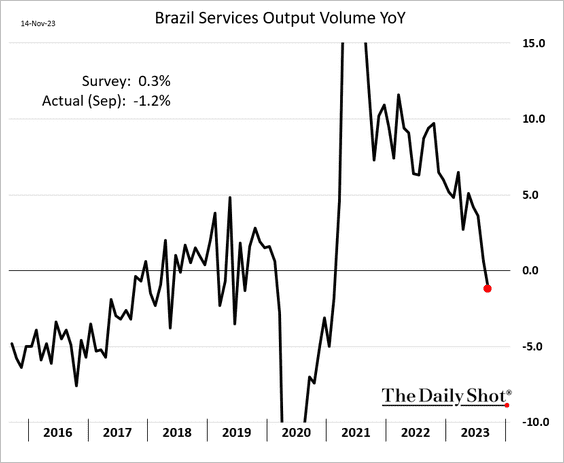
3. In September, Brazil registered its first year-over-year decline in services output since 2020.
Back to Index
Energy
1. This chart shows previous conflict-driven oil supply disruptions …
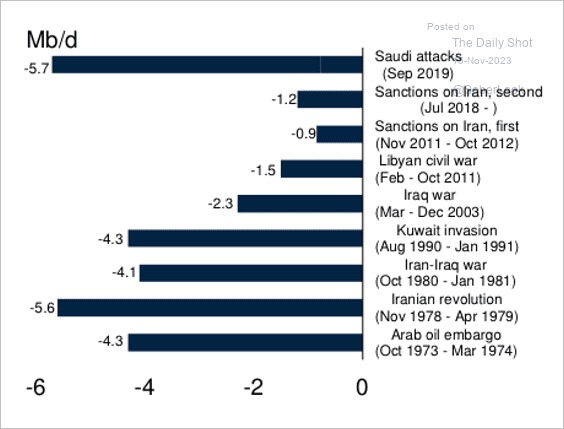 Source: World Bank Group
…and oil price volatility.
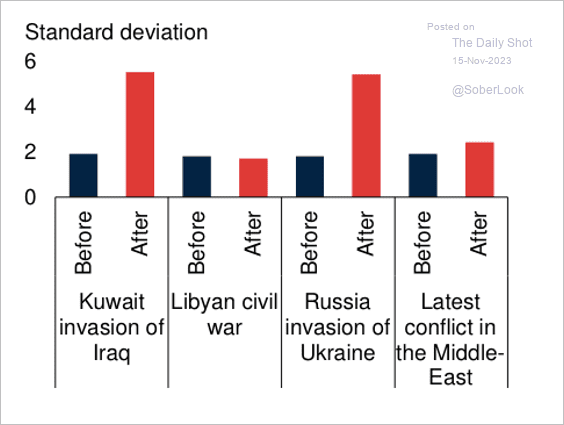 Source: World Bank Group
2. Here is a look at events that contributed to oil price moves over the past two years.
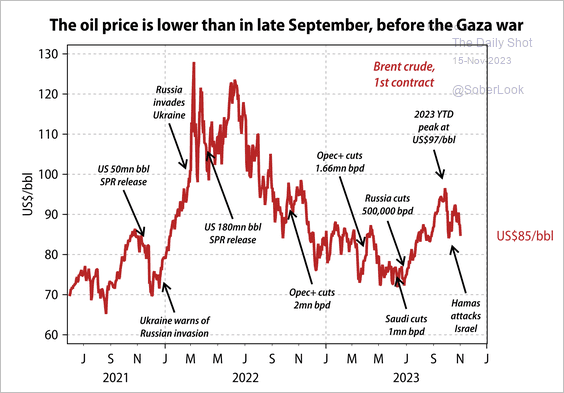 Source: Gavekal Research
Back to Index
Equities
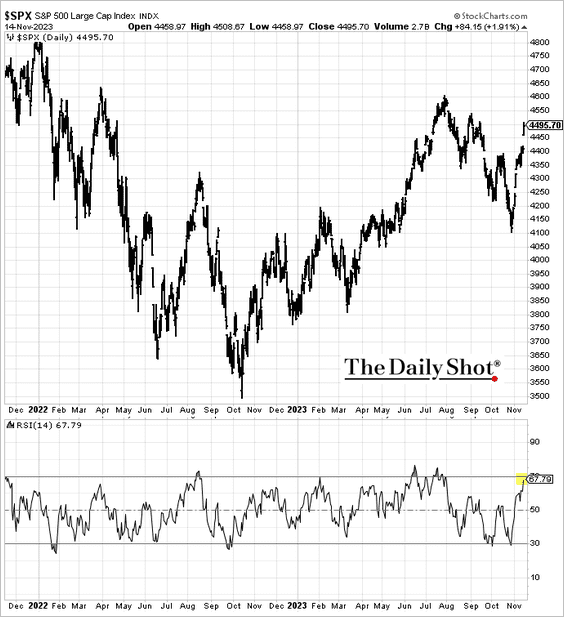
1. US indices are nearing overbought territory.
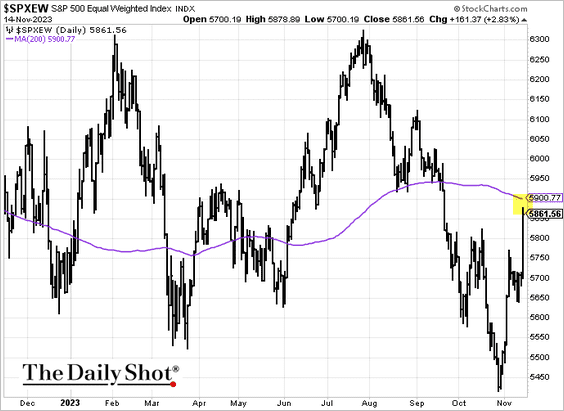
• The S&P 500 equal-weight index is approaching the 200-day moving average.
——————–
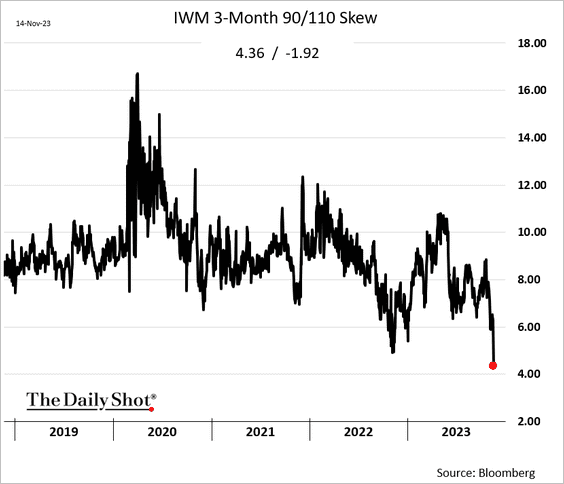
2. It was a very good day for small caps, both in absolute terms and relative to the S&P 500.
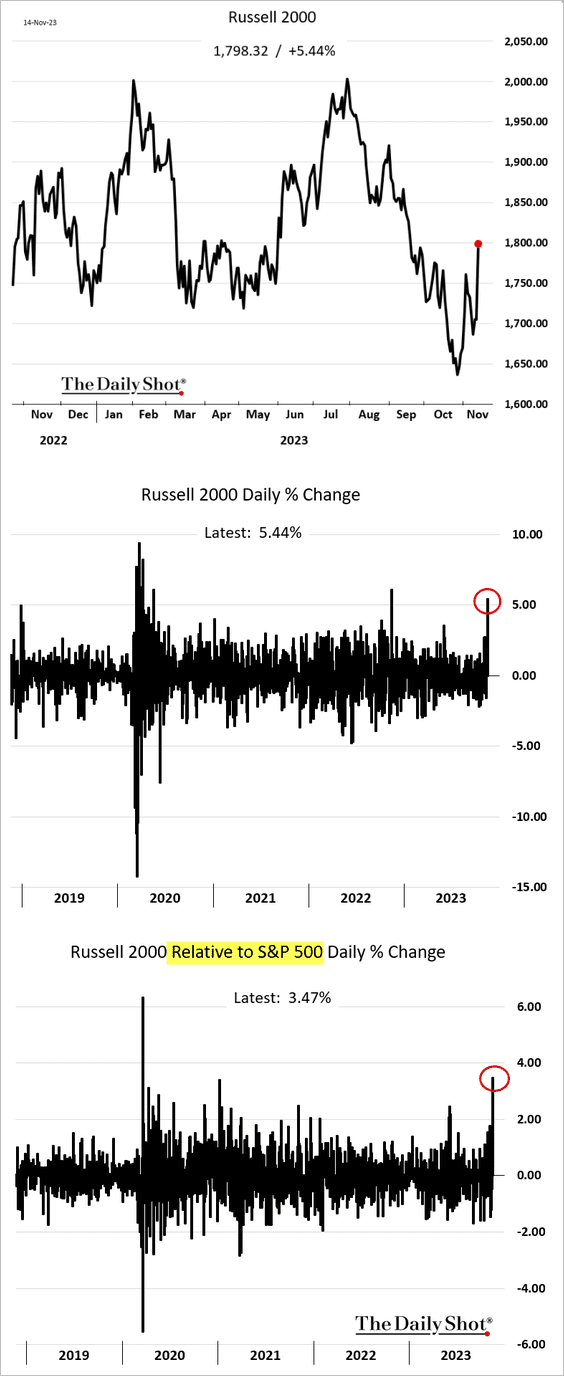
The Russell 2000 volatility skew tumbled.
——————–
3. The stock-bond correlation remains high, …
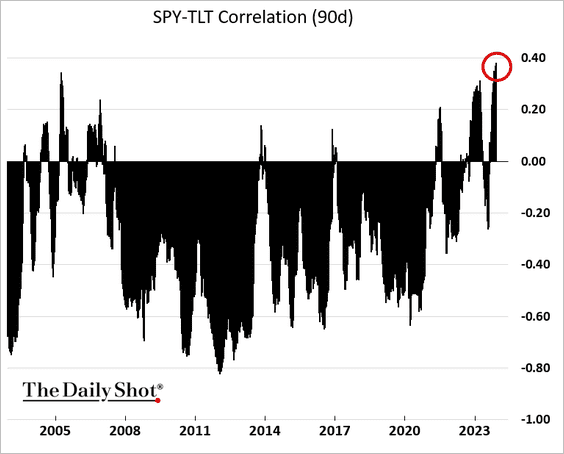
… which tends to be the case when inflation is elevated.
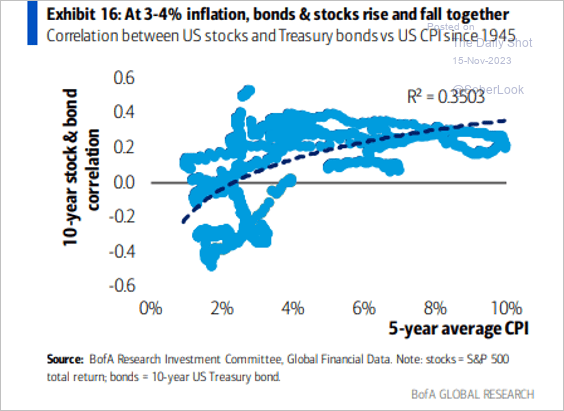 Source: BofA Global Research
——————–
4. Margins are expected to decline this quarter but rebound next year.
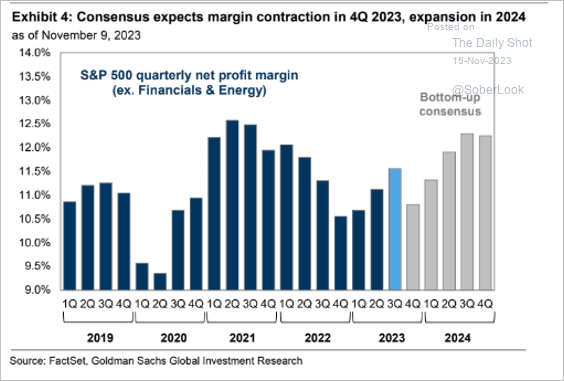 Source: Goldman Sachs; @MikeZaccardi
5. Fund managers are now overweight stocks.
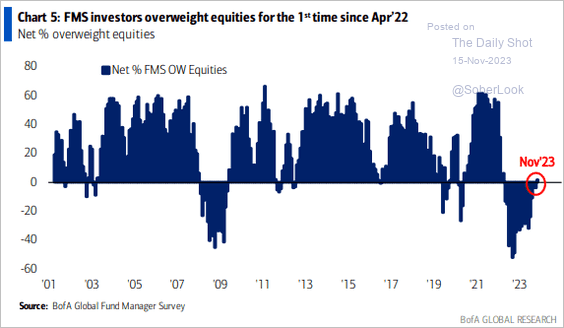 Source: BofA Global Research
6. Finally, this chart shows cumulative fund flows by sector.
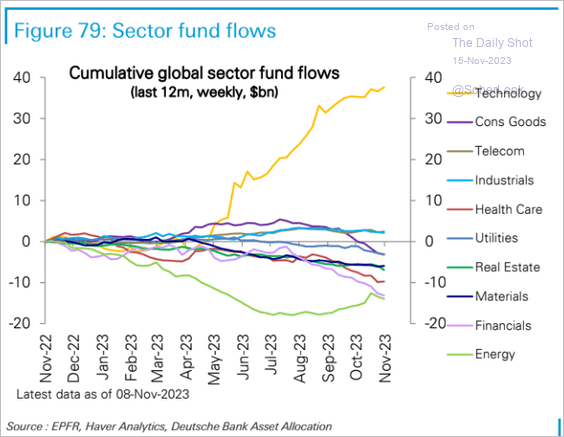 Source: Deutsche Bank Research
Back to Index
Credit
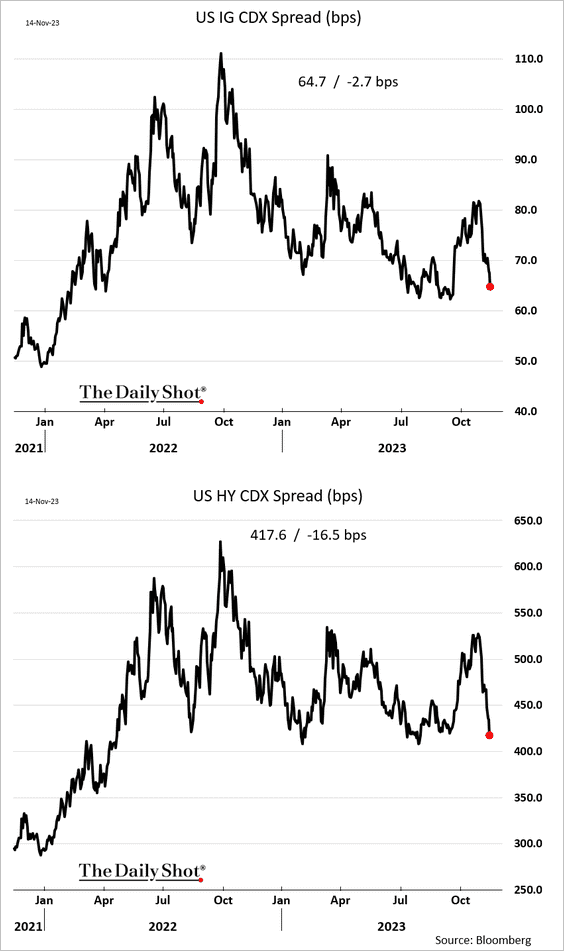
1. Credit spreads tightened further after the downside CPI surprise in the US.
2. The inverted Treasury yield curve has weighed on US bank margins.
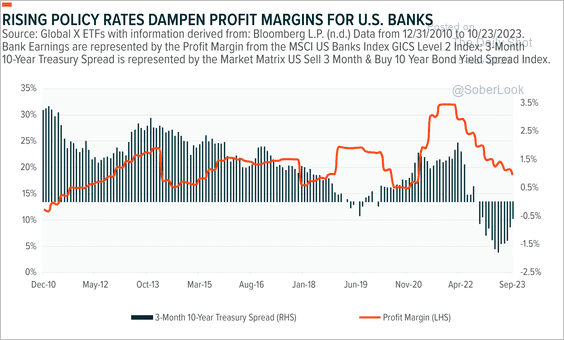 Source: Global X ETFs Read full article
3. Will corporate bonds keep outperforming Treasuries?
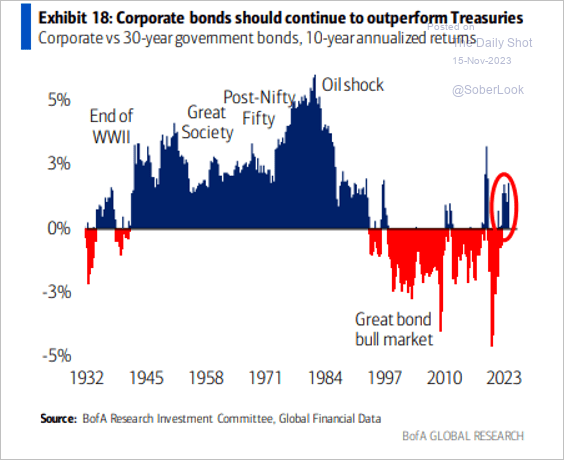 Source: BofA Global Research
4. Cat bonds continue to outperform.
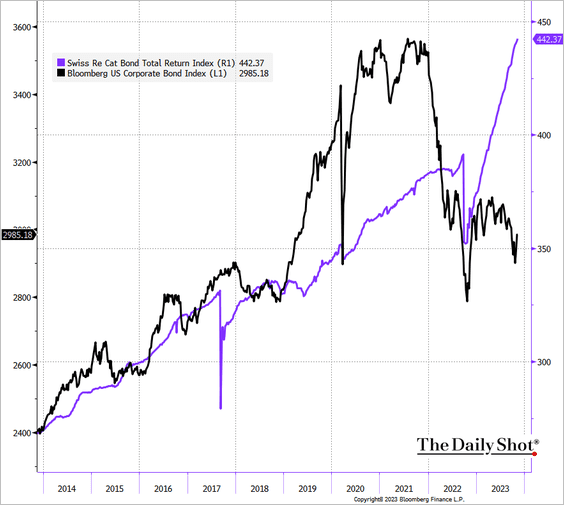 Source: @TheTerminal, Bloomberg Finance L.P.
Back to Index
Rates
1. There is a limit to the Fed’s QT. Cutting reserves too much will adversely impact money markets.
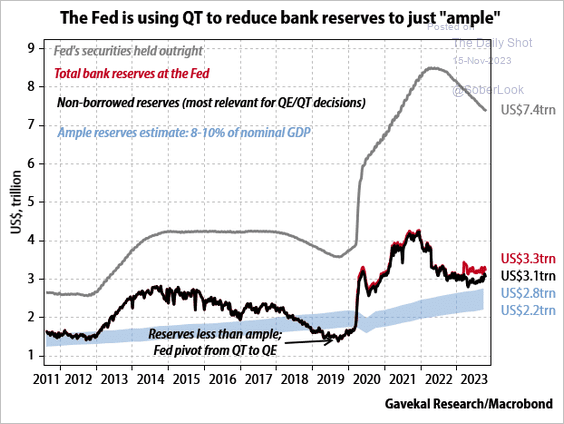 Source: Gavekal Research
2. Fund managers are overweight bonds.
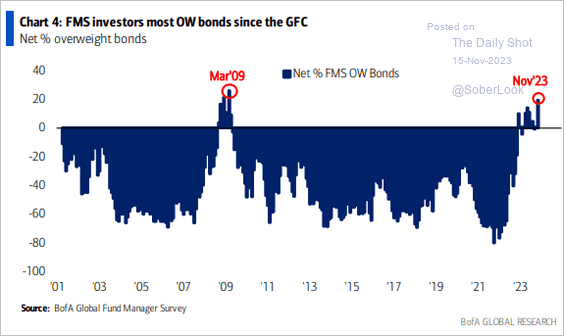 Source: BofA Global Research
——————–
Food for Thought
1. Confidence in US higher education:
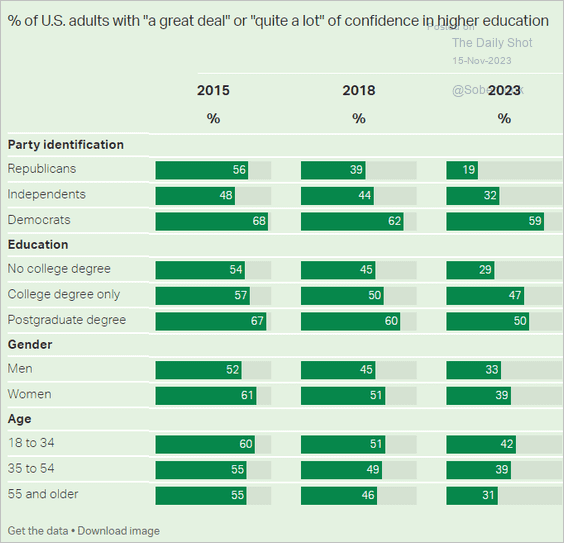 Source: Gallup Read full article
2. African military coup attempts:
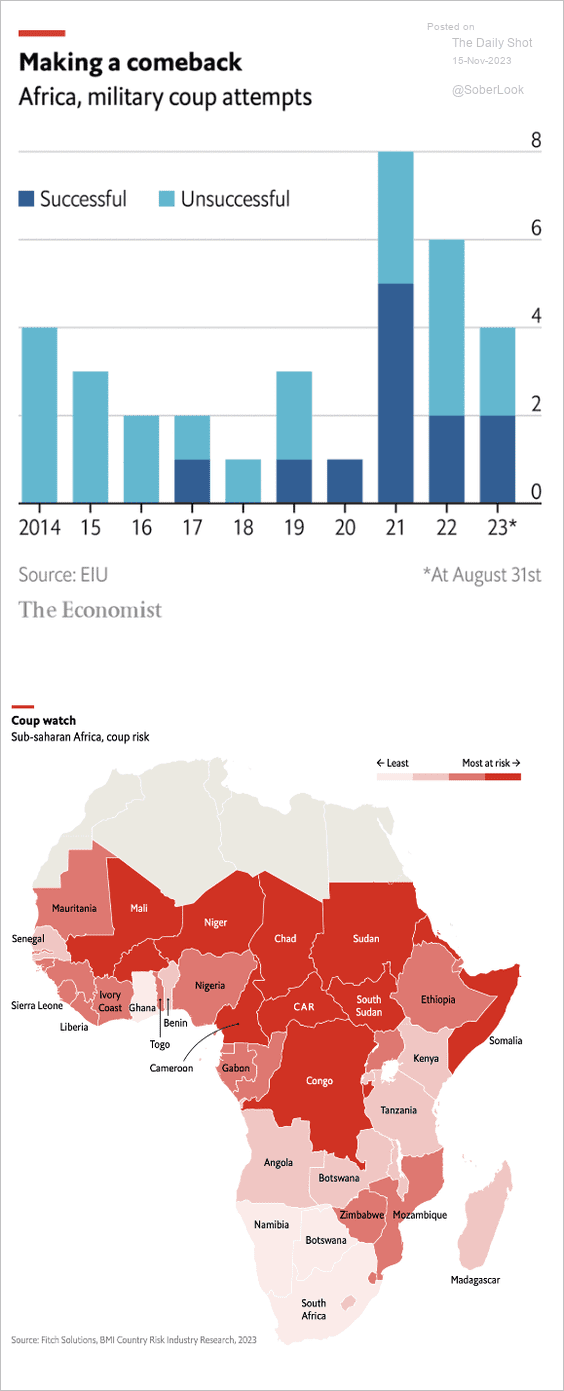 Source: The Economist Read full article
3. Traumatic brain injury deaths:
 Source: USAFacts
4. GOP presidential nomination probabilities in the betting markets:
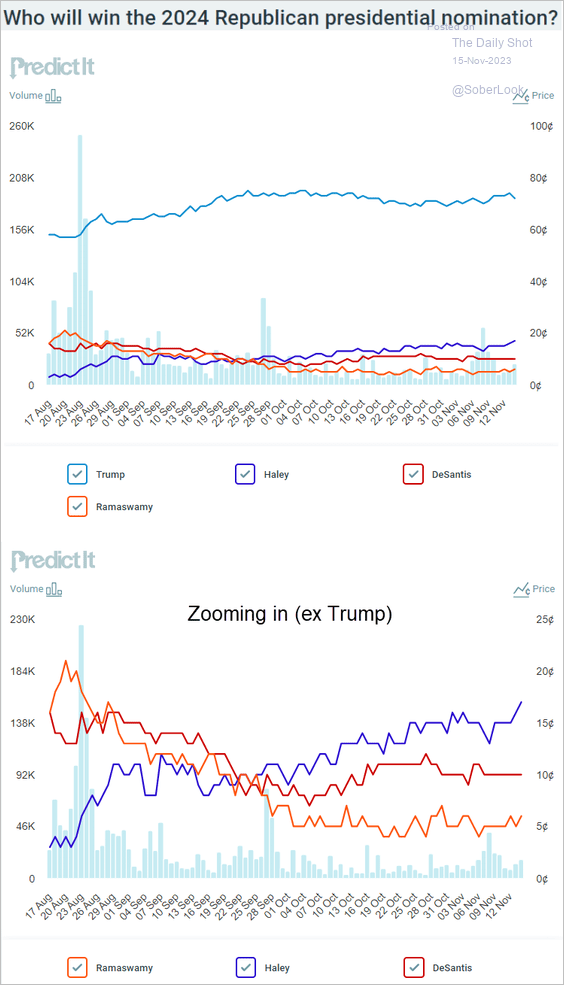 Source: @PredictIt
5. WFH rates:
 Source: @chartrdaily
6. What’s on holiday shoppers’ lists?
 Source: Gallup Read full article
——————–
Back to Index