
The Daily Shot: 04-Dec-23
• The United States
• Canada
• The United Kingdom
• The Eurozone
• Europe
• Japan
• Asia-Pacific
• Emerging Markets
• Cryptocurrency
• Commodities
• Energy
• Equities
• Alternatives
• Credit
• Rates
• Global Developments
• Food for Thought
The United States
1. Despite Chair Powell’s pushback, the market now sees some 130 bps of rate cuts in 2024.
 Source: @financialtimes Read full article

• Are traders too optimistic about next year’s monetary easing?

• Here is the 2-year Treasury yield.

2. Financial conditions eased sharply in November. Is the surge in market optimism overdone?

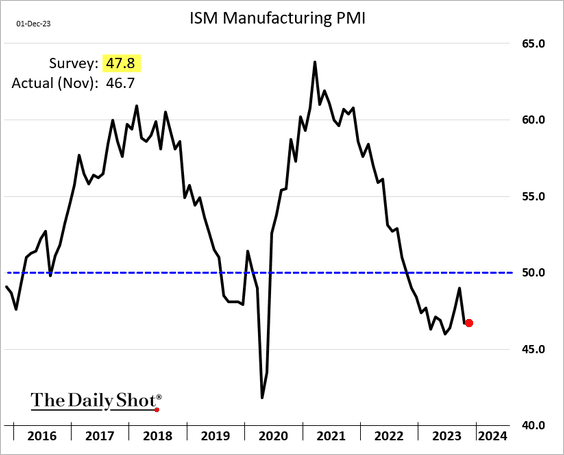
3. The ISM Manufacturing PMI surprised to the downside, …
 Source: Reuters Read full article
… with US factory activity now contracting for thirteen consecutive months.

• All ISM PMI components were below 50 last month.
 Source: @TheTerminal, Bloomberg Finance L.P.
• The decline in new orders was smaller than expected.

But the contraction in export orders intensified in November.

• Manufacturing staff reductions were worse than forecast.

• Input prices unexpectedly stopped falling in November.

Despite the persistent ISM PMI weakness, leading indicators continue to signal improvement ahead.
– Orders-inventories spread:
 Source: @TheTerminal, Bloomberg Finance L.P.
– GS cyclicals vs. defensives stock prices:
 Source: @TheTerminal, Bloomberg Finance L.P.
– S&P 500 revenue surprises:
 Source: @TheTerminal, Bloomberg Finance L.P.
——————–
4. Construction spending topped forecasts in October, …

… boosted by residential construction.
 Source: Chart and data provided by Macrobond
• Public construction spending is up 16% from last year.

——————–
5. Automobile sales were a bit softer than expected last month.

 Source: MarketWatch Read full article
——————–
6. Economy-wide corporate profits (including non-public companies) strengthened in Q3.
 Source: Wells Fargo Securities
• Business applications remain elevated.
 Source: @JustinWolfers
• Many larger businesses were able to lock in low interest rates after the initial COVID shock.
 Source: @Markzandi
• The outlook for CapEx growth continues to weaken.
 Source: BofA Global Research
Back to Index
Canada
1. The November employment report was relatively strong, with 60k full-time jobs created.

• But the unemployment rate increased.

 Source: @economics Read full article
• Employee hours declined.

• The labor force participation rate held steady.

• Wage growth remains elevated.

——————–
2. The November PMI report showed a faster contraction in factory activity.

Back to Index
The United Kingdom
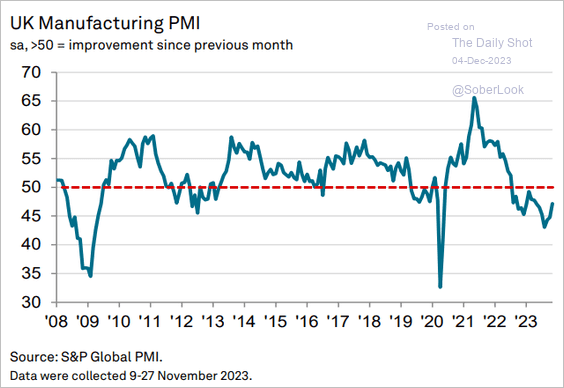
1. The final manufacturing PMI figure for November was a bit firmer than the flash report but remained in contraction territory.
 Source: S&P Global PMI
2. Home prices unexpectedly increased for the third month in a row.

Back to Index
The Eurozone
1. The final manufacturing PMI figure was a touch firmer than the flash report.
 Source: S&P Global PMI
Here are some of the PMIs that were not in the flash report.
• The Netherlands:
 Source: S&P Global PMI
• Spain:
 Source: S&P Global PMI
• Italy:
 Source: S&P Global PMI
——————–
2. Germany’s retail sales climbed from the recent lows.

3. Recent Eurozone inflation figures may already be below the ECB’s target of 2%, which could raise the odds of an ECB rate cut as soon as Q1, according to Deutsche Bank. (2 charts)
 Source: Deutsche Bank Research
 Source: Deutsche Bank Research
——————–
4. After the pullback from the high (due to softer-than-expected inflation), EUR/USD held support at the 200-day moving average.
 Source: barchart.com
Back to Index
Europe
1. Let’s run through some manufacturing PMI reports.
• Sweden (stabilizing):

• Norway (no longer declining):

• Poland (slower contraction):
 Source: S&P Global PMI
• The Czech Republic (ongoing contraction):
 Source: S&P Global PMI
——————–
2. Q3 was a tough quarter for the Czech Republic’s economy.

3. The Swiss franc surged last week amid diverging rate expectations.


The Swiss franc trade-weighted index is near record highs.

——————–
• Here is a look at the EU trade in green energy products.
 Source: Eurostat Read full article
Back to Index
Japan
1. Dollar-yen is holding the uptrend support.
 Source: barchart.com
• Hedge funds are boosting bets against the yen.

——————–
2. Goldman expects further gains for Japanese stocks next year.
 Source: Goldman Sachs
Back to Index
Asia-Pacific
1. Singapore’s factory activity has gradually returned to growth mode.

2. Next, we have some updates on Australia.
• Inflation continues to ease.

• Job openings declined sharply in November.

 Source: @WSJ Read full article
——————–
• Mortgage lending topped expectations in October.

Back to Index
Emerging Markets
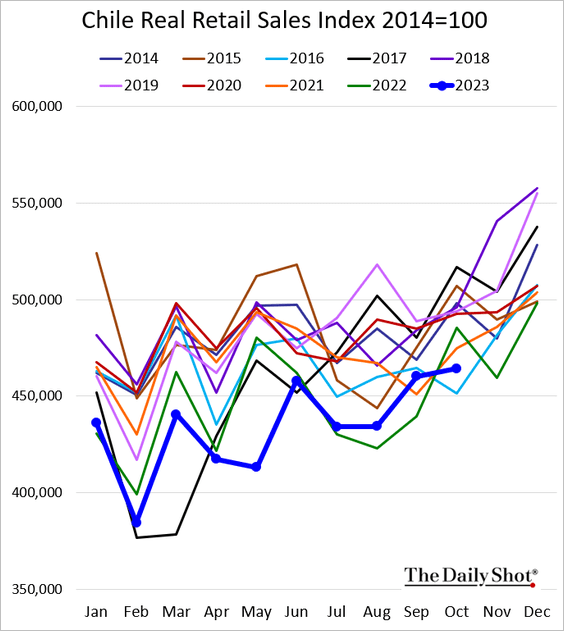
1. Let’s begin with some updates on Chile.
• Manufacturing output (large upside surprise):

• Copper production (below last year’s levels):

• Year-over-year changes in economic activity (soft):

• Business confidence (lower in November):

• Retail sales:
——————–
2. Next, let’s run through some key manufacturing PMI trends.
• Brazil (close to stabilizing):
 Source: S&P Global PMI
• Mexico (improving growth):
 Source: S&P Global PMI
• South Africa (slower declines):

• Turkey (accelerating contraction):

——————–
3. Brazil’s trade surplus remained elevated last month but was below forecasts, …

… due to softer than expected exports.

• Brazil’s industrial production was roughly unchanged in October.

• The unemployment rate continues to drop.

——————–
4. Thai exports hit a record high for this time of the year.

Industrial production remains soft.

——————–
5. Indonesia’s core inflation is back below 2%.

6. Turkey’s Q3 GDP growth topped forecasts.

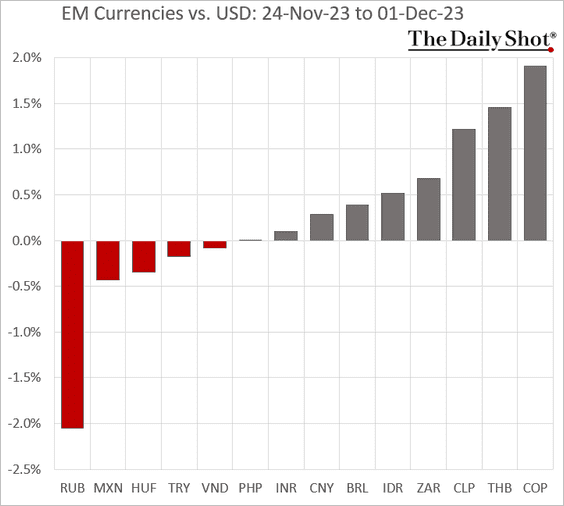
7. Next, we have some performance data from last week.
• Currencies:
• Bond yields:

• Equity ETFs:

Back to Index
Cryptocurrency
1. Bitcoin blasted past 41k as risk appetite (and the Reddit crowd) returns.

• Here is last week’s performance.

2. Ether has the highest correlation to stocks among the most liquid cryptos. Bitcoin is more correlated to gold.

Back to Index
Commodities
1. Gold hit a record high.

 Source: Reuters Read full article
• Gold mining stocks have significantly underperformed the gold commodity price.
 Source: SentimenTrader
——————–
2. Sugar prices declined again on Friday.

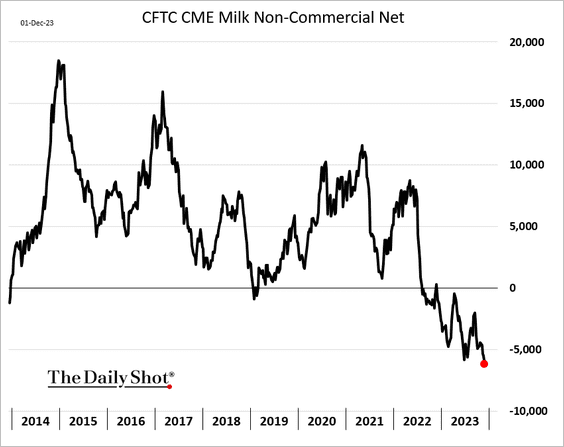
3. Speculative accounts are boosting their bets against wheat and corn futures.


• Bets against milk futures are hitting extreme levels.
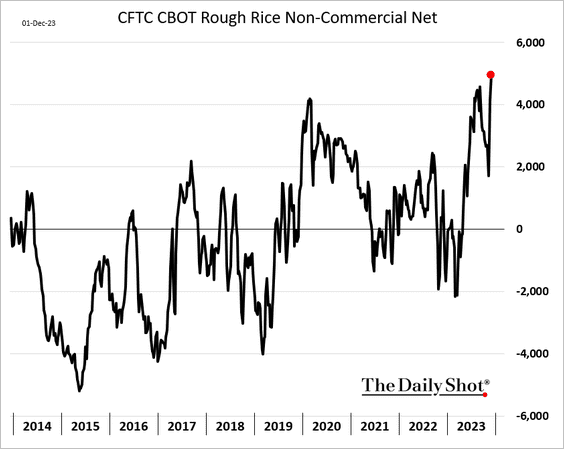
• Speculators have increased their bets on rice futures.
——————–
4. Here is a look at last week’s performance across key commodity markets.

Back to Index
Energy
1. Crude oil is softer despite tensions in the Middle East.

 Source: NPR Read full article
——————–
2. US natural gas prices continue to sink, …

… amid warmer-than-normal weather conditions and elevated inventories in storage.

 Source: NOAA
Back to Index
Equities
1. The stock market is showing signs of froth.
• The Dow is up for five weeks in a row.

• The rally looks increasingly stretched.
 Source: barchart.com
• Retail investors are very bullish.

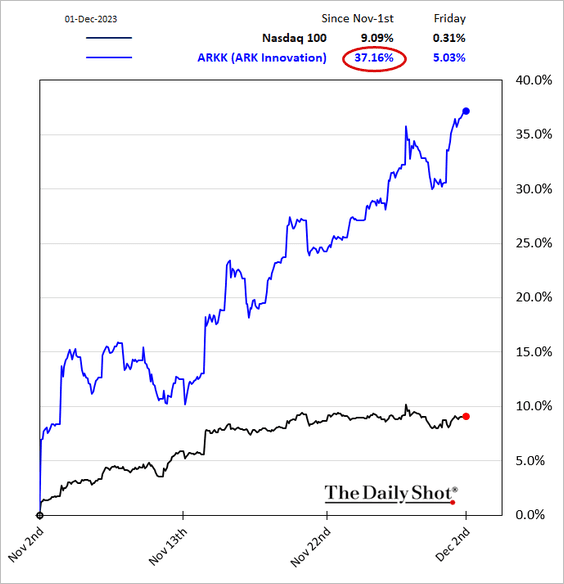
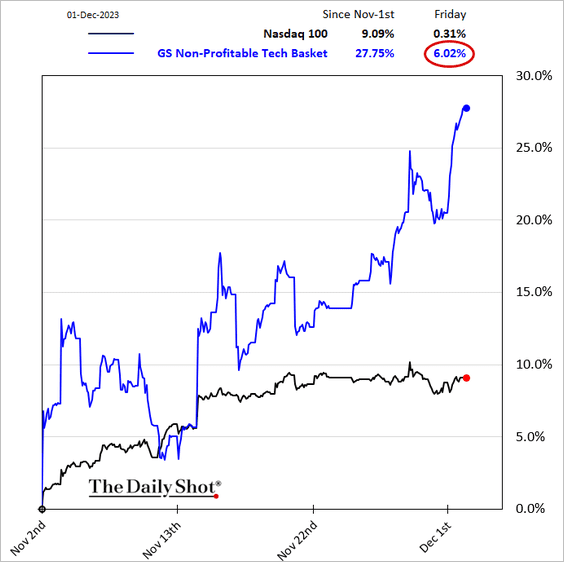
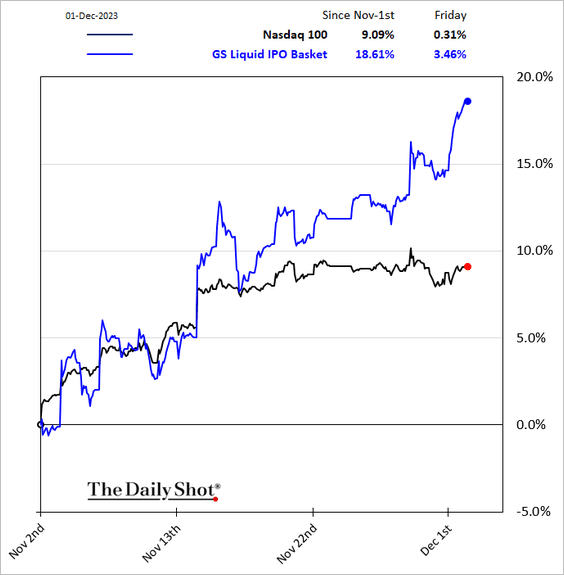
• Speculative stocks (and other assets such as crypto) have been surging as the Reddit crowd returns.
– Meme stocks and retail favorites:


– ARK Innovation ETF:
– Non-profitable tech:
– Most-shorted tech stocks:

– Post-IPO stocks:
——————–
2. Here are a couple of additional trends over the past month.
• Long- vs. short-duration stocks:

• Companies known for share buybacks:

——————–
3. The rally has broadened.
• The percentage of S&P 500 stocks trading above their 200-day moving average:

• The equal-weight index:

• Small caps:

——————–
4. Investors are nervous about the small-cap outperformance. The Russell 2000 implied volatility index (RVX) has not been following VIX lower.
 Source: @TheTerminal, Bloomberg Finance L.P.

——————–
5. The VIX/MOVE ratio (equities vs. rates implied vol) is near multi-year lows.

6. Historically, the best environment for the S&P 500 is when yields are falling, driven by declining term premiums.
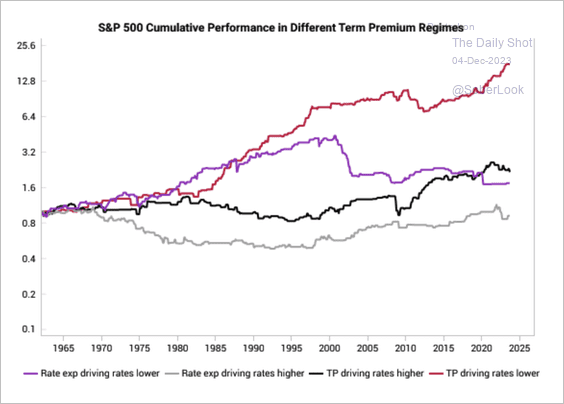 Source: Variant Perception
A trough in US leading indicators could coincide with a decline in term premium and potentially benefit equities.
 Source: Variant Perception
——————–
7. The popularity of anti-obesity drugs contributed to an extremely narrow healthcare rally.
 Source: Citi Private Bank
Healthcare positioning and fund flows have been very bearish (2 charts).
 Source: Deutsche Bank Research
 Source: Deutsche Bank Research
——————–
8. Valuations of most S&P 500 stocks (the equal-weight index), as well as mid- and small-caps, remain below the 10-year average (below the red line).
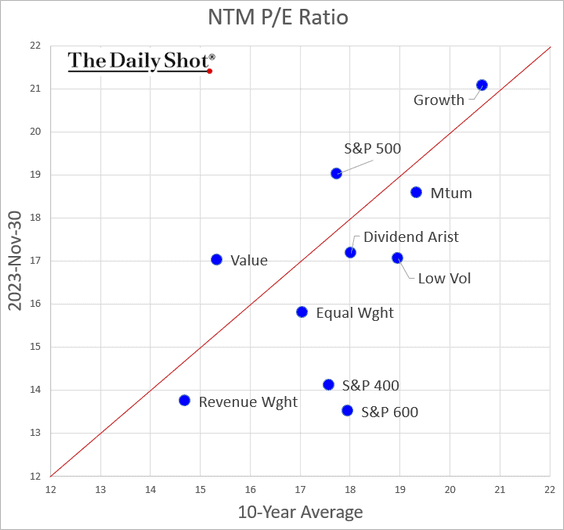
This chart shows forward P/E ratio changes for the month of November.

——————–
9. This year’s rally took strategists by surprise. The forecast below from a year ago shows the S&P 500 declining in 2023.
 Source: @markets; h/t @MikeZaccardi Read full article
10. Finally, we have some performance data from last week.
• Sectors:

• Equity factors:

• Macro basket pairs’ relative performance:

• Thematic ETFs:

• Largest US tech firms:

Back to Index
Alternatives
1. Let’s start with private equity activity through October.
![]() Source: S&P Global Market Intelligence
Source: S&P Global Market Intelligence
2. Here is a look at PE funds by size and strategy.
 Source: Bloomberg Private Equity Solutions
3. The current venture capital deal-making environment is deemed investor-friendly as capital demand increased significantly relative to the supply of capital, according to PitchBook. (2 charts)
 Source: PitchBook
 Source: PitchBook
——————–
4. December is usually a major month for startup deals.
 Source: Carta
5. Middlle-market LBO deal data shows an increase in equity multiples last quarter.
 Source: @theleadleft
6. The amount of private capital dry powder eased slightly last year.
 Source: PitchBook
7. Private debt assets continue to grow.
 Source: @markets Read full article
But fundraising was softer this year.
 Source: @theleadleft
Nonetheless, private credit has maintained its dominant share of total fundraising. Meanwhile, private equity’s share has declined from 23% to 16% over the past three months, according to PitchBook.
 Source: PitchBook
Back to Index
Credit
1. The volume of US leveraged loans maturing in the next two years is higher than in recent years, and half of that amount is in riskier debt.
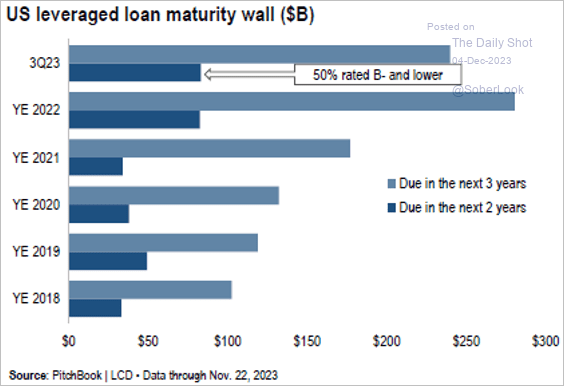 Source: PitchBook
2. Banks’ bond spreads remain elevated relative to the overall IG market.
 Source: @markets Read full article
3. Broad outlook for credit performance has been weak.
 Source: JP Morgan Research; @WallStJesus
4. Middle-market CLO activity hit a record high this year.
 Source: Deutsche Bank Research
5. Finally, we have some performance data from last week.

Back to Index
Rates
1. The 2-year Treasury note is holding long-term support with improving momentum.
 Source: Aazan Habib, Paradigm Capital
2. The large net-long position among primary dealers reflects a material inventory of Treasuries on their balance sheets. According to Moody’s, primary dealers have less balance sheet capacity to act as market makers in the event of a volatile shock.
 Source: Moody’s Investors Service
3. Larger yield curve shifts into inversion tend to precede deeper recessions.
 Source: Simon White, Bloomberg Markets Live Blog
Back to Index
Global Developments
1. Rate cuts are accelerating, driven by EM central banks.
 Source: Bank of America Institute
2. November was a strong month for both stocks and bonds, while oil ended lower.
 Source: Deutsche Bank Research
3. The global stock/bond ratio uptrend is intact.
 Source: MRB Partners
4. Next, we have some DM performance data from last week.
• Currencies:

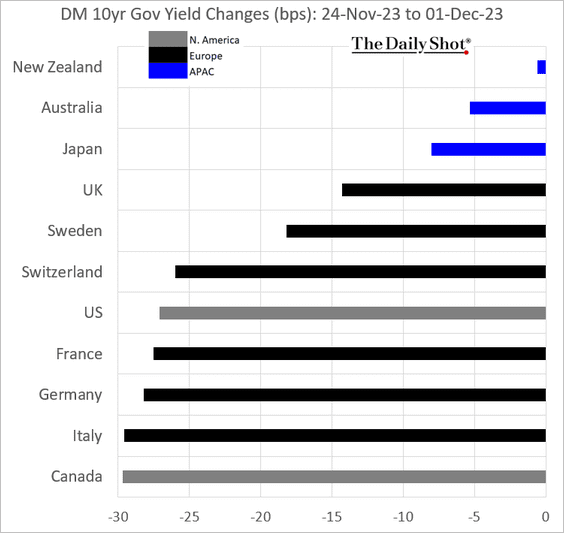
• Bond yields:
• Equities (European stocks outperformed):

——————–
Food for Thought
1. Consumer views on competition in various industries:
 Source: YouGov Read full article
2. Global EV Penetration:
 Source: Goldman Sachs
3. Largest US privately-held companies:
 Source: Statista
4. In the US, deaths are expected to outnumber births by 2040.
 Source: @WSJ Read full article
5. Median age by state:
 Source: @TheDailyShot
6. The United States educates foreign engineers and scientists, but many are compelled to depart, leaving the nation grappling with significant shortages of skilled workers in the semiconductor industry.
 Source: SIA
7. Volcanic activity:
 Source: Statista
——————–
Back to Index