
The Daily Shot: 18-Dec-23
• The United States
• Canada
• The United Kingdom
• The Eurozone
• Europe
• Asia-Pacific
• China
• Emerging Markets
• Commodities
• Energy
• Equities
• Alternatives
• Credit
• Rates
• Global Developments
• Food for Thought
The United States
1. Fed officials pushed back on the markets’ aggressive rate cut projections.
• Bostic:
 Source: Reuters Read full article
• Goolsbee:
 Source: @economics Read full article
• Williams:
 Source: CNBC Read full article
Nonetheless, the market is still pricing in some 140 bps of rate cuts next year.

——————–
2. US manufacturing output climbed last month, spurred by the conclusion of the UAW strike.

Excluding vehicle production, US industrial output has been deteriorating over the past two years.

——————–
3. The NY Fed’s regional manufacturing index (the first such report of the month) dipped back into contraction territory this month.

• Staff reductions accelerated.

• Cost pressures have been easing.

——————–
4. At the national level, the US manufacturing PMI from S&P Global surprised to the downside amid soft demand.

However, service firms are reporting growth.


——————–
5. The Atlanta Fed’s wage growth tracker is holding above 5%.

6. Retail gasoline prices hit the lowest level since 2021.

7. The fiscal impulse is expected to be modestly negative next year.
 Source: Deutsche Bank Research
• In total, monetary and fiscal policies will be a drag on economic growth in 2024.
 Source: Oxford Economics
——————–
8. Mortgage rates are down sharply from the peak (2 charts).
 Source: Mortgage News Daily
 Source: @WSJ Read full article
Back to Index
Canada
1. Housing starts slowed sharply last month.

2. The sales-to-listings ratio signals further declines in home prices.
 Source: Scotiabank Economics
3. Capital Economics expects the household debt service ratio to keep rising.
 Source: Capital Economics
Back to Index
The United Kingdom
1. Manufacturing activity continued to contract this month.

But service firms are reporting stronger growth.

——————–
2. How do UK inflation measures compare to the Eurozone?
 Source: ING
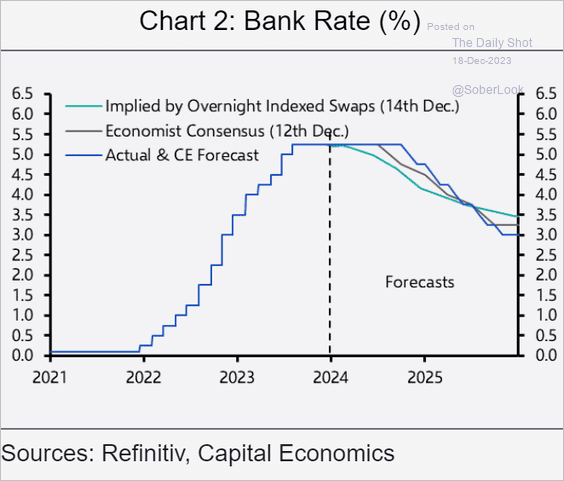
3. Capital Economics sees the BoE on hold longer than the Fed or the ECB due to elevated inflation. But once the BoE begins cutting rates, it will do so faster than the market expects.
 Source: Capital Economics
4. London’s property market looks frothy relative to NYC.
 Source: The Economist Read full article
Back to Index
The Eurozone
1. According to the S&P Global PMI report, business activity contraction persisted this month (surprising to the downside).
• Manufacturing:
– Germany:

– France:

• Services:
– Germany:

– France:

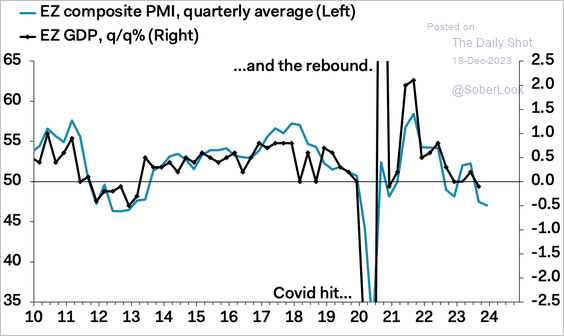
The euro-area composite PMI index is firmly in contraction territory, …
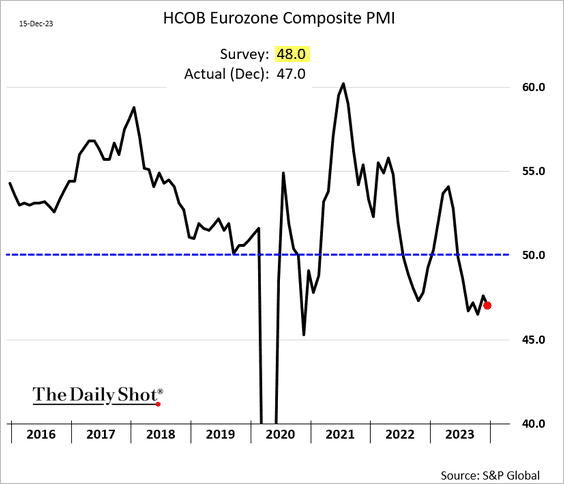
… signaling a recession.
 Source: Pantheon Macroeconomics
 Source: Reuters Read full article
——————–
2. Despite the ECB’s pushback, the market is pricing in deep rate cuts ahead (3 charts).


Euro-area bond yields keep moving lower.

Here is the Bund curve.

——————–
3. Barclays sees a faster inflation path toward the 2% target than the ECB.
 Source: Barclays Research
• Longer-term market-based inflation expectations have been sinking.

Back to Index
Europe
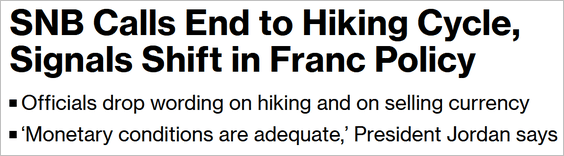
1. The SNB is done with monetary tightening.
 Source: @economics Read full article
• Is the unprecedented contraction in the SNB’s currency holdings finally over?

• The Swiss central bank shifted its inflation forecast lower.
 Source: Pantheon Macroeconomics
• Swiss bond yields have been falling.

——————–
2. The Norwegian krone had a good week as the central bank surprised with a rate hike.


——————–
3. Rent or own?
 Source: Eurostat Read full article
Back to Index
Asia-Pacific
1. Taiwan’s housing market affordability continues to deteriorate.
 Source: @ANZ_Research
2. Singapore’s home sales rebounded last month.
 Source: @markets Read full article
3. Next, we have some updates on Australia.
• A breakout for the Aussie dollar?

• Bond yields continue to sink.

• The PMI report showed an ongoing contraction in manufacturing and services this month.

• Australia’s housing market is expected to keep outperforming.
 Source: Fitch Ratings
• Australia’s net immigration growth is above the pre-COVID average but may be near a peak. (2 charts)
 Source: @ShaneOliverAMP
 Source: @ShaneOliverAMP
Back to Index
China
1. Is China’s stock market close to reaching a trough?

Valuation discounts to global peers are growing.
 Source: Capital Economics
——————–
2. USD/CNY is at the 200-day moving average.
 Source: @TheTerminal, Bloomberg Finance L.P.
3. Private equity funds are giving up on China.
 Source: @WSJ Read full article
Back to Index
Emerging Markets
1. Economists continue to upgrade their forecasts for India’s GDP growth.

Indian exports have been holding steady (slightly below last year’s levels).

——————–
2. Brazil’s services output has been slowing.

3. Economists have been downgrading their projections for Colombia’s economic growth while boosting estimates for the nation’s CPI next year.

4. BofA’s private clients have been dumping EM debt.
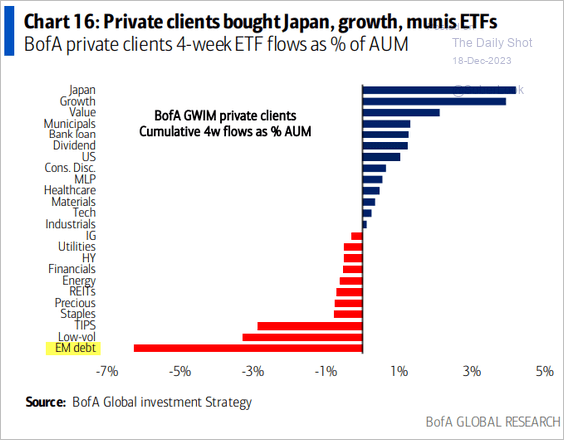 Source: BofA Global Research
5. Next, we have some performance data from last week.
• Currencies:

• Bond yields:

• Equity ETFs:

Back to Index
Commodities
1. The copper market is expected to be in surplus next year.
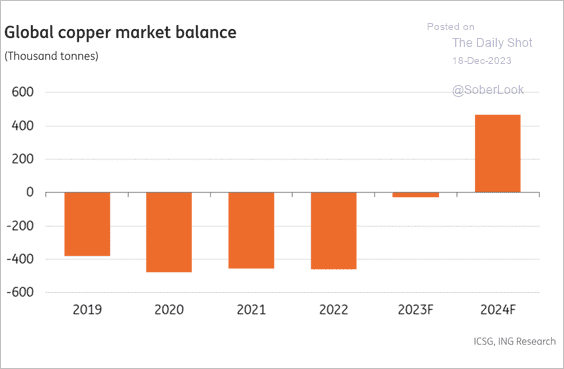 Source: ING
2. China accelerated metal ore imports this year.
 Source: Capital Economics
3. It’s been a good year for softs.
 Source: @business Read full article
4. Which markets are least correlated to broad movements across global commodities?
 Source: Simon White, Bloomberg Markets Live Blog
5. Historically, commodity bull markets have occurred alongside weak real S&P 500 returns.
 Source: Stifel
6. Finally, we have last week’s performance data across key commodity markets.

Back to Index
Energy
1. Brent is holding support at the 200-week moving average.
 Source: @TheTerminal, Bloomberg Finance L.P.
2. Indicators of US fracking activity have been soft.
• Rig count:

• Frac spread:

And yet, US production has been surprising to the upside.
 Source: @markets Read full article
——————–
3. Will OPEC ramp up production next year?
 Source: Capital Economics
4. The spread between premium and regular US gasoline keeps rising.
 Source: @axios Read full article
5. US natural gas storage levels are at the upper end of the five-year range.

Back to Index
Equities
1. The Dow and the S&P 500 marked their seventh consecutive weekly gain.

• Many stocks hit their 52-week highs last week.

• 46% of S&P 500 members are overbought, the most in decades.
 Source: @Marlin_Capital
——————–
2. Roughly 48% of Russell 2000 stocks made a 63-day high, reaching the fifth-highest level in history.
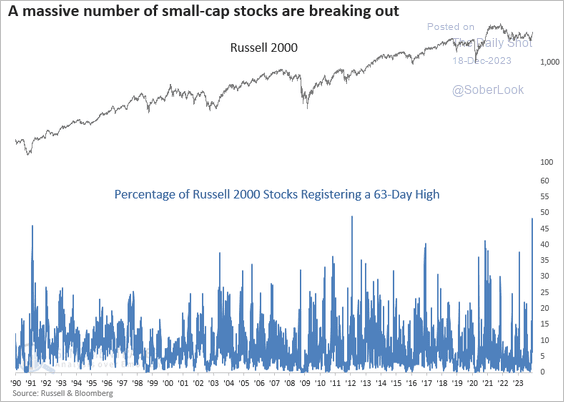 Source: SentimenTrader
Will we see a breakout in the Russell 2000?

——————–
3. Risk appetite keeps rising.
 Source: Longview Economics
• Retail investors haven’t been this optimistic since 2021. There are not a lot of bearish investors left (2nd panel).

• Call option trading surged last week.
 Source: @WSJ Read full article
——————–
4. Fund flows remain strong.
 Source: BofA Global Research; @dailychartbook
5. US growth stocks appear stretched versus value stocks, which may point to a decade of weak relative returns.
 Source: Stifel
6. Here is a look at tech mega-cap valuations relative to the past ten years.
 Source: Macrobond
7. Finally, we have some performance data from last week.
• Sectors:

• Equity factors:

Here are a couple of factor trends that got a boost from the Fed’s “pivot.”
– Buyback:

– Dividend growers:

• Macro basket pairs’ relative performance:

• Thematic ETFs:

• Largest US tech firms:

Back to Index
Alternatives
1. PE/VC activity slowed in November.
 Source: S&P Global Market Intelligence
2. Venture exit values have increased, although with greater dispersion since 2011. (2 charts)
 Source: Santé
 Source: Santé
• The rise in exit values is partly driven by the emergence of mega-rounds.
 Source: Santé
——————–
3. Silicon Valley continues to attract the most venture funding than other US regions.
 Source: Carta
4. This chart compares public and private markets.
 Source: Torsten Slok, Apollo
5. Private credit dry powder surged this year.
 Source: BofA Global Research; @MikeZaccardi
6. Finally, we have total private assets under management over time.
 Source: @financialtimes Read full article
Back to Index
Credit
1. Downgrades continue to outnumber upgrades at lower rating levels.
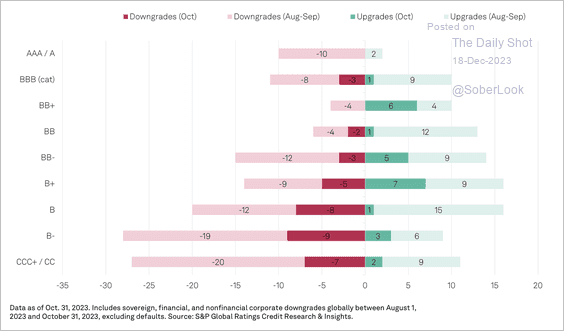 Source: S&P Global Ratings
Consumer products continue to lead downgrades this year.
 Source: S&P Global Ratings
——————–
2. This chart shows how much an average US borrower with negative equity is underwater on a car loan.
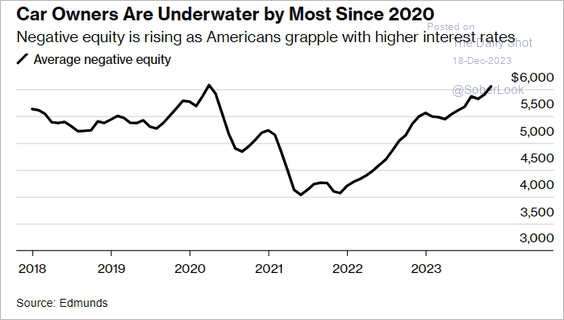 Source: @wealth Read full article
3. Smaller US banks increasingly tap brokered deposits, which tend to be “hot money” (not stable).
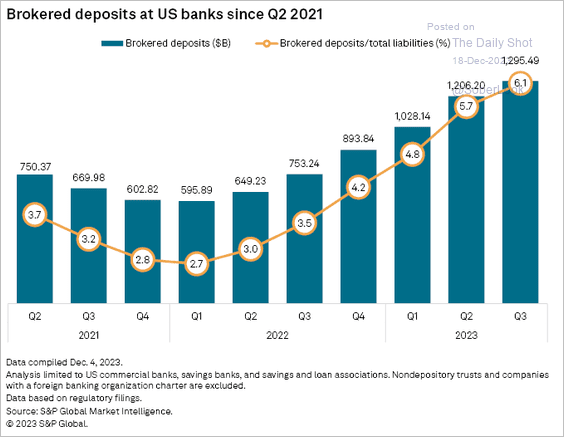 Source: S&P Global Market Intelligence
4. European collateralized loan obligation (CLO) new issuance looks set to match 2022 levels.
 Source: PitchBook
• Most market participants believe the European leveraged loan market is near a cycle low, according to a survey by PitchBook.
 Source: PitchBook
——————–
5. Finally, we have some performance data from last week.

Back to Index
Rates
1. The 30-year Treasury yield is now well below its 200-day moving average.
 Source: @TheTerminal, Bloomberg Finance L.P.
2. Deutsche Bank sees “the Fed phasing out QT in Q3 as it cuts rates to actively ease the policy stance.”
 Source: Deutsche Bank Research
• First rate cut in May?
 Source: Commerzbank Research
——————–
3. Deutsche Bank’s models point to a higher expected US long-run neutral rate than surveys do.
 Source: Deutsche Bank Research
• US real rates have only recently turned positive and are not yet at restrictive levels by historical standards.
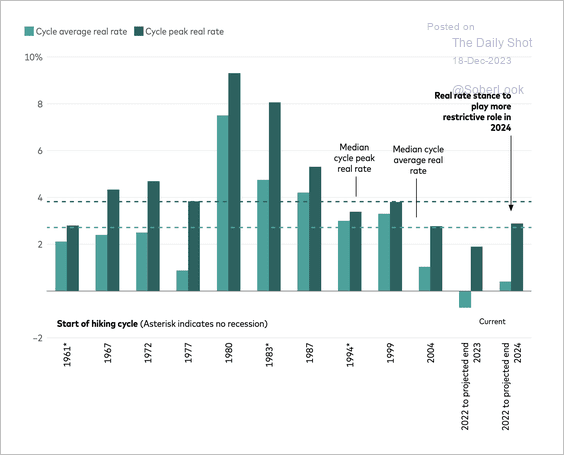 Source: Vanguard Read full article
Back to Index
Global Developments
1. Speculative accounts have turned bearish on the US dollar.

2. Here is a look at COVID-era real wage growth in select economies.
 Source: @MichaelAArouet
3. How much will global growth slow next year? (Oxford Economics vs. consensus estimates)
 Source: Oxford Economics
4. Finally, we have some performance data from last week.
• Currencies:

• Bond yields:

• Equities:

——————–
Food for Thought
1. Remote and hybrid job postings:
 Source: Indeed Hiring Lab
2. NYC homeless shelter population:
 Source: City Limits
• Homelessness in the US:
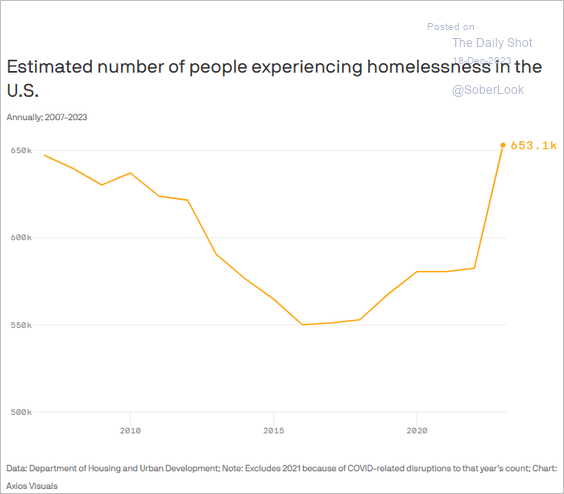 Source: @axios Read full article
——————–
3. How late into pregnancy is abortion allowed?
 Source: @axios Read full article
4. Foreign-born US veterans:
 Source: Statista
5. The Global Innovation Index:
 Source: Visual Capitalist Read full article
6. Salary needed to feel happy:
 Source: @WSJ Read full article
——————–
Back to Index