The Daily Shot: 21-Dec-23
• The United States
• The United Kingdom
• The Eurozone
• Europe
• Japan
• Asia-Pacific
• China
• Emerging Markets
• Commodities
• Energy
• Equities
• Credit
• Rates
• Food for Thought
The Daily Shot will not be published next week (from December 25th to January 1st).
The United States
1. Consumer confidence jumped this month, boosted by the stock market rally and cheaper gasoline.
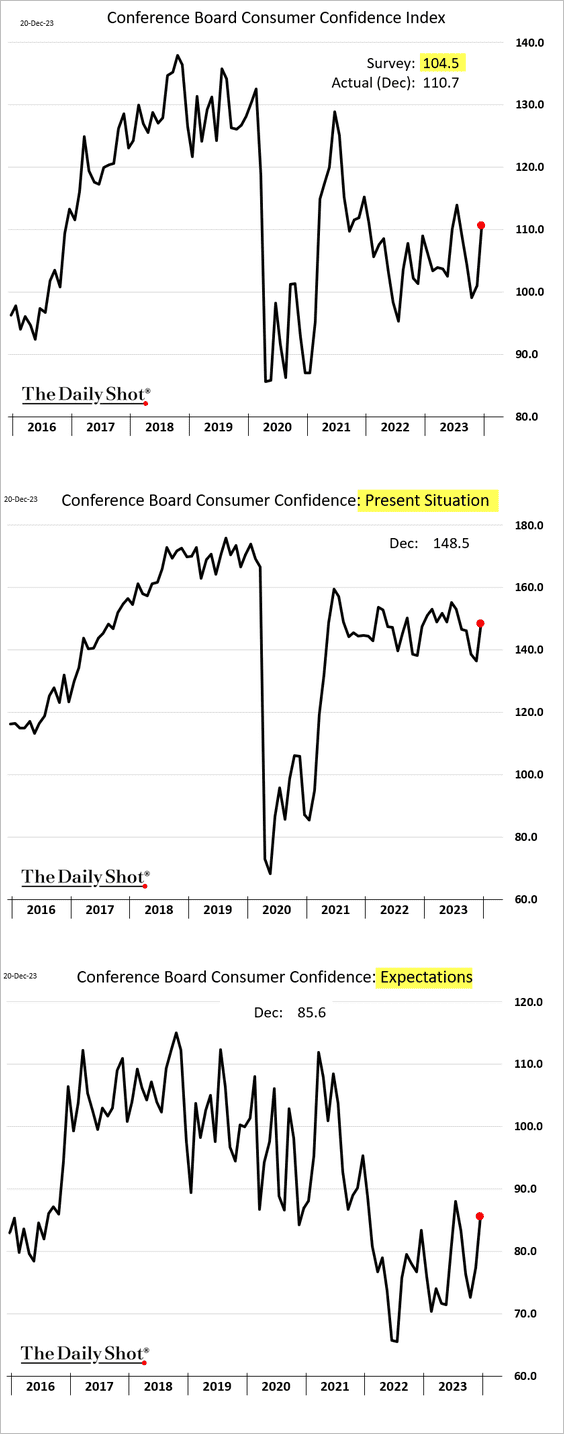
• The labor differential climbed, signaling increased confidence in the job market.

• Inflation expectations eased.

• Consumers are increasingly upbeat on the stock market.

——————–
2. Next, we have some updates on the housing market.
• Mortgage applications have been a bit firmer in recent weeks.


– Here is the rate lock count.
 Source: AEI Housing Center
• This chart shows the distribution of rates for outstanding mortgages.
 Source: Oxford Economics
• Existing home sales remained soft last month, …

… but firmer mortgage applications point to an uptick.
 Source: Pantheon Macroeconomics
– The median transaction price is now firmly above last year’s levels.

– Inventories are still tight but are now above 2021 and 2022 levels.

• The housing market’s downturn has been impacting the broader economy.
 Source: @WSJ Read full article
• The supply of luxury apartments has increased substantially in recent years. An overhang?
 Source: Quill Intelligence
——————–
3. Despite the pushback from Fed officials, the market is pricing in over six 25 bps rate cuts next year.

How will the Fed’s pivot impact GDP growth?
 Source: Torsten Slok, Apollo
Back to Index
The United Kingdom
1. The CPI report surprised to the downside.


 Source: @economics Read full article
• Below are some CPI components.
– Services:

– Rent CPI (still very high):

– Vehicles:

• Here is the retail price index.

• This chart shows ING’s CPI forecast for next year.
 Source: ING
——————–
2. Softer-than-expected CPI data sent bond yields sharply lower.


Here is the gilt curve.

• The market is now pricing in larger rate cuts next year.


• The pound declined.

——————–
3. The official index of home prices is now firmly in negative territory (year-over-year).

Back to Index
The Eurozone
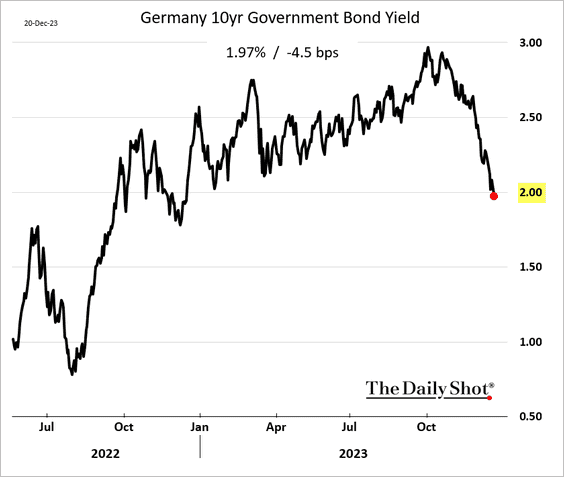
1. The 10-year Bund yield dipped below 2% for the first time this year.
2. Euro-area consumer sentiment improved this month.
• The Netherlands:

• Germany:

• The Eurozone:

——————–
3. Germany’s industrial demand weakness has been mostly driven by non-domestic customers.
 Source: Destatis Read full article
4. This chart shows Greece’s path to investment grade.
 Source: @markets Read full article
5. The ECB’s quantitative tightening is expected to continue.
 Source: Deutsche Bank Research
Back to Index
Europe
1. Poland’s industrial production was slightly below last year’s levels in November.

Employment is shrinking.

——————–
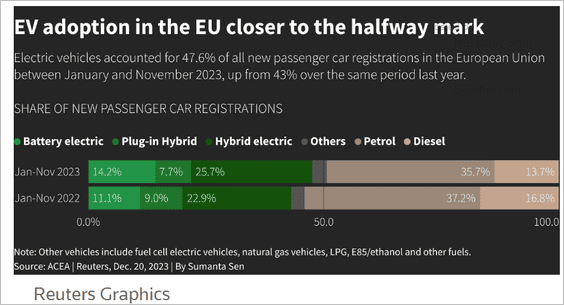
2. The EU’s new car registrations are running above last year’s levels, but momentum is softening.

• There are a lot of EVs sold in the EU these days.
 Source: Reuters Read full article
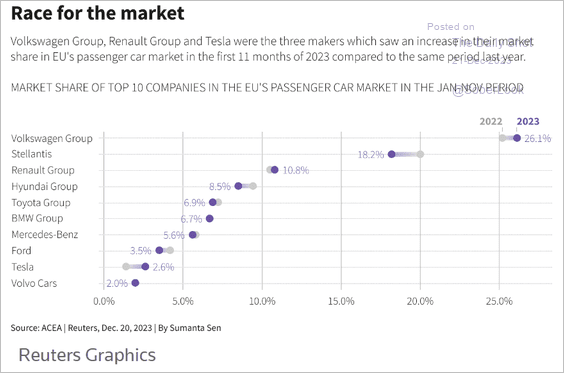
• Here is a look at the auto market.
 Source: Reuters Read full article
——————–
3. Finally, we have R&D spending by sector.
 Source: Eurostat Read full article
Back to Index
Japan
1. The Nikkei 225 resistance is holding.

2. M&A activity jumped this year.
 Source: @financialtimes Read full article
Back to Index
Asia-Pacific
1. South Korea’s exports surged this month.

2. Taiwan’s November export orders were disappointing.

3. New Zealand’s business confidence continues to climb.

4. Australia’s retail spending has been soft relative to last year.
 Source: @ANZ_Research
Back to Index
China
1. The PBoC has been expanding its balance sheet.
 Source: Gavekal Research
2. Monetary conditions tightened further last month.

3. Properties are taking longer to sell.
 Source: Longview Economics
Back to Index
Emerging Markets
1. Mexico’s October retail sales topped expectations.

Bond yields are moving lower.

——————–
2. Brazil’s economy is losing steam.

3. Argentina’s trade deficit was wider than expected.

4. Colombia’s sentiment indicators are trending lower.

5. Turkey’s consumer confidence is rebounding.

Turkey’s 2-year government bond yield broke above a wide range.
 Source: @TechCharts
——————–
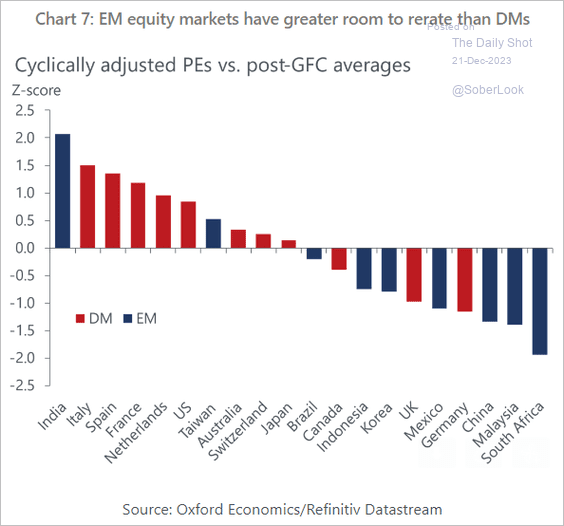
6. There is room for EM valuations to improve.
 Source: Oxford Economics
Back to Index
Commodities
1. Iron ore futures continue to rally.

2. The bear market in sugar has intensified.

3. Battery demand is expected to slow next year.
 Source: @technology Read full article
Back to Index
Energy
1. According to the US Department of Energy, US crude oil production hit a record high.

2. US crude oil and gasoline inventories increased last week.


• Refinery runs and refinery utilization strengthened.

——————–
3. Solar is currently significantly cheaper than wind energy.
 Source: Goldman Sachs
Back to Index
Equities
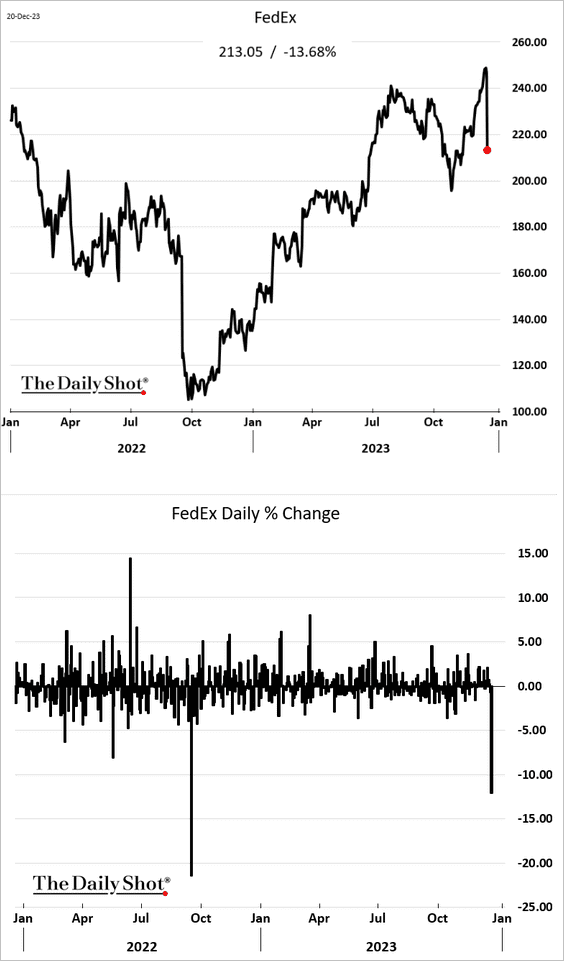
1. We finally saw a healthy pullback on Wednesday.

• FedEx sold off sharply on revenue outlook. Could this be indicative of a broader economic slowdown?
 Source: CNBC Read full article
• This chart shows Wednesday’s declines by sector.

——————–
2. Cyclical sectors continue to outperform.

3. The equal-weight S&P 500 cycled from a one-year low to a one-year high in 33 days.
 Source: SentimenTrader
4. Will we see a bump in IPOs next year?
 Source: Goldman Sachs; @MikeZaccardi
Post-IPO stocks underperformed the Nasdaq 100 this year.

——————–
5. AI stocks continue to outperform.

6. Tech fund inflows have been remarkable.
 Source: Deutsche Bank Research
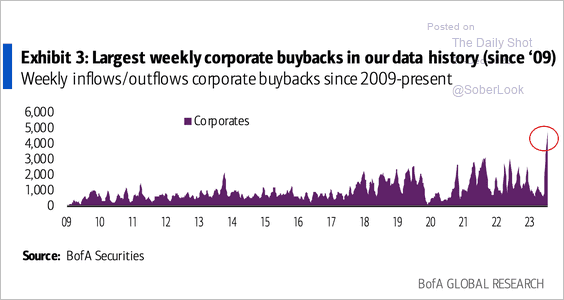
7. Share buybacks have been strong in recent weeks, helping to fuel the rally.
 Source: BofA Global Research
8. Companies with strong balance sheets outperformed in 2023.

9. Hedge funds’ stock picks focused on tech mega-caps this year and outperformed the S&P 500.

Back to Index
Credit
1. Leveraged loans continue to rally.

2. Will investment-grade loan activity rebound next year?
 Source: @markets Read full article
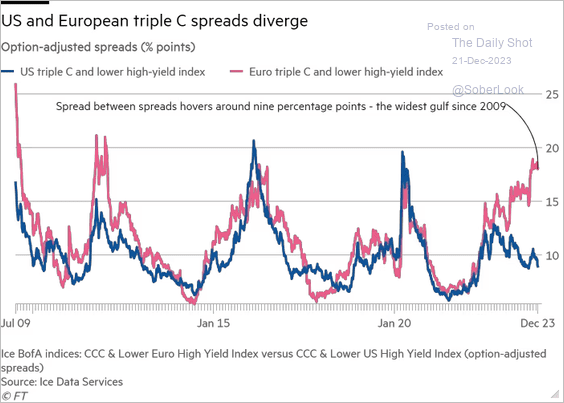
3. European CCC spreads have diverged from those of US counterparts amid concerns about a recession in the Eurozone.
 Source: @financialtimes Read full article
Back to Index
Rates
1. The 30-year Treasury yield dipped below 4%.
 Source: @TheTerminal, Bloomberg Finance L.P.
• The 10-year Treasury yield is below its 40-week (~200-day) moving average again, although prior dips were temporary.

• The 20+ Year Treasury Bond ETF (TLT) appears overbought near resistance.

——————–
2. The 2-year Treasury note looks attractive relative to fed funds rate expectations (OIS).

3. Deutsche Bank forecasts a much steeper 2s10s Treasury curve than the forward market suggests.
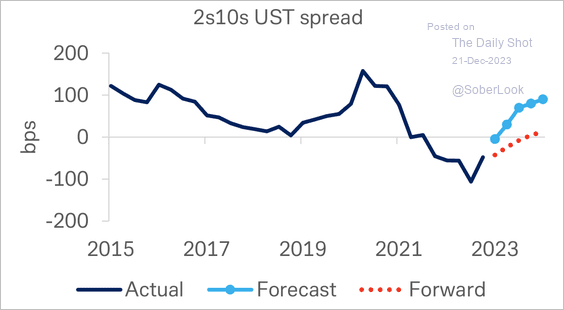 Source: Deutsche Bank Research
——————–
Food for Thought
1. US solar panel imports:
 Source: S&P Global Market Intelligence
2. Fossil fuel usage:
 Source: The New York Times Read full article
3. Annual wages of US physicians and surgeons:
 Source: USAFacts
4. Industrial production and GDP of US- and China-allied nations:
 Source: Capital Economics
5. Foreign students in the US:
 Source: USAFacts
6. Artificial Christmas trees:
 Source: Statista
——————–
The Daily Shot will not be published next week (from December 25th to January 1st).
Back to Index
