
The Daily Shot: 02-Jan-24
• The United States
• Canada
• The United Kingdom
• The Eurozone
• Europe
• Japan
• Asia-Pacific
• China
• Emerging Markets
• Cryptocurrency
• Commodities
• Energy
• Equities
• Credit
• Rates
• Global Developments
• Food for Thought
The United States
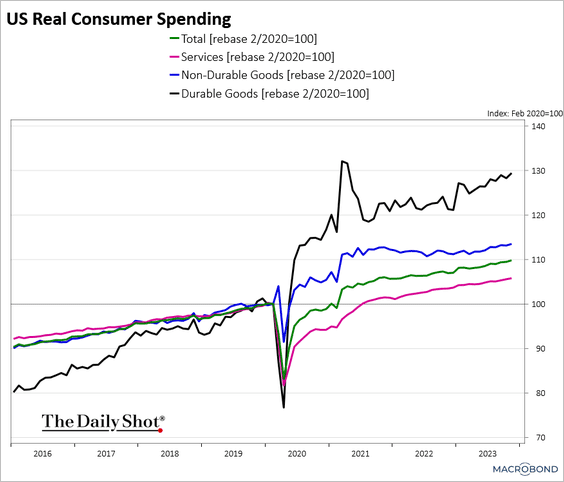
1. The US consumer remained resilient going into the holiday season, with spending rising in November.
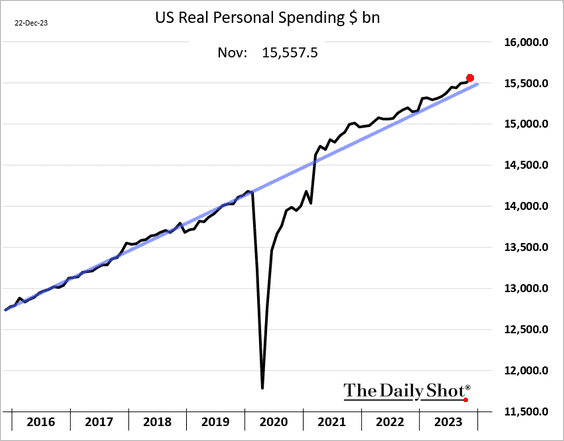
Here are the trends in goods and services.
However, card spending shows a slowdown.
 Source: Longview Economics
• Excluding government transfers, real income growth is accelerating.

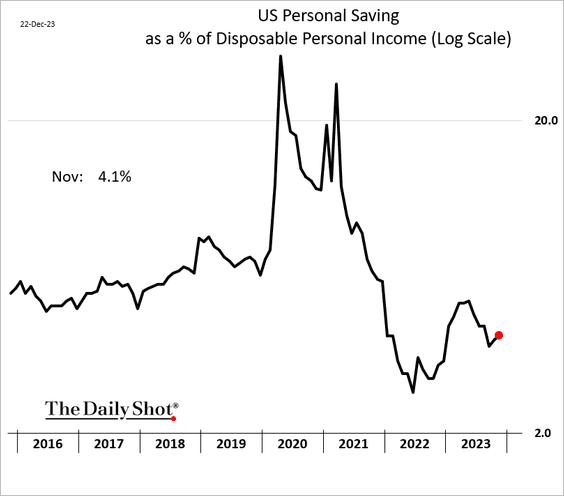
• Savings edged higher in November.
——————–
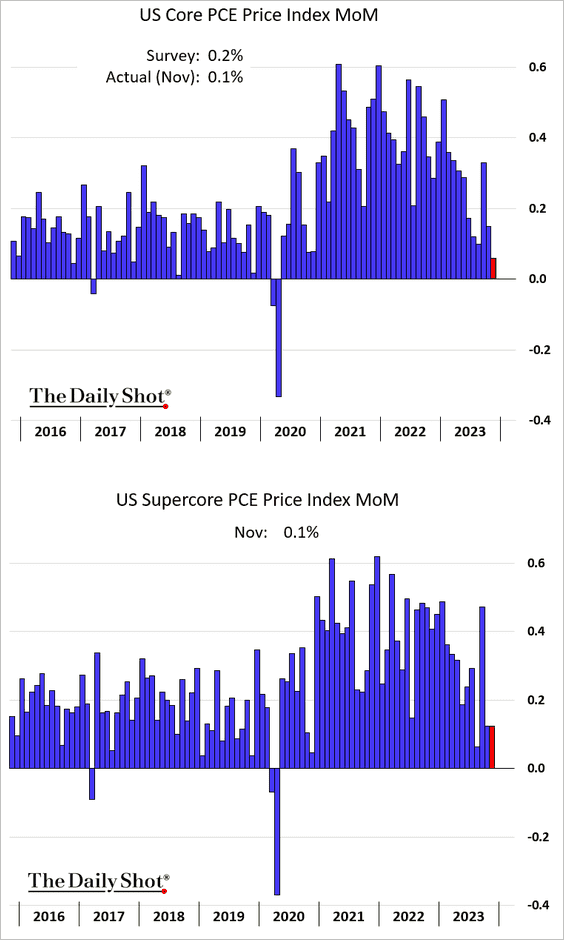
2. The core PCE inflation (the Fed’s preferred measure) slowed more than expected.
 Source: AP News Read full article
——————–
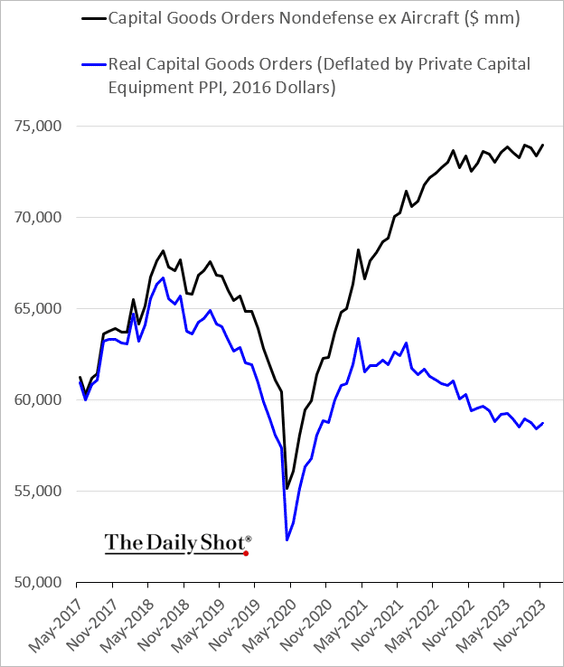
3. November’s durable goods orders topped expectations.
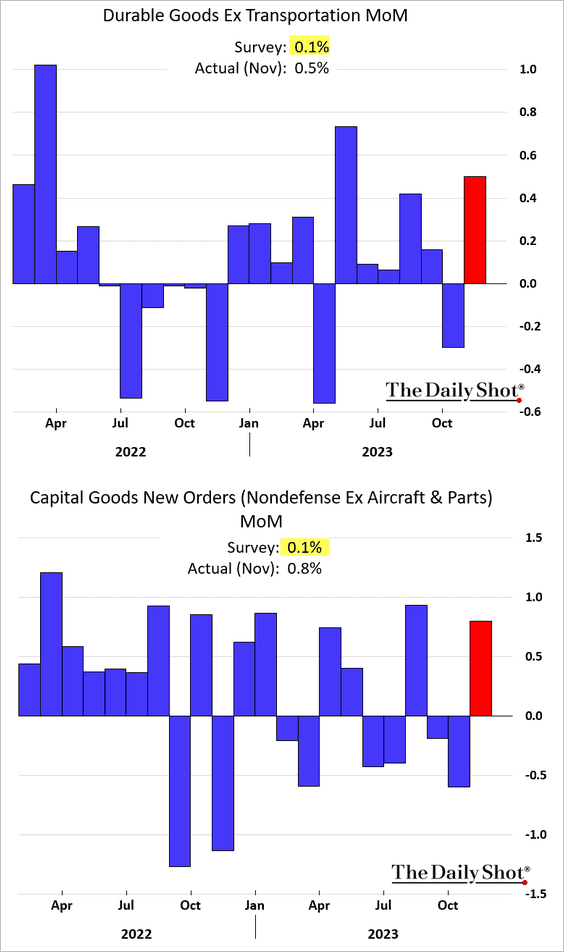
Here is a look at nominal and real capital goods spending.
——————–
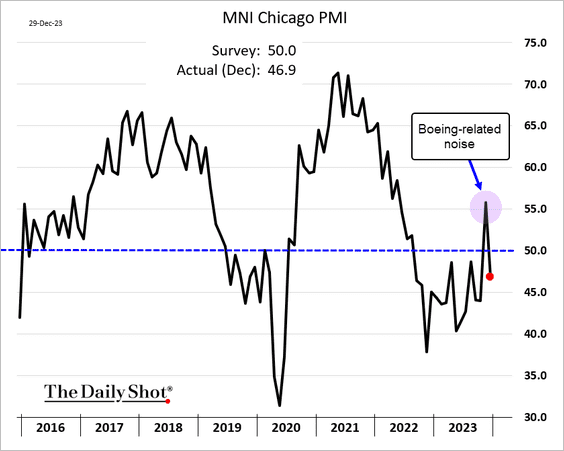
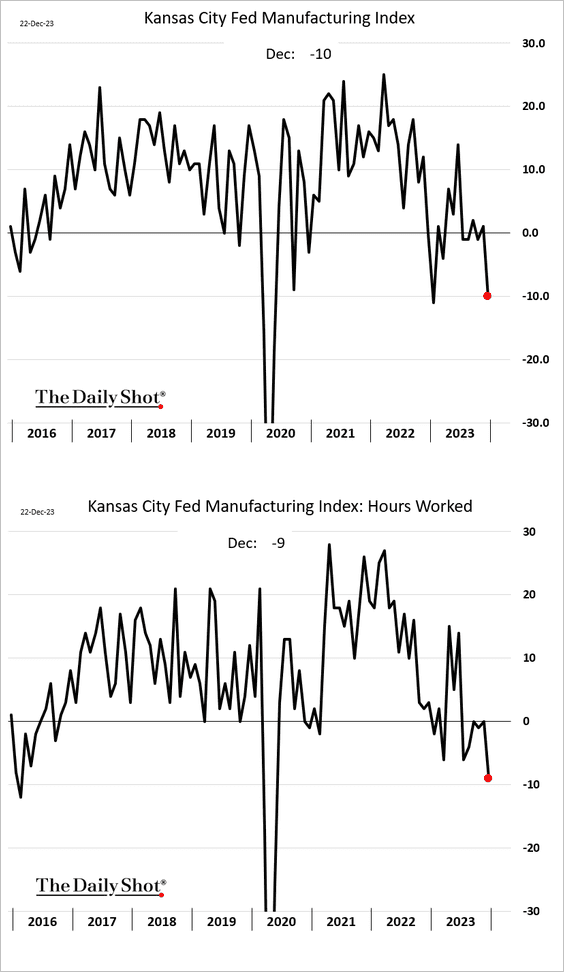
4. Recent regional manufacturing data persistently indicate subdued activity levels.
• Dallas Fed:

• MNI Chicago PMI:
• Richmond Fed:

• Kansas City Fed:
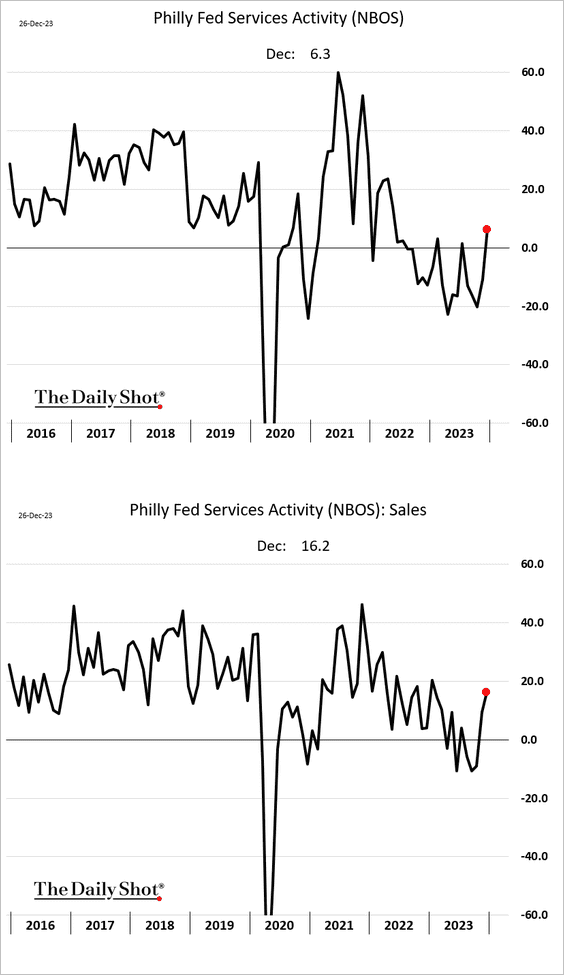
On the other hand, the Philly Fed’s services index was back in growth mode in December.
——————–
5. Next, we have some updates on the labor market.
• Initial jobless claims remain very low for this time of the year.
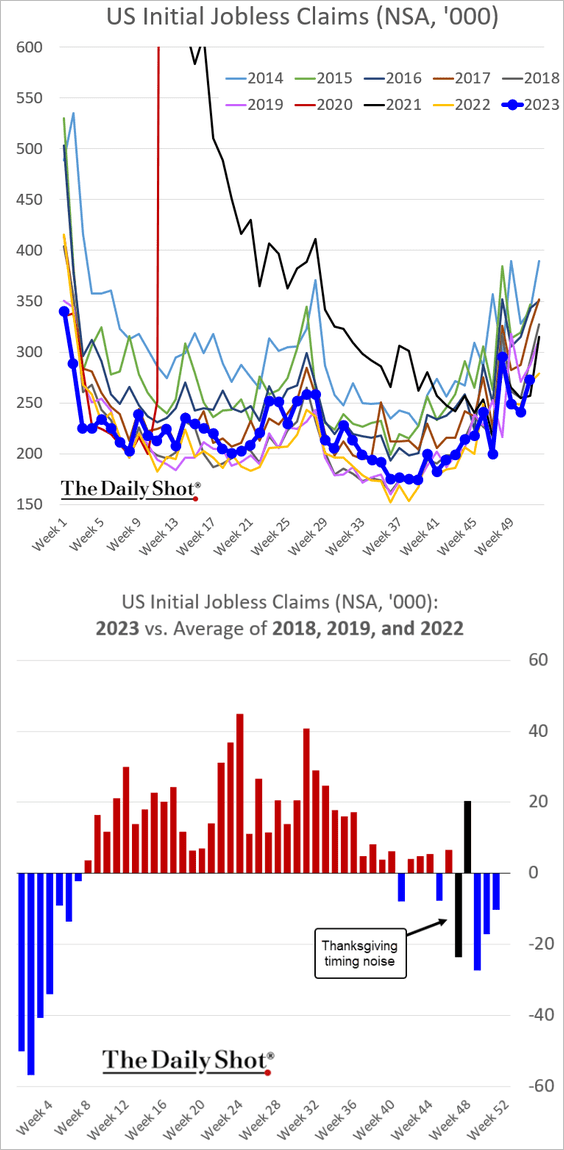
Continuing claims have been easing.

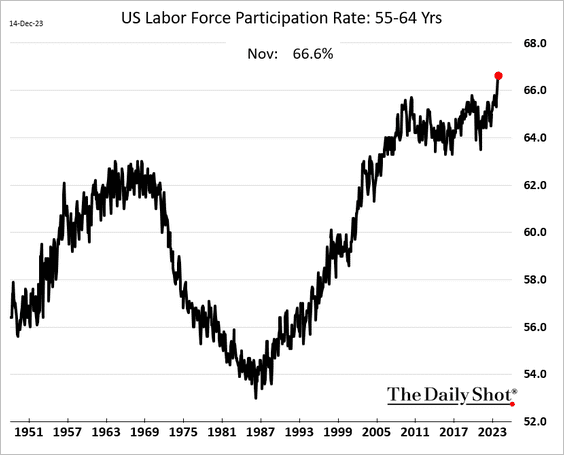
• Labor force participation among Americans aged 55-64 is hitting new highs.
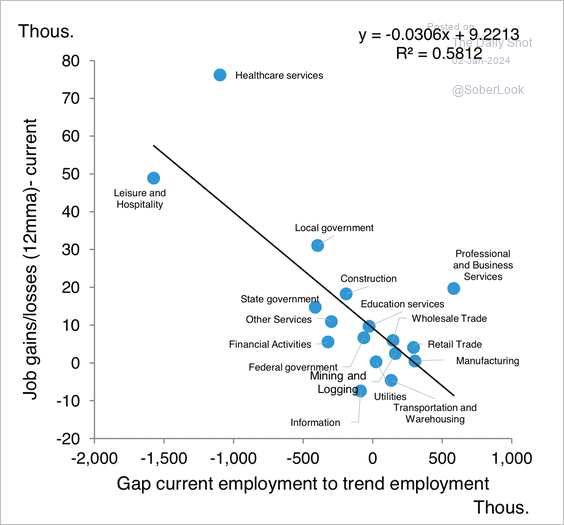
• Here is a look at the job gap versus pre-COVID compared to job momentum.
 Source: Deutsche Bank Research
• How has immigration contributed to labor force growth?
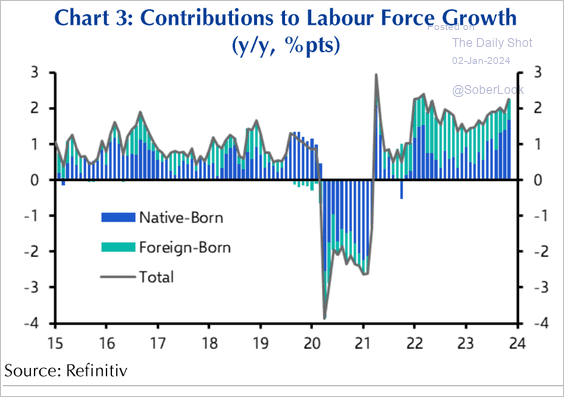 Source: Capital Economics
• The working-age population is expected to grow at a slower pace over the next decade.
 Source: J.P. Morgan Asset Management
• Here is the share of private industries with rising employment.
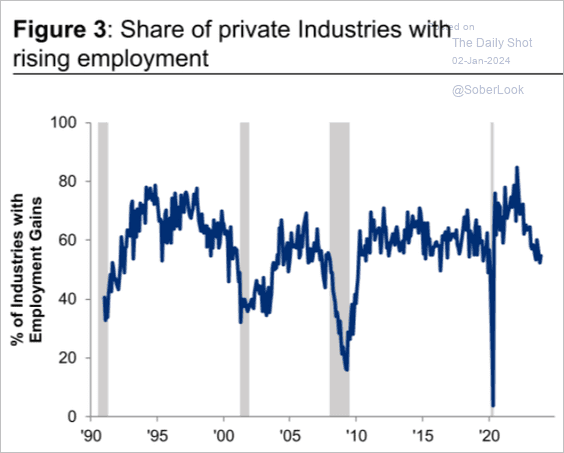 Source: Citi Private Bank
• Very few states are reporting rising voluntary resignations (quits).
 Source: Quill Intelligence
——————–
6. The trade deficit in goods widened in November.
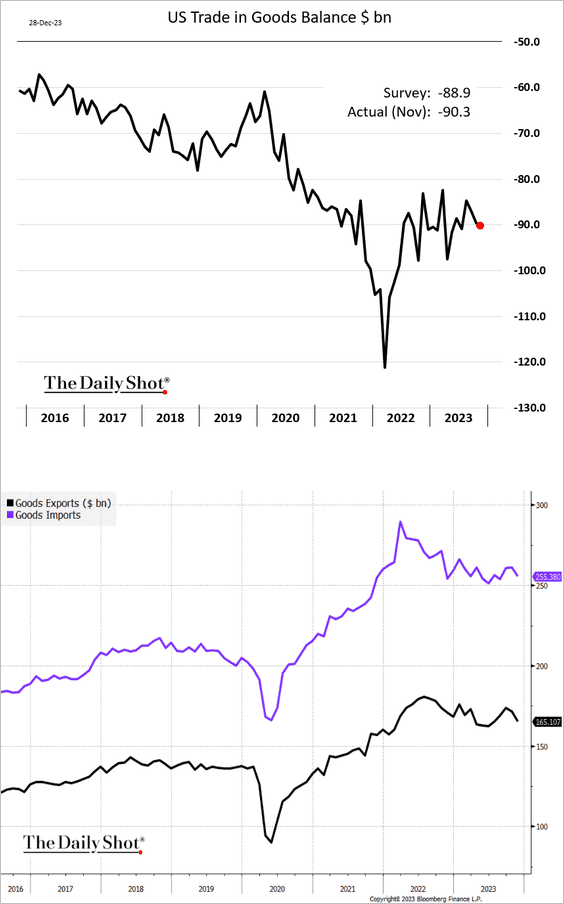
 Source: MarketWatch Read full article
Back to Index
Canada
1. The GDP growth has been close to flat in recent months, but Canada appears to have avoided a recession for now.
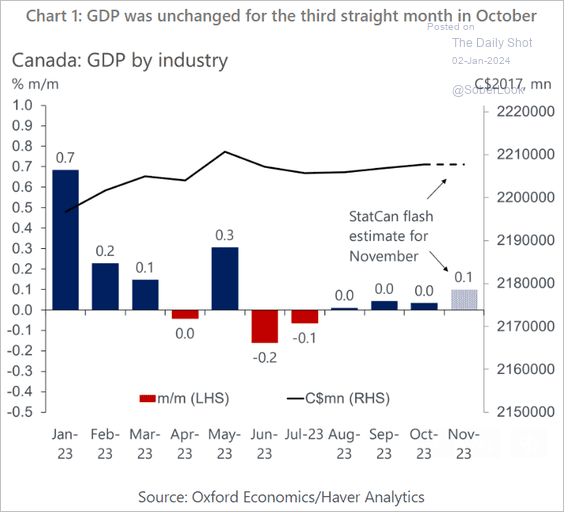 Source: Oxford Economics

 Source: @economics Read full article
——————–
2. Small business activity remained in contraction territory in December.

Here is the breakdown by sector.
• Level:

• Change:

——————–
3. Immigration levels were elevated again in Q3.
 Source: Capital Economics
Back to Index
The United Kingdom
1. Retail sales firmed up in November.

2. Last month’s home price appreciation surprised to the downside.

3. BoE rate cuts starting in Q2?
 Source: Barclays Research
4. UK equities continue to lag global peers.
 Source: @financialtimes Read full article
Back to Index
The Eurozone
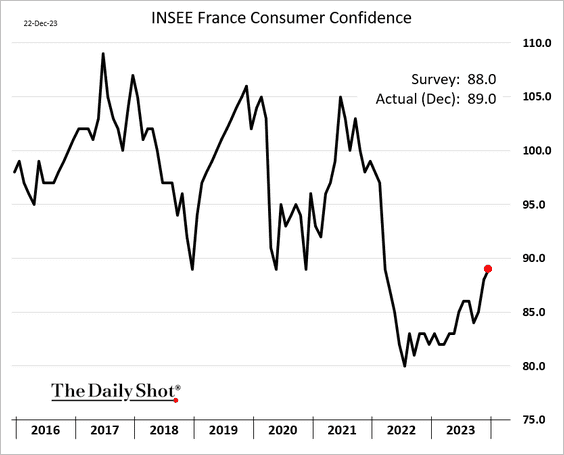
1. As we saw earlier, euro-area consumer sentiment showed signs of improvement in December.
• France:
• Italy:

2. Italian manufacturing confidence continues to deteriorate.

3. Spain’s retail sales have been very strong.

4. When will the ECB begin cutting rates?
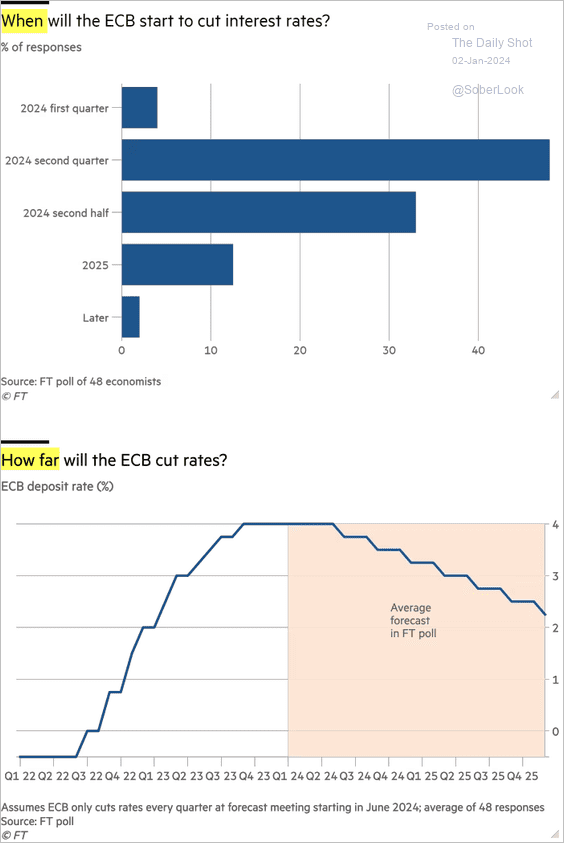 Source: @financialtimes Read full article
Back to Index
Europe
1. Container shipping costs have been rising as vessels are forced to divert away from the Suez Canal.
 Source: Bloomberg
 Source: @economics Read full article
——————–
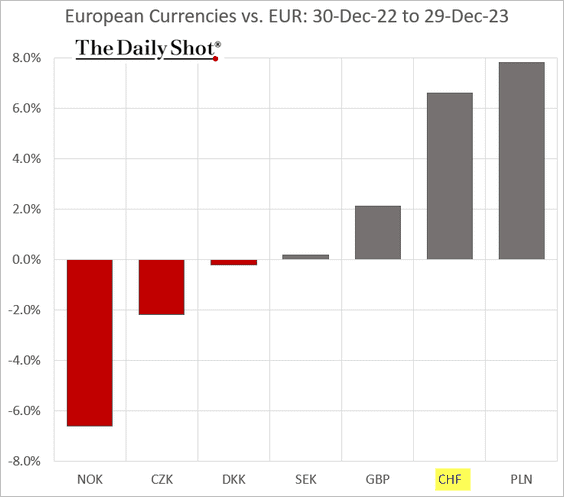
2. The Swiss franc has been hitting new highs vs. the euro.

——————–
3. Here is a look at the European Parliament poll data.
 Source: Europe Elects Read full article
Back to Index
Japan
1. The yen continues to strengthen vs. USD due to the expected policy divergence.

2. 2023 was a good year for Japanese shares.

3. Industrial production eased in November.

4. The jobs-to-applicants ratio has been trending lower (2nd panel).

5. Housing starts hit a multi-year low.

Back to Index
Asia-Pacific
1. Taiwan’s industrial production edged lower in November.

• The PMI indicator continues to signal contraction in Taiwan’s factory activity.
 Source: S&P Global PMI
• The unemployment rate is at multi-decade lows.

——————–
2. South Korea’s industrial production gained in November as recovery continues.

• The PMI report shows stable factory activity but no growth.
 Source: S&P Global PMI
• Inflation is moderating.

——————–
3. Australia’s home prices continue to climb.

 Source: Reuters Read full article
• Here is a look at Australia’s public- vs. private-sector wage growth.
 Source: Capital Economics
Back to Index
China
1. The PMI indicators paint a mixed picture in manufacturing.
• The official manufacturing PMI (contraction):

• The S&P Global China Manufacturing PMI (growth):

——————–
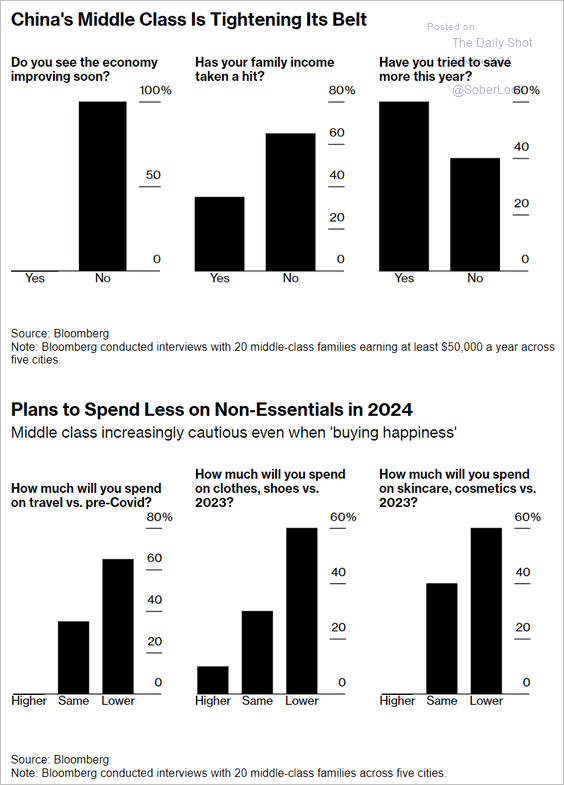
2. Consumer sentiment has been awful.
 Source: @business Read full article
3. This chart shows the drivers of China’s GDP growth.
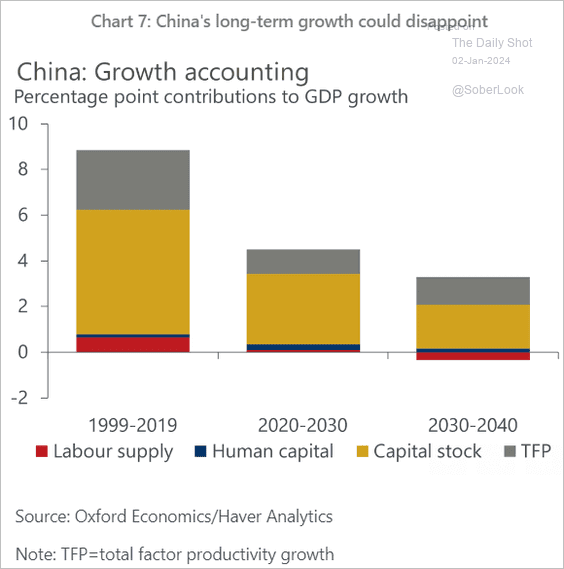 Source: Oxford Economics
Back to Index
Emerging Markets
1. Let’s run through Asian manufacturing PMIs for December.
• ASEAN (modest contraction):
 Source: S&P Global PMI
• Indonesia (growth):
 Source: S&P Global PMI
• The Philippines (slower growth):
 Source: S&P Global PMI
• Malaysia (muted):
 Source: S&P Global PMI
• Thailand (rapid contraction):
 Source: S&P Global PMI
• Vietnam (soft):
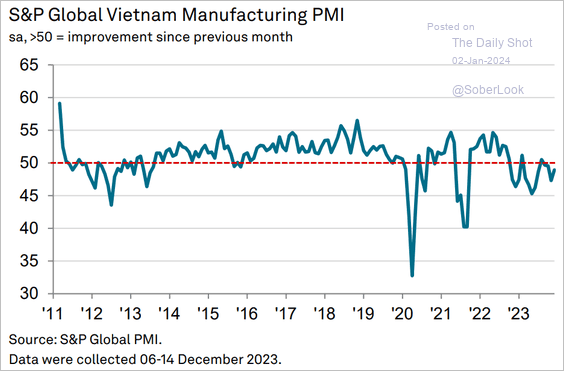 Source: S&P Global PMI
——————–
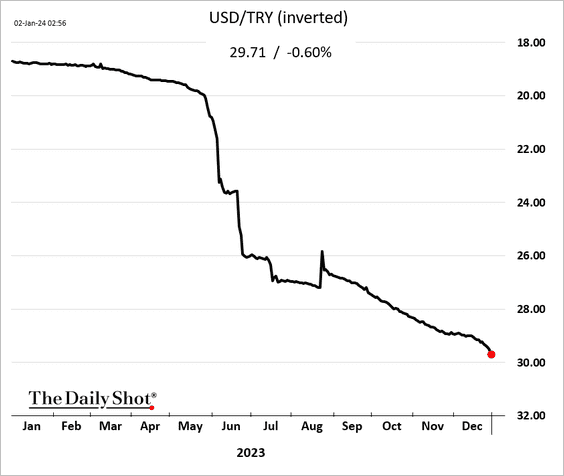
2. The Turkish lira depreciation is accelerating (approaching 30 to the dollar).
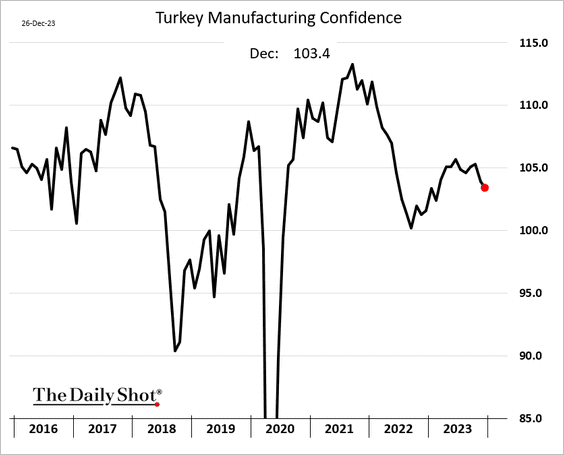
• Manufacturing confidence eased again last month.
——————–
3. India’s key industries’ output remains well above last year’s levels.

• The government’s capital spending is expected to accelerate next year.
 Source: Goldman Sachs
——————–
4. How did emerging markets perform in 2023?
• Currencies:

• Bond yields:

• Equity ETFs:

Back to Index
Cryptocurrency
1. 2023 was a good year for cryptos.

2. Bitcoin’s price tends to rally around halving events, although less extreme in recent years.
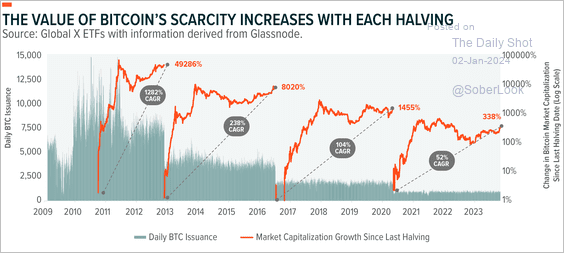 Source: Global X ETFs Read full article
3. A majority of crypto liquidity is concentrated in just a handful of exchanges.
 Source: @KaikoData
4. Bitcoin’s hash price (revenue generated by miners) returned toward pre-2020 levels.
 Source: @glassnode
Back to Index
Commodities
1. Iron ore continues to rally.

2. Gold retreated below the resistance level after a record-high close.
 Source: @TheTerminal, Bloomberg Finance L.P.
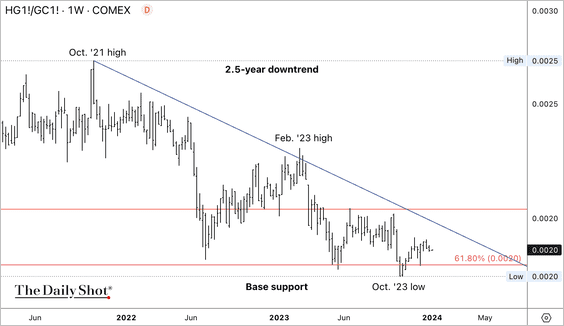
3. The copper/gold ratio remains in a long-term downtrend. Will we see a breakout this year?
4. Rice prices continue to climb.
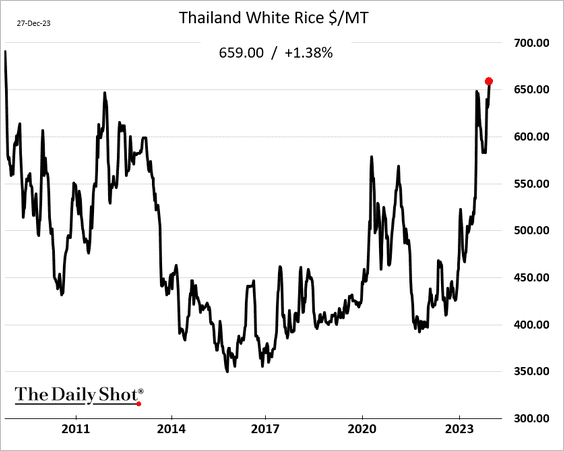
 Source: @markets Read full article
——————–
5. Here is a look at which commodities are overbought and oversold heading into the new year.
 Source: Peak Trading Research
6. How did commodity markets perform in 2023?

Back to Index
Energy
1. Brent crude hit resistance at the 200-day moving average and is now back below $80/bbl.
 Source: @TheTerminal, Bloomberg Finance L.P.
2. Angola is exiting OPEC. The nation’s oil output has declined since it joined OPEC in 2007.
 Source: @JavierBlas, @opinion Read full article
3. The US is exporting more crude oil to Europe.
 Source: @WSJ Read full article
4. Uranium prices continue to surge.
 Source: barchart.com
Back to Index
Equities
1. The S&P 500 has been up for nine weeks in a row.

• The index is entering the new year with widespread overbought signals.
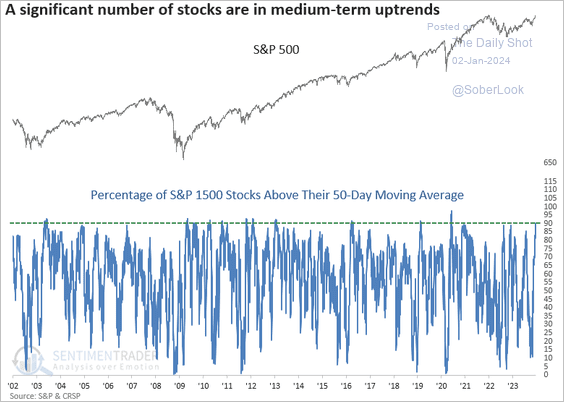 Source: SentimenTrader
——————–
2. Investment managers are extremely bullish.
 Source: NAAIM
3. The S&P 500 is highly concentrated.
• Top seven names:
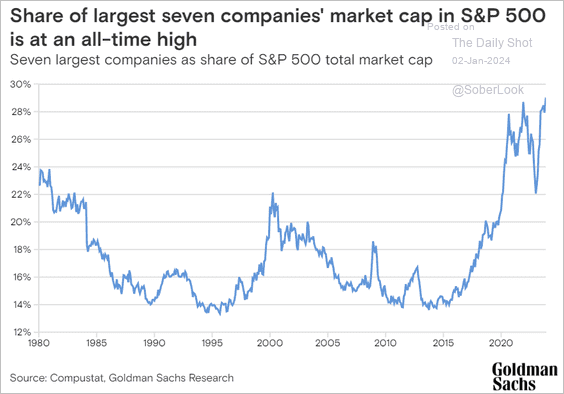 Source: Goldman Sachs
• Proportion of members outperforming the index:
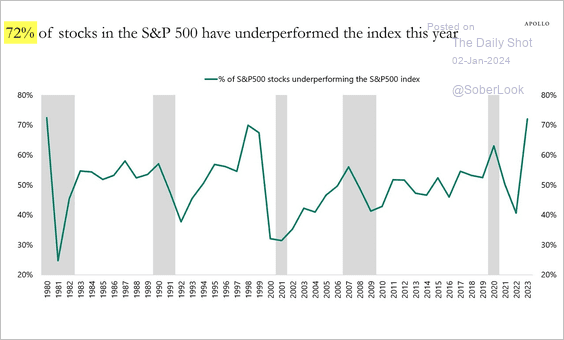 Source: Torsten Slok, Apollo
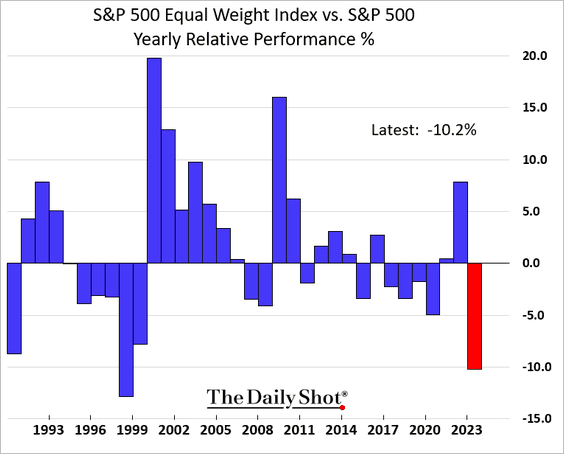
– Here is the relative performance of the S&P 500 equal-weight index.
——————–
4. Analysts expect 11-12% earnings-per-share growth over the next two years. Too optimistic?
 Source: J.P. Morgan Asset Management
5. Current valuations point to sub-5% returns for the S&P 500 over the next five years.
 Source: J.P. Morgan Asset Management
6. Small caps failed to break out relative to the S&P 500 (capped by downtrend resistance).

7. Fund flows into SPDR S&P 500 ETF (SPY) hit extreme levels in December.

8. Next, let’s take a look at performance attribution for the S&P 500 and S&P 600 (small caps) in 2023.

The S&P 600 was up about 16% in 2023 on a total-return basis.

——————–
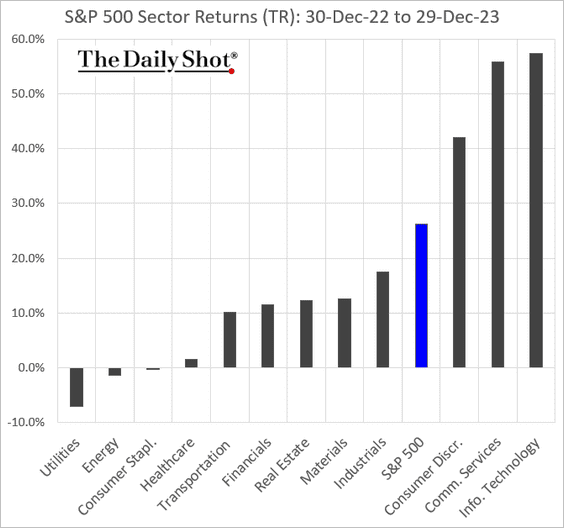
9. Finally, we have some performance data for 2023.
• Sectors:
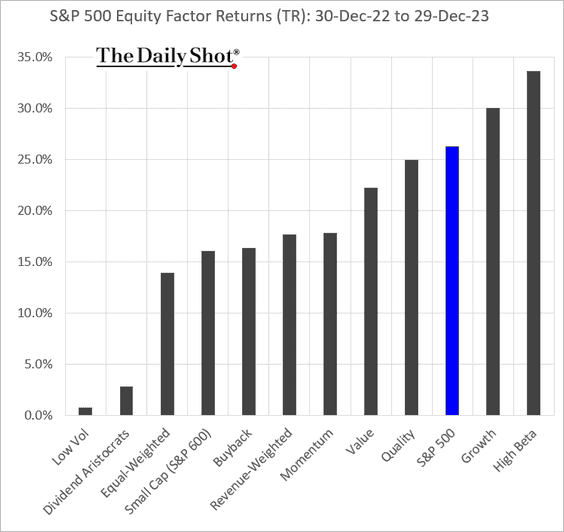
• Equity factors:
• Macro basket pairs’ relative performance:

• Thematic ETFs:

• Largest US tech firms:

Back to Index
Credit
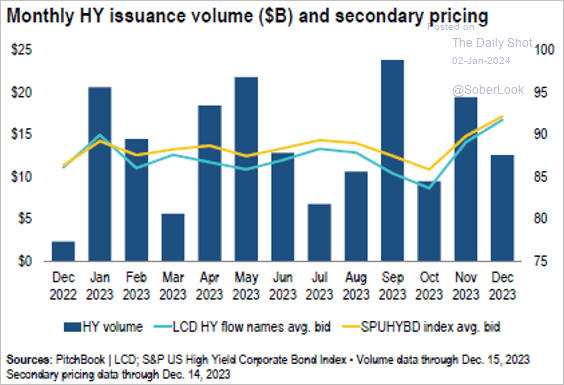
1. US high-yield issuance and secondary pricing improved in Q4. This was driven by tighter spreads, which helped reopen access to the asset class, although borrowing remains expensive.
 Source: PitchBook
2. Credit market implied vol hit a two-year low.
 Source: S&P Dow Jones Indices
3. This chart shows relative risk and yields across asset classes. At current cash rates, relatively high levels of income can be achieved without taking as much risk as in the past.
 Source: Wellington Management Read full article
4. Retail investors continue to boost their holdings of money market funds.

• Here is a look at the key players in US money market fund management.
 Source: @financialtimes Read full article
——————–
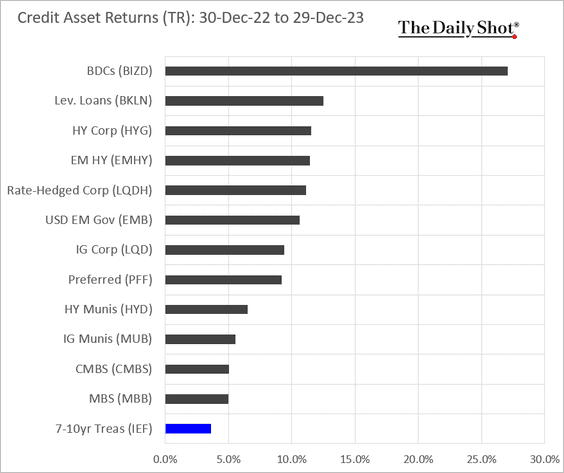
5. Finally, we have the 2023 performance data across credit asset classes.
Back to Index
Rates
1. Let’s start with Treasury yield attribution data for Q4 and 2023. Note that the 10-year Treasury yield was almost flat in 2023.


——————–
2. Central clearing is coming to the repo market.
![]() Source: Deutsche Bank Research
Source: Deutsche Bank Research
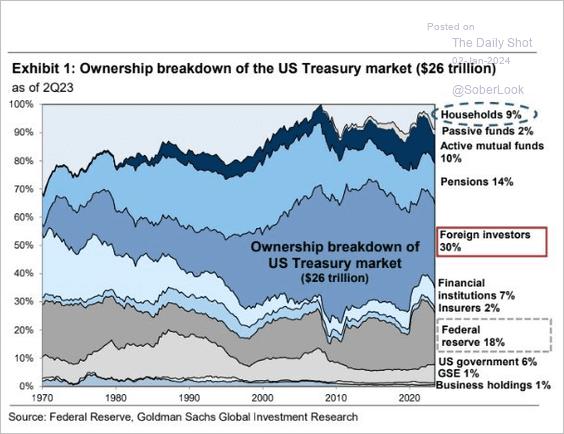
3. Who owns Trasuries?
 Source: Goldman Sachs; @MikeZaccardi
Back to Index
Global Developments
1. Global investment-grade bonds just had their best two months on record.
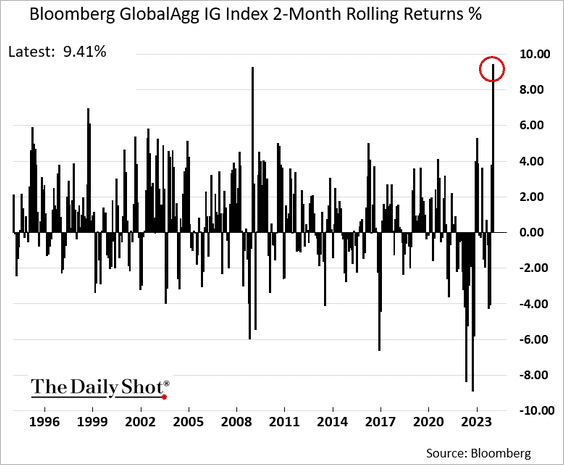 Further reading
2. House prices have been stabilizing/rebounding in advanced economies.
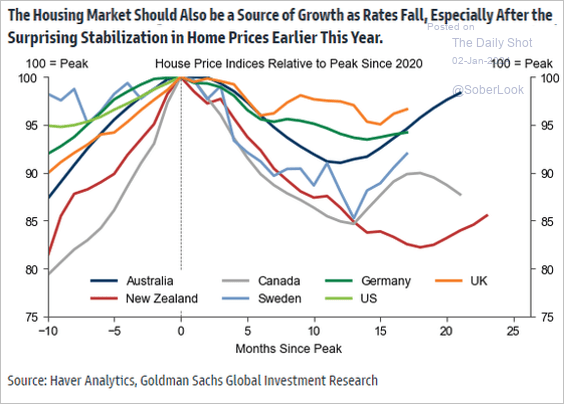 Source: Goldman Sachs; @MikeZaccardi
3. Here is a look at Wells Fargo’s currency forecasts for 2024.
 Source: Wells Fargo Securities
4. Finally, we have some performance data for 2023.
• Currencies:

• Bond yields:

• Large-cap equity indices:

——————–
Food for Thought
1. Weekly working hours and wages:
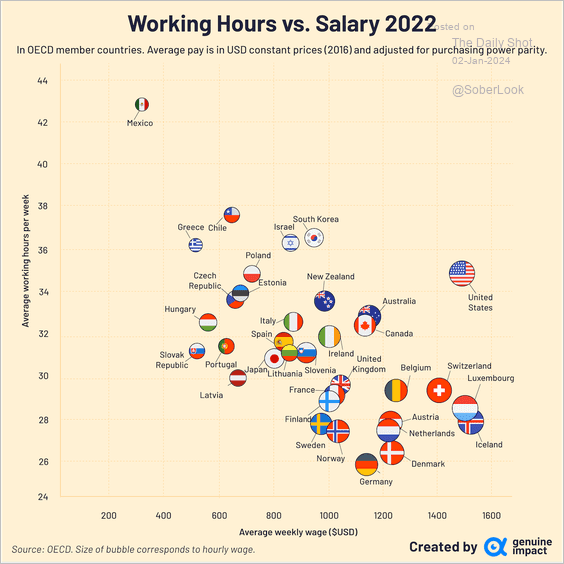 Source: Visual Capitalist Read full article
2. Worker days lost to stoppages:
 Source: @WSJ Read full article
3. COVID-19 variants:
 Source: @axios Read full article
4. 2023 was a warm year.
 Source: Climate Reanalyzer
 Source: @axios Read full article
——————–
5. Nuclear reactors:
![]() Source: The Economist Read full article
Source: The Economist Read full article
6. A look at the gaming industry:
 Source: @genuine_impact
7. Discovering new music:
 Source: YouGov
——————–
Back to Index