The Daily Shot: 03-Jan-24
• The United States
• Canada
• The United Kingdom
• The Eurozone
• Europe
• Japan
• Asia-Pacific
• China
• Emerging Markets
• Cryptocurrency
• Commodities
• Equities
• Credit
• Rates
• Global Developments
• Food for Thought
The United States
1. Construction spending in November increased less than expected.

• Private construction spending continues to rise, with recent gains driven by residential investment.
 Source: @TheTerminal, Bloomberg Finance L.P.
– Growth in single-family construction spending has been outpacing multifamily housing projects.
 Source: LPL Research
• Manufacturing construction spending continues to climb, driven by semiconductor facility investment.
![]()
• Public construction spending has been surging, …

… but there was a pullback in November.
 Source: Wells Fargo Securities
——————–
2. Next, we have some updates on the housing market.
• Mortgage rates are below 6.5%.

• Home prices continued to climb in October, rising by almost five percent relative to 2022.


• The gap between home prices and wages keeps widening.

• Housing inventories are back at last year’s levels.
 Source: AEI Housing Center
• Many home sales are falling through.
 Source: Redfin
• Mortgage delinquencies remain very low.

• Fewer homebuyers are looking for a home outside their metro area.
 Source: Redfin Read full article
• New home sales declined sharply in November.

 Source: MarketWatch Read full article
– Measured in months of supply, new home inventories surged.

– Here is the composition of new home inventories (by stage of construction).
 Source: Calculated Risk
• Pending home sales held at multi-year lows in November.

——————–
3. The updated manufacturing PMI from S&P Global showed a faster contraction in the nation’s manufacturing activity last month.

4. Labor productivity is rising alongside slowing inflation.
 Source: Alpine Macro
• The average cost of industrial robots is expected to decline, which could boost labor productivity.
 Source: Global X ETFs Read full article
Back to Index
Canada
Manufacturing activity has slowed sharply, forcing factories to shed jobs.

 Source: Reuters Read full article
Back to Index
The United Kingdom
1. Factory activity remains depressed.
 Source: S&P Global PMI
 Source: Reuters Read full article
——————–
2. Here is a look at UK immigration trends.
 Source: @WSJ Read full article
Back to Index
The Eurozone
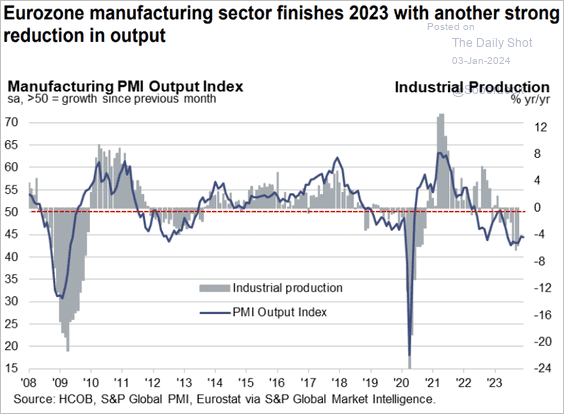
1. The PMI data continues to signal a recession.
 Source: S&P Global PMI
 Source: Reuters Read full article
Here are the PMI trends for Italy, Spain, and the Netherlands.
 Source: S&P Global PMI

——————–
2. Germany’s real residential property prices have been crashing.
 Source: BIS; h/t @ValuablOfficial
Back to Index
Europe
1. Poland’s factory activity failed to stabilize last month.
 Source: S&P Global PMI
The Czech Republic’s manufacturing sector continues to shrink.
 Source: S&P Global PMI
2. Norway’s manufacturing is back in growth territory.

3. Here is a look at asylum applications in the EU.
 Source: @financialtimes Read full article
4. This map shows all the European renewable energy projects.
 Source: The Economist Read full article
Back to Index
Japan
1. M&A activity accelerated last year.
 Source: Torsten Slok, Apollo
2. Japan’s population is expected to keep aging.
 Source: @WSJ Read full article
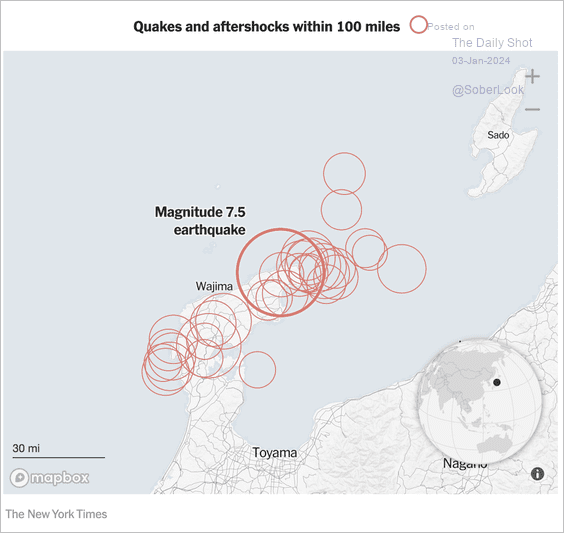
3. Here is a look at the Sea of Japan earthquake intensity.
 Source: @financialtimes Read full article
 Source: The New York Times Read full article
Back to Index
Asia-Pacific
1. The rebound in Asian currencies is stalling.
 Source: @TheTerminal, Bloomberg Finance L.P.
2. NZD/USD appears overbought within its long-term downtrend.

3. Next, let’s take a look at South Korea’s exports.
• Exports to the US vs. China:
 Source: @JeffreyKleintop
• Key products:
 Source: ING
——————–
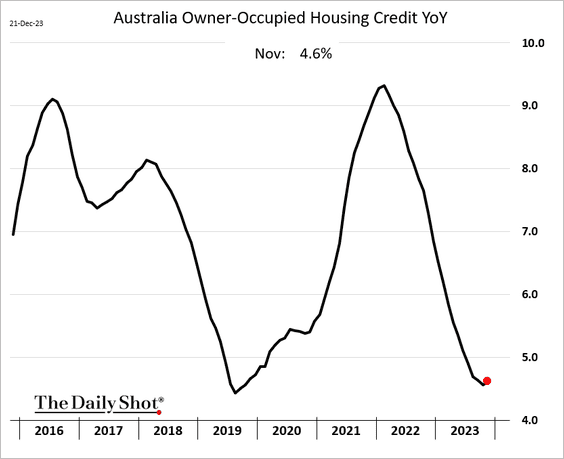
4. Australia’s housing credit growth appears to have bottomed.
Back to Index
China
1. The PBoC is providing more liquidity accommodation to boost growth.
 Source: @markets Read full article
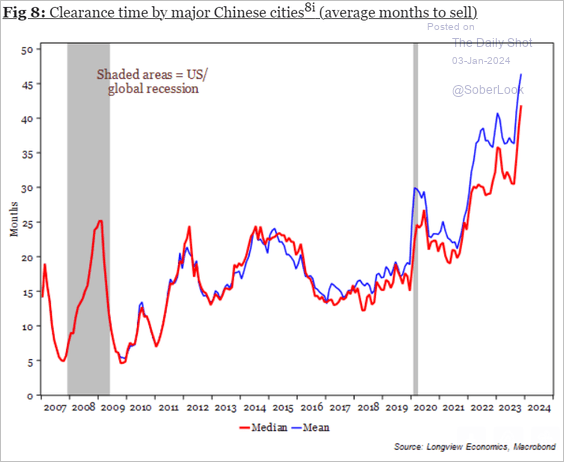
2. Properties are taking longer to sell.
 Source: Longview Economics
3. Home prices have been falling in Hong Kong while rents are climbing.
 Source: @economics Read full article
4. China faces deteriorating demographics.
 Source: @WSJ Read full article
Back to Index
Emerging Markets
1. Let’s run through some manufacturing PMI trends.
• India (growth is still strong but slowing):
 Source: S&P Global PMI
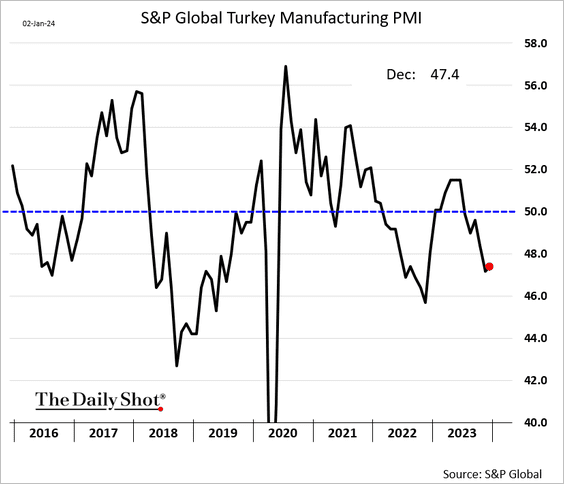
• Turkey (dragged lower by weak EU activity):
• Mexico (growing):
 Source: S&P Global PMI
• Brazil (mild contraction):
 Source: S&P Global PMI
• Colombia (rebounding):
 Source: S&P Global PMI
——————–
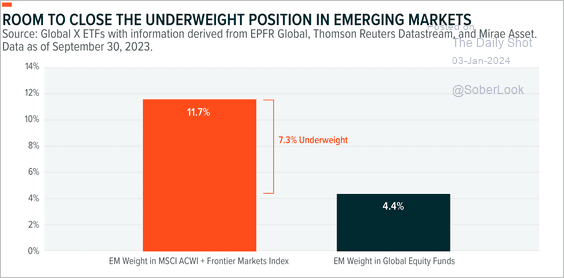
2. Generally, investors are underweight in their allocation to EM equities.
 Source: Global X ETFs Read full article
• EM equities typically outperform US equities 12 months after the last Fed rate hike.
 Source: Global X ETFs Read full article
——————–
3. Here is a look at external debt-to-GDP ratios.
 Source: Goldman Sachs
Back to Index
Cryptocurrency
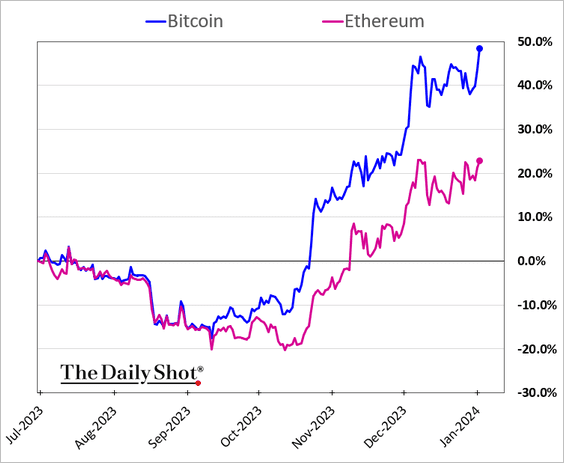
1. Bitcoin climbed above $45k on spot bitcoin ETF hopes.

 Source: Reuters Read full article
——————–
2. Ether continues to lag.
3. Bitcoin options activity has accelerated in recent months.
 Source: The Block
4. Bitcoin proof-of-work difficulty levels continue to hit record highs.
 Source: CoinWarz
5. The supply of stablecoins is growing again.
 Source: @axios Read full article
Back to Index
Commodities
1. US corn prices have been under pressure.


2. Brazil’s rainfall improved soybean growing conditions, sending prices sharply lower this week.

Speculative accounts have become bearish on soybeans.

——————–
3. Here is Bloomberg’s grains index.

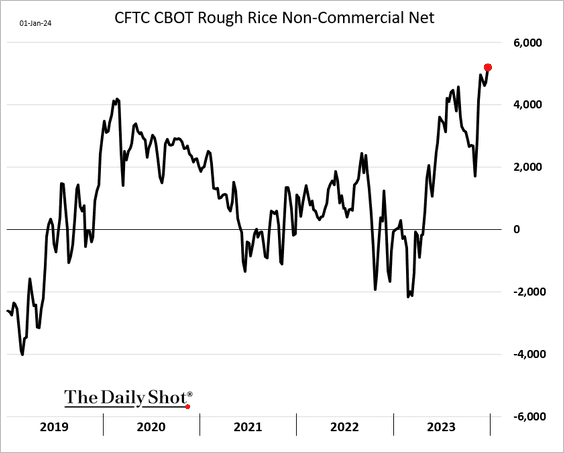
4. Rice futures have been rallying, …

… with speculative accounts boosting their bets.
——————–
5. Chicago hog futures have been tumbling.

Back to Index
Equities
1. The Nasdaq 100 took a hit in the first session of the year as bond yields climbed.

• The S&P 500 is starting to break below its uptrend from October 2023.

——————–
2. Defensives are back in favor as sentiment turns cautious. Here are some sector trends over the past few days.
• Healthcare:

• REITs:

• Consumer staples:

• Consumer discretionary:

• Transportation:

• Tech and semiconductors:

![]()
——————–
3. High-beta stocks are very correlated to Treasuries.

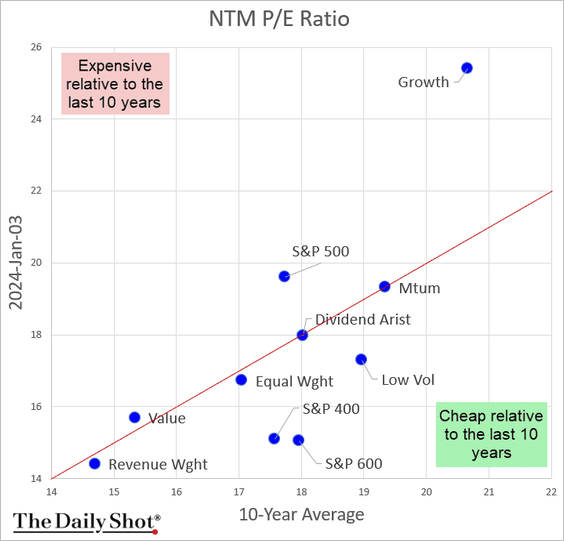
4. Here is a look at equity valuations relative to the past ten years.
5. This chart shows CapEx and R&D by sector.
 Source: J.P. Morgan Asset Management
6. Return dispersion remains elevated.
 Source: BlackRock Investment Institute
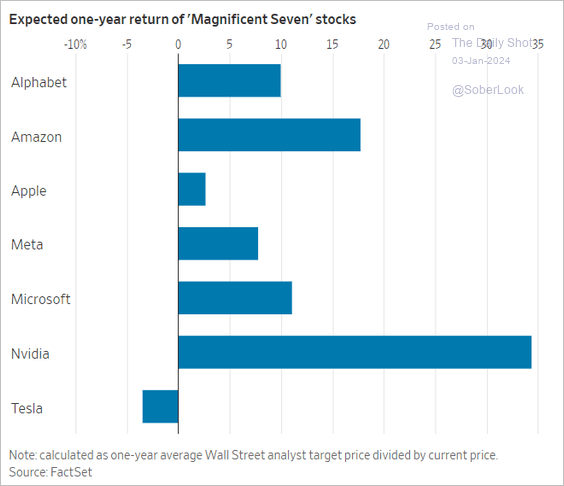
7. Analysts are upbeat about this year’s tech mega-cap performance.
 Source: @WSJ Read full article
8. Share buybacks are expected to drive much of the new demand for equities in 2024.
 Source: Goldman Sachs
9. 2023 was a rough year for SPACs.
 Source: @markets Read full article
10. Finally, we have detailed equity factor performance over the past year.
 Source: CornerCap Institutional
Back to Index
Credit
1. Market focus will likely shift to the impending US high-yield maturity wall.
 Source: PitchBook
2. Leveraged finance assets outperformed investment-grade debt over the past three years.
 Source: @markets Read full article
3. The US leveraged loan default rate rose toward its 10-year average.
 Source: PitchBook
Back to Index
Rates
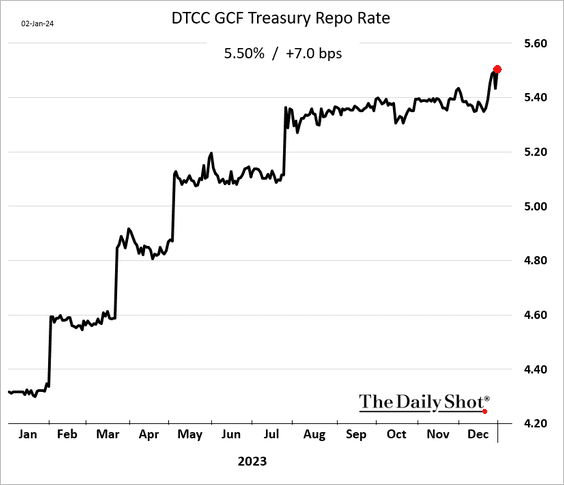
1. Repo rates are elevated, pointing to tight liquidity.

 Source: @markets Read full article
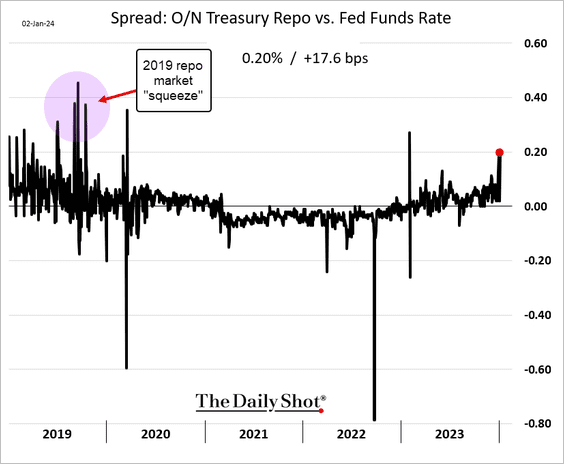
Here is the spread between the overnight Treasury repo rate and fed funds.
——————–
2. The Fed’s RRP facility balances dropped after the year-end “window dressing” spike.

3. The Fed’s estimate of the longer-run fed funds rate (chart below) is now about 50 bps below the market’s projection (2nd chart).
 Source: @WSJ Read full article
 Source: @TheTerminal, Bloomberg Finance L.P.
Back to Index
Global Developments
1. The dollar index is oversold and holding short-term support above 99.57.

2. Manufacturing activity remained in the doldrums last month amid soft demand.
 Source: S&P Global PMI
3. 2023 was a positive year for most financial assets, particularly developed market equities. However, oil and Chinese stocks sold off.
 Source: Deutsche Bank Research
Here is a look at total returns since Treasury yields peaked in October 2023.
 Source: Deutsche Bank Research
——————–
Food for Thought
1. Demand for weight loss drugs:
 Source: The Economist Read full article
2. Influenza activity map:
 Source: CDC; h/t @MikeZaccardi
3. Palestinian support for Hamas:
 Source: @financialtimes Read full article
4. Trans people killed:
 Source: Statista
5. Mass shootings and low-weight births in impacted communities:
 Source: NBER Read full article
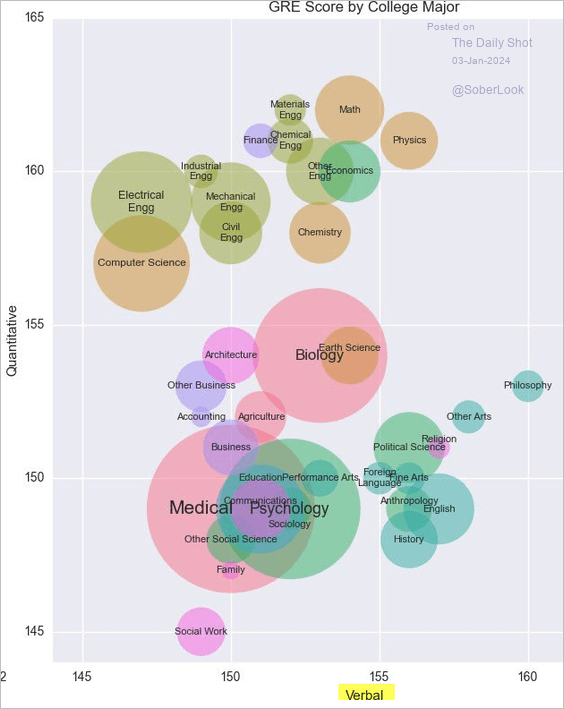
6. GRE scores across college majors:
 Source: @debarghya_das
7. Economic activity by state:
 Source: Federal Reserve Bank of Philadelphia
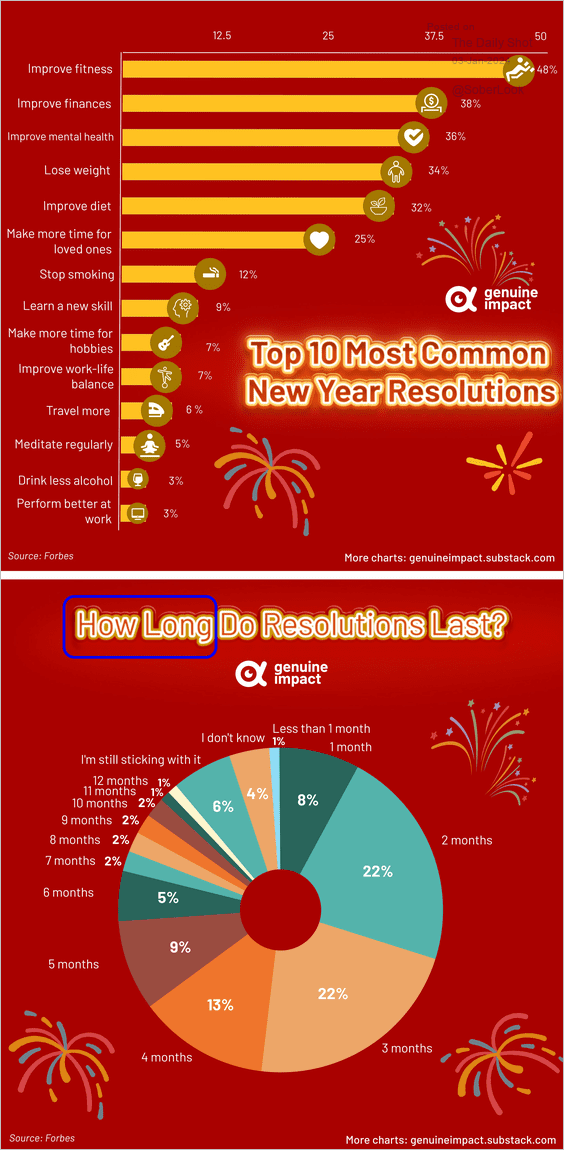
8. New Year’s resolutions:
 Source: @genuine_impact
——————–
Back to Index
