The Daily Shot: 16-Jan-24
• Administrative Update
• The United States
• Canada
• The Eurozone
• Europe
• Asia-Pacific
• China
• Cryptocurrency
• Energy
• Equities
• Credit
• Rates
• Global Developments
• Food for Thought
Administrative Update
We wanted to inform you that due to a necessary medical procedure, there will be a brief hiatus in the publication of The Daily Shot. This pause will be from January 24th to at least January 26th (perhaps longer). We are committed to ensuring that our content remains as insightful and informative as ever, and we eagerly anticipate resuming publication shortly after this period.
Your understanding and support during this time is greatly appreciated.
Back to Index
The United States
1. Let’s begin with some data on the US consumer.
• Real household deposits are nearing pre-pandemic levels.
 Source: Wells Fargo Securities
• Following an initial spike after the payment holiday ended, student loan payments are rapidly trending lower.
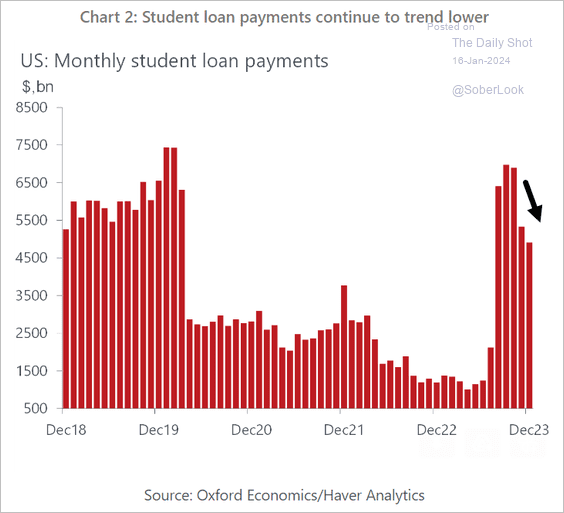 Source: Oxford Economics
• Here is a look at real household income growth this year (a forecast from Goldman).
 Source: Goldman Sachs
——————–
2. Next, we have a couple of updates on inflation.
• Sharp declines in the money supply signal slower inflation ahead.
 Source: Gavekal Research
• The Phillips Curve has been shifting lower.
 Source: Alpine Macro
——————–
3. Goldman anticipates US job gains to stabilize around 100k per month, aligning closely with the breakeven pace – the number of new jobs required to maintain a steady unemployment rate in light of labor supply growth.
 Source: Goldman Sachs
• Last year saw a record number of individuals holding multiple jobs. Yet, at 5.3% of total employment, the proportion of multiple jobholders is not exceptionally high, returning to the 2019 highs.

——————–
4. Chapter 11 filings may signal a downshift in US economic growth.
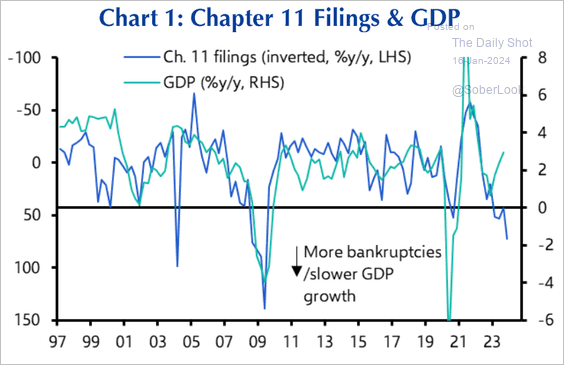 Source: Capital Economics
5. Here is a look at the share of US imports by country/region.
 Source: Hugo Ste-Marie, Portfolio & Quantitative Strategy Global Equity Research, Scotia Capital
6. The dollar has been rebounding, with the Deutsche Bank Trade Weighted Index back at its 200-day moving average.
 Source: @TheTerminal, Bloomberg Finance L.P.
Back to Index
Canada
1. Consumer confidence moved higher in recent weeks.

2. Manufacturing sales increased in November.

3. Existing home sales surged last month.

4. Next, we have some trends from the BoC’s business survey (as of Q4).
• The overall sentiment (still depressed):

• Sales expectations (a strong rebound):

• CapEx (improvement in Q4):
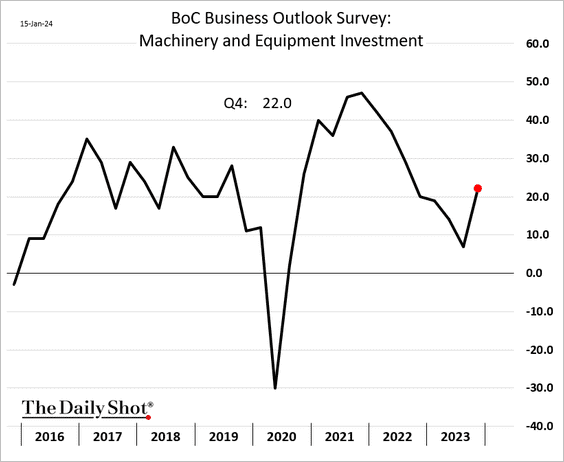
• Credit conditions (tight):

• Employment (slowing):

• No labor shortages:

• Price inflation balance (still slowing):

• Inflation expectations (elevated):

 Source: The Globe and Mail Read full article
——————–
5. Leading indicators point to slower wage growth and softer inflation ahead.
 Source: Alpine Macro
Back to Index
The Eurozone
1. Euro-area industrial output declined again in November.

2. The trade surplus has been rising.

3. Economists have downgraded their forecasts for this year’s inflation.

4. Four rate cuts this year?
 Source: @economics Read full article
5. Inflation hawks are focused on the euro area’s strong wage growth.
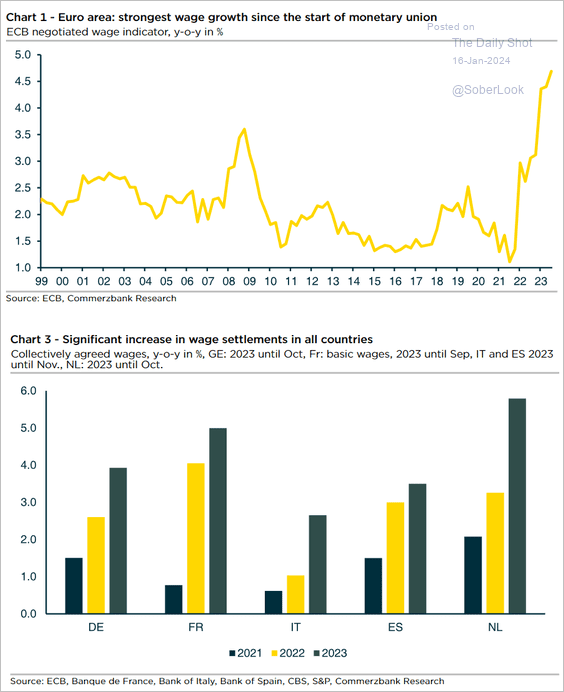 Source: Commerzbank Research
6. Germany’s economy contracted in 2023.

Back to Index
Europe
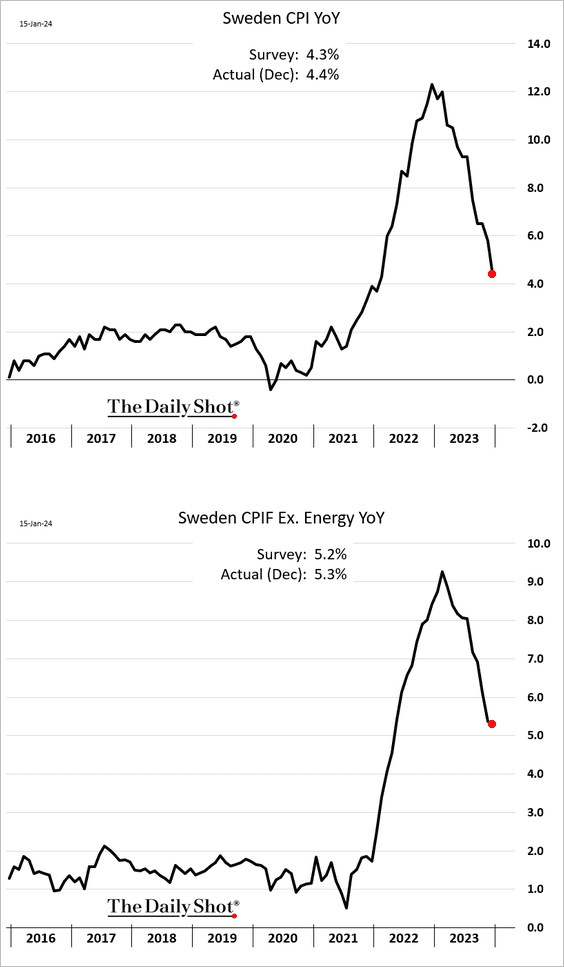
1. Sweden’s inflation report was a bit stronger than expected.
 Source: @economics Read full article
——————–
2. Here is a look at net electricity exports across the EU.
 Source: @DanielKral1, @OxfordEconomics
Back to Index
Asia-Pacific
1. Japan’s PPI hit zero last month (on a year-over-year basis).

2. Asian currencies have been weakening this year.

3. Next, we have some updates on Australia.
• Consumer confidence (still soft):

• Household spending (a sharp decline last month):

• Mortgage lending (a rebound over the past few months):

• The trade balance (an upside surprise due to softer imports):

• Wage growth (a slowdown ahead):
 Source: Capital Economics
• The Aussie dollar (falling):

Back to Index
China
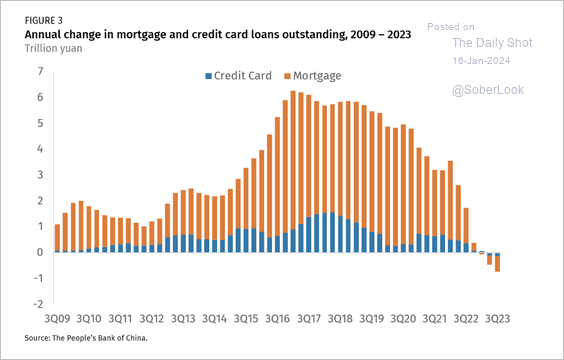
1. Household credit has been contracting, …
 Source: Rhodium Group Read full article
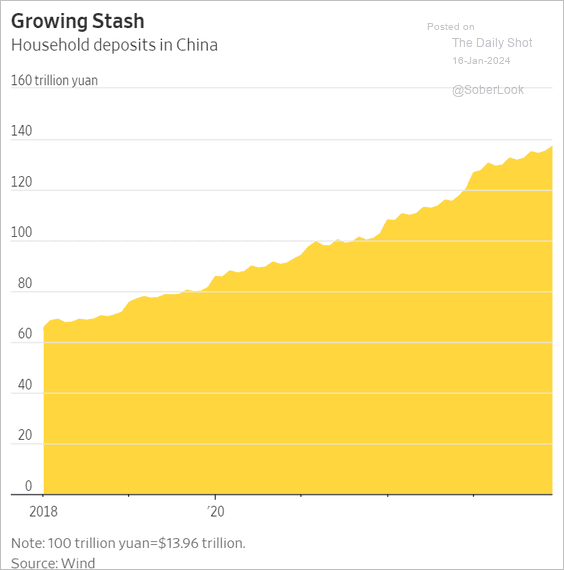
…. while household deposits continue to rise.
 Source: @WSJ Read full article
——————–
2. Investors expect weaker economic growth ahead.
 Source: BofA Global Research
3. Automobiles have been dominating exports.
 Source: Capital Economics
Back to Index
Cryptocurrency
1. BTC/USD appears overbought within its intermediate-term uptrend.

2. Previous bitcoin product launches occurred around major price peaks.
 Source: @donnelly_brent
3. Large spikes in bitcoin futures open interest also occur around price peaks.
 Source: @McClellanOsc
4. The Crypto Fear & Greed Index declined from “extreme greed” territory over the past week.
 Source: Alternative.me
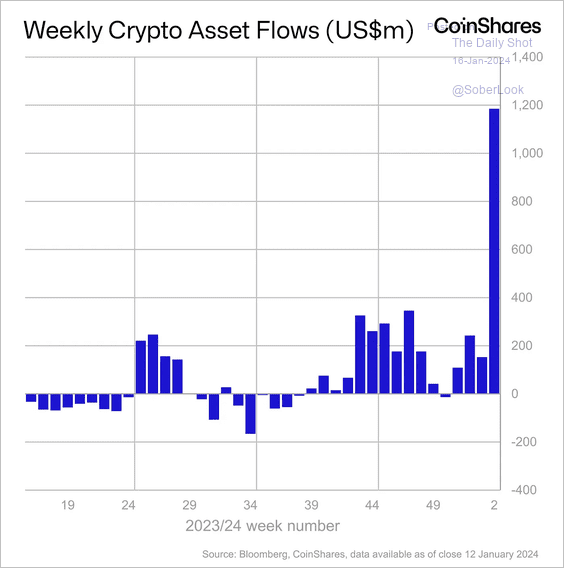
5. Crypto funds saw a near-record spike in inflows last week.
 Source: CoinShares Read full article
6. Miners’ average cost of production per bitcoin is around $37,856, according to CoinShares.
 Source: CoinShares Read full article
Back to Index
Energy
1. Demand on the Texas power grid has been surging.

2. Capital Economics expects OPEC oil output to increase from April.
 Source: Capital Economics
3. Goldman has revised its forecast for US natural gas production higher.
 Source: Goldman Sachs; @MikeZaccardi
4. European natural gas futures continue to sink amid ample supplies in storage.

5. Here is a look at renewables capacity additions.
 Source: IEA Read full article
Back to Index
Equities
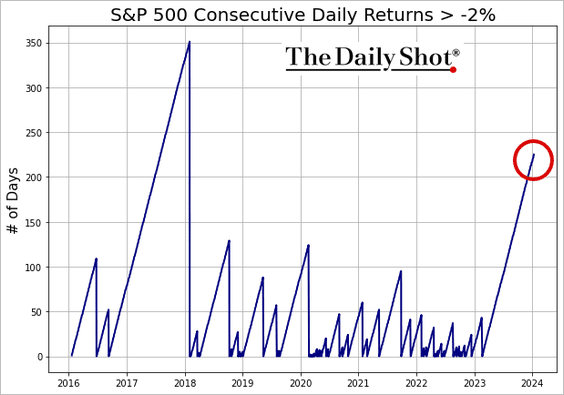
1. The S&P 500 hasn’t had a 2% down day in almost a year (225 trading sessions).
2. Investors see the tech mega-caps as the most crowded trade.
 Source: BofA Global Research
3. Fund flows have turned negative.
 Source: BNP Paribas; @WallStJesus
4. Here is a look at the S&P 500 dividend yield compared to counterparts abroad.
 Source: Goldman Sachs; @MikeZaccardi
5. Dividend growers’ valuation discount to the S&P 500 has been widening …
 Source: @TheTerminal, Bloomberg Finance L.P.
… due to the tech mega-cap distortion.
 Source: Goldman Sachs
——————–
6. Call option activity in defensive shares surged in recent weeks.
 Source: Deutsche Bank Research
7. Lagging stocks in the S&P 500 typically post their best performance around the end of the year.
 Source: Mensur Pocini; Julius Baer
8. The US value factor’s underperformance is extreme, although earnings momentum remains weak. (2 charts)
 Source: Truist Advisory Services
 Source: Truist Advisory Services
——————–
9. Implied correlations are near multi-year lows.

Back to Index
Credit
1. Last year’s bankruptcy filings hit their highest level since 2010.
 Source: S&P Global Market Intelligence
2. European leveraged loans posted stellar returns last year, matching high-yield bonds in the region and trouncing equities.
 Source: PitchBook
3. Midle-market CLO volume surged last year.
 Source: Deutsche Bank Research
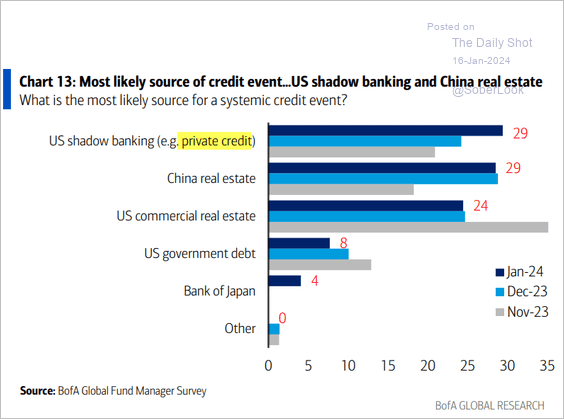
4. Investors are concerned about private credit.
 Source: BofA Global Research
5. Most US public finance sectors continue to benefit from their post-pandemic liquidity boost.
 Source: Breckinridge Capital Advisors Read full article
• US public sector unfunded pension liabilities continue to decline as a percentage of GDP.
 Source: Breckinridge Capital Advisors Read full article
• State general fund revenue is expected to drop by nearly 2% this year.
 Source: Breckinridge Capital Advisors Read full article
Back to Index
Rates
1. The Fed’s reverse repo facility balance continues to shrink as money market funds find higher-yielding opportunities in private markets (T-bills, private repo).

2. Here is a look at the Fed’s balance sheet.
 Source: Oxford Economics
3. Goldman sees Fed rate cuts starting in March.
 Source: Goldman Sachs
Back to Index
Global Developments
1. Most central banks have paused rate hikes after an aggressive tightening phase.
 Source: @topdowncharts
2. Speculative accounts remain bearish on the US dollar.
 Source: Morgan Stanley Research; @dailychartbook
3. This chart shows CapEx trends for the US, Germany, and Japan.
 Source: BofA Global Research
——————–
Food for Thought
1. What’s keeping Americans from buying an EV?
 Source: @CivicScience Read full article
2. Poverty rates:
 Source: Census Bureau Read full article
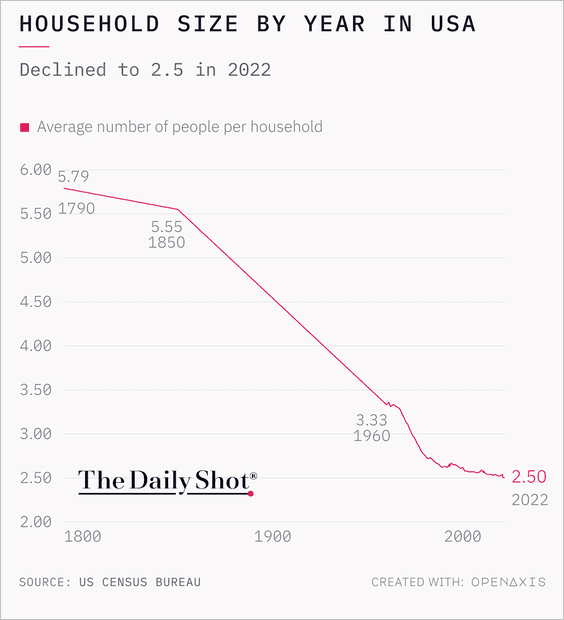
3. US household size over time:
 Source: @TheDailyShot
4. Gen Z and STEM:
 Source: Gallup Read full article
5. Teacher shortages:
 Source: @financialtimes Read full article
6. Wealthier, better-educated Russians are more supportive of Putin’s war.
 Source: The Economist Read full article
7. Pedestrian death rates:
 Source: The New York Times Read full article
8. Antisemitic incidents:
 Source: ADL
9. How long does it take to put on makeup?
 Source: YouGov
——————–
Back to Index
