
The Daily Shot: 18-Jan-24
• The United States
• The United Kingdom
• The Eurozone
• Japan
• Australia
• China
• Emerging Markets
• Commodities
• Equities
• Credit
• Global Developments
• Food for Thought
As a reminder, there will be a brief hiatus in the publication of The Daily Shot due to a necessary medical procedure. This pause will be from January 24th to at least January 26th (perhaps longer). We are committed to ensuring that our content remains as insightful and informative as ever, and we eagerly anticipate resuming publication shortly after this period.
Your understanding and support during this time is greatly appreciated.
The United States
1. The December retail sales report topped expectations.

 Source: Reuters Read full article
• Vehicle sales increased again.

• Growth in online sales remains robust.

• Here are the contributions.
 Source: @TheTerminal, Bloomberg Finance L.P.
• “Core” retail sales also surpassed economists’ forecasts (2 charts).
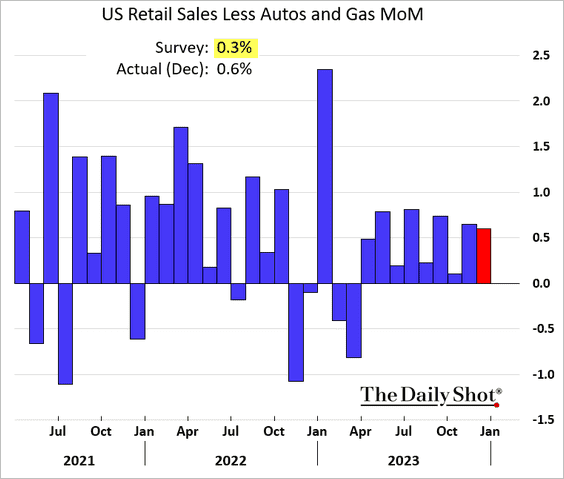

• Real retail sales have been trending higher in recent months.

——————–
2. Treasury yields climbed in response to the retail sales report, …

… as the market further repriced Fed rate cut expectations.

——————–
3. The GDPNow estimate for Q4 growth was revised upwards following the retail sales data release.
 Source: Federal Reserve Bank of Atlanta
Here are the contributions showing an increase in goods consumption estimate (PCE Goods).
 Source: @TheTerminal, Bloomberg Finance L.P.
——————–
4. Industrial production in December registered a slight rise, attributed mainly to a downward revision in November’s figures. Industrial production would have remained unchanged from the previous month without this revision.

Overall, 2023 was a tough year for the nation’s manufacturing sector.

Factory output got a boost from vehicle production in December.

 Source: @economics Read full article
——————–
5. Last week, mortgage applications held at their lowest levels in years, …

… approximately 35% below the nine-year average.

This chart shows the rate lock count.
 Source: AEI Housing Center
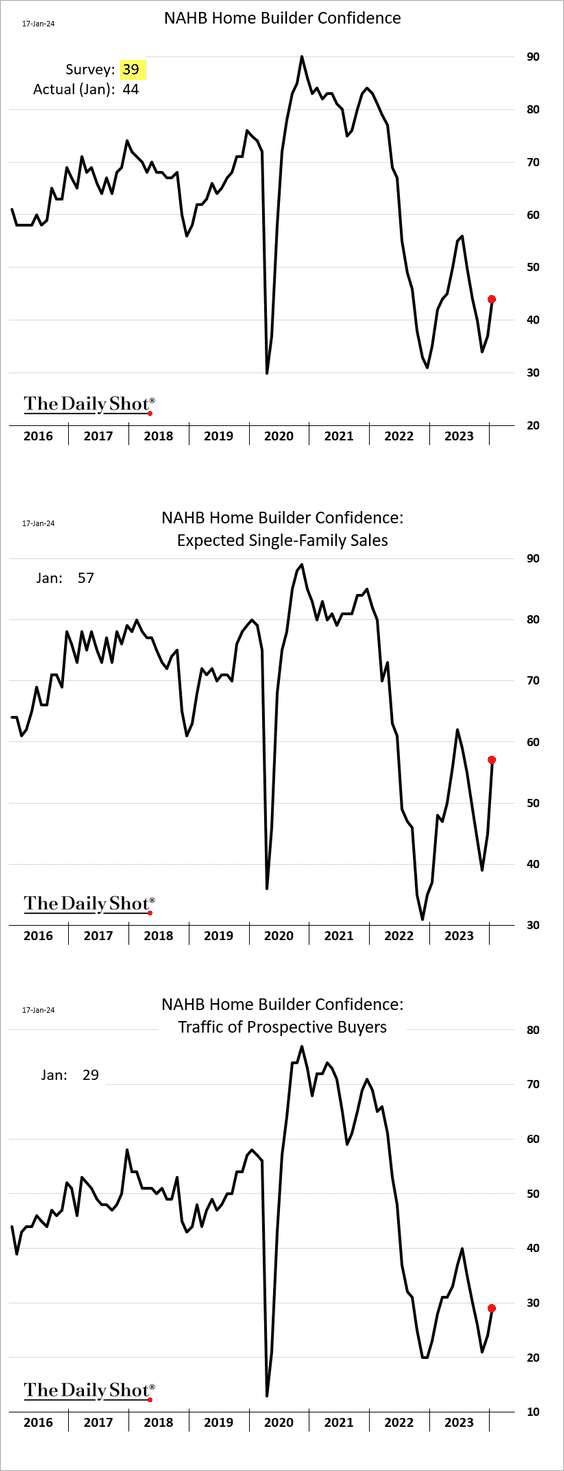
6. Homebuilder sentiment improved again this month.
 Source: CNBC Read full article
——————–
7. This month’s Beige Book report from the Fed was slightly more upbeat, …
 Source: Oxford Economics
… with fewer mentions of slowdown/recession.
 Source: Oxford Economics
Is it signaling stronger economic activity ahead?
 Source: @RenMacLLC
——————–
8. Import prices held below 2022 levels last month.

Back to Index
The United Kingdom
1. The CPI report topped expectations (2 charts).


 Source: Reuters Read full article
• Services CPI remains elevated.

• Retail inflation continues to moderate.

• Clothing CPI is holding above 6%.

• Here is a look at the contributions to the CPI.
 Source: @TheTerminal, Bloomberg Finance L.P.
——————–
2. Home prices continued to decline in November.

 Source: @financialtimes Read full article
• But survey data signaled a housing market improvement in December, with the RICS index topping expectations.

 Source: @economics Read full article
• Sales-to-stock ratio:

• Sales expectations:

——————–
3. Here is a look at the latest polls.
 Source: The Telegraph Read full article
Back to Index
The Eurozone
1. This chart shows the contributions to the euro-area CPI.
 Source: @TheTerminal, Bloomberg Finance L.P.
2. The French budget deficit widened further in November.

3. European net equity issuance plunged last year.
 Source: Goldman Sachs; @MikeZaccardi
Back to Index
Japan
1. Machinery orders tumbled in November.

 Source: Reuters Read full article
——————–
2. With unit labor costs rising, almost all of the increase in the GDP deflator over the past year reflects rising profit margins.
 Source: Capital Economics
3. Foreigners were loading up on Japanese stocks last week.

4. The elderly dependency ratio is expected to keep climbing.
 Source: OECD Read full article
Back to Index
Australia
1. Full-time employment unexpectedly tumbled last month.
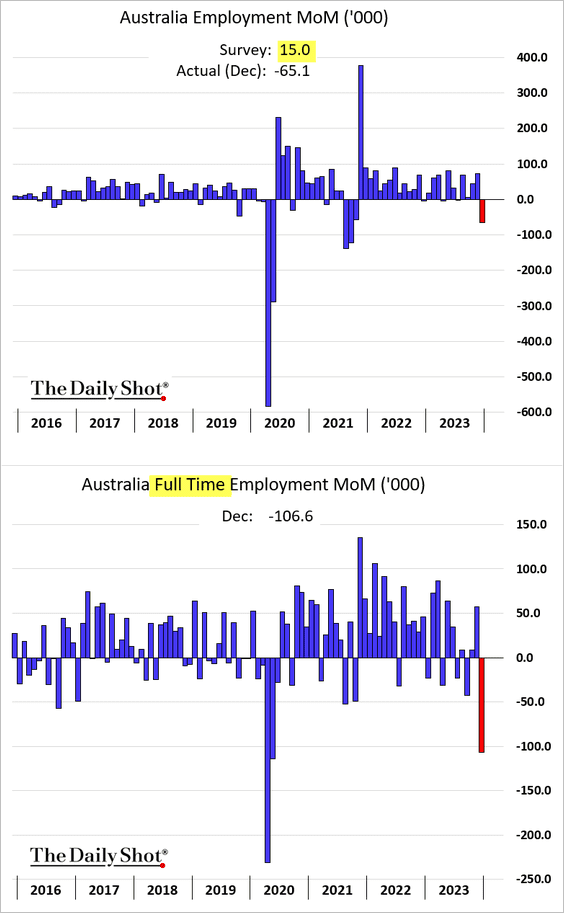
But the unemployment and underemployment rates held steady.

 Source: @WSJ Read full article
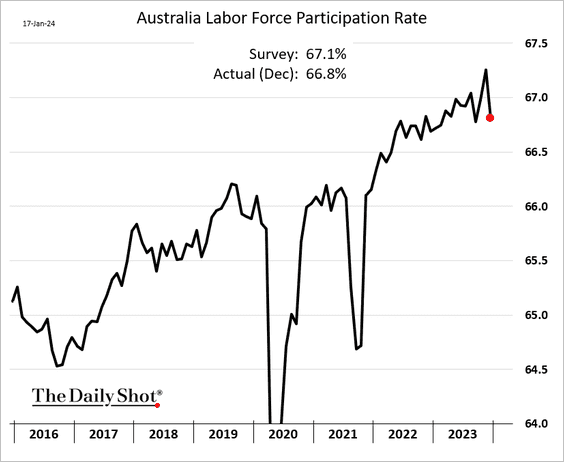
• Labor force participation declined.
• Job ads remain above pre-COVID levels.
 Source: @ANZ_Research
——————–
2. Inflation expectations held steady this month.

3. The Aussie dollar declined again.

Back to Index
China
1. Last year’s nominal GDP growth was the lowest since “The Great Reform” during the late 1970s.
 Source: Deutsche Bank Research
2. Construction activity remains depressed amid funding challenges and soft demand.
 Source: @MacroKova
3. Dollar bond issuance is off to a weak start.
 Source: Wei Zhou, Bloomberg Read full article
4. Here is a look at loan growth for households and businesses.
 Source: Capital Economics
5. The rise in local government special-purpose bond issuance could support further infrastructure spending.
 Source: BCA Research
Back to Index
Emerging Markets
1. Brazil’s real retail sales edged higher in November.

2. Argentina’s leading indicator tumbled last month.

3. South Africa’s retail sales showed a modest improvement in November.

Back to Index
Commodities
1. CTAs have trimmed their net-short positions in copper.
 Source: Deutsche Bank Research
2. Orange juice prices continue to retreat (now deep in bear market territory).

3. How correlated are different commodity markets to the S&P 500 and the US dollar?

Back to Index
Equities
1. The S&P 500 has been holding resistance at 4800.
 Source: @TheTerminal, Bloomberg Finance L.P.
2. Market breadth started deteriorating in recent days, …
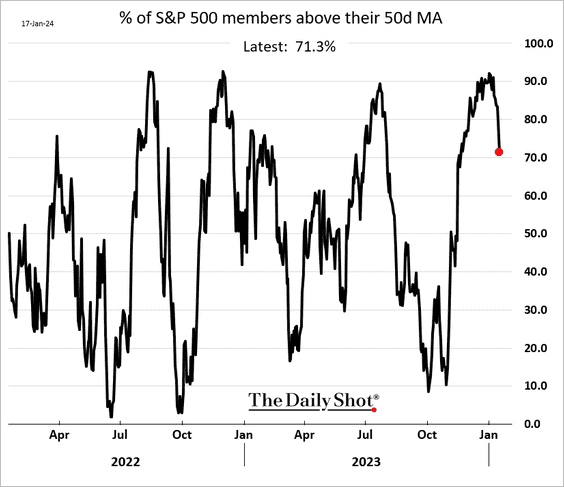
… after bond yields bottomed.
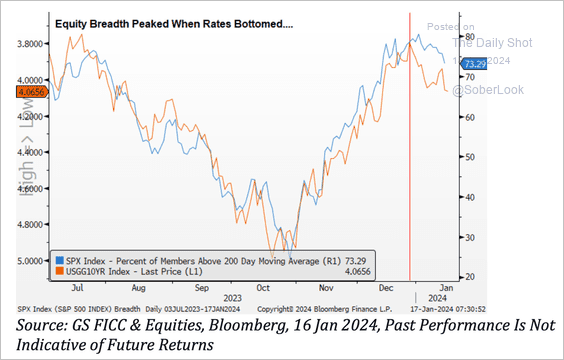 Source: Goldman Sachs; @dailychartbook
Here is the Russell 3000 (broad market) breadth.
 Source: Aazan Habib, Paradigm Capital
——————–
3. Speculative stocks have been struggling in 2024.

4. Retail investors shifted from ETFs to single-stock purchases this year.
 Source: Vanda Research
5. Bearish positioning in defensive sectors (healthcare and utilities) appears stretched. (2 charts)
 Source: Deutsche Bank Research
 Source: Deutsche Bank Research
——————–
6. Here is a look at regional valuations.
 Source: Goldman Sachs; @MikeZaccardi
7. The pandemic era has been marked by the inverse correlation between equity valuations and interest rate volatility.
 Source: @TheTerminal, Bloomberg Finance L.P.; h/t Morgan Stanley, @dailychartbook
8. Starting in the mid-1960s (amid elevated rates and inflation), the equity market was stuck in a range for nearly two decades.
 h/t BofA Global Research
Here is the number of trading days it took the S&P 500 to reach its prior all-time high.
 Source: S&P Dow Jones Indices
Back to Index
Credit
1. Credit spreads have been remarkably resilient,…

… showing much less stress than the Treasury curve.
 Source: SG Cross Asset Research; @WallStJesus
——————–
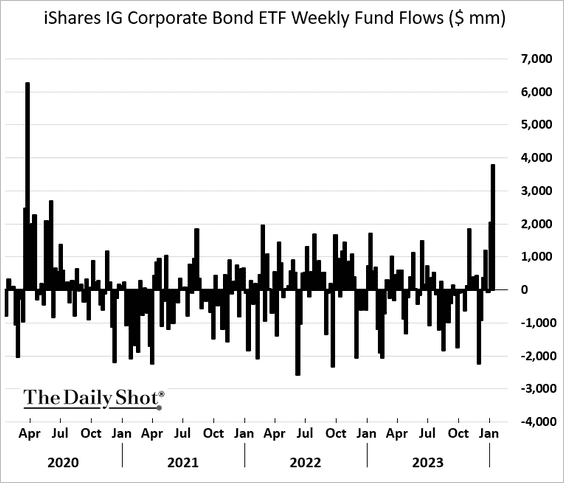
2. Investment-grade bond funds have been seeing robust inflows.
3. Here is a look at the maturity wall for small-cap borrowers.
 Source: SG Cross Asset Research; @WallStJesus
Back to Index
Global Developments
1. How do companies plan to de-risk supply chains?
 Source: BCA Research
2. What do investors see as the biggest tail risk?
 Source: BofA Global Research
——————–
Food for Thought
1. Percentage of US households that own stocks:
 Source: @WSJ Read full article
2. Streaming subscriptions:
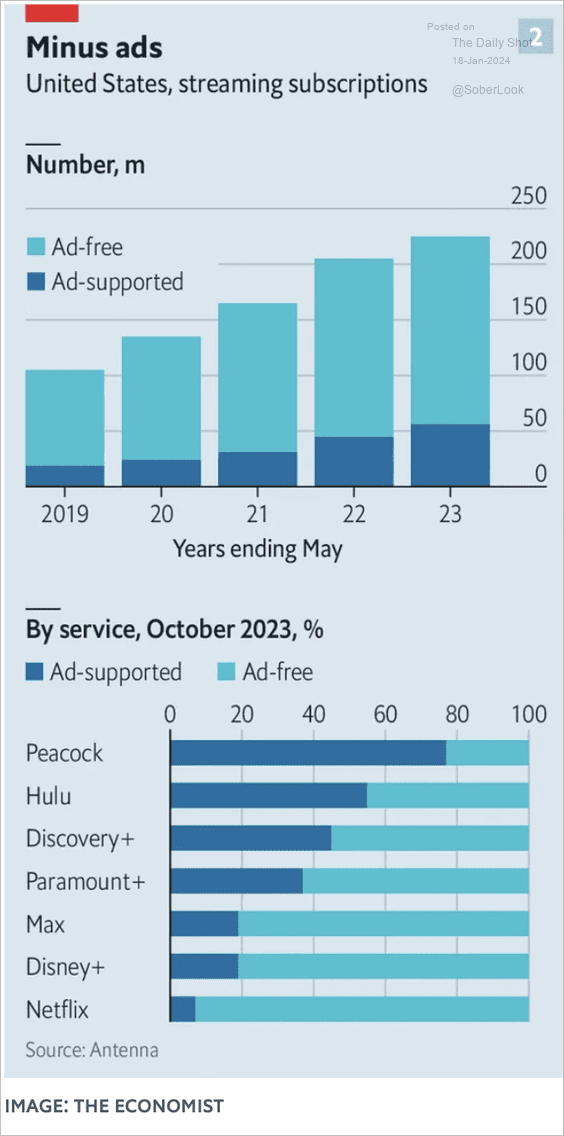 Source: The Economist Read full article
3. Vehicles with the smallest five-year depreciation:
 Source: Visual Capitalist Read full article
4. Price gains at restaurants (“food away from home”) relative to grocery stores (“food at home”):
 Source: BofA Global Research; @MikeZaccardi
5. Unmarried US 40-year-olds:
 Source: Statista Read full article
6. A downtrend in US college enrollment over the past decade:
 Source: Capital Economics
7. US meat consumption per capita:
 Source: @WSJ Read full article
8. The most popular Wordle opening words:
 Source: The New York Times Read full article
——————–
Back to Index