
The Daily Shot: 07-Jul-21
• The United States
• Canada
• The Eurozone
• Europe
• Asia – Pacific
• China
• Emerging Markets
• Cryptocurrency
• Commodities
• Energy
• Equities
• Rates
• Global Developments
• Food for Thought
The United States
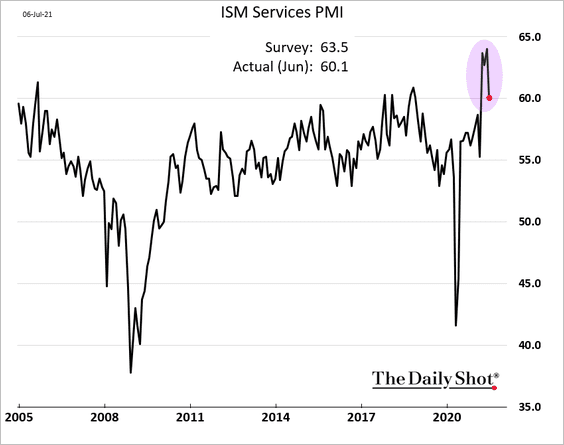
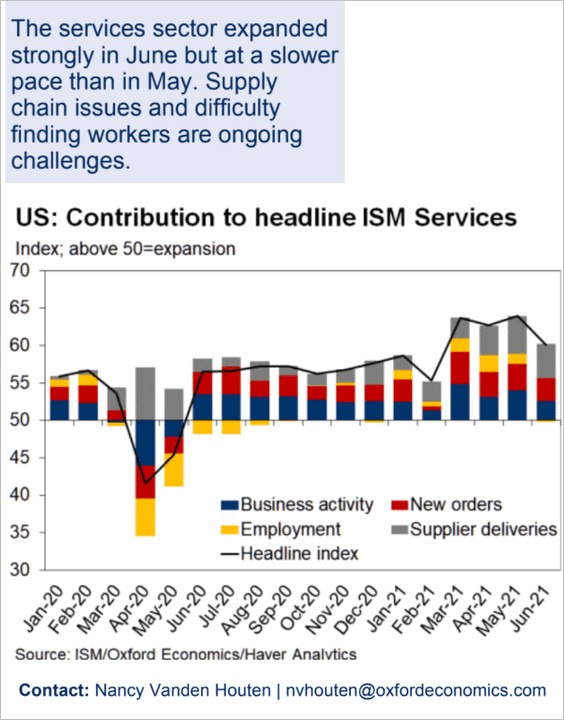
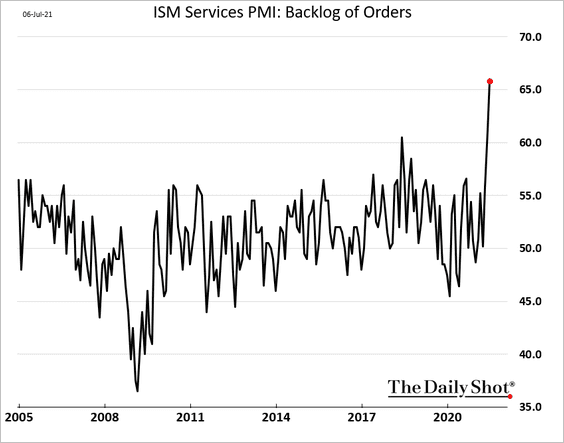
1. The ISM Services PMI came off the highs, surprising to the downside. To be sure, US service sector activity continued to expand at a healthy pace in June, but growth was slower than in May.
 Source: Oxford Economics
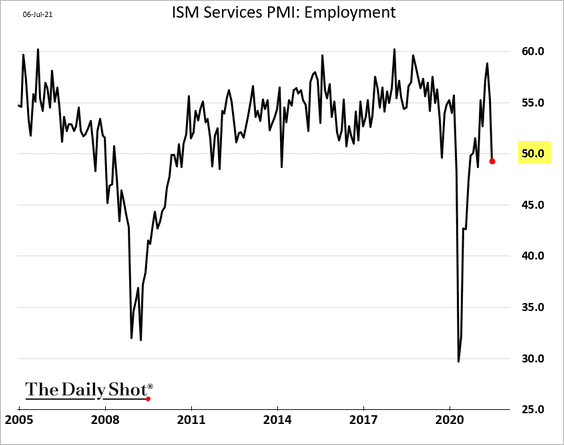
• The employment index dipped into contraction territory (PMI < 50).
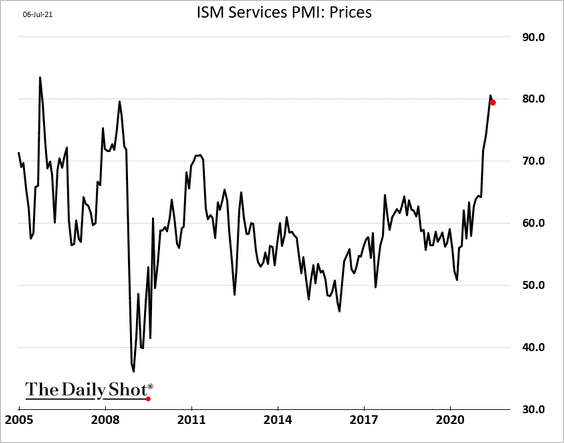
• Prices continued to climb, but a touch slower.
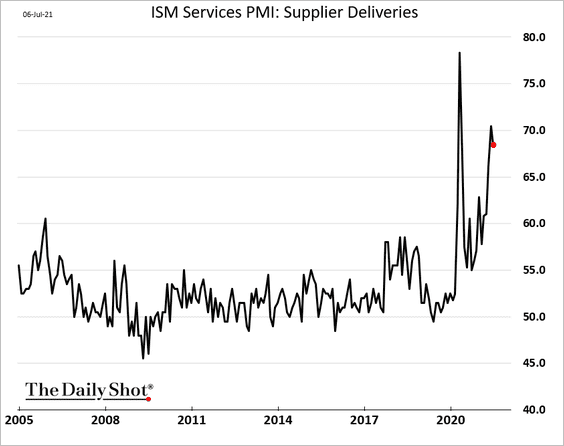
• Service firms, particularly retailers, are struggling to fill orders, …
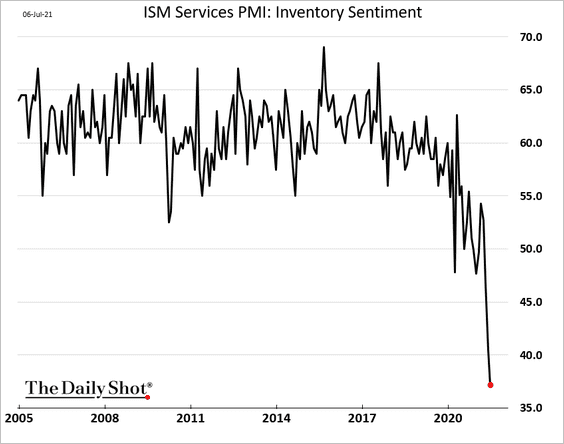
… amid supply bottlenecks (slow deliveries) …
… and extraordinarily tight inventories.
——————–
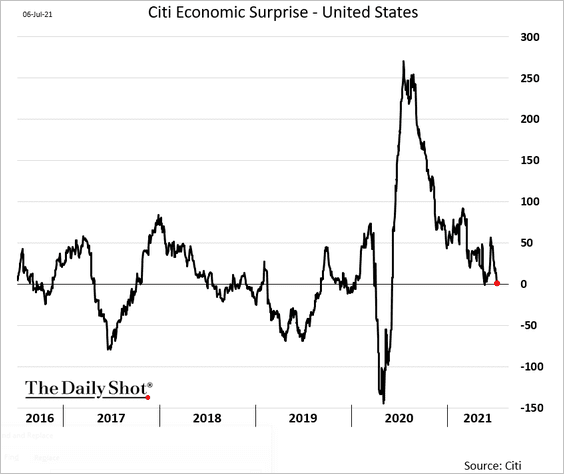
2. The Citi Economic Surprise Index is back near zero due to the ISM data miss.
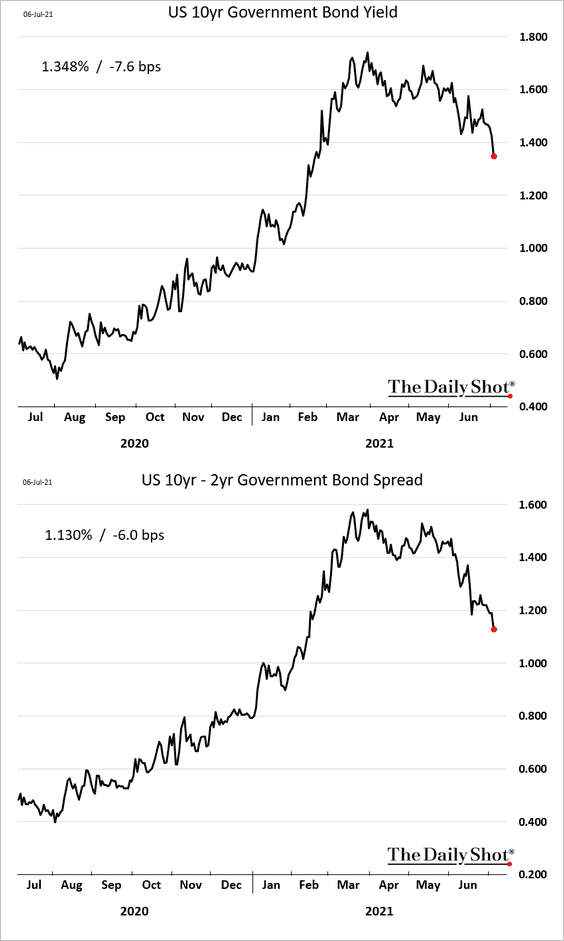
3. Treasury yields tumbled, and the curve flattened. Bond yields around the world followed (see the rates section). It wasn’t entirely clear just how much of the Treasury rally and the downshift in risk sentiment on Tuesday was due to the disappointing ISM report.
 Source: CNBC Read full article
——————–
4. Given the urgent demand for labor in many areas, more workers should be coming off unemployment.
![]() Source: @PIIE Read full article
Source: @PIIE Read full article
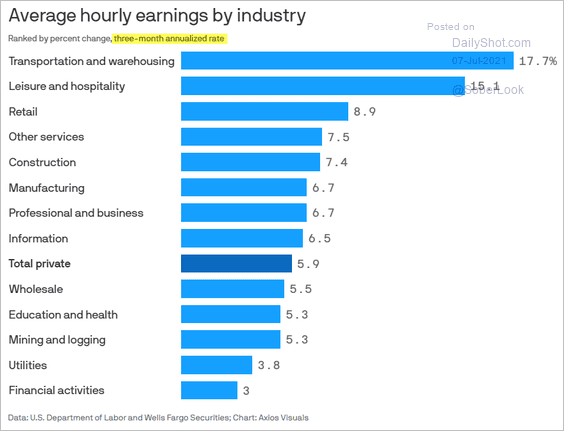
5. The following chart shows the change in wages by industry over the past three months.
 Source: @axios Read full article
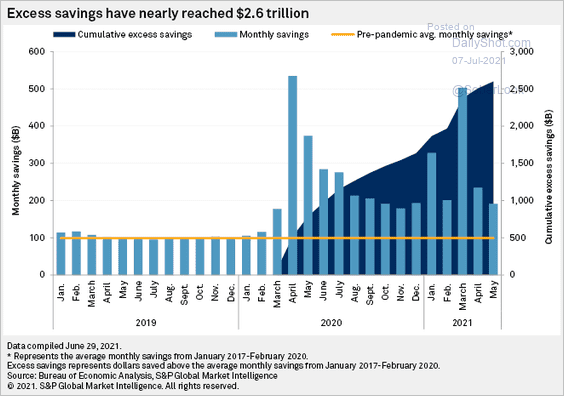
6. Excess household savings are nearing $2.6 trillion.
 Source: S&P Global Market Intelligence
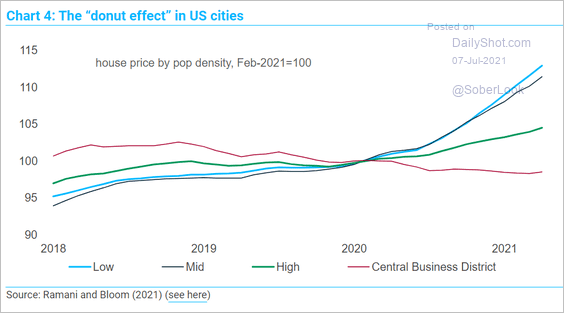
7. Property price trends continue to show the “donut effect” as housing demand shifts toward suburban areas (2 charts).
 Source: TS Lombard
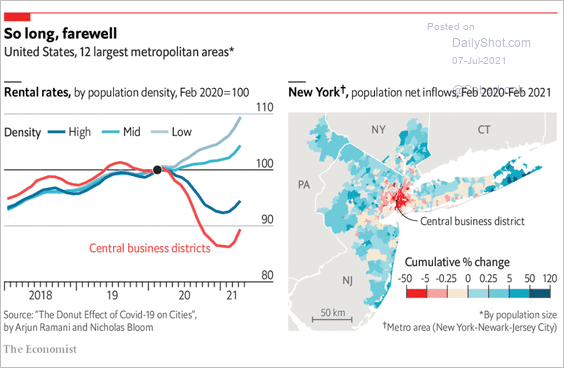 Source: The Economist Read full article
——————–
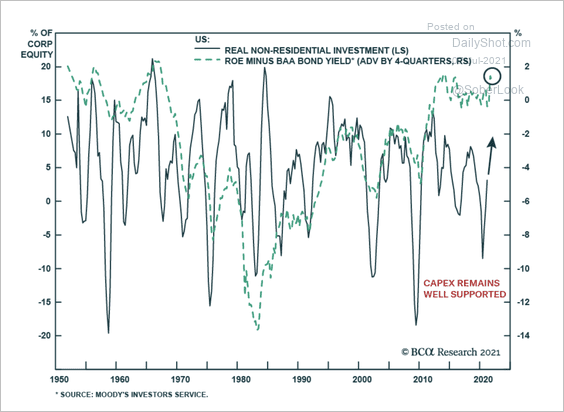
8. The gap between the return on capital and the cost of capital is incentivizing businesses to invest (see Morgan Stanley’s CapEx expectations chart).
 Source: BCA Research
Back to Index
Canada
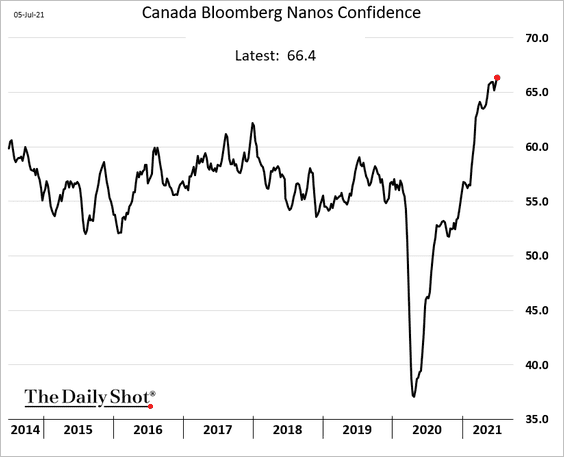
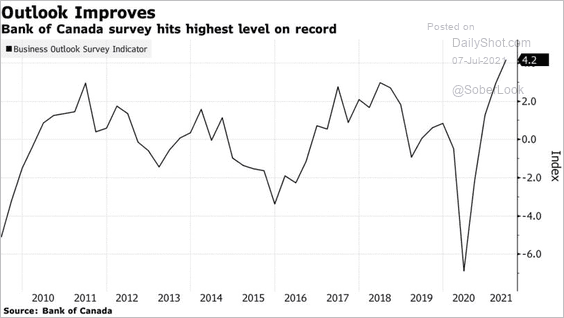
Consumer and business confidence indicators are hitting multi-year highs.
 Source: @markets Read full article
Back to Index
The Eurozone
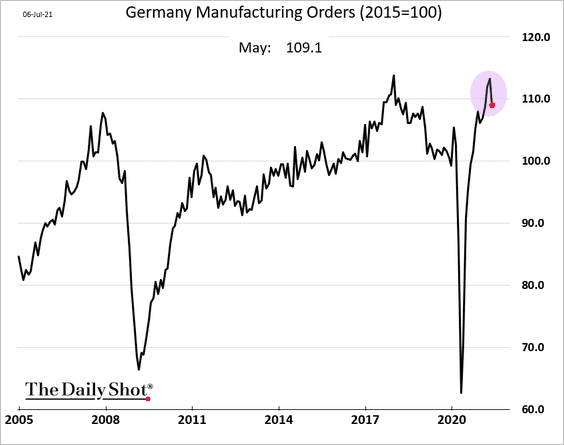
1. Let’s begin with Germany.
• Manufacturing orders unexpectedly declined in May.
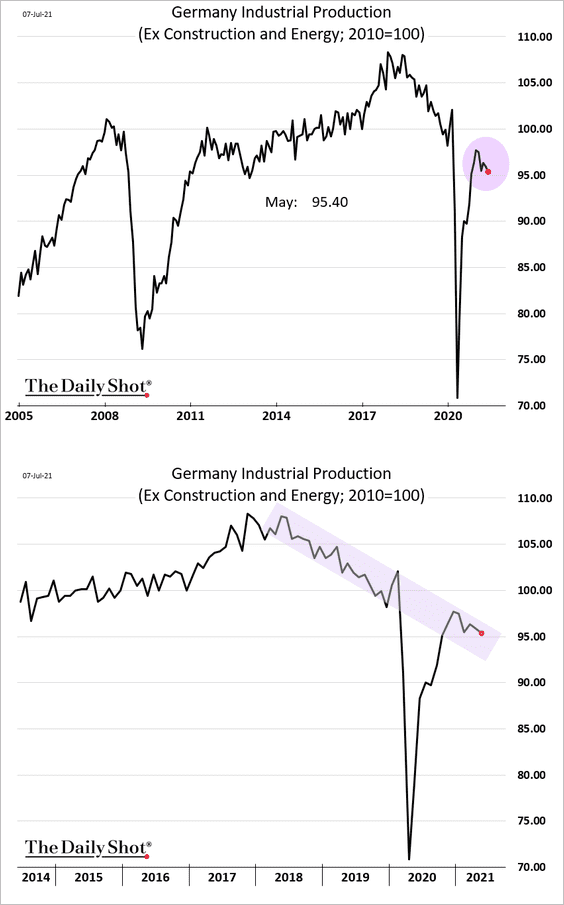
And industrial production continued to shrink. While some attribute this weakness to supply-chain problems, it’s worth noting that the downtrend started in 2018 (2nd chart).
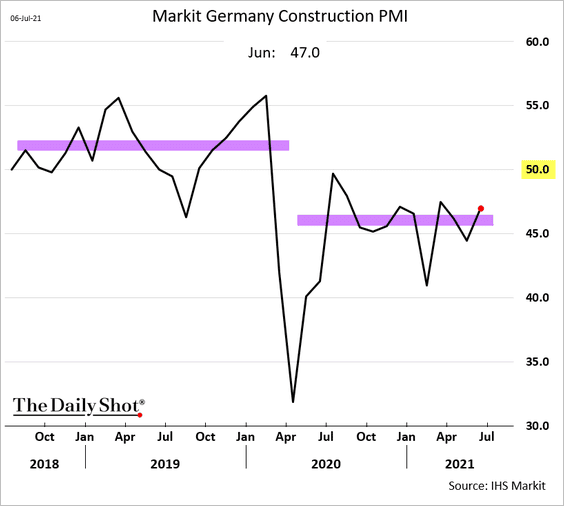
• Construction activity continues to shrink (PMI < 50).
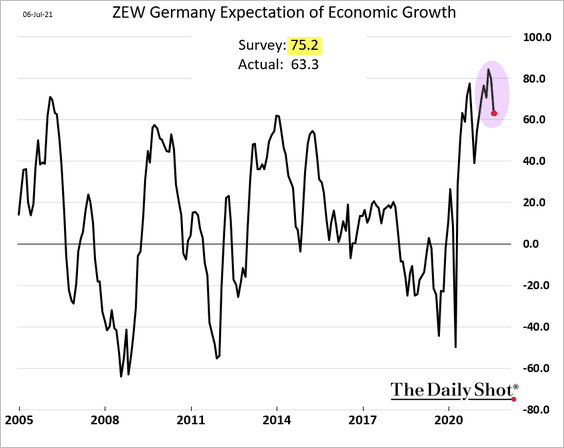
• The ZEW expectations index surprised to the downside.
 Source: Bloomberg Read full article
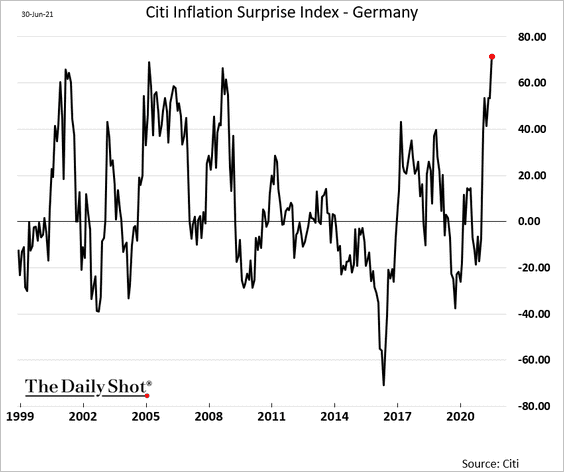
• The Citi Inflation Surprise Index hit a record high.
——————–
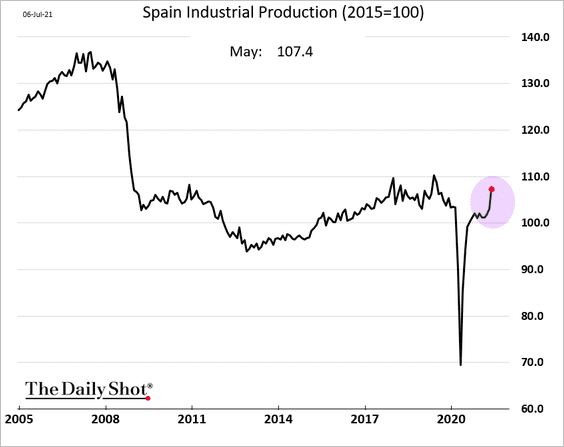
2. Spain’s industrial production is now well above pre-COVID levels.
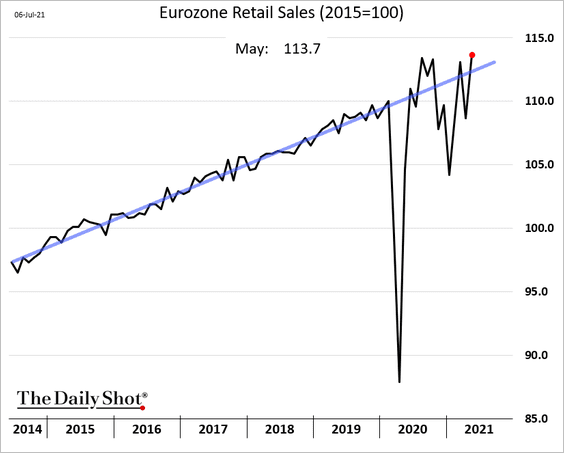
3. Euro-area retail sales were back above trend in May.
 Source: IHS Markit
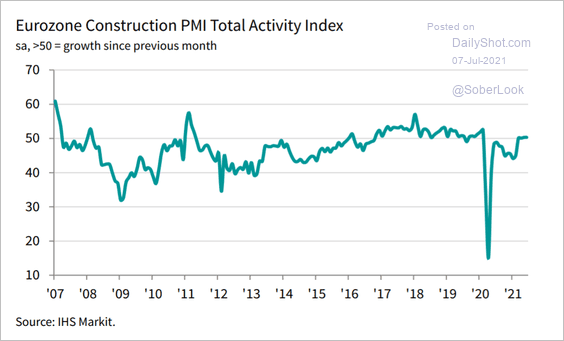
4. Construction activity at the Eurozone level is stable but not growing (PMI = 50).
 Source: ANZ Research
5. The ECB will begin tapering later this year.
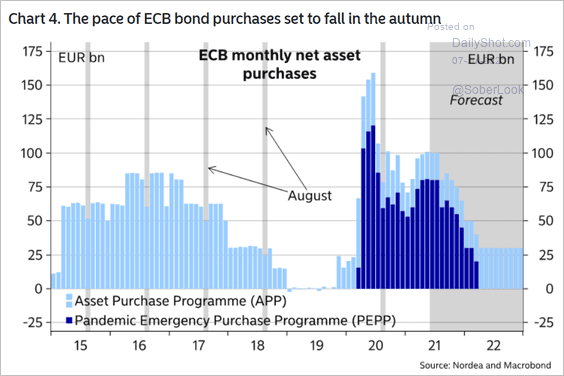 Source: Nordea Markets
6. The TLTRO program (attractive ECB financing for banks) more than offset the cost of negative rates on excess reserves.
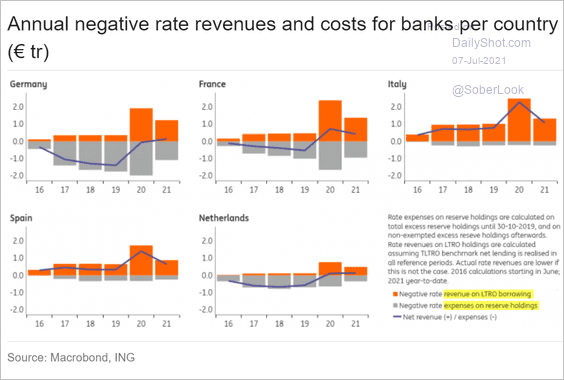 Source: ING
7. Negative corporate loan flows (declines in business loan balances) have been concentrated in France and Spain.
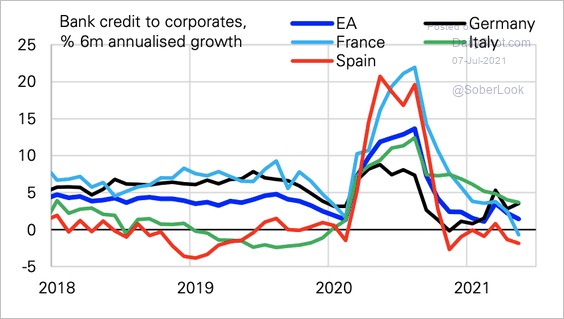 Source: Deutsche Bank Research
Back to Index
Europe
1. Online search data point to a strong rebound in retail and recreation mobility.
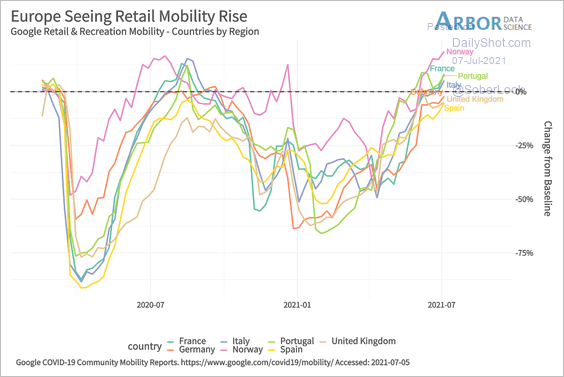 Source: Arbor Research & Trading
2. Which invoicing currencies are most commonly used for EU imports and exports?
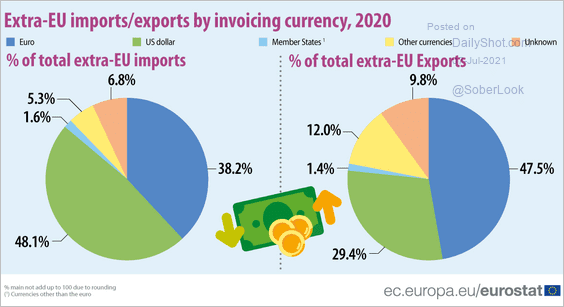 Source: Eurostat Read full article
3. Next, we have some data on Western Europe’s younger population.
• Youth unemployment in the EU:
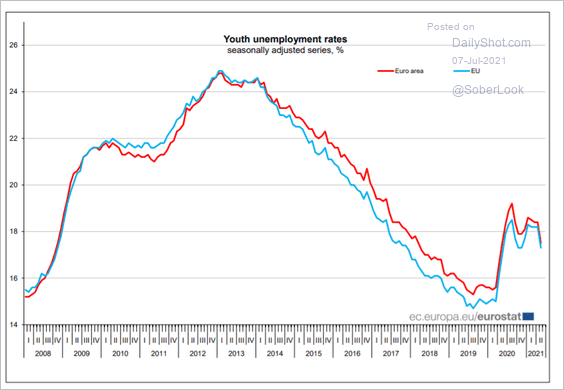 Source: Eurostat Read full article
• Opportunities for new graduates:
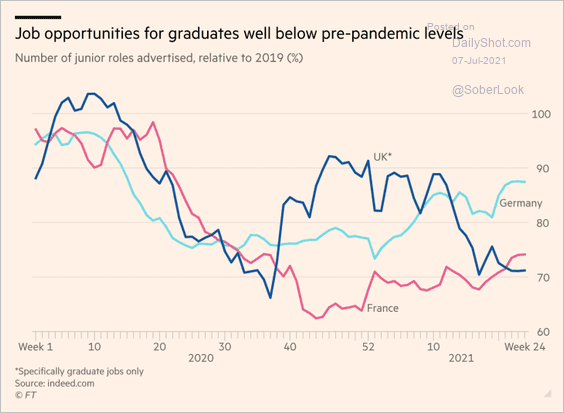 Source: @financialtimes Read full article
• Millenials with tertiary educational attainment:
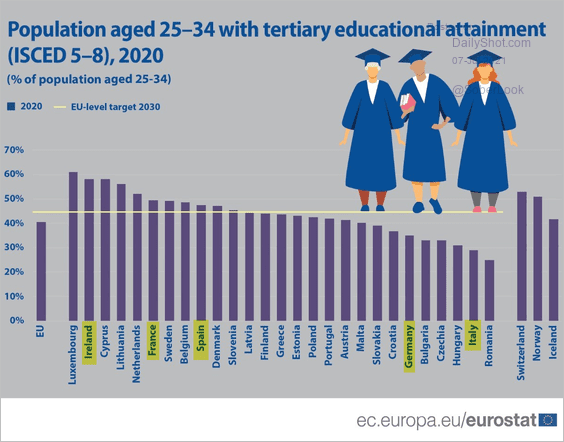 Source: Eurostat Read full article
• According to Eurostat, “In 2020, 9.9 % of 18-24-year-olds in the EU had completed at most a lower secondary education and were not in further education or training.”
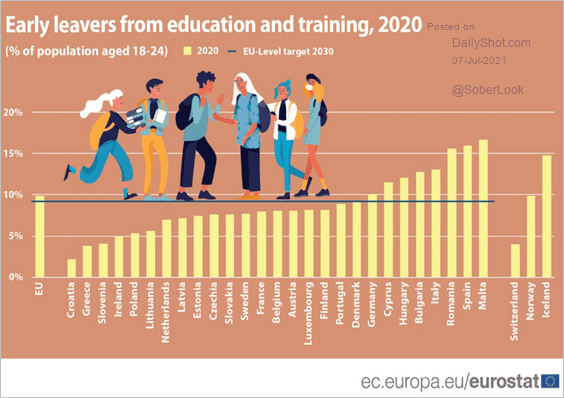 Source: Eurostat
Back to Index
Asia – Pacific
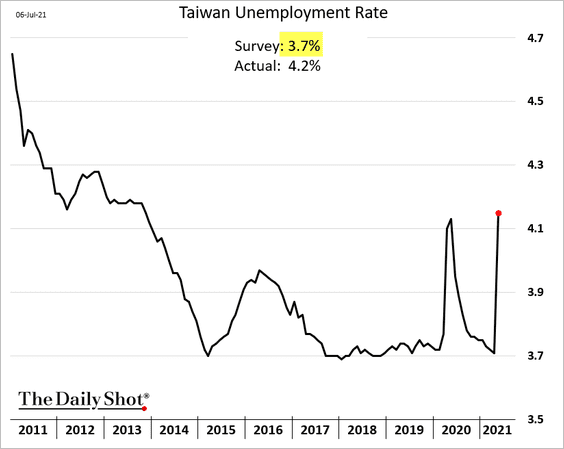
1. Taiwan’s unemployment rate surged in May.
 Source: Reuters Read full article
——————–
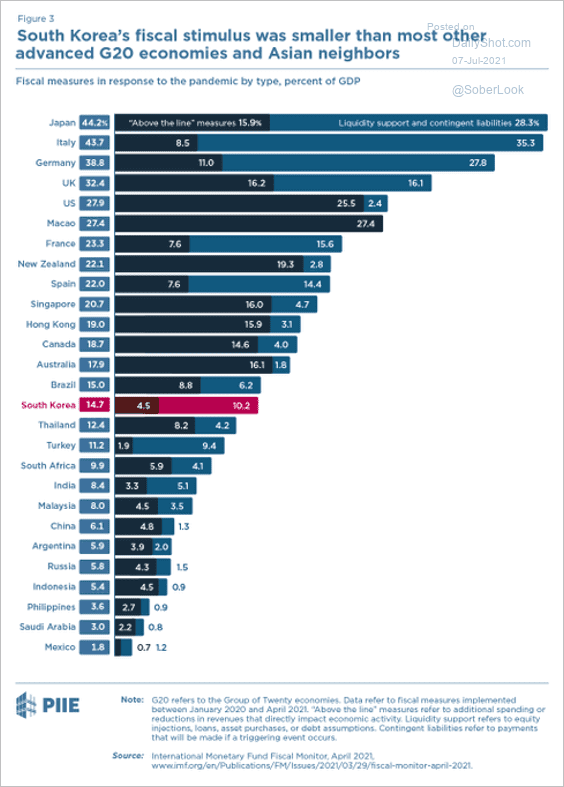
2. South Korea’s fiscal stimulus was smaller than what we saw in other economies.
 Source: @PIIE, @jfkirkegaard Read full article
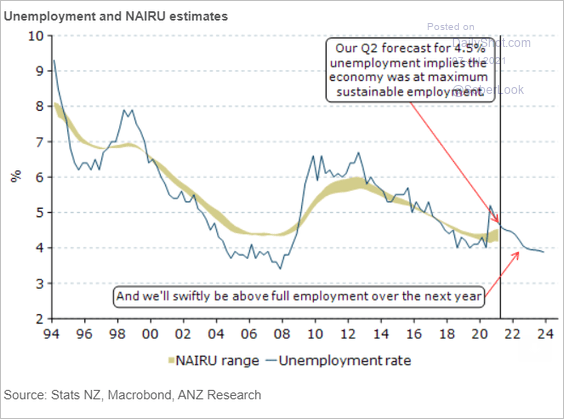
3. New Zealand is approaching full employment. Rate hikes are coming this year.
 Source: ANZ Research
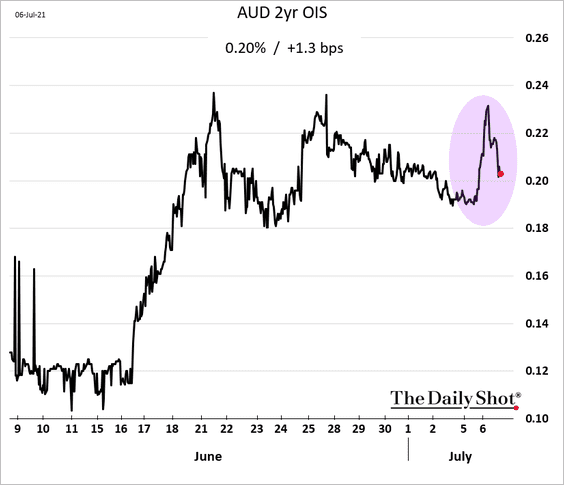
4. The RBA has set the stage for removing some accommodation.
 Source: ING Read full article
But the market wasn’t impressed. The increase in yields was short-lived.
Back to Index
China
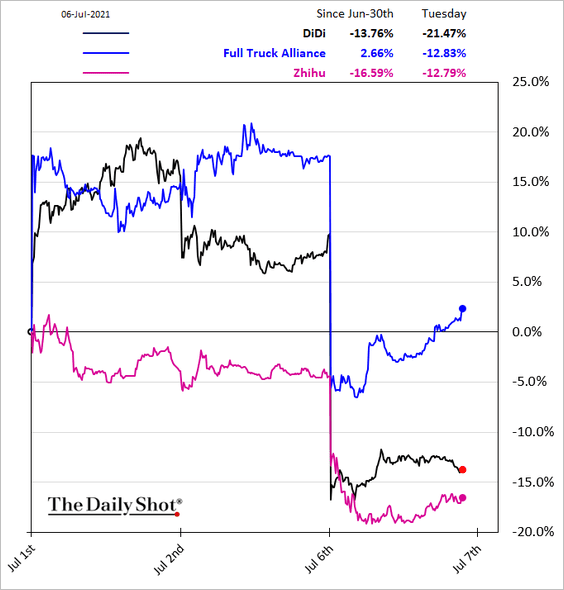
1. Beijing’s aggressive stance on DiDi may sap demand for China’s equity listings abroad.
 Source: @WSJ Read full article
Recently-listed US shares of Chinese companies took a hit.
——————–
2. Banks are revising the ceilings on rates offered to depositors.
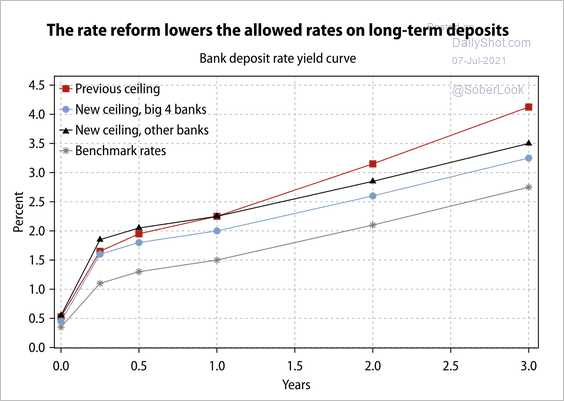 Source: Gavekal Research
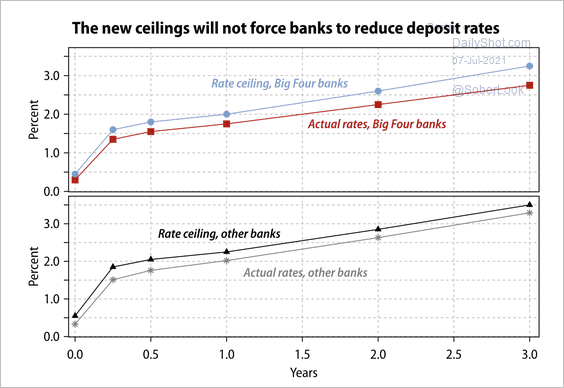 Source: Gavekal Research
——————–
3. Domestic rates remain low despite the pullback in stimulus.
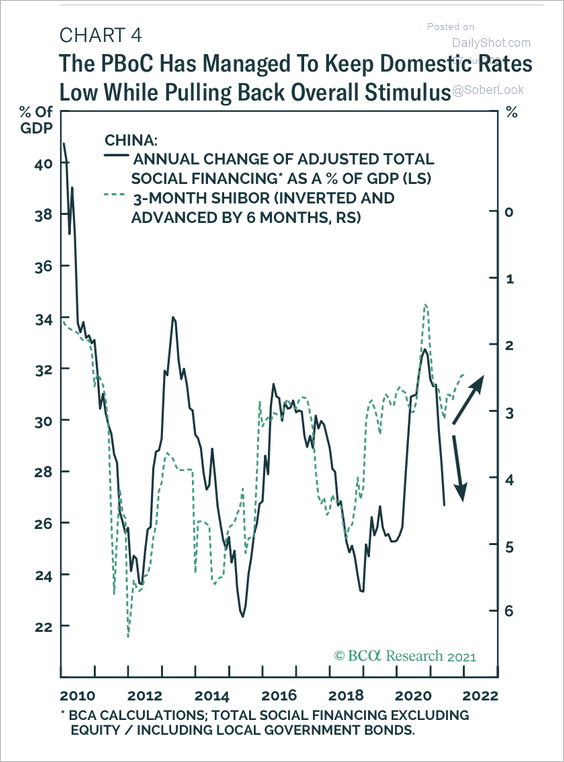 Source: BCA Research
4. BCA Research expects credit growth to stabilize later this year.
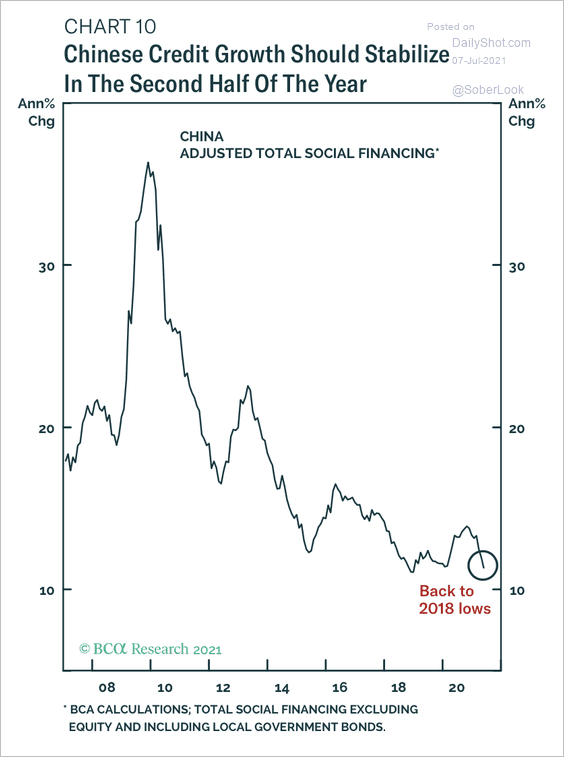 Source: BCA Research
5. This chart shows the contributions to China’s GDP growth.
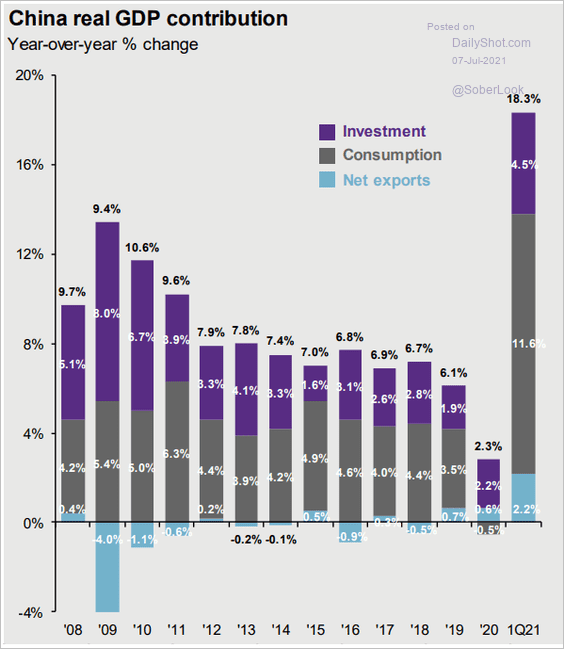 Source: @JPMorganAM
6. Steel producer earnings grew over the past quarter while coal weakened.
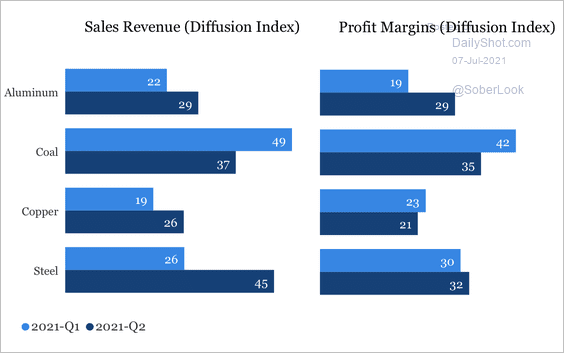 Source: China Beige Book
Back to Index
Emerging Markets
1. Many EM central banks are starting to raise rates (2 charts).
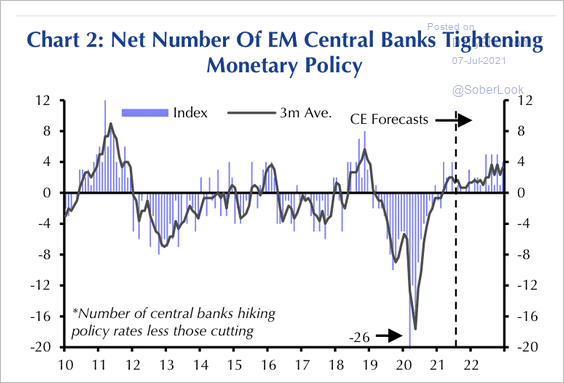 Source: Capital Economics
 Source: Capital Economics
——————–
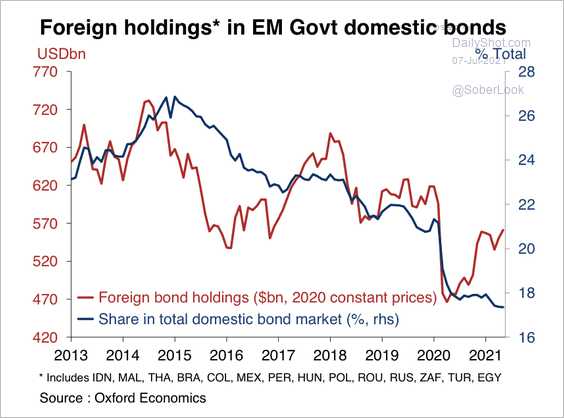
2. Foreign exposure to EM bonds has risen over the past year. However, foreign investors’ share in local EM bond markets has been declining since 2015. This is mainly due to EM countries issuing debt at a faster pace than foreign investors are willing/able to absorb, according to Oxford Economics.
 Source: Oxford Economics
• This chart shows foreign investors’ holdings of local government bonds.
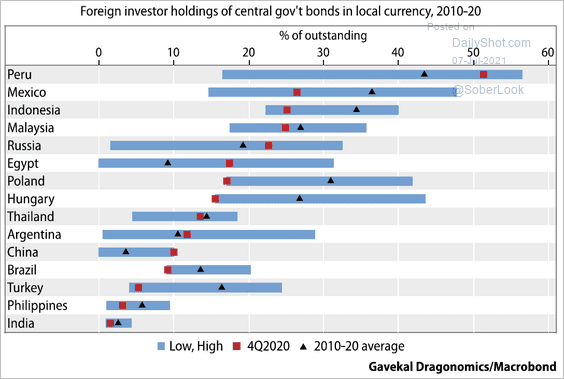 Source: Gavekal Research
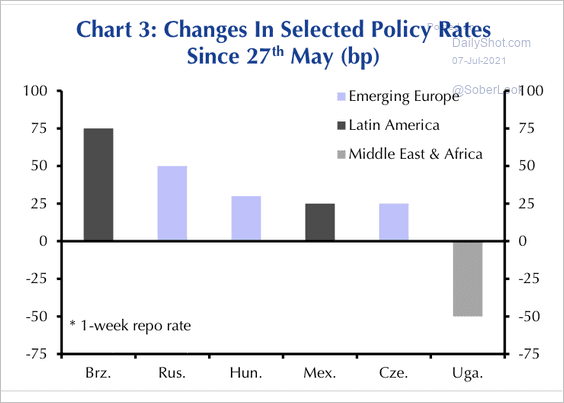
• Political risks have pushed up local-currency bond yields across Latin America.
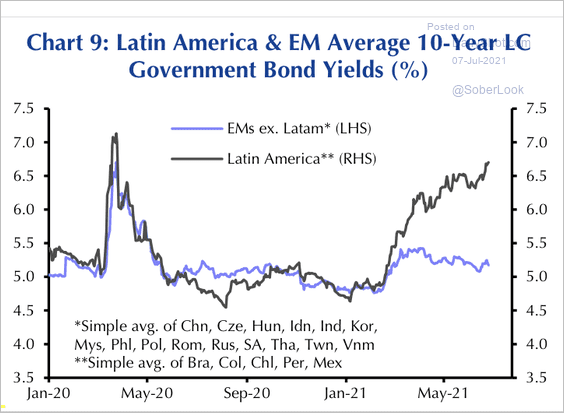 Source: Capital Economics
——————–
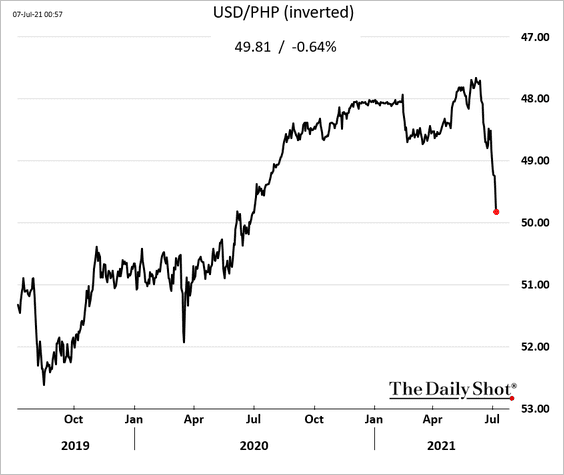
3. The Philippine peso continues to weaken, dragged lower (in part) by elevated oil prices.
Back to Index
Cryptocurrency
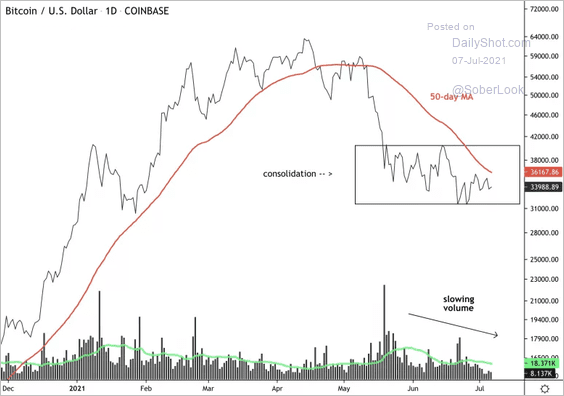
1. Bitcoin faces resistance at the 50-day moving average.
 Source: Dantes Outlook
2. Bitcoin trading volume dropped significantly over the past week as price remains stuck in a range between $30,000 and $40,000.
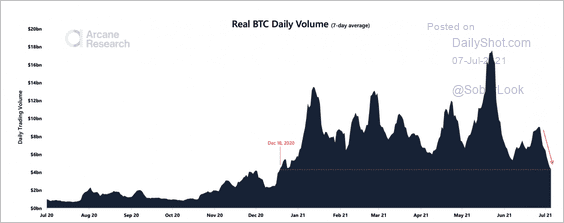 Source: Arcane Research
3. Bitcoin miner revenue is starting to recover.
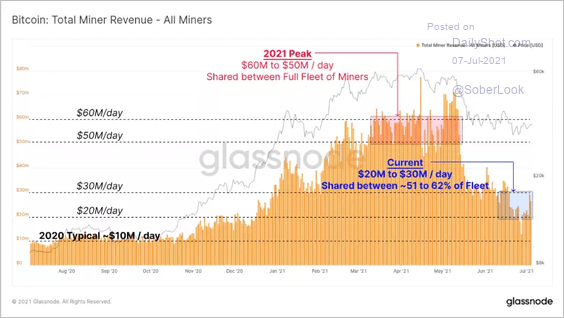 Source: Glassnode
4. Digital asset investment funds attracted net capital inflows last week after four consecutive weeks of redemptions.
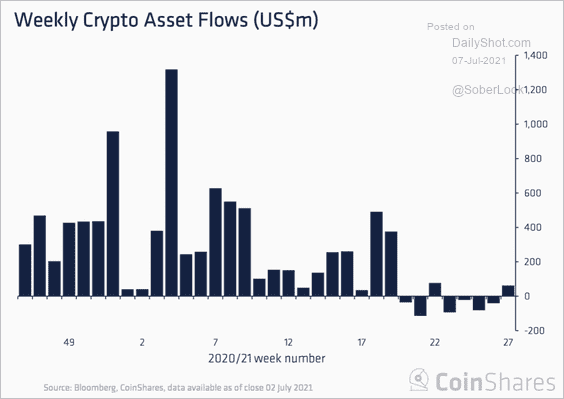 Source: CoinDesk Read full article
5. Rising crypto ransom payments increase reputational risks for the market.
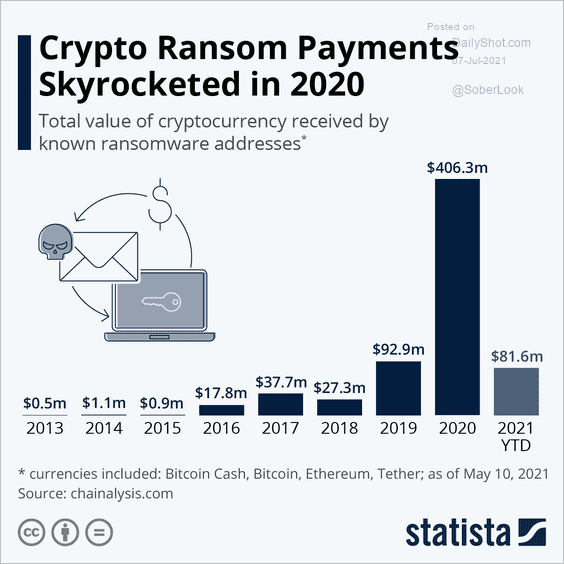 Source: Statista
Back to Index
Commodities
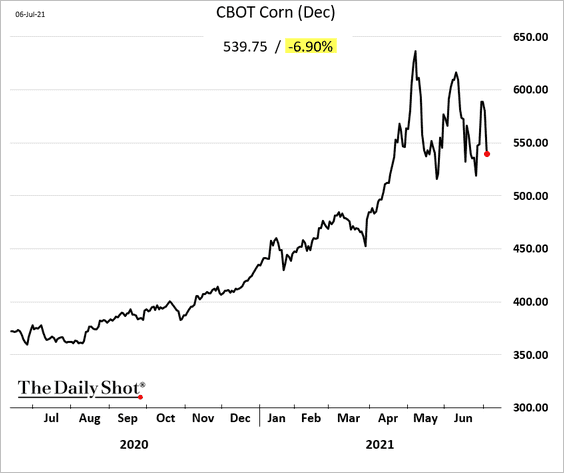
1. US grains tumbled on Tuesday, with rains expected to ease drought in many parts of the country. There are also concerns that China’s buying spree will moderate. As the chart below shows, corn and other grans have been whipsawed since May.
Volatility in US grains has reached multi-year highs.
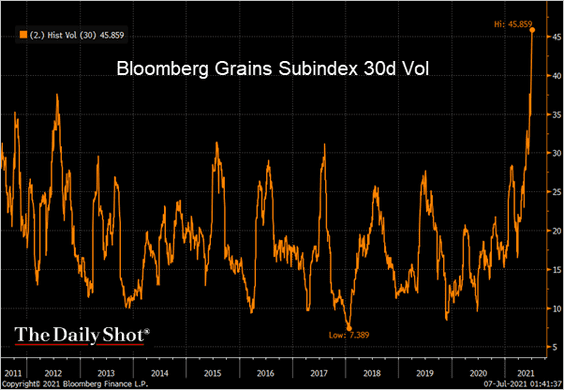 Source: @TheTerminal, Bloomberg Finance L.P.
2. This volatility is making farmers uneasy as sentiment tumbles. Part of the decline is also due to US politics.
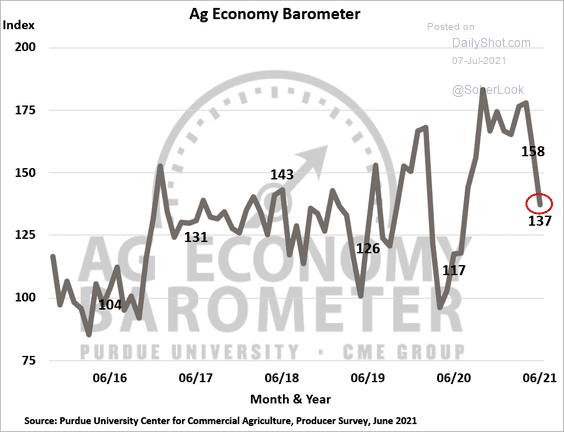 Source: Purdue University/CME Group Ag Economy Barometer
3. US grain inventories have been trending lower.
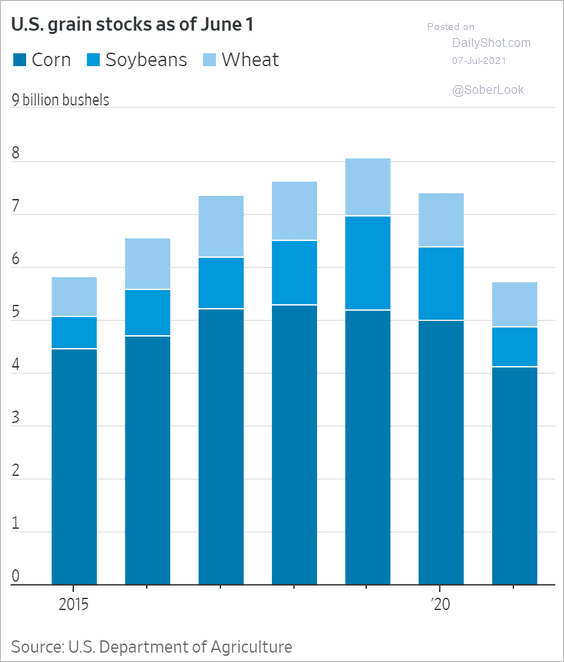 Source: @WSJ Read full article
——————–
4. This chart illustrates the looming lithium market deficit.
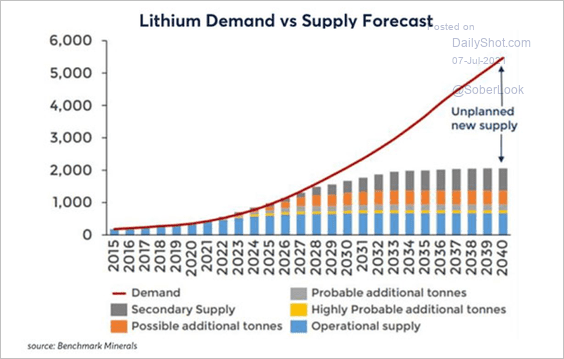 Source: Institutional Investor Read full article
Back to Index
Energy
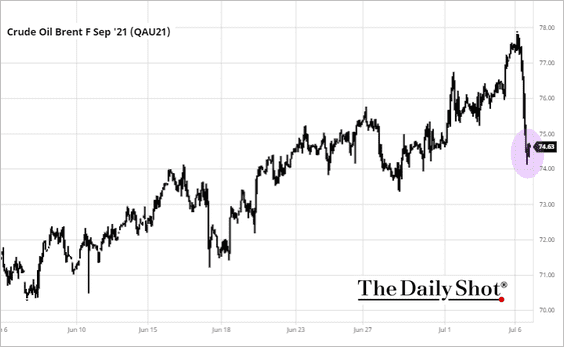
1. The US involvement in OPEC’s spat improves the chances of a deal to boost production. Crude oil tumbled.
 Source: Bloomberg Read full article
 Source: barchart.com
By the way, Brent crude is at a long-term downtrend resistance.
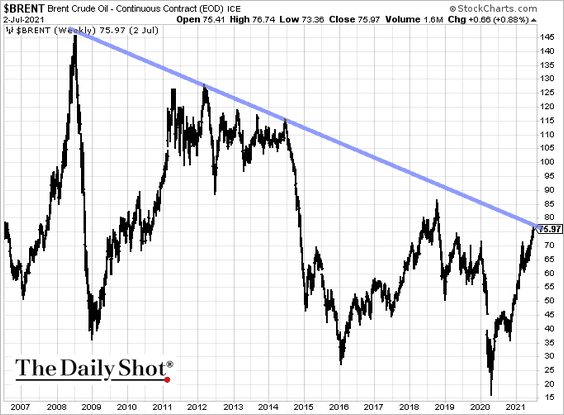 h/t @AkshayChinchal4
——————–
2. Renewables’ share of net new power generating capacity keeps climbing.
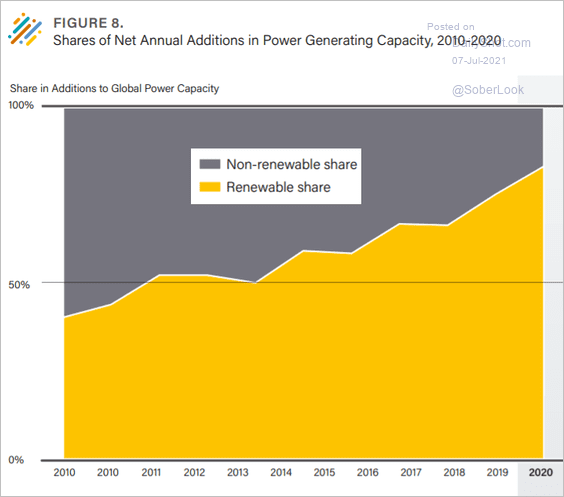 Source: REN21 Read full article
Back to Index
Equities
1. Current valuations don’t bode well for longer-term returns.
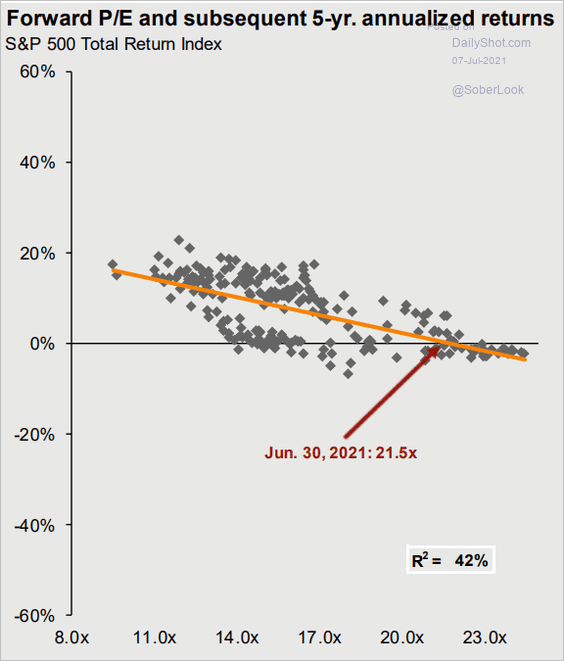 Source: @JPMorganAM
2. Equity multiples could start to decline if inflation expectations remain elevated.
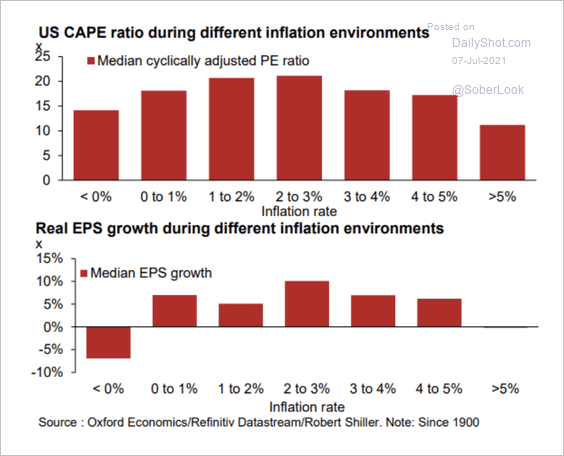 Source: Oxford Economics
In an inflation scenario, world equity prices are 10% lower than Oxford Economics’ baseline forecast.
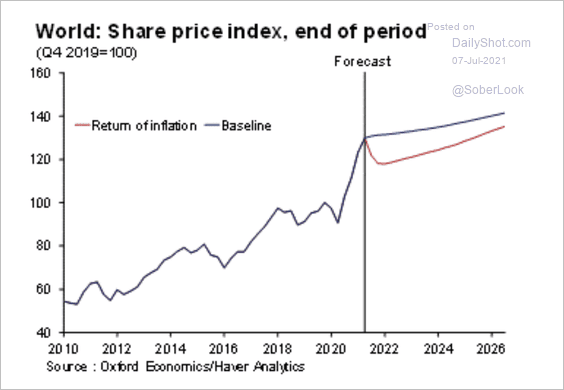 Source: Oxford Economics
Equities are more resistant to an inflation spurt than bonds.
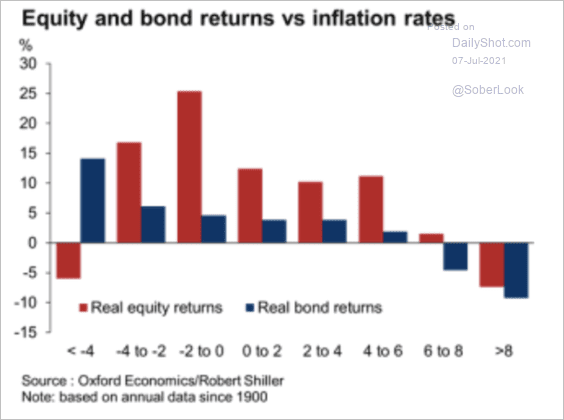 Source: Oxford Economics
——————–
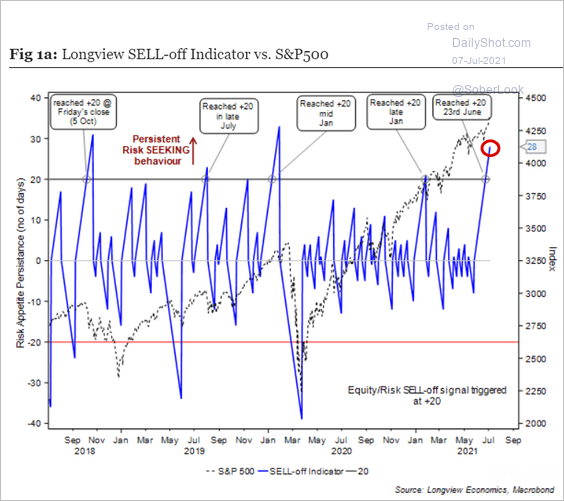
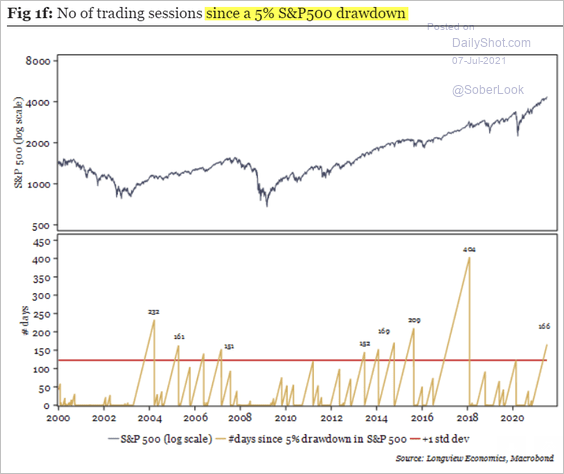
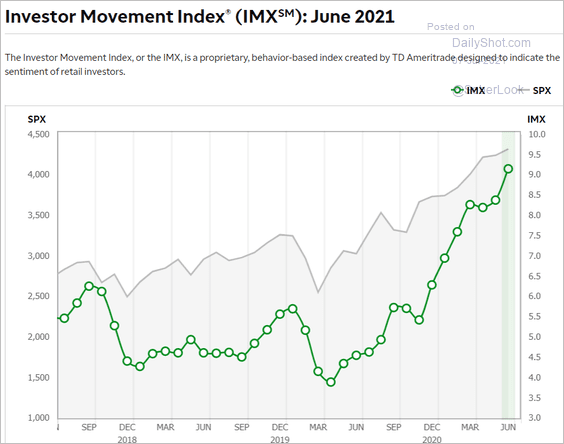
3. We continue to see signs of exuberance in the market.
• The Longview Economics risk appetite indicator:
 Source: Longview Economics
• Trading sessions since a 5% drawdown:
 Source: Longview Economics
• The TD Ameritrade retail investor positioning index (record high):
 Source: @TDAmeritrade
——————–
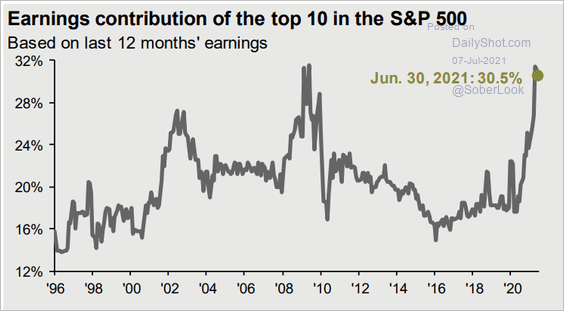
4. Earnings contribution of the top ten stocks in the S&P 500 are still near record highs.
 Source: @JPMorganAM
5. This chart shows equity factor/style year-to-date returns.
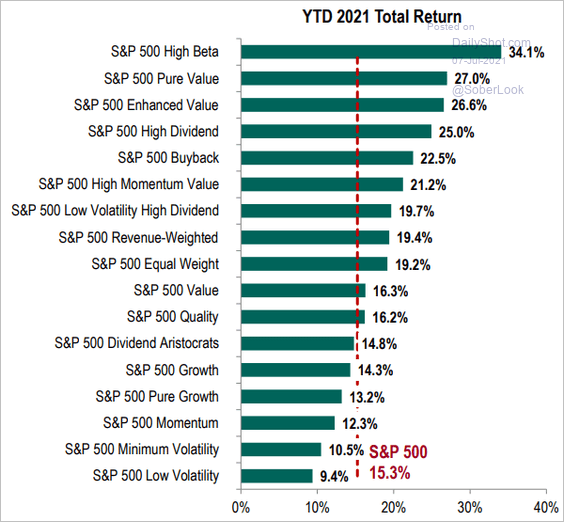 Source: S&P Global Market Intelligence
Which factors will outperform over the next 12 months?
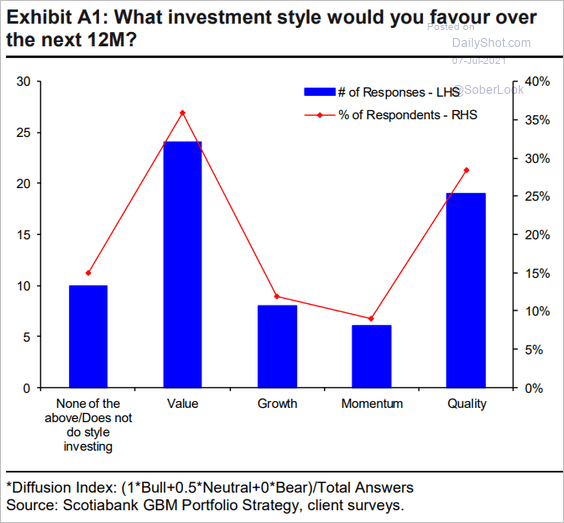 Source: Hugo Ste-Marie, Portfolio & Quantitative Strategy Global Equity Research, Scotia Capital
——————–
6. The gap between S&P 500 and Nasdaq 100 volatility measures has been tightening.
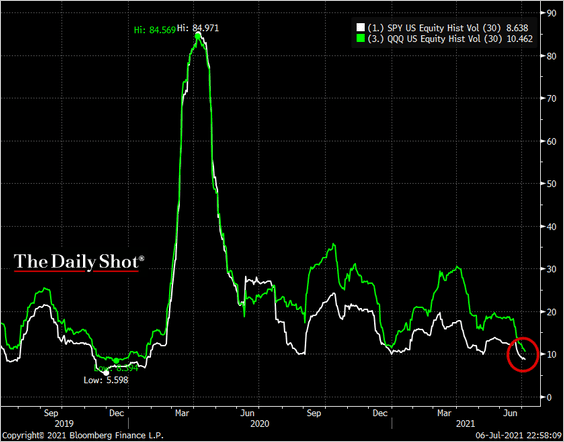 Source: @TheTerminal, Bloomberg Finance L.P.
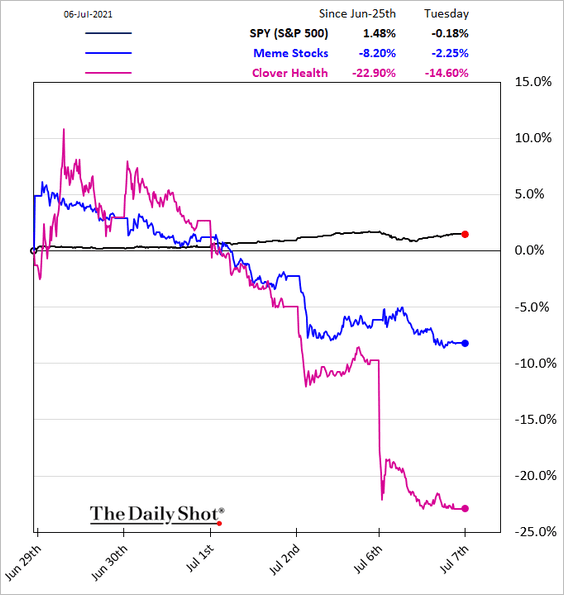
7. Meme stocks continue to struggle, which could be a positive for crypto.
Back to Index
Rates
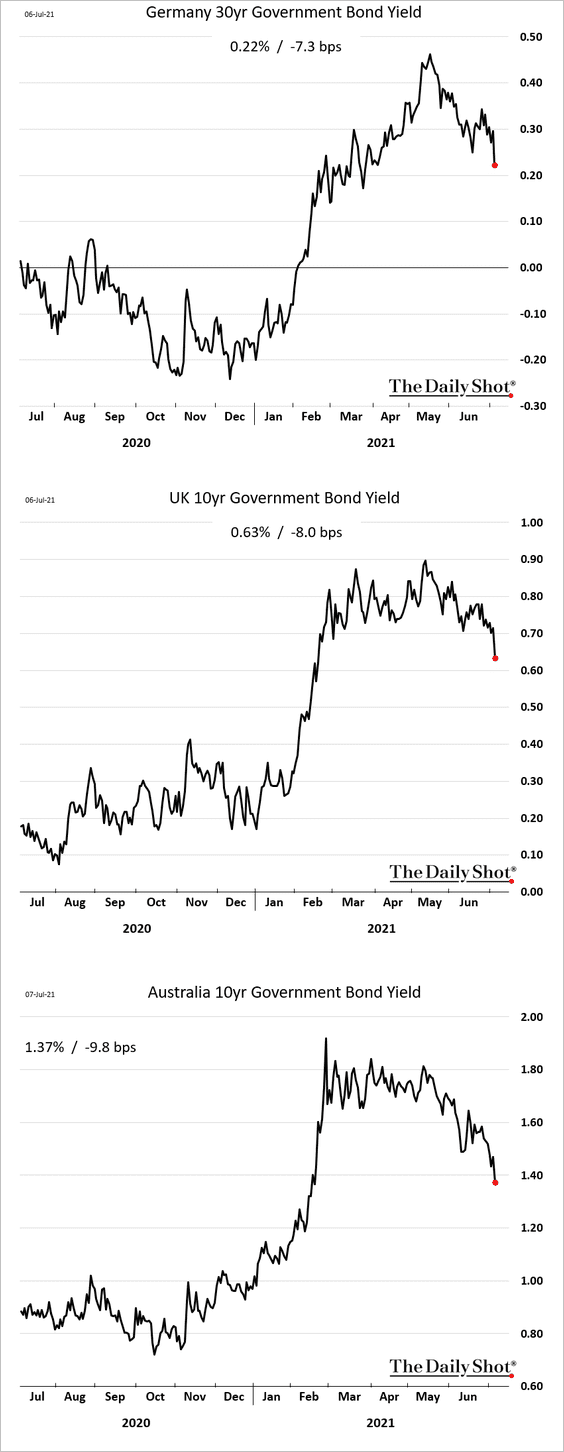
1. Global yields dipped on Tuesday with Treasuries.
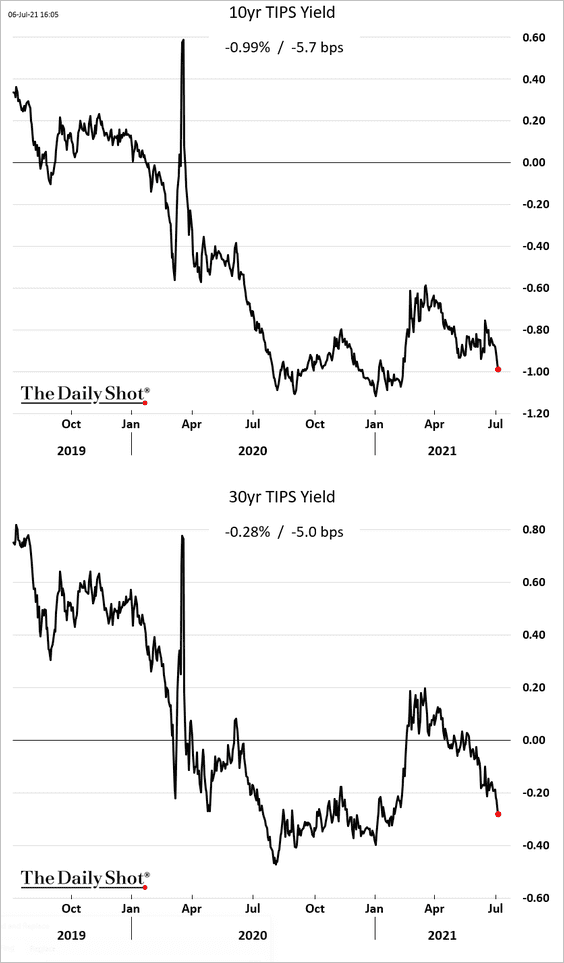
2. US inflation-linked Treasury yields (real rates) declined as well.
Back to Index
Global Developments
1. How will investors change allocations in response to higher inflation and a more hawkish Fed?
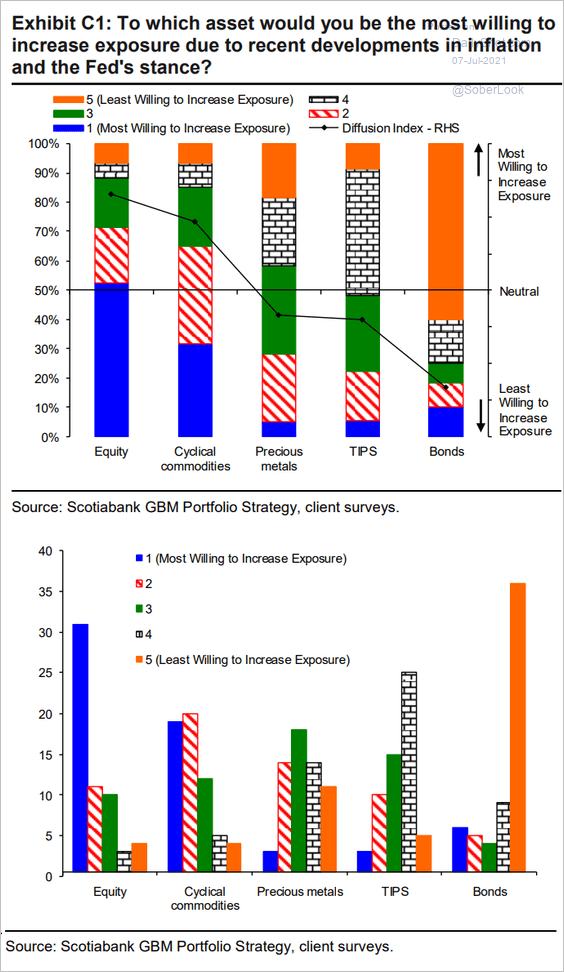 Source: Hugo Ste-Marie, Portfolio & Quantitative Strategy Global Equity Research, Scotia Capital
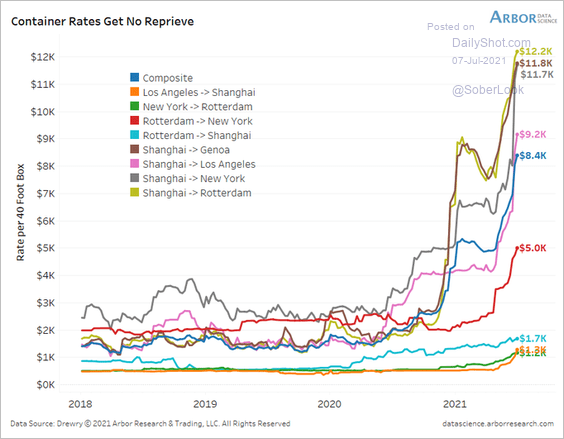
2. Container shipping costs continue to surge.
 Source: @benbreitholtz
3. This scatterplot shows business activity (PMIs) vs. vaccination rates.
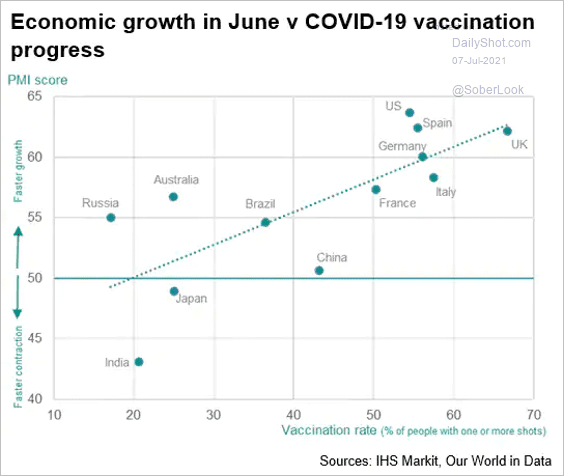 Source: IHS Markit
4. The chart below shows currencies used in the international monetary system.
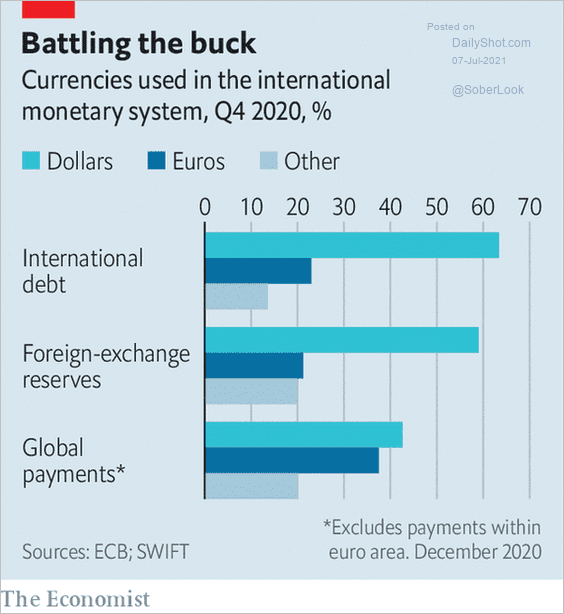 Source: The Economist Read full article
——————–
Food for Thought
1. Share of the population fully vaccinated against COVID:
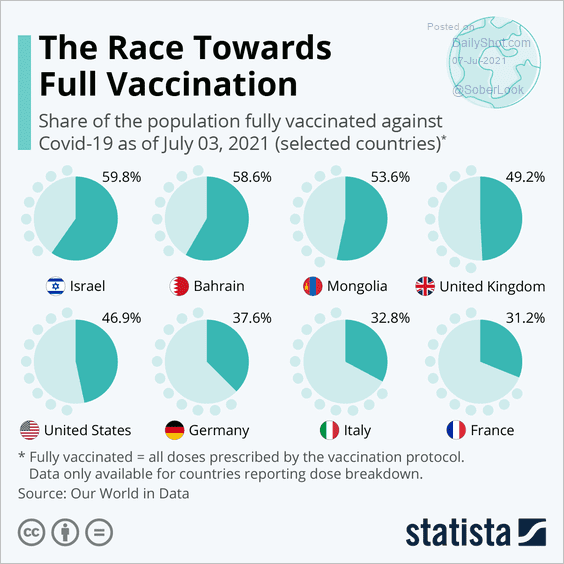 Source: Statista
2. US views on the Delta variant:
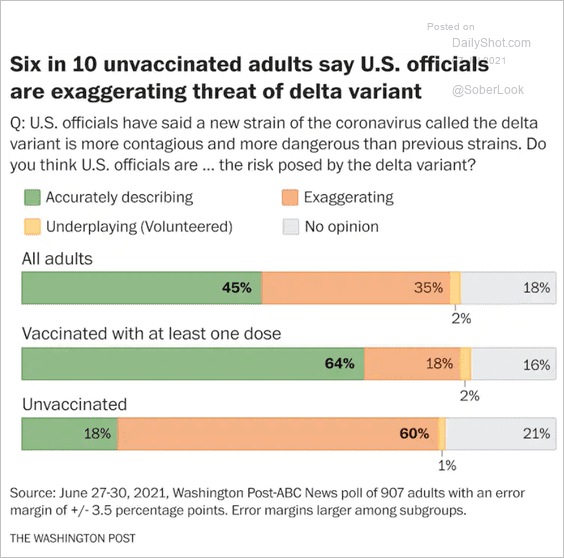 Source: The Washington Post Read full article
3. Vaccination rates by state:
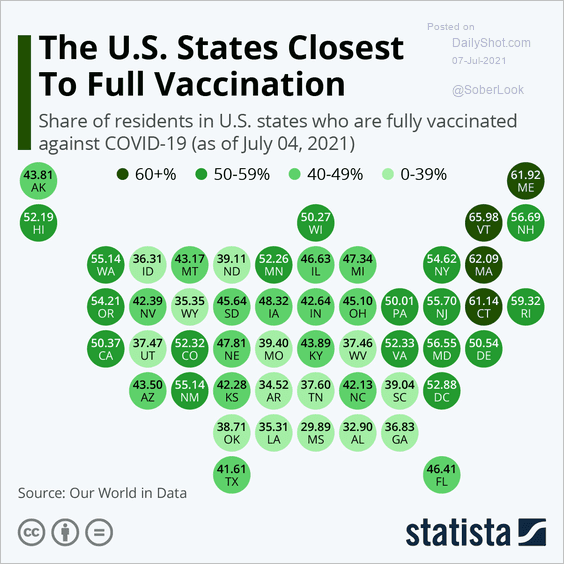 Source: Statista
4. Uneven vaccination progress in the US:
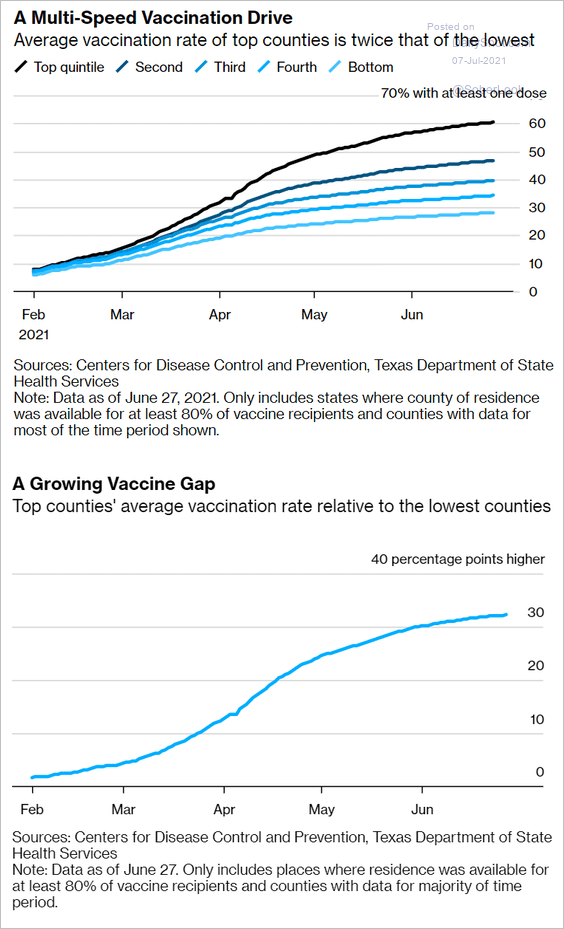 Source: Bloomberg Read full article
5. US daily deaths by cause:
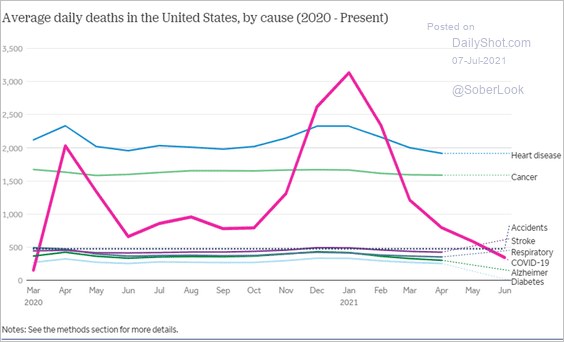 Source: Peterson-KFF Read full article
6. Demonstrations in 2020:
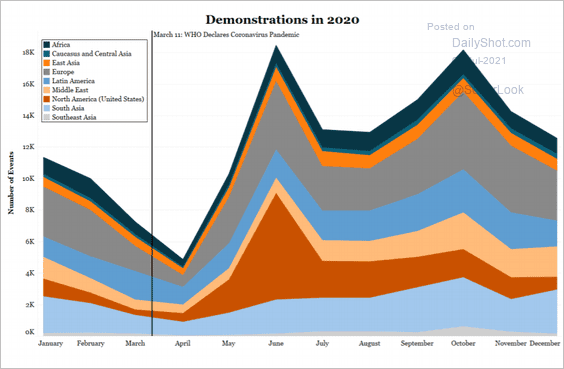 Source: ACLED Read full article
7. CCTV cameras in LA and Beijing:
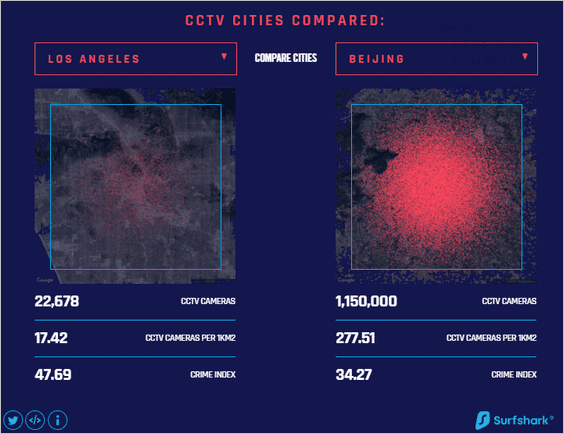 Source: Visual Capitalist Read full article
8. US local public education employment:
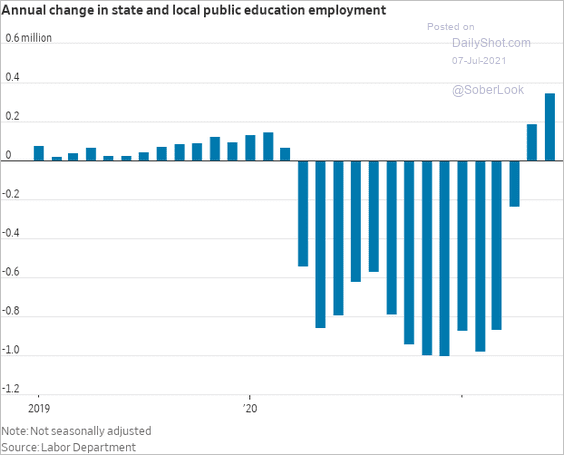 Source: @WSJ Read full article
9. Sub-Saharan Africa working-age population:
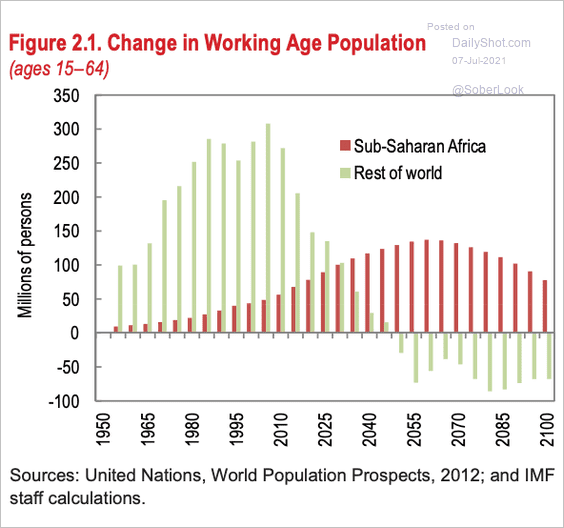 Source: IMF, @adam_tooze Read full article
10. Population density across the African continent:
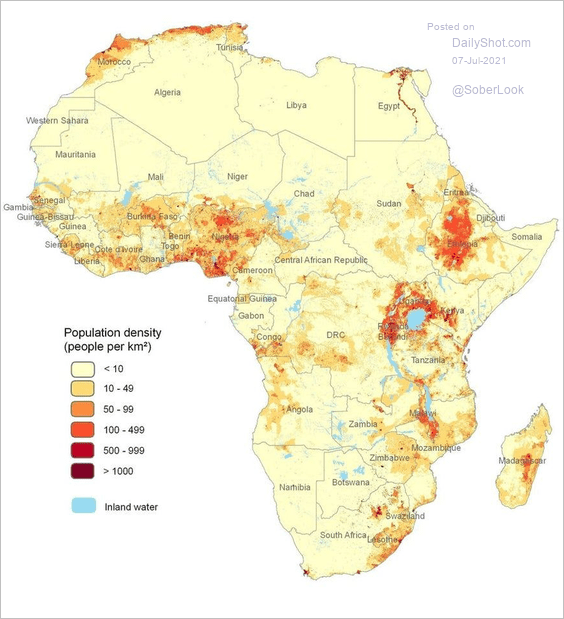 Source: @simongerman600 Read full article
11. Superyachts flocking to Greece:
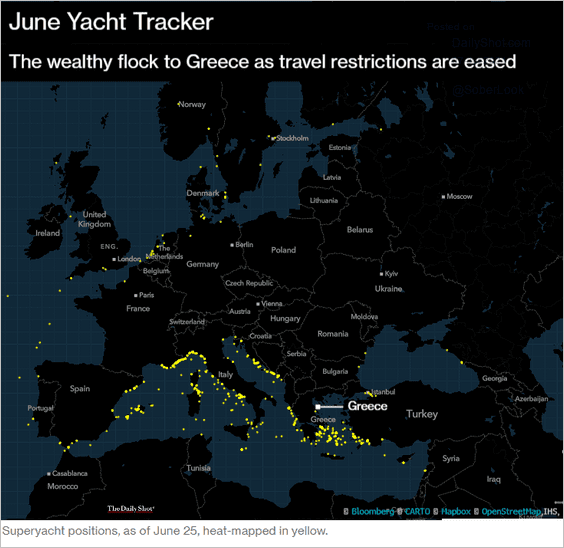 Source: Bloomberg Read full article
——————–
Back to Index