
To receive the Daily Shot newsletter in your inbox, please sign up at our Email Center. Previous issues of the Daily Shot are available online at DailyShotWSJ.com.
Have questions, feedback or comments? Contact author [email protected].
Twitter: @SoberLook
The Daily Shot: 13-Mar-20
• Equities
• Credit
• Rates
• Cryptocurrency
• Commodities
• Energy
• Emerging Markets
• Asia – Pacific
• The Eurozone
• Canada
• The United States
• Global Developments
• Food for Thought
Equities
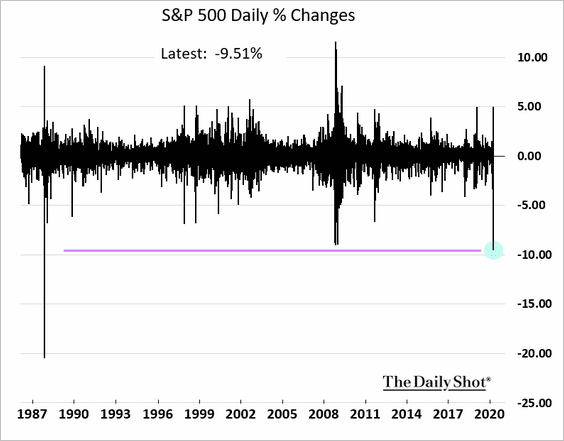
1. The S&P 500 plummetted almost 10% on Thursday, the worst one-day drop since 1987.
The table below shows the declines in US indices from the highs.
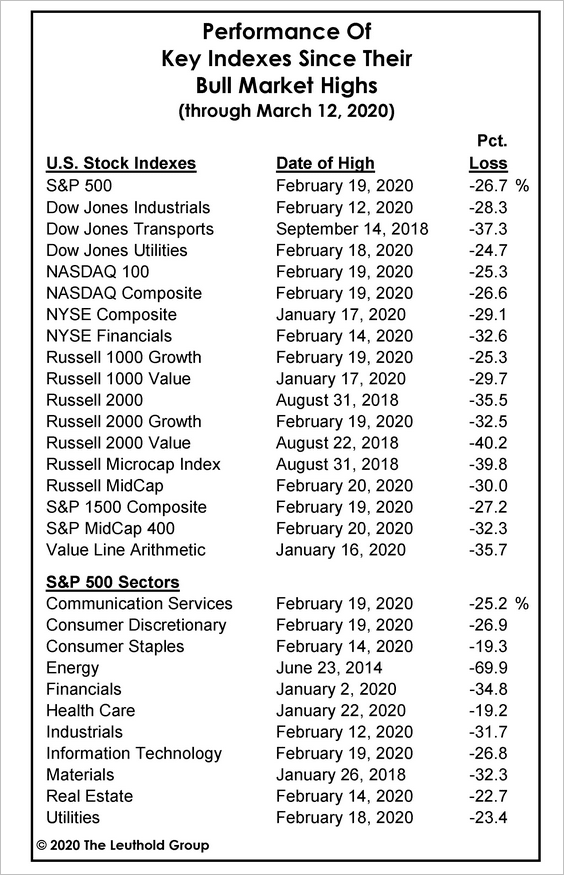 Source: @LeutholdGroup
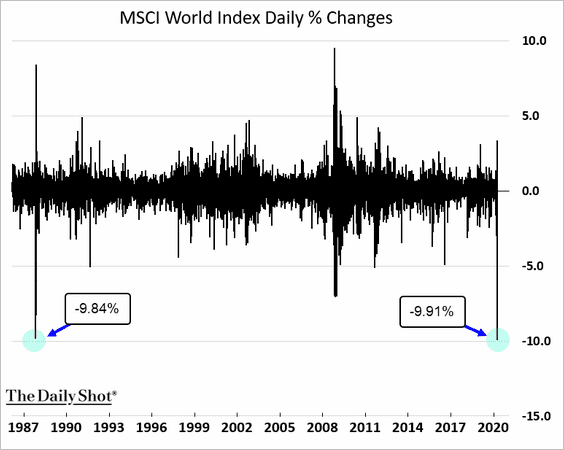
The MSCI global stock market index had the worst day on record.
——————–
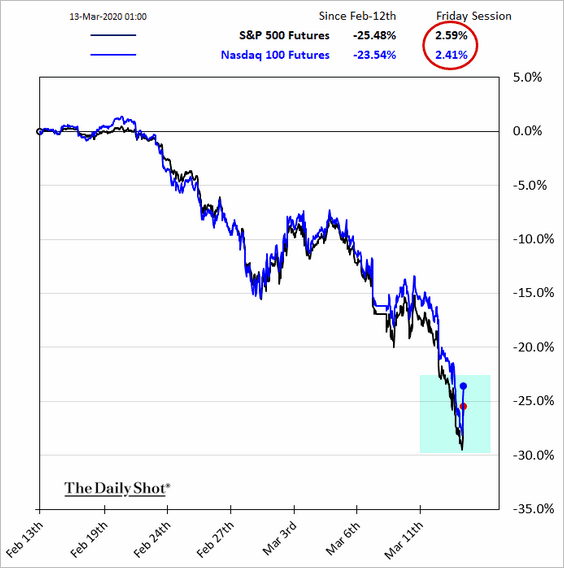
2. Stock futures appear to have stabilized in early trading.
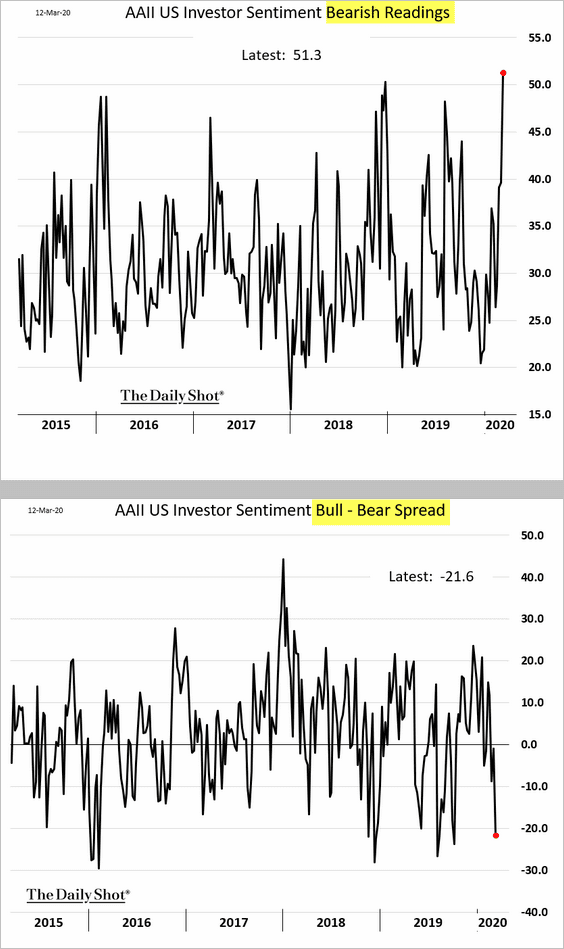
3. The share of bearish investors in the AAII survey rose to multi-year highs, but the bull-bear spread (second chart) is still above the recent selloffs.
CNN’s Fear & Greed index is at the lows.
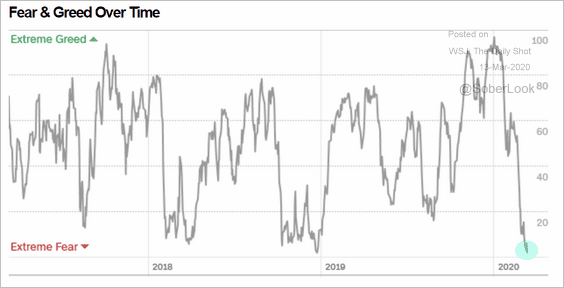 Source: CNN Business
——————–
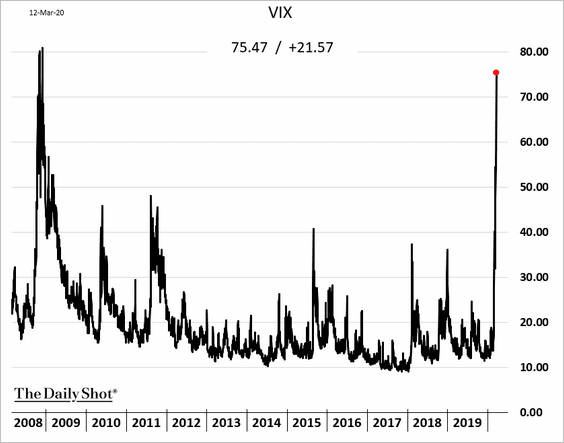
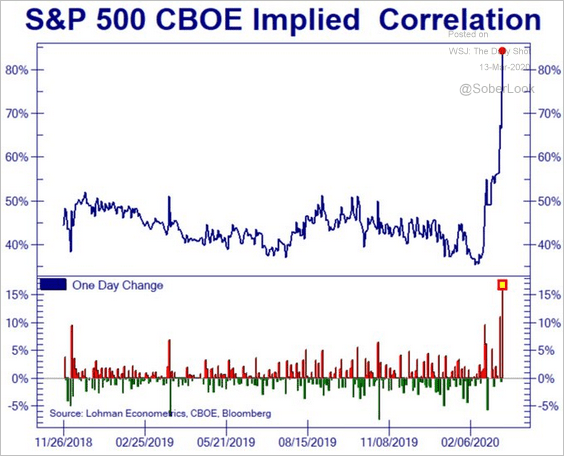
4. Below, we have some updates on equity volatility indicators.
• VIX is near the 2008 highs.
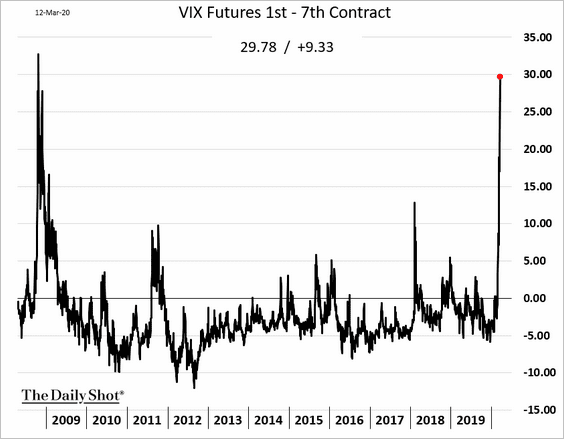
• The VIX futures curve backwardation (negative slope) is also near 2008 levels.
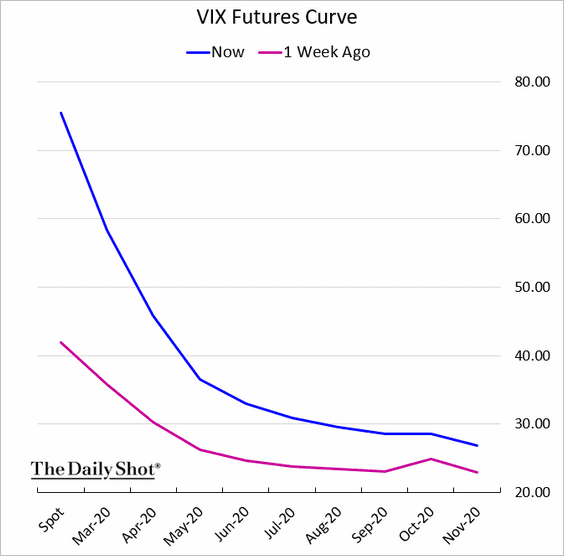
• The S&P 500 implied correlation spiked this week.
 Source: @Not_Jim_Cramer
——————–
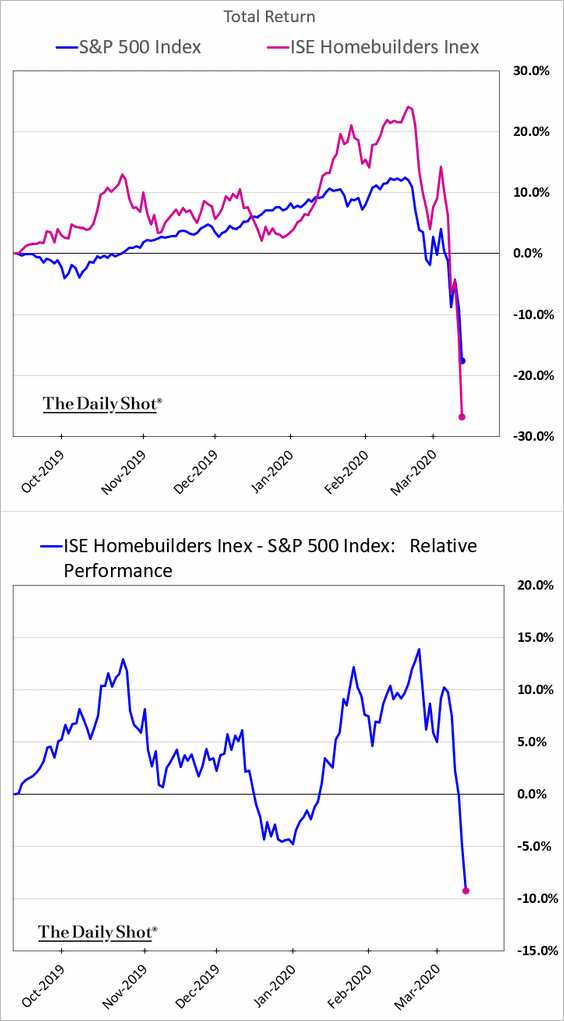
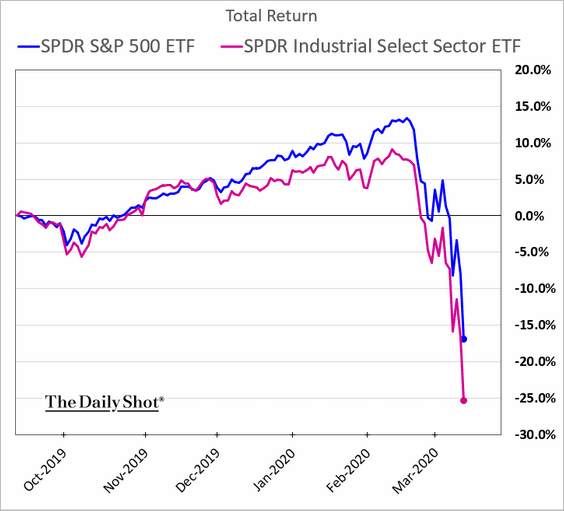
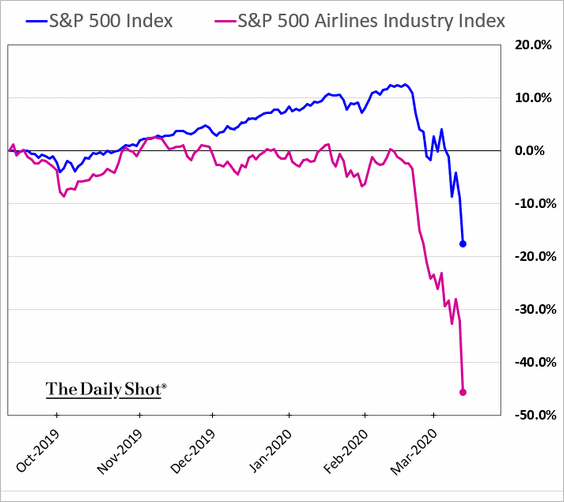
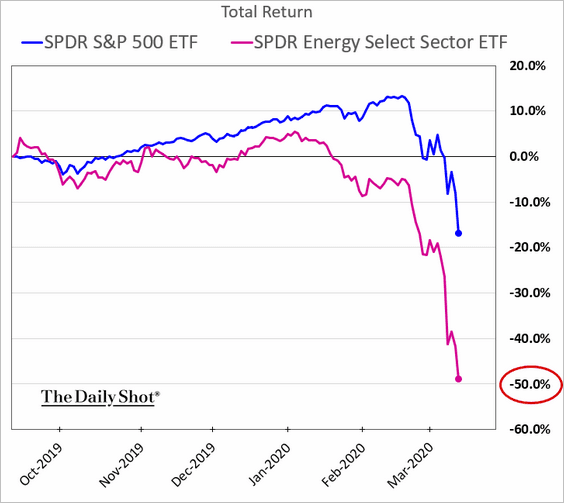
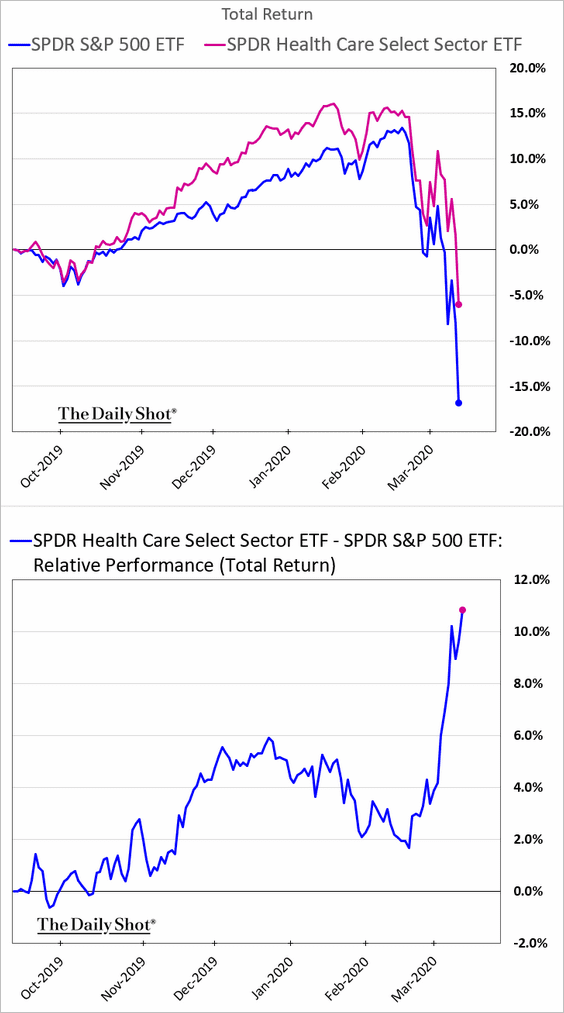
5. Next, let’s take a look at some sector performance charts (last six months).
• Homebuilders:
• Industrials:
• Transportation (2 charts):
![]()
• Energy:
• Healthcare:
——————–
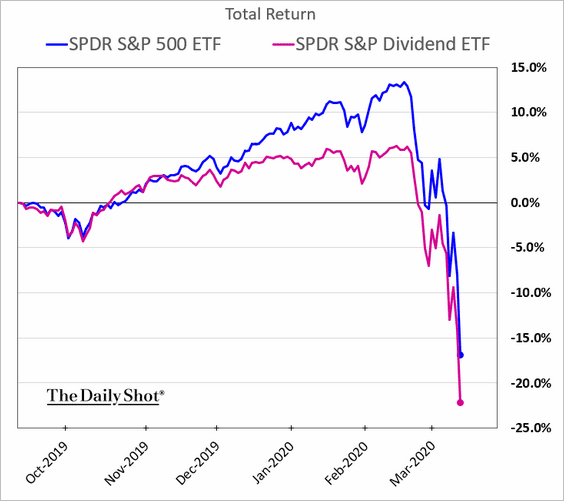
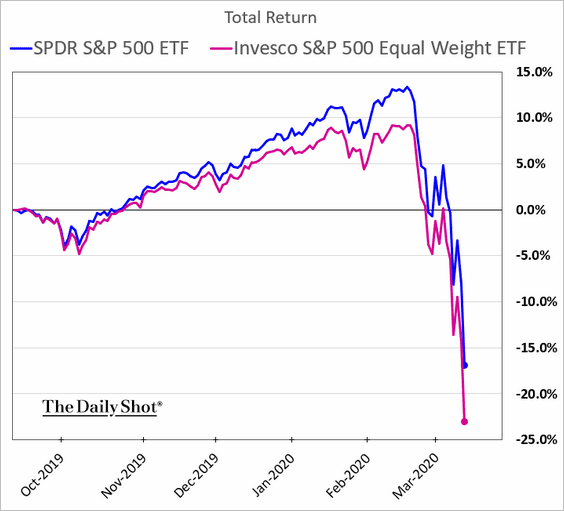
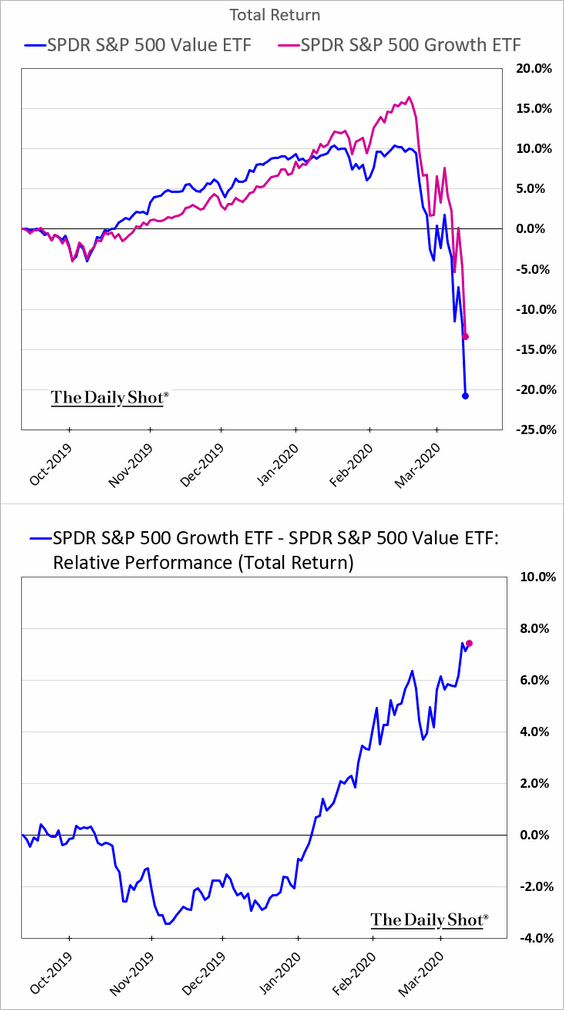
6. Finally, here are some factor performance charts.
• High-dividend:
• Equal-weight:
• Growth vs. value:
Credit
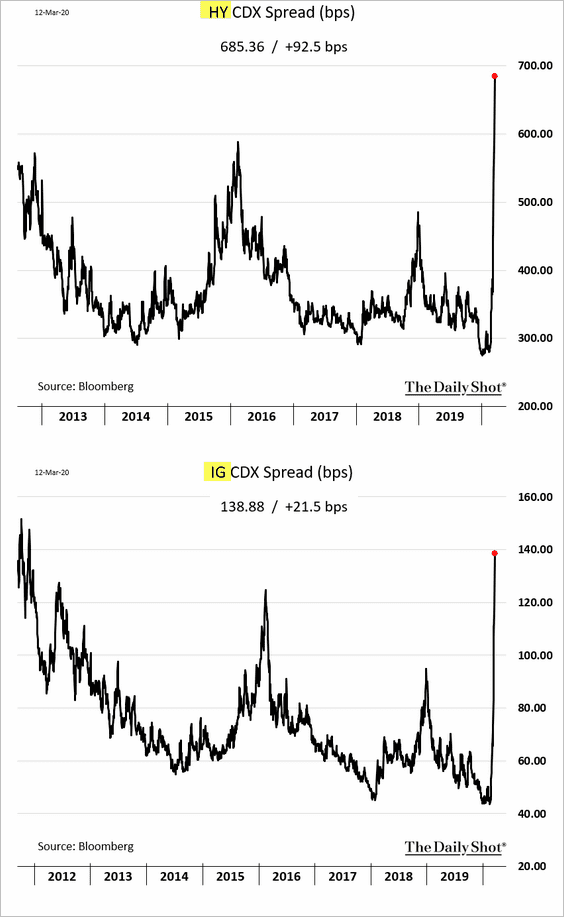
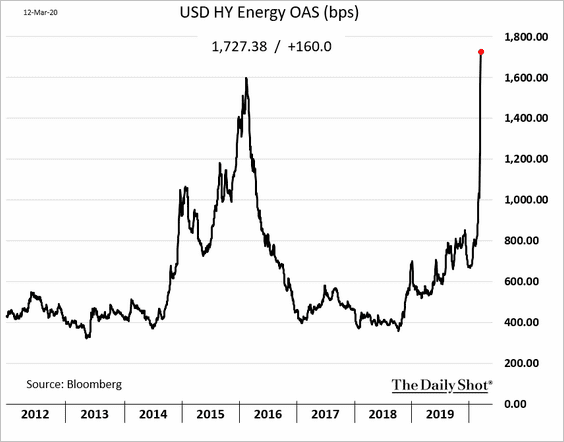
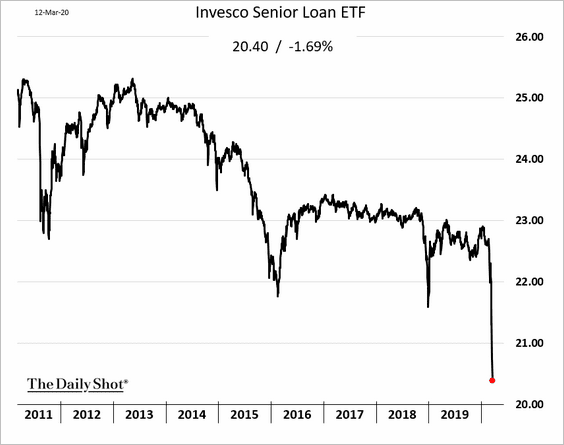
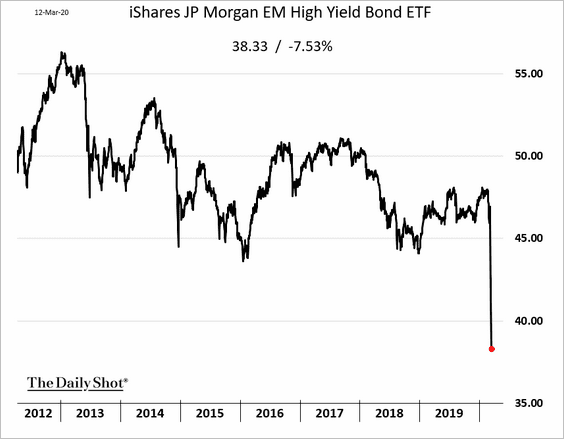
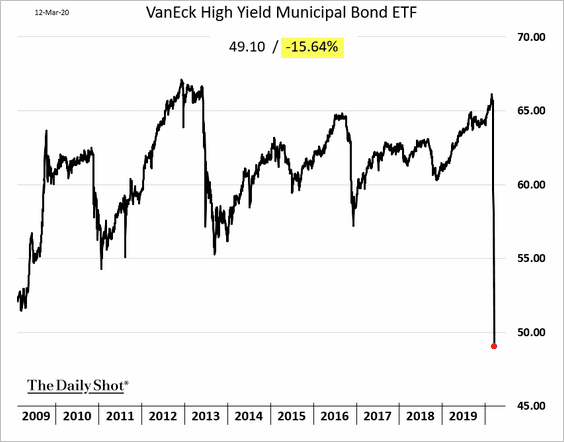
1. There was more pain in credit markets on Thursday.
• High-yield (HY) and investment-grade (IG) CDX spreads:
• Energy-sector high-yield bond spreads:
• Leveraged loans:
• Emerging market high-yield bonds:
• High-yield munis:
——————–
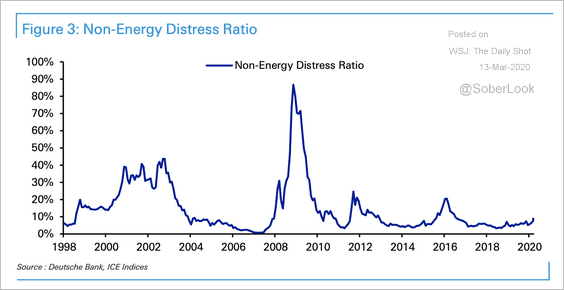
2. The non-energy high-yield distress ratio remains low relative to prior crisis levels, although there has been a steady uptick in recent weeks.
 Source: Deutsche Bank Research
3. There is some nervousness in the interbank market. The FRA-OIS spread shows the market expecting elevated LIBOR levels relative to the fed funds (overnight) rate.
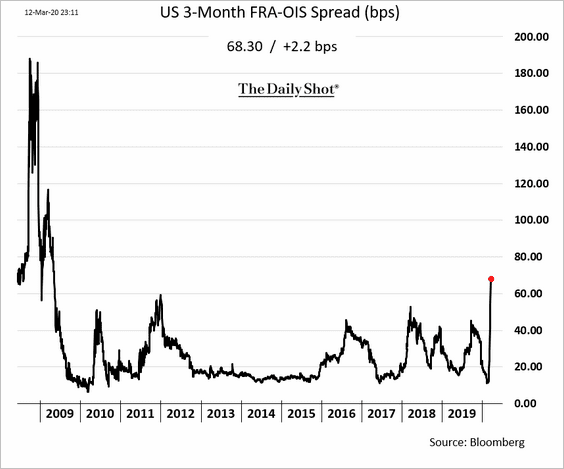
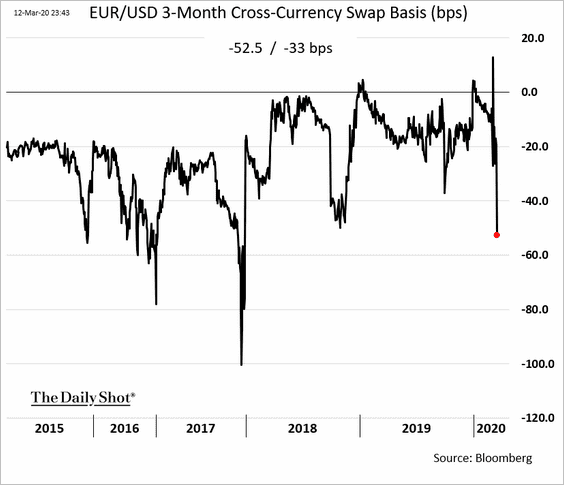
Cross-currency basis spreads have widened, indicating tighter US dollar financing market for foreign banks.
——————–
4. Moody’s expects global speculative-grade defaults to rise this year.
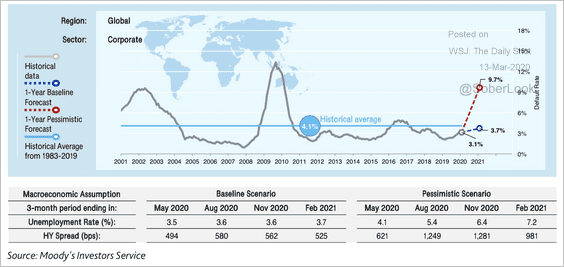 Source: Moody’s Investors Service
Global default counts rose above average in February.
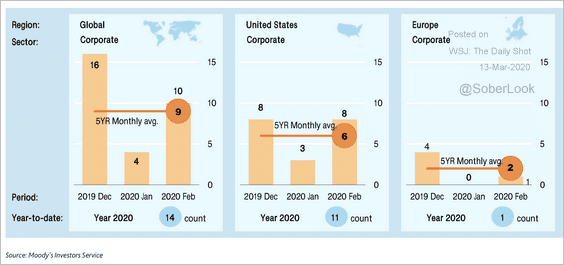 Source: Moody’s Investors Service
Rates
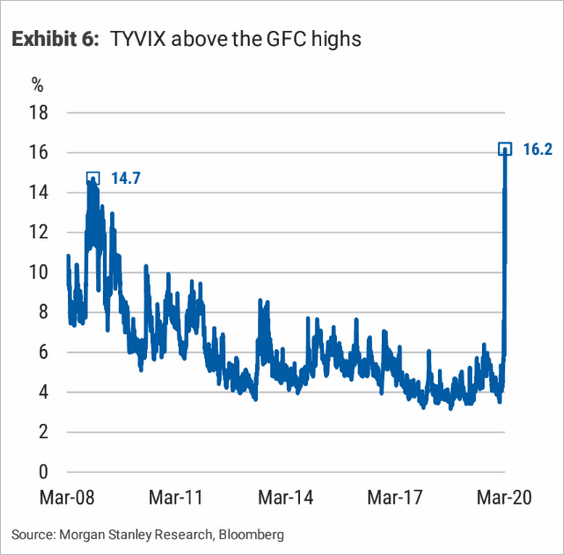
1. Treasury implied volatility spiked in recent days.
 Source:
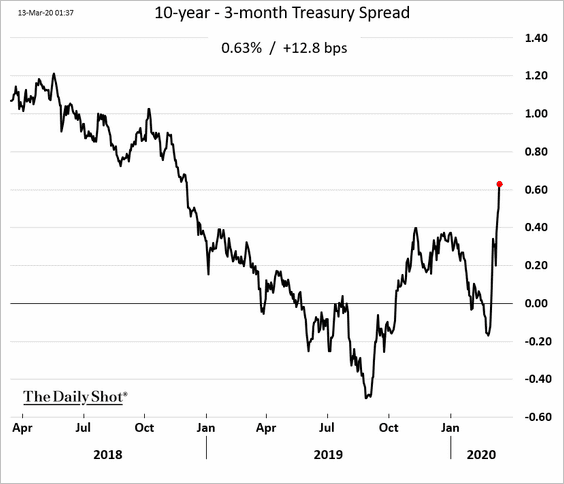
2. The Treasury curve is steepening.
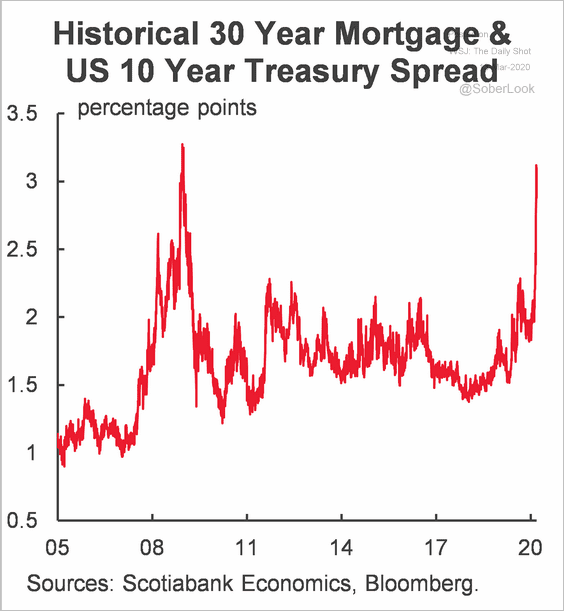
3. The spread between the 30yr mortgage rate and the 10yr Treasury yield rose to the highest level since 2008 (pricing in extreme volatility).
 Source: Scotiabank Economics
4. See the US section for an update on the Fed’s action on Thursday.
Cryptocurrency
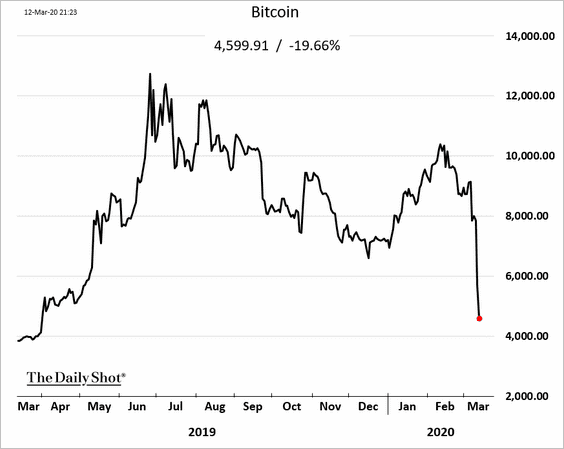
1. Bitcoin plummetted with stocks, falling to its 200-week moving average (second chart).
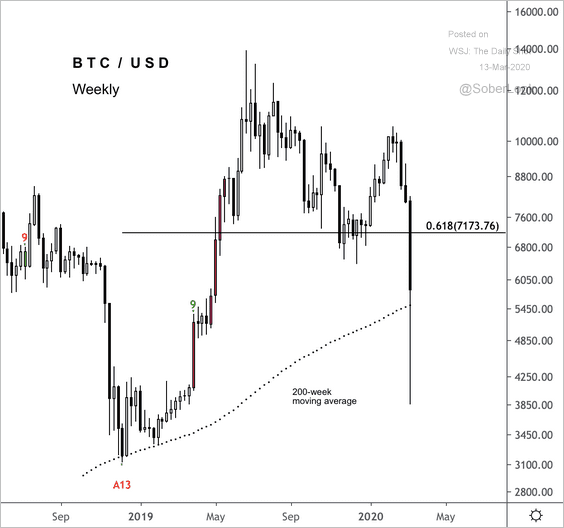 Source: @DantesOutlook
——————–
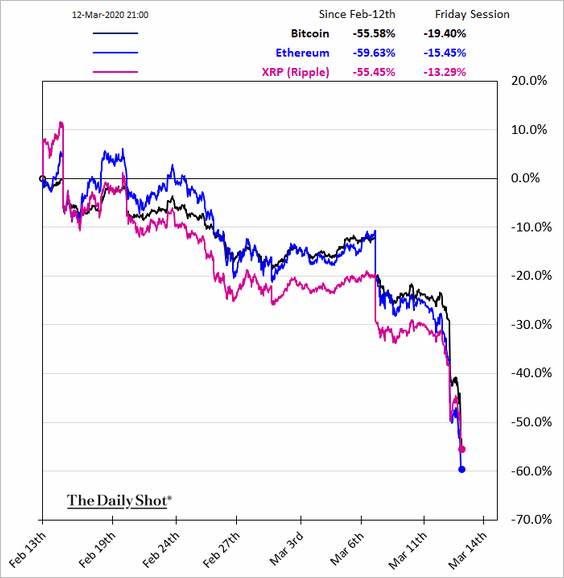
2. Here is the relative performance.
3. A large amount of Bitcoin (BTC) was just taken off exchange accounts, according to Santiment data. The blue line indicates withdrawn BTC.
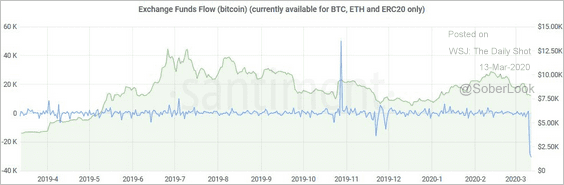 Source: @santimentfeed
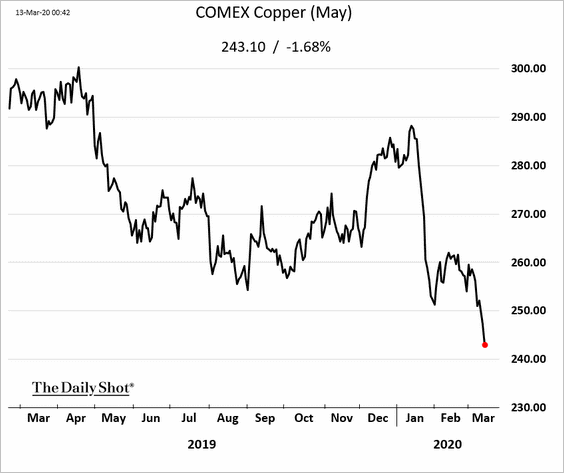
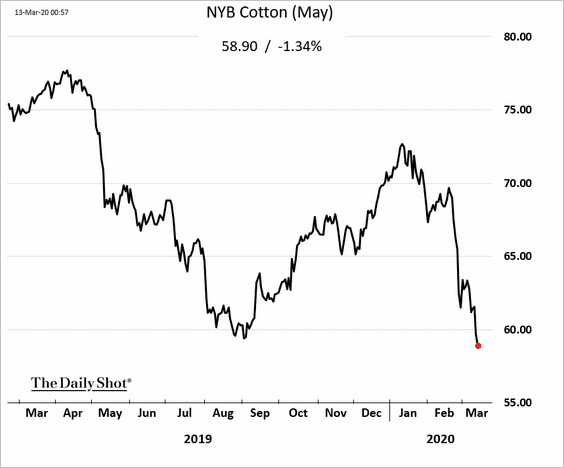
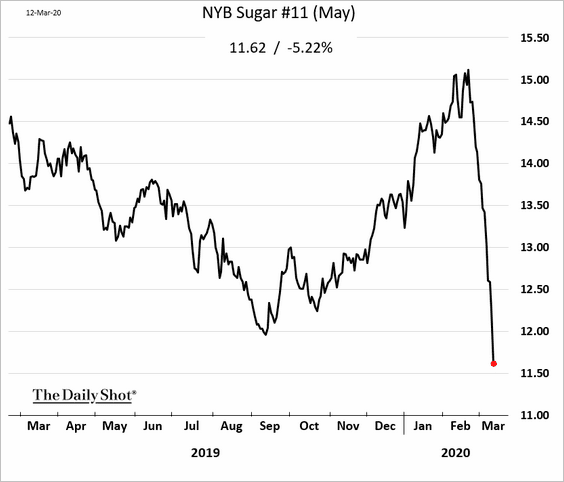
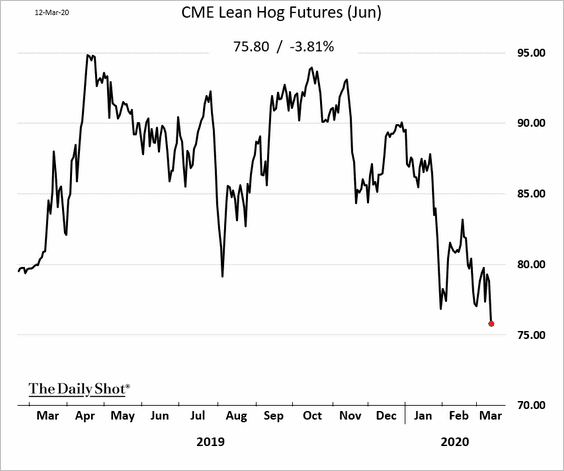
Commodities
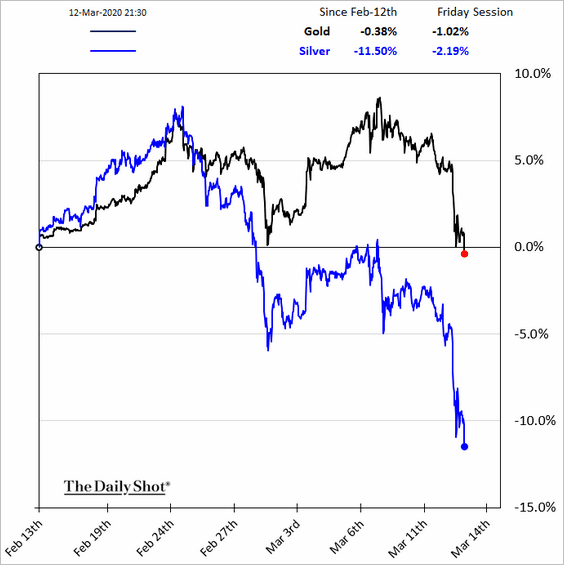
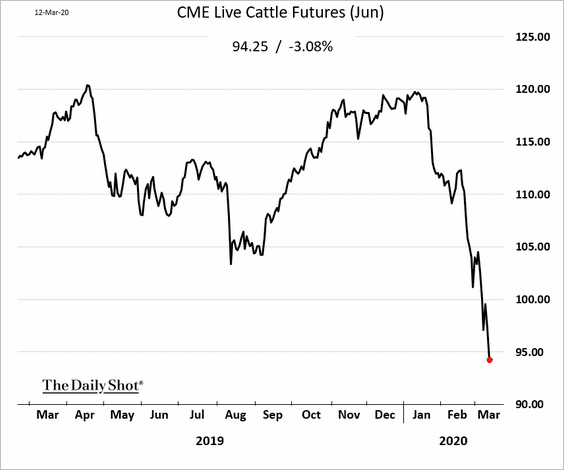
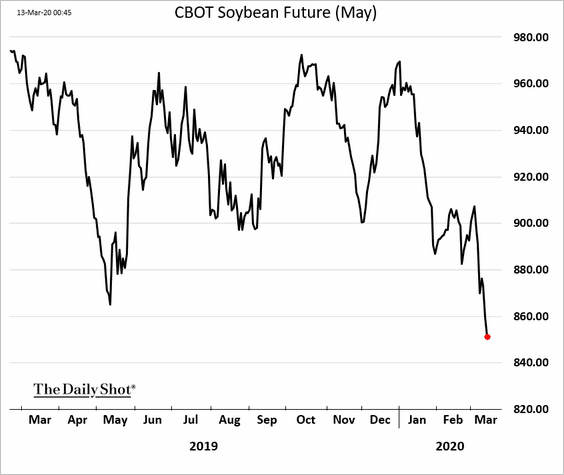
Thursday was an ugly day for commodities across the board.
• Gold and silver:
• Copper:
• Softs:
• Livestock:
• Grains:
Energy
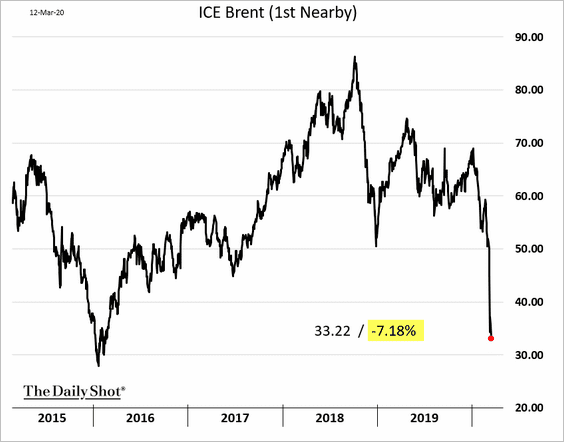
1. Brent crude tumbled 7% on Thursday but appears to have stabilized on Friday morning.
2. Here’s how oil prices below $30 per barrel will impact GDP across countries, according to Oxford Economics.
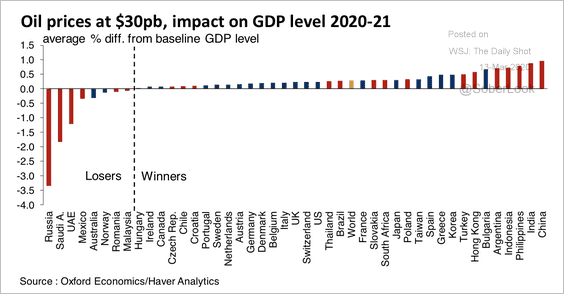 Source: Oxford Economics
3. Russia produced more oil than Saudi Arabia, even when it was cooperating with OPEC.
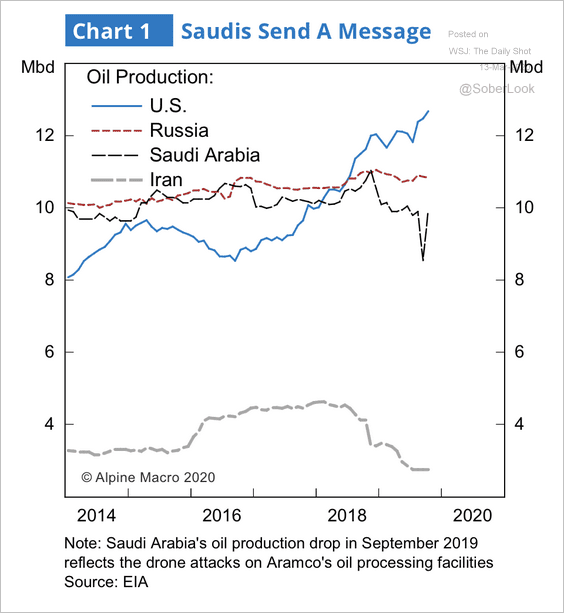 Source: Alpine Macro
Emerging Markets
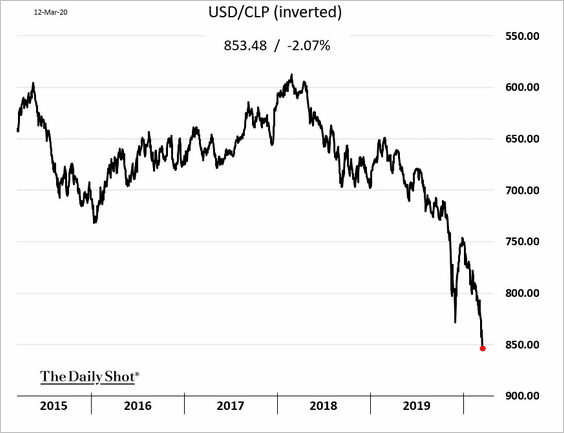
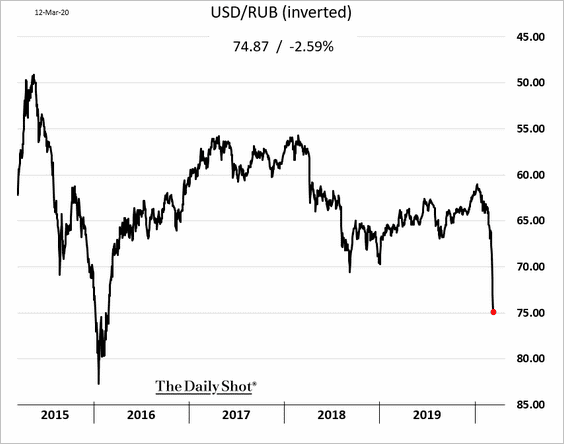
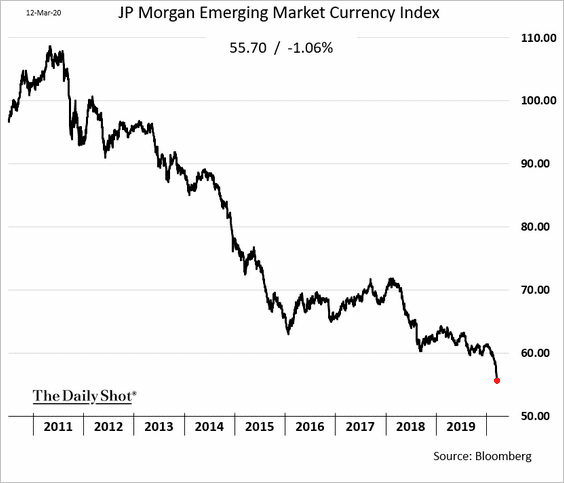
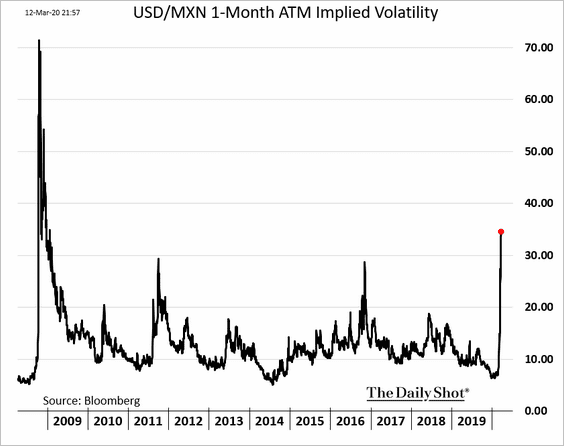
1. Pressure on EM currencies persisted on Thursday.
• The Chilean peso:
• The Russian ruble:
• The JP Morgan EM Currency Index:
Implied volatility in a number of currencies spiked to multi-year highs. Here is the 1-month vol in the Mexican peso.
 h/t George Lei
——————–
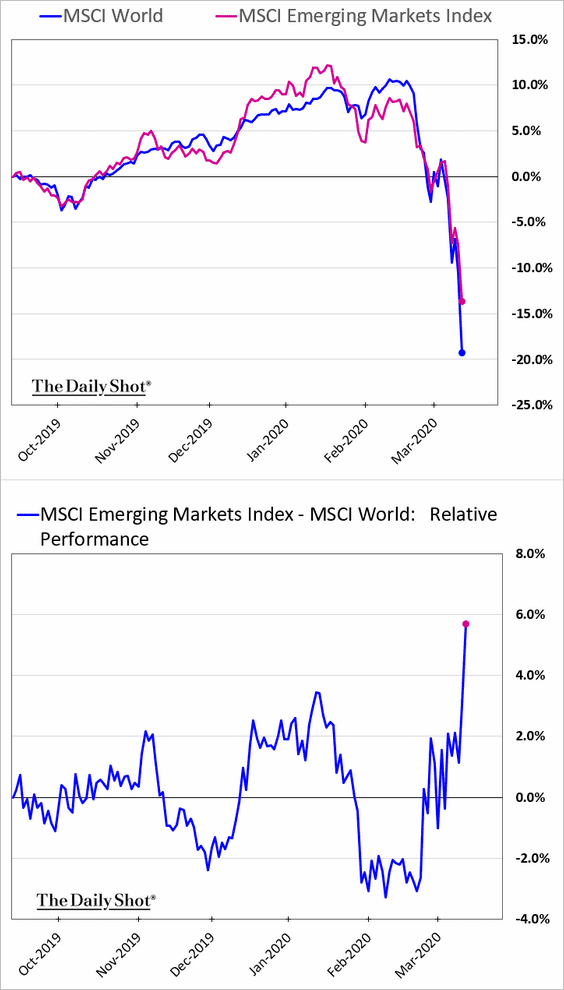
2. EM equities have outperformed developed markets during this market crash.
 h/t Srinivasan Sivabalan
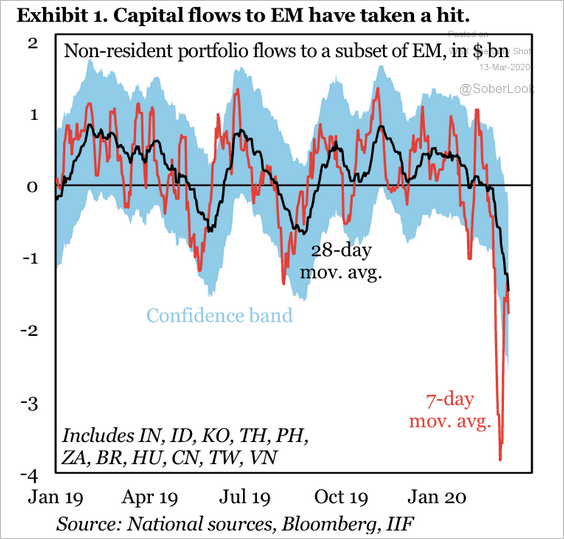
3. In recent days, EM capital flows have retreated faster than at any time since the 2008 financial crisis, according to IIF.
 Source: IIF
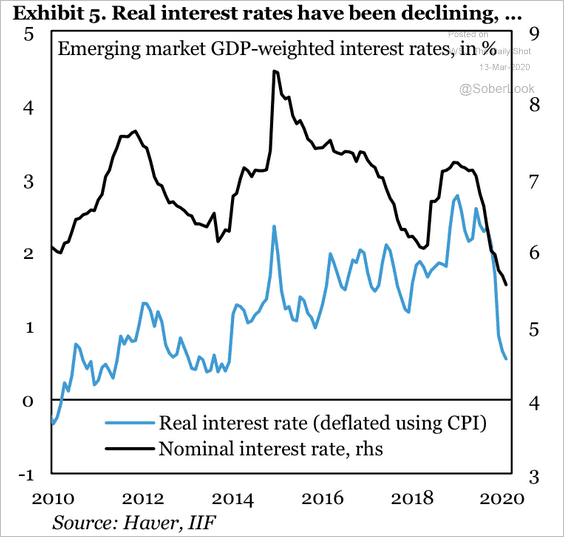
4. EM real rates have been declining.
 Source: IIF
Asia – Pacific
1. There are encouraging signs from South Korea on the coronavirus epidemic.
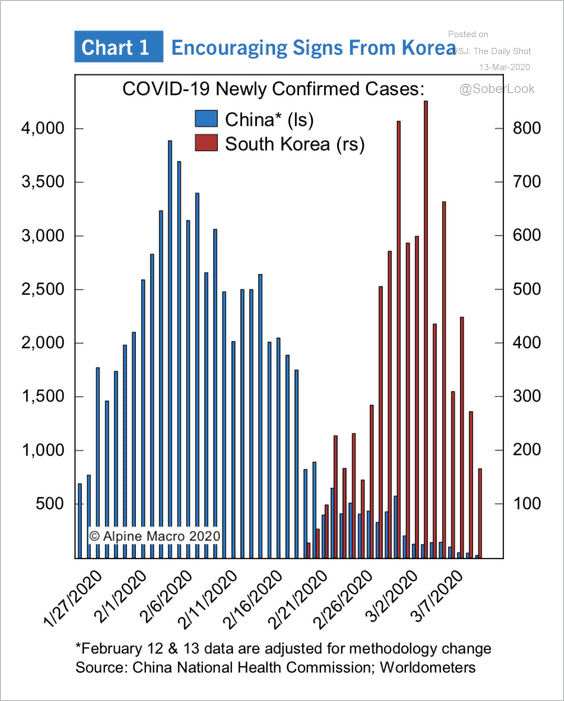 Source: Alpine Macro
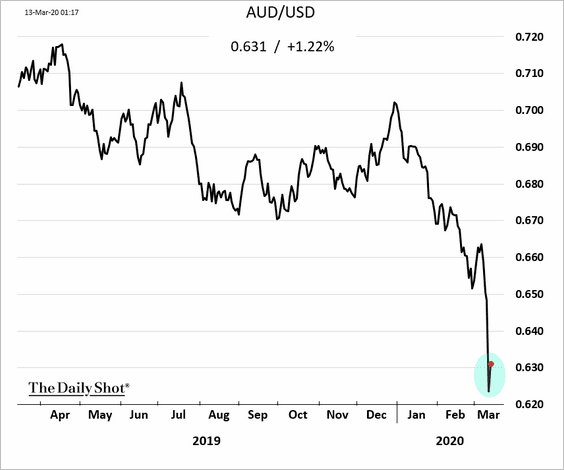
2. The Aussie dollar appears to have stabilized.
3. Australia’s ASX is on track to break its previous weekly record decline.
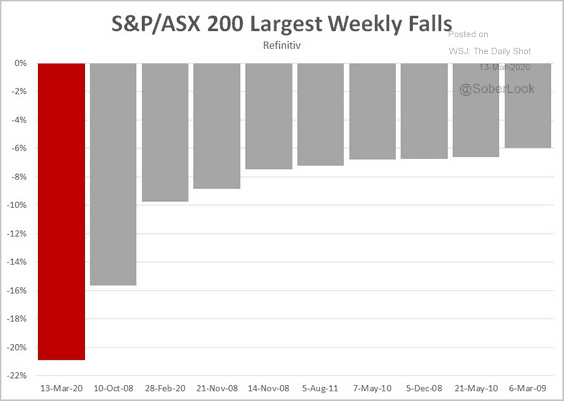 Source: @Scutty
4. Japanese investors have been loading up on foreign bonds.
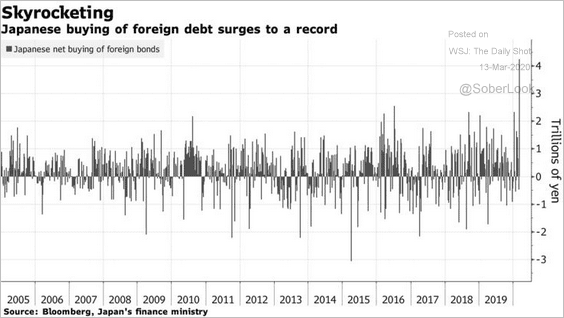 Source: @markets Read full article
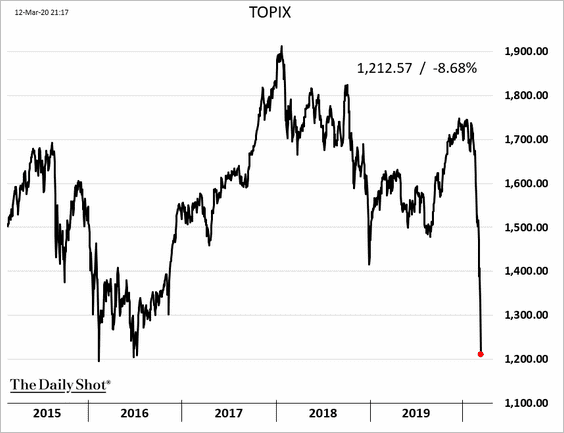
5. Japan’s Topix index hit the lowest level since 2016.
The Eurozone
1. The ECB did not cut the benchmark rate deeper into negative territory (as was expected). The central bank did, however, increase its QE program by €120 billion this year and boosted targeted lending to banks (chart below).
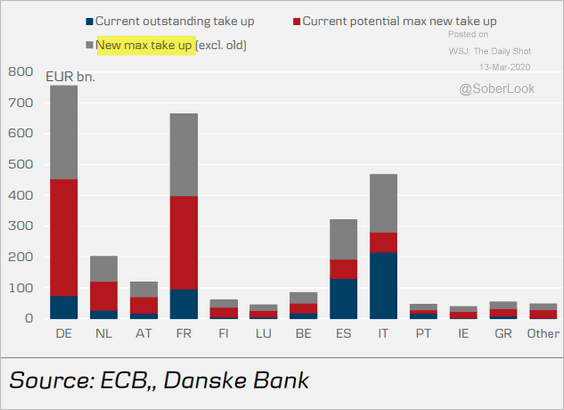 Source: Danske Bank
The ECB’s comments were quite dovish.
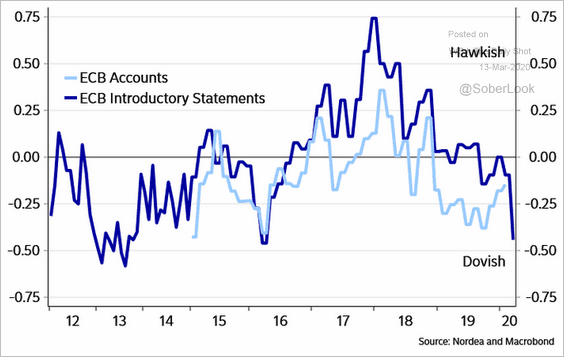 Source: @NordeaMacroLab
——————–
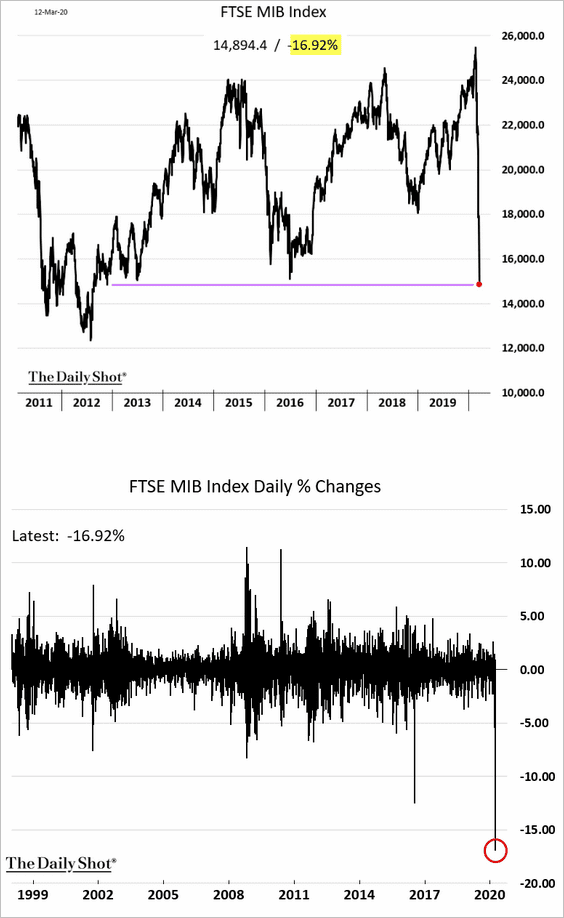
2. Equity markets were disappointed with the ECB’s action, sending the STOXX 600 index to the lowest level since 2013. The 11.5% one-day decline was the largest in decades.
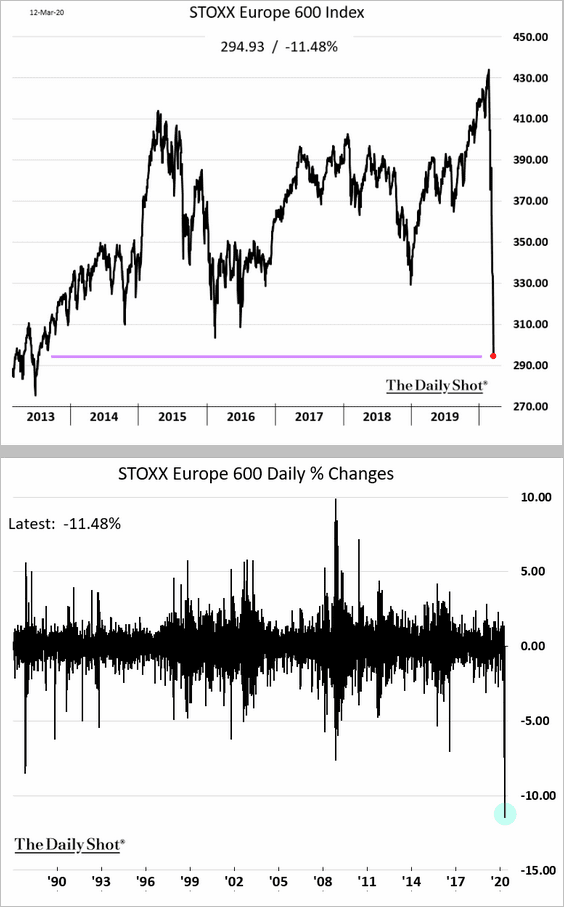
Italy’s stock market index tumbled 17% in a single day.
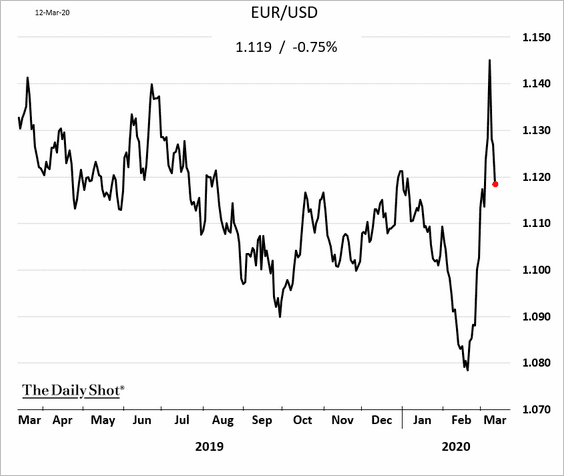
3. The euro weakened.
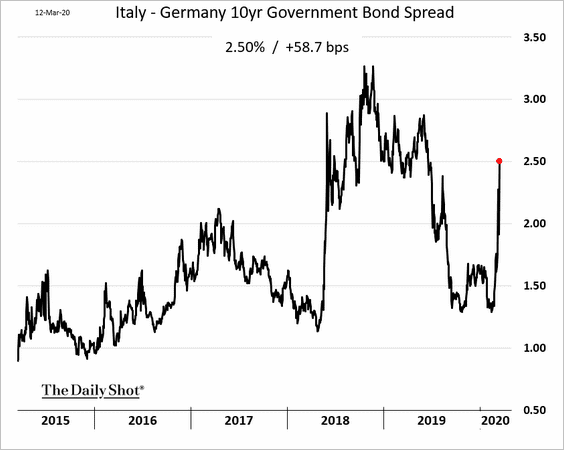
4. Periphery bond yields and spreads rose sharply.
• Italian 10yr yield daily changes:
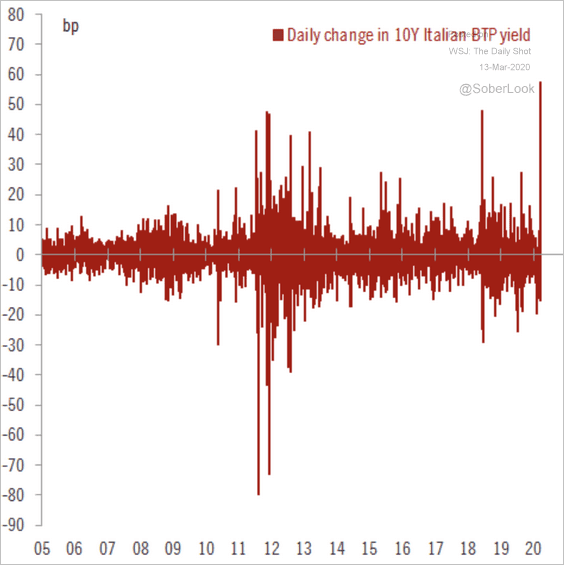 Source: @fwred
• Italy – Germany 10yr spread:
——————–
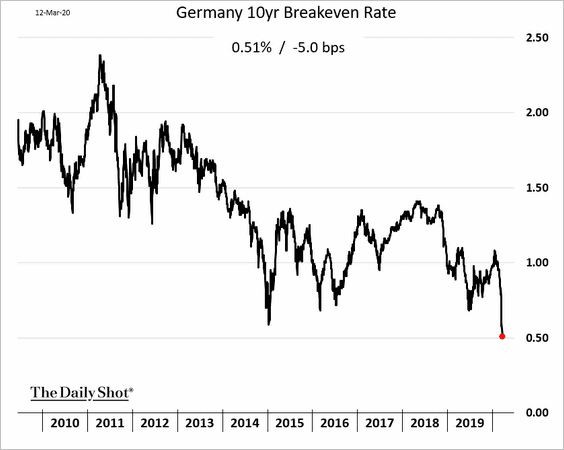
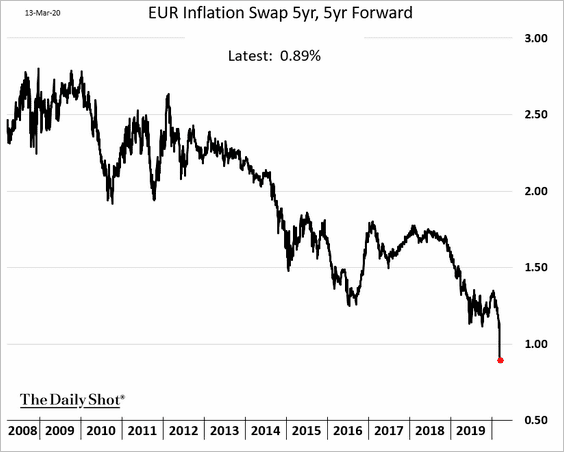
5. The risk of deflation in the Eurozone has risen significantly. Below are two market-based inflation expectations indicators.
• Germany 10yr breakeven rate:
• EUR 5yr, 5yr forward inflation swap:
——————–
6. Analysts expect more country-wide lockdowns in the Eurozone.
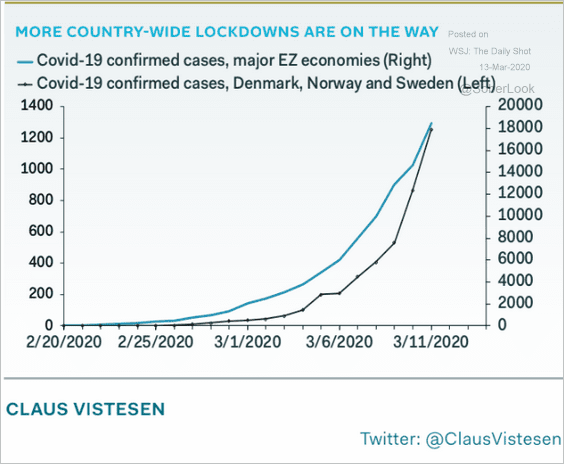 Source: Pantheon Macroeconomics
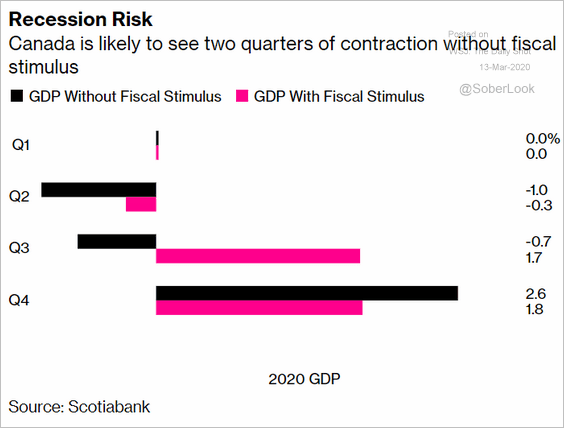
Canada
Recession risks have risen substantially.
 Source: @markets Read full article
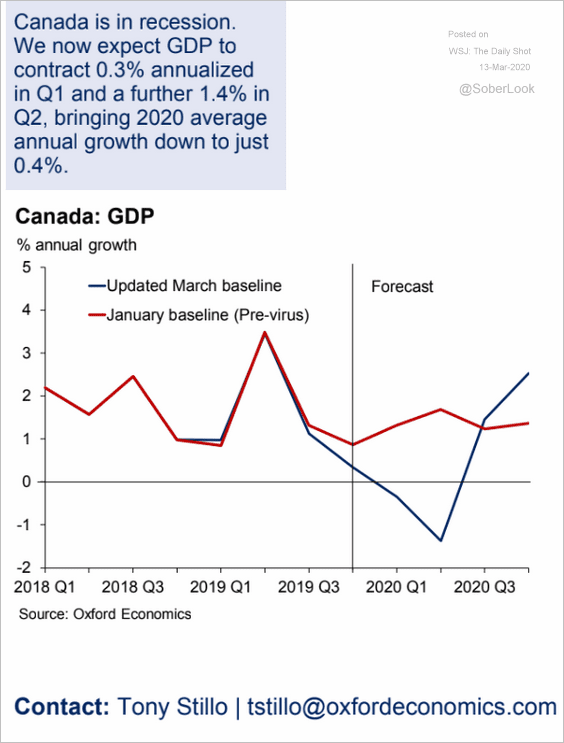 Source: Oxford Economics
The United States
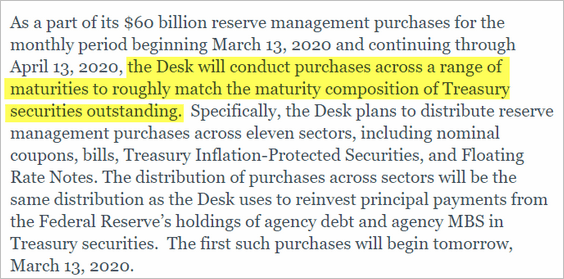
1. The Fed moved aggressively on Thursday to ease policy and lubricate the funding markets.
• The central bank turned its T-Bill purchasing program into a full-blown quantitative easing, planning to buy Treasuries across all maturities.
 Source: NY Fed Read full article
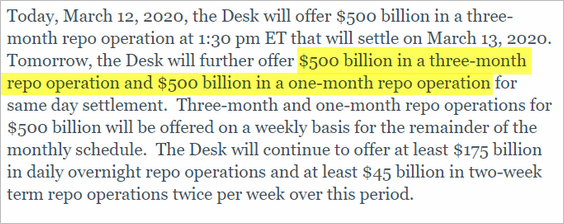
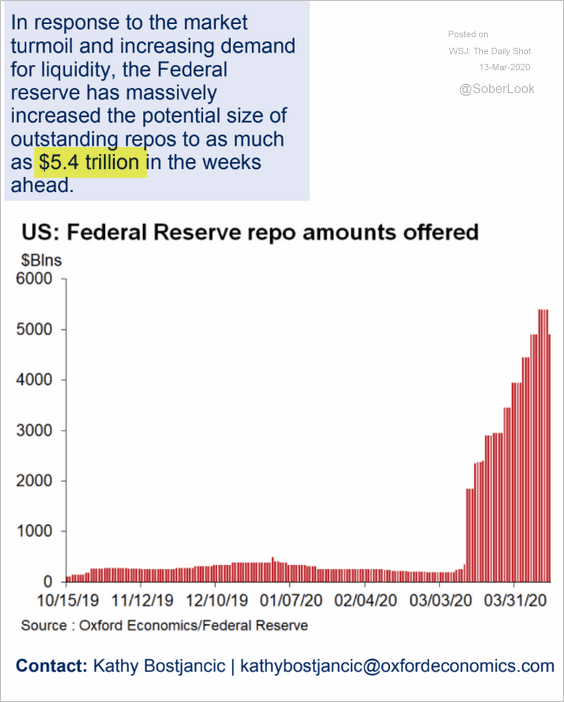
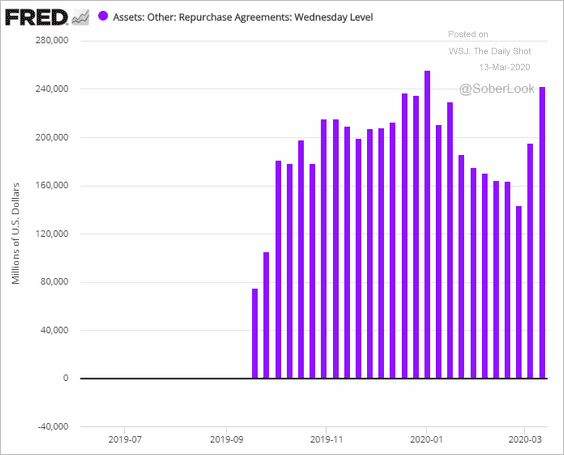
• The Fed dramatically increased its repo financing offerings, including term repo. The move will result in massive liquidity injections into the US funding markets.
 Source: NY Fed Read full article
 Source: Oxford Economics
The demand for repo financing has been climbing over the past couple of weeks.
——————–
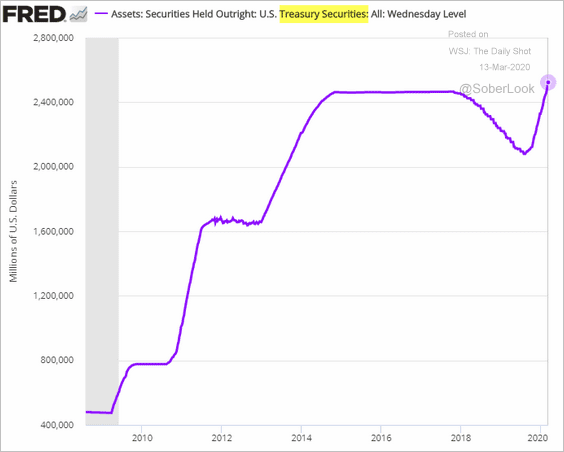
2. The Fed’s holdings of Treasuries hit a record high and will keep rising.
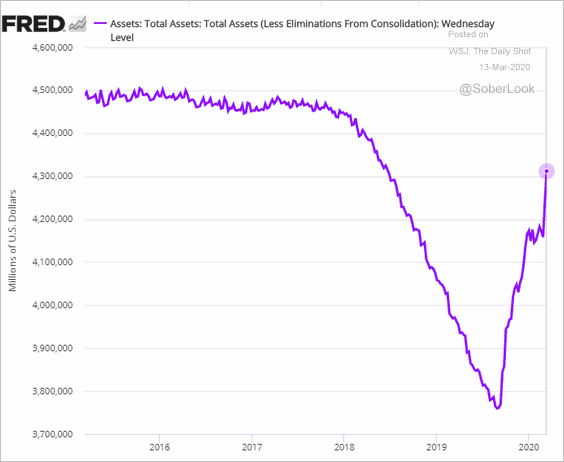
The combination of increased repo financing and Treasury purchases further boosted the Fed’s balance sheet this week.
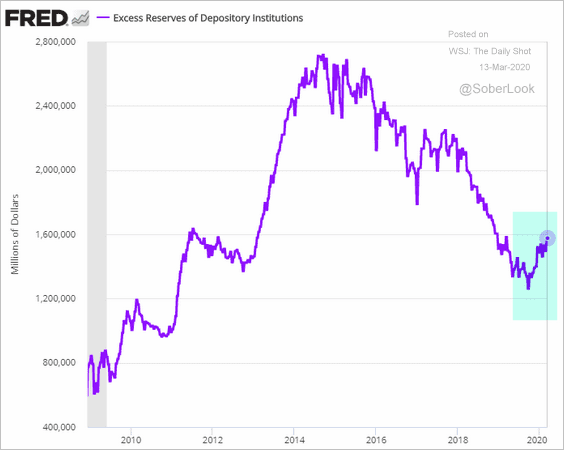
Excess reserves rose.
——————–
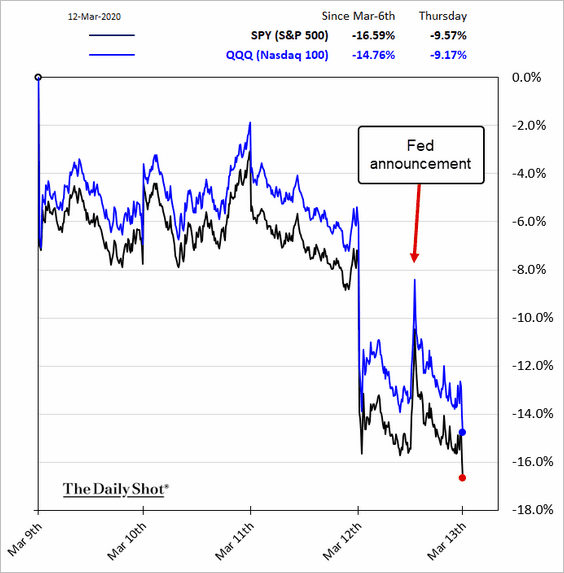
3. The stock market jumped in response to the Fed’s action but proceeded to decline shortly after, dropping the most since 1986.
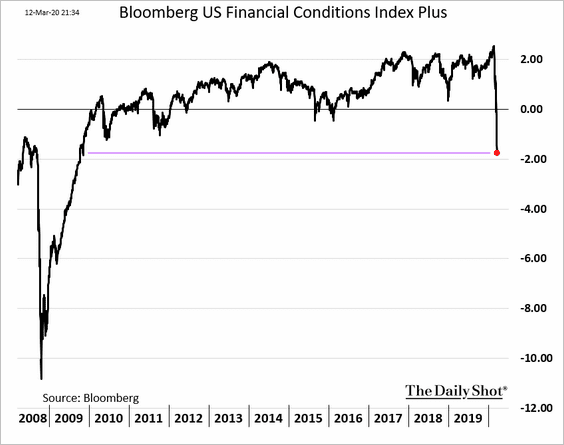
4. US financial conditions tightened further – to levels not seen since the Great Recession.
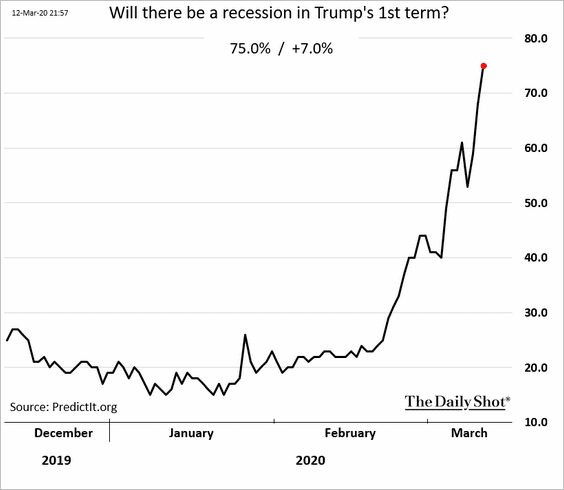
5. US recession probability has risen significantly in recent days.
• A survey of economists:
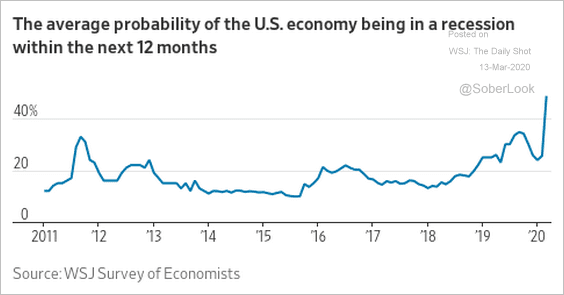 Source: @WSJecon Read full article
• The betting markets:
——————–
6. The US consumer has been relatively cautious, given the late phase in the economic cycle. Here is the personal saving rate.
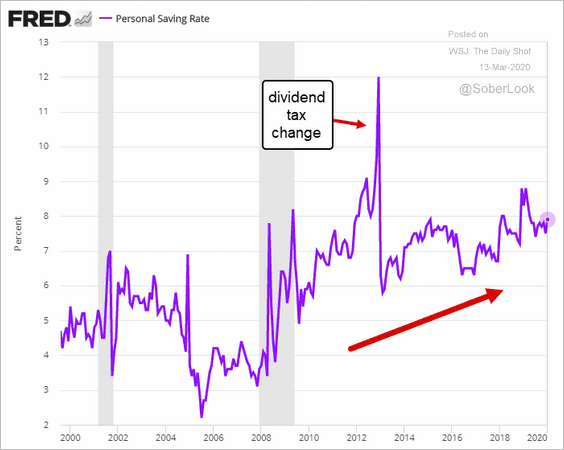
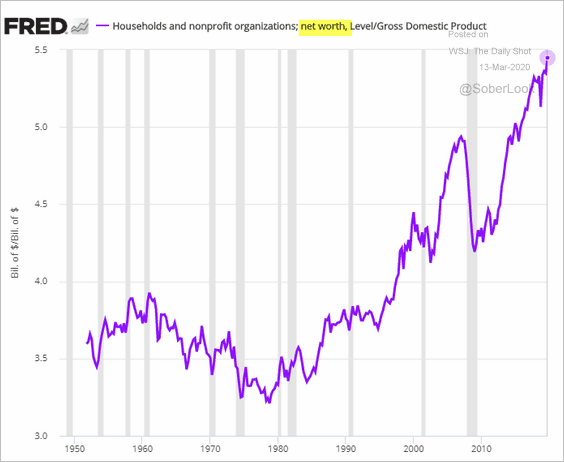
However, the hit to households’ net worth will be massive and will pressure consumption. And this is on top of the coronavirus scare.
——————–
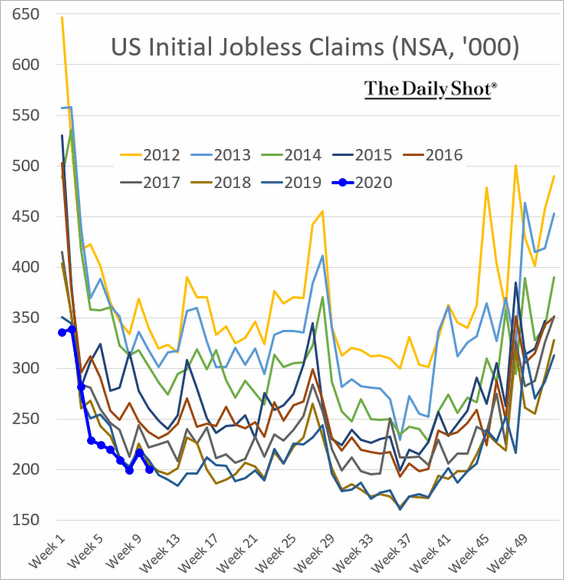
7. For now, we haven’t seen any stress in the labor market (initial jobless claims shown below), but it’s coming.
Searches for “remote” jobs have spiked.
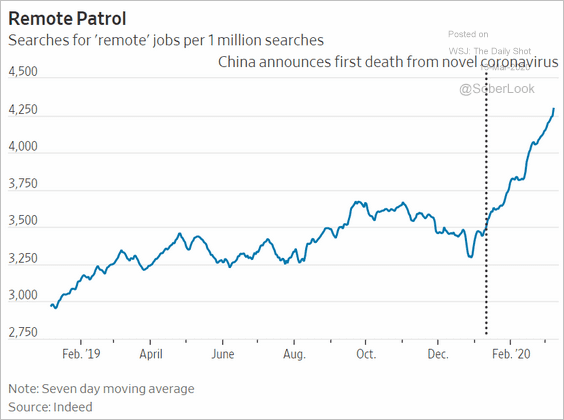 Source: @WSJ Read full article
——————–
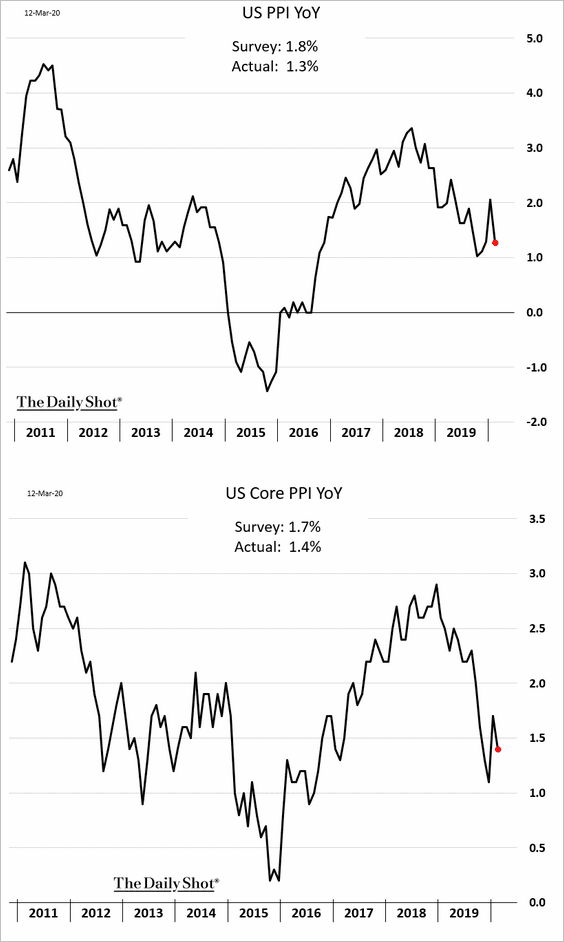
8. Producer price inflation dipped in February. But that’s just the beginning. The headline PPI will soon be in negative territory as disinflationary trends begin to dominate.
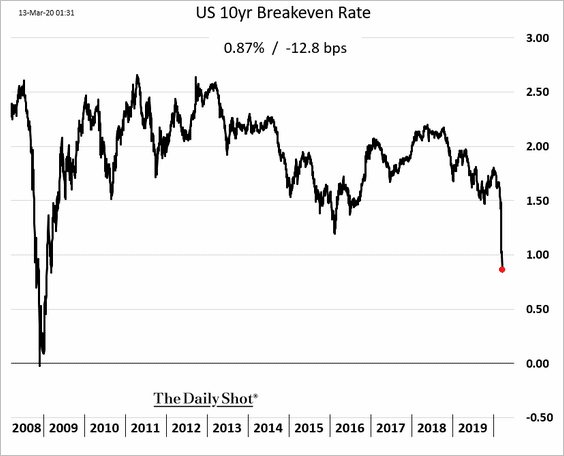
Here is a market-based inflation expectations indicator (based on inflation-linked Treasuries).
Global Developments
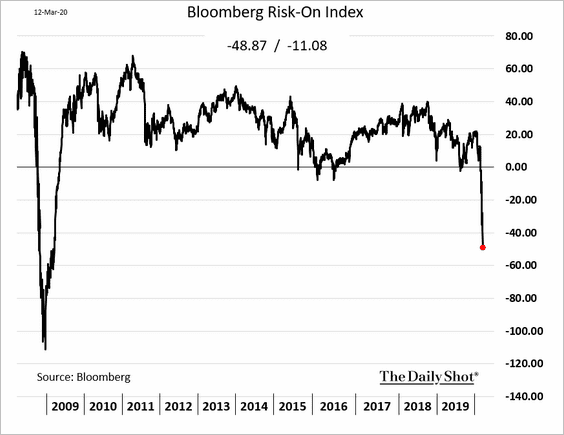
1. Bloomberg’s risk-on/off indicator is deeply in the “off” territory.
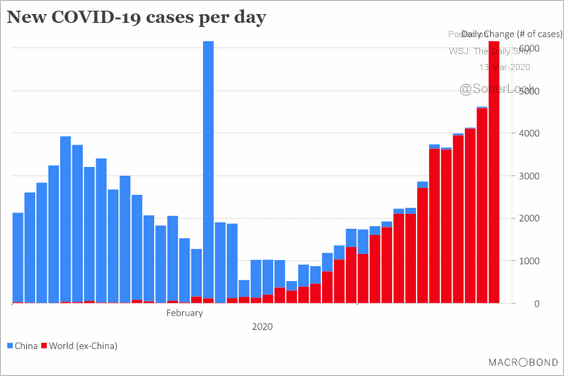
2. The number of new coronavirus cases outside of China keeps climbing (but is down to just a few a day in mainland China).
 Source: Macrobond Financial
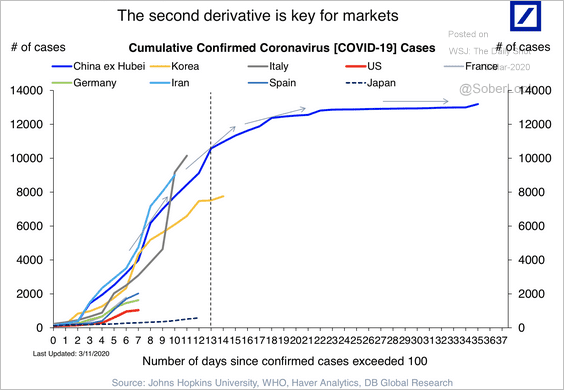 Source: Deutsche Bank Research
——————–
3. Fund flows into safe-haven assets spiked in recent days.
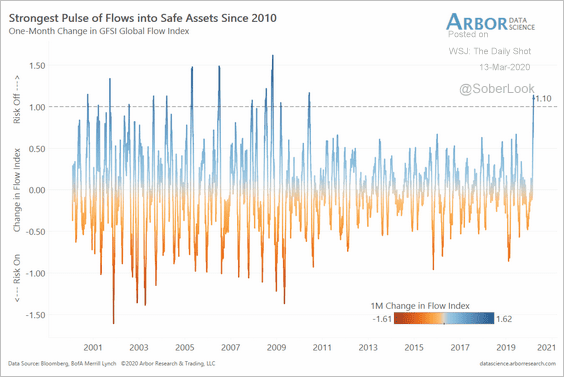 Source: Arbor Research & Trading
——————–
Food for Thought
1. Who will be impacted by the US travel ban?
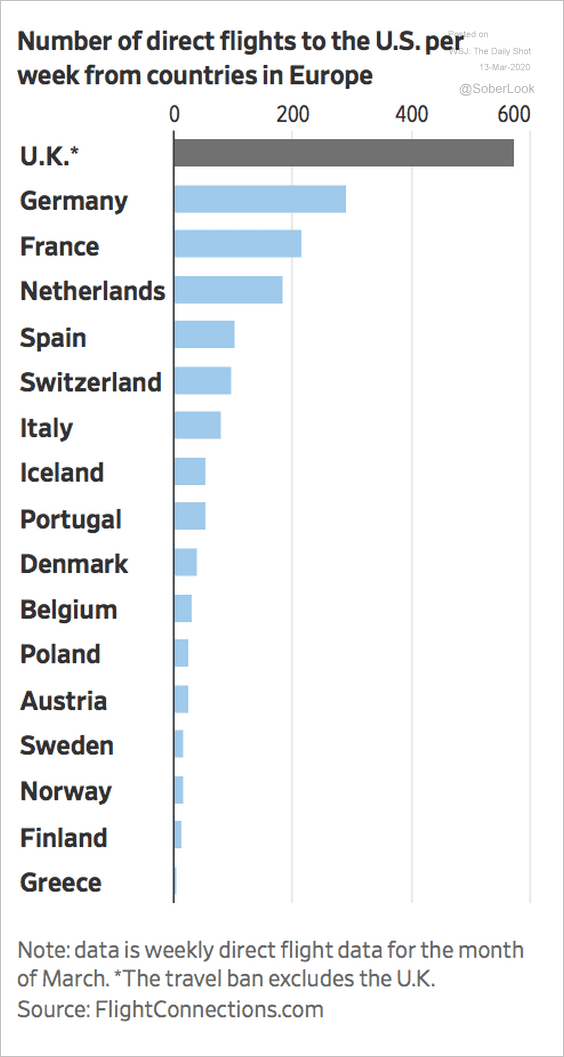 Source: @WSJ Read full article
2. US median income by type of employment:
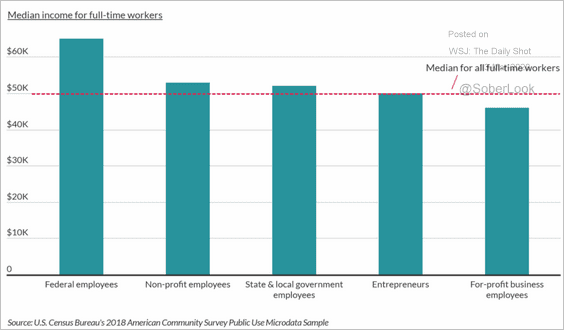 Source: ZenBusiness Read full article
3. Shutting down the internet:
 Source: Statista
4. Travel alerts (pre-coronavirus):
 Source: @onlmaps
5. US suicide statistics:
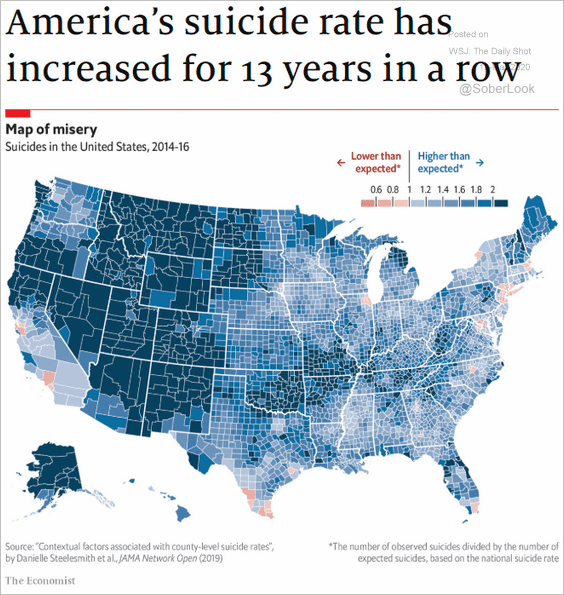 Source: The Economist Read full article
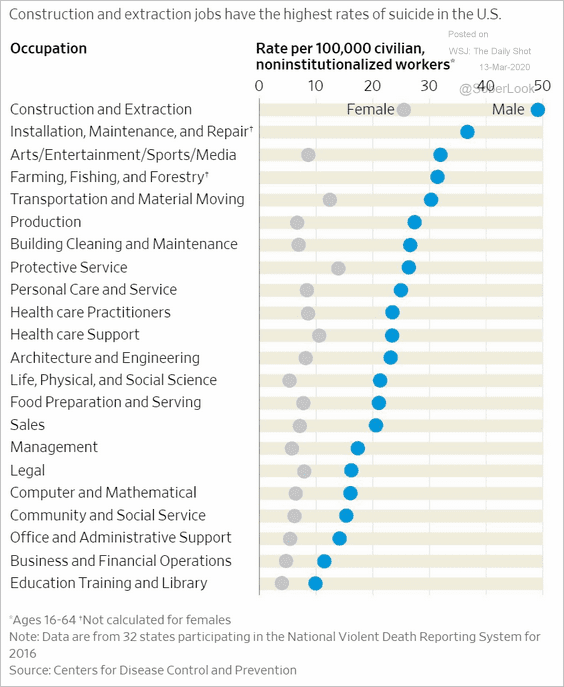 Source: @WSJ Read full article
——————–
6. Improving estimates of the coronavirus fatality rate in China:
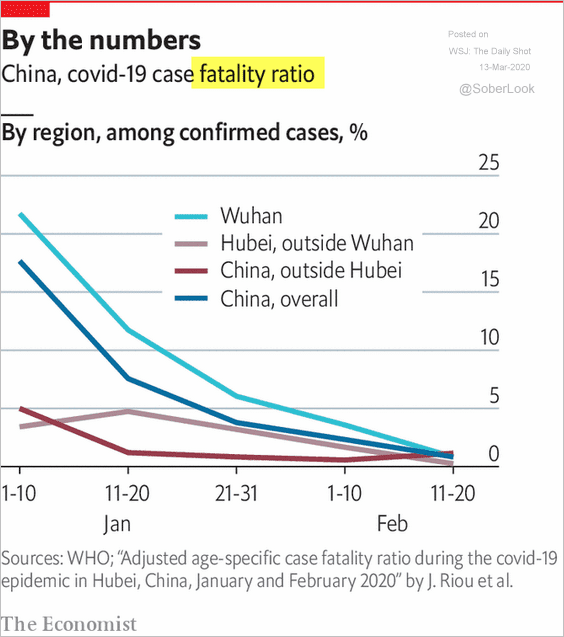 Source: The Economist Read full article
7. US sick leave availability:
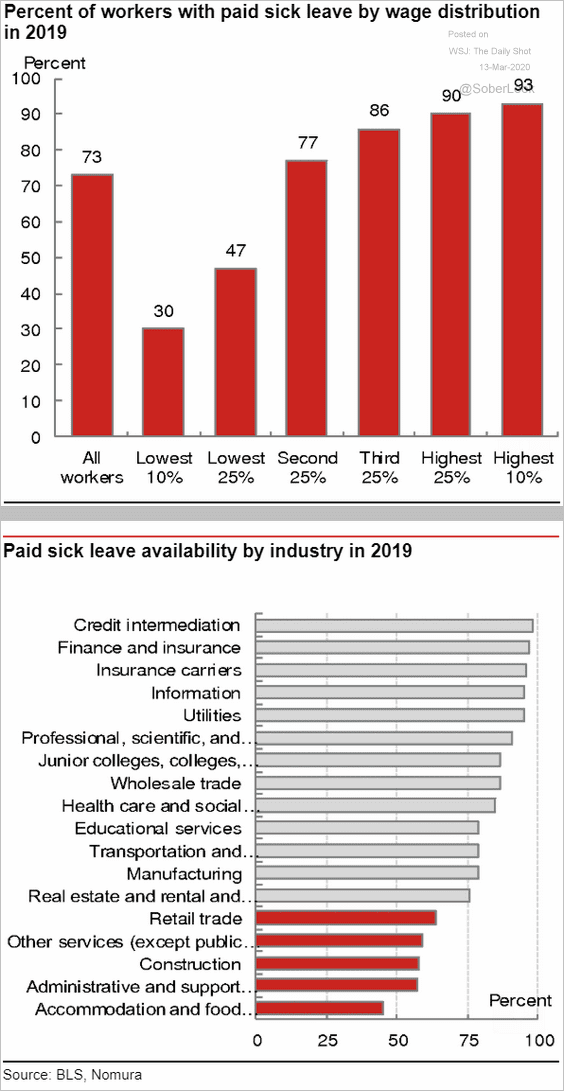 Source: Nomura Securities
8. What will Americans do when they self-quarantine?
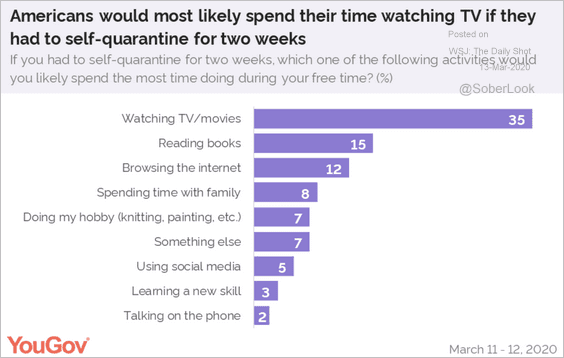 Source: @YouGovUS Read full article
——————–
Have a great weekend!