
The Daily Shot: 30-Mar-20
• The United States
• Canda
• The Eurozone
• Asia – Pacific
• China
• Emerging Markets
• Commodities
• Energy
• Equities
• Credit
• Rates
• Global Developments
• Food for Thought
The United States
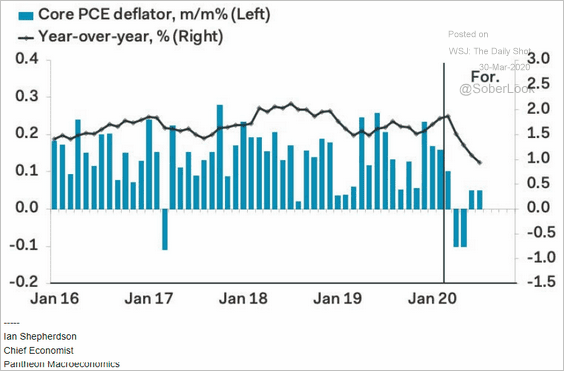
1. The core PCE inflation ticked higher in February.
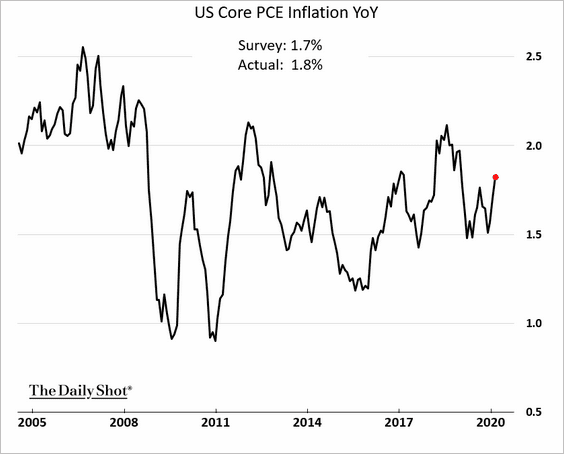
However, according to Pantheon Macroeconomics, core inflation is expected to tumble over the next few months, dipping below 1%.
 Source: Pantheon Macroeconomics
——————–
2. Consumer inflation expectations have been declining.
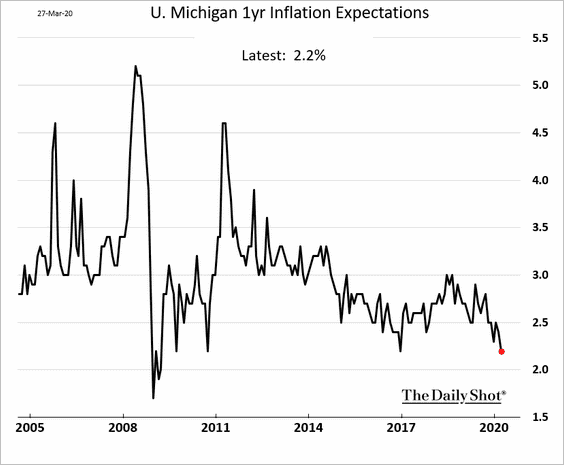
This trend will continue as gasoline prices hit multi-year lows.
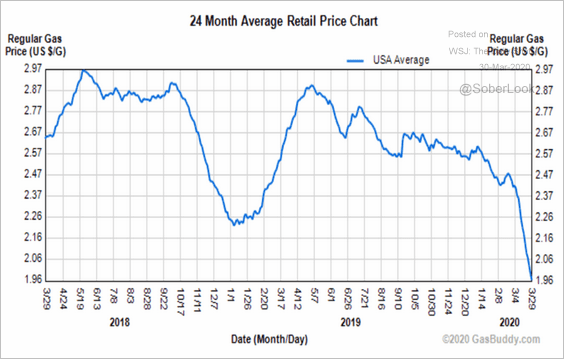 Source: GasBuddy
——————–
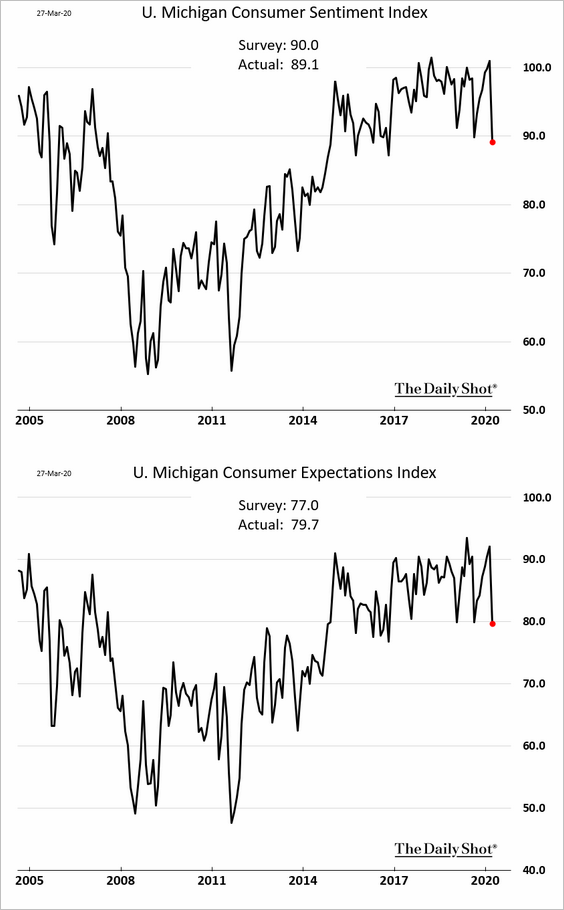
3. March consumer sentiment weakened. However, the U. Michigan data is stale, with confidence deteriorating sharply just over the past week.
4. Consumer delinquencies were picking up before the epidemic.
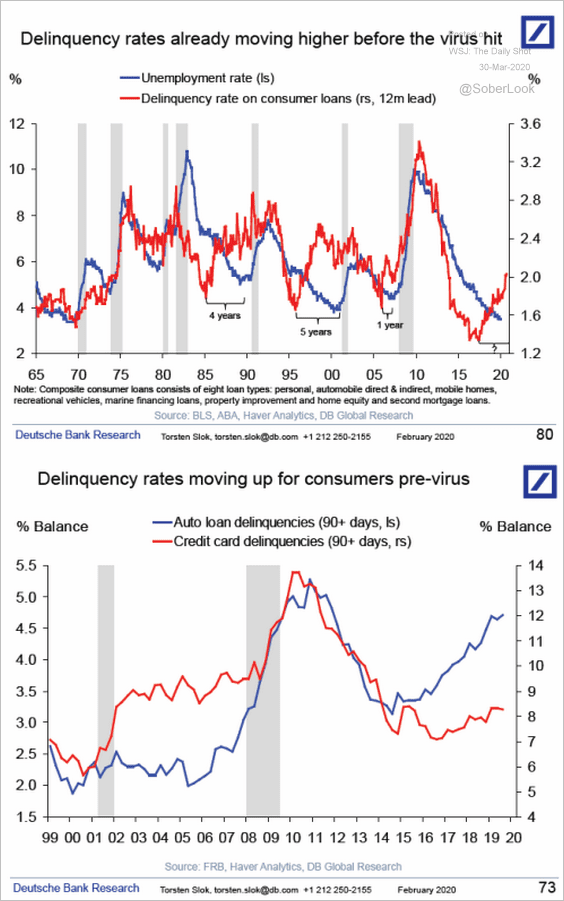 Source: Deutsche Bank Research
We are now going to see a spike in delinquency rates. Here is the Google search frequency for the phrase “can’t pay.”
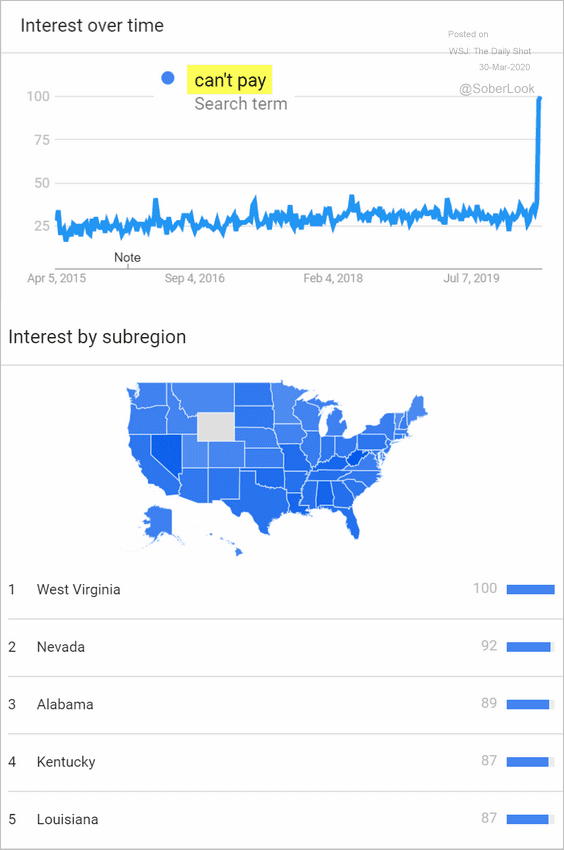 Source: Google Trends
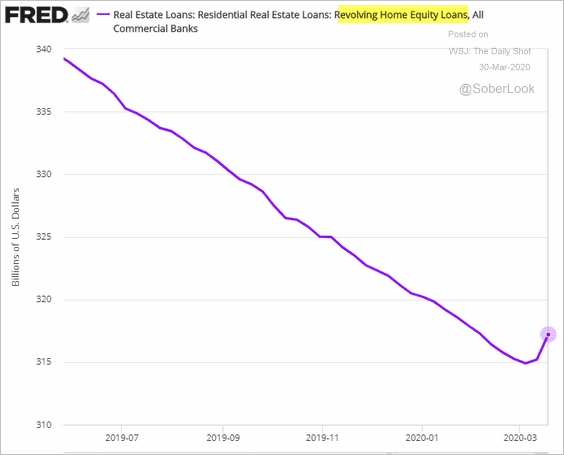
Households are starting to tap home equity lines of credit.
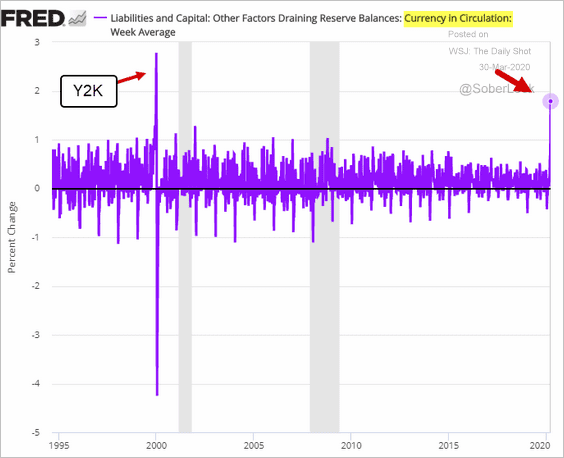
5. Americans have been hoarding cash at the fastest pace since the Y2K jitters two decades ago. The chart below shows weekly changes in “currency in circulation.”
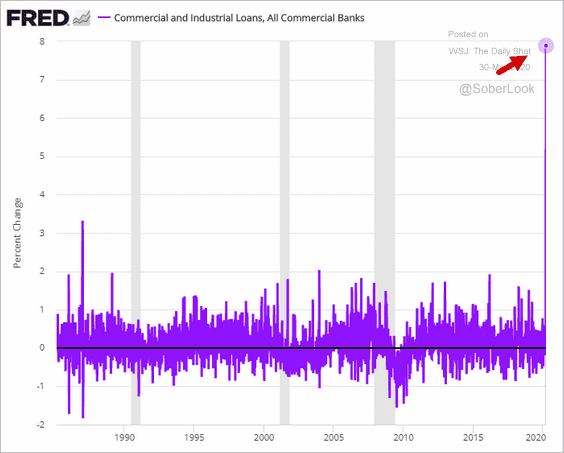
6. US business loan balances jumped by the highest percentage on record as companies rushed to tap their credit lines.
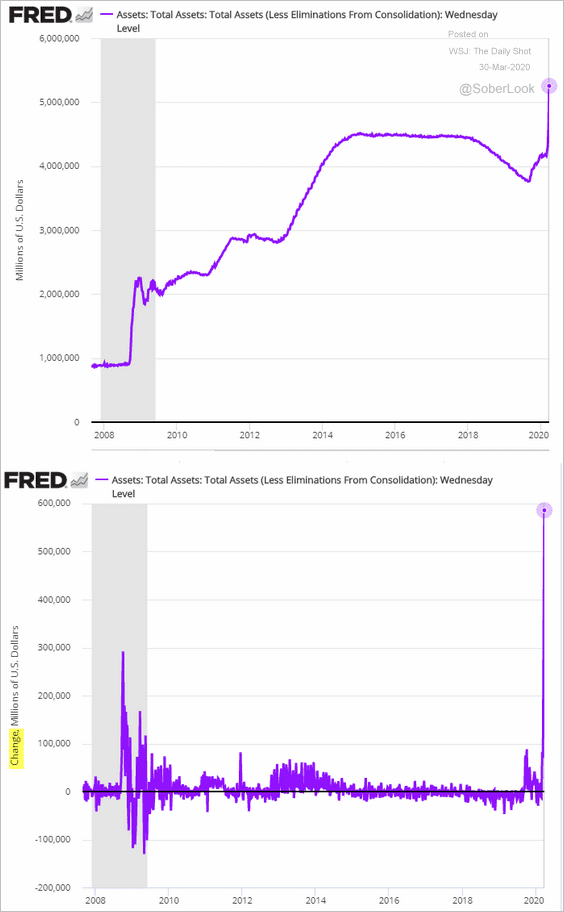
7. Next, we have some updates on the Fed’s market activity.
• The US central bank’s balance sheet hit a new high, with the largest weekly increase on record (by far).
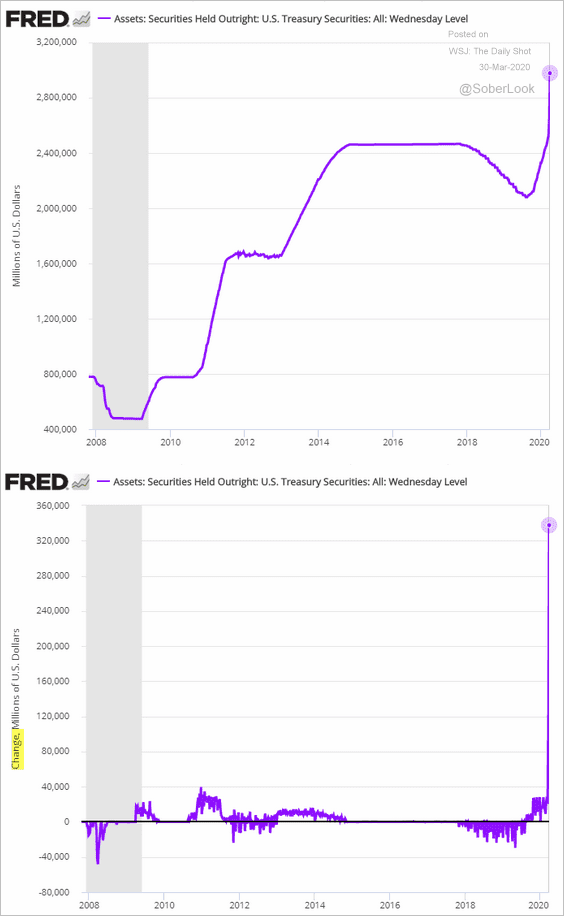
• The increase was driven by massive purchases of Treasury securities.
– The Fed’s buying sent the 5-year Treasury yield to a record low, …
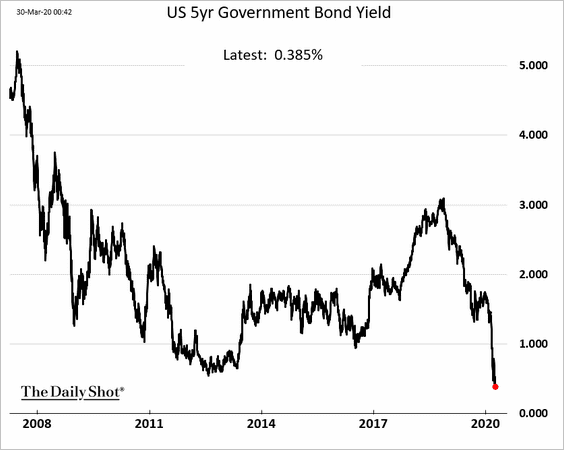
… and tamed Treasury volatility.
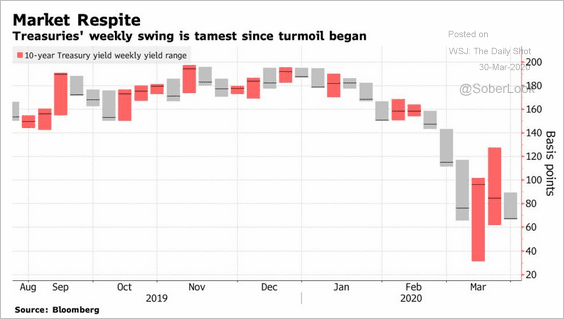 Source: @markets Read full article
——————–
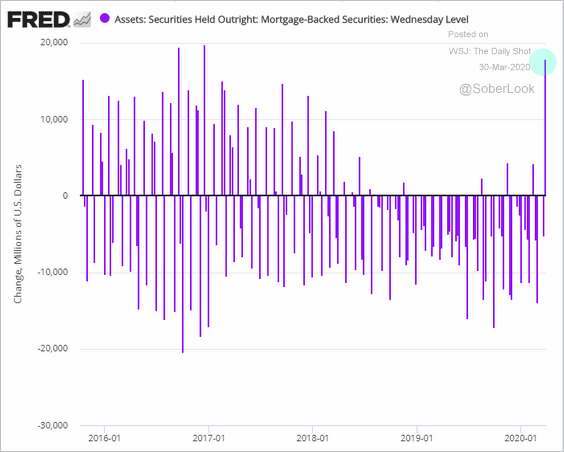
• The purchase of mortgage-backed securities was also relatively large.
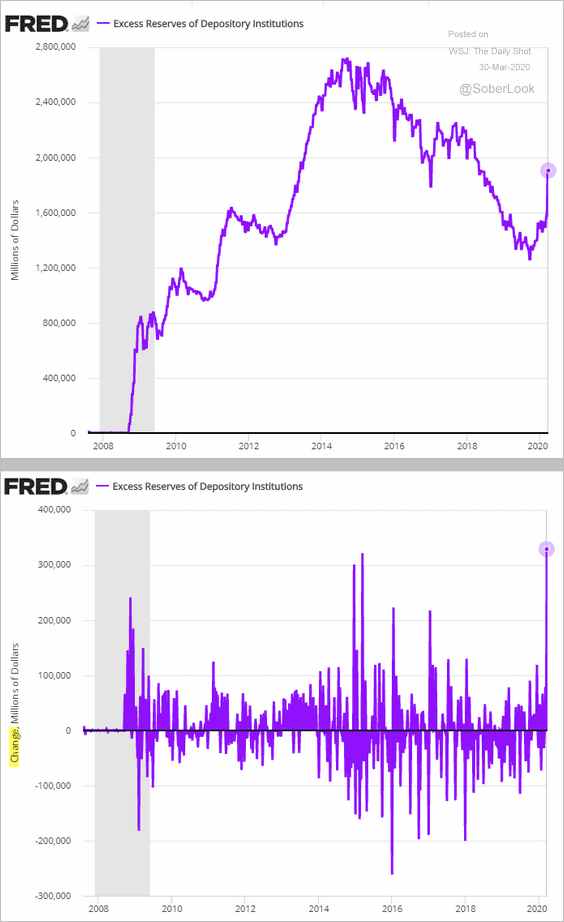
• As a result of this spike in quantitative easing, excess reserves rose sharply.
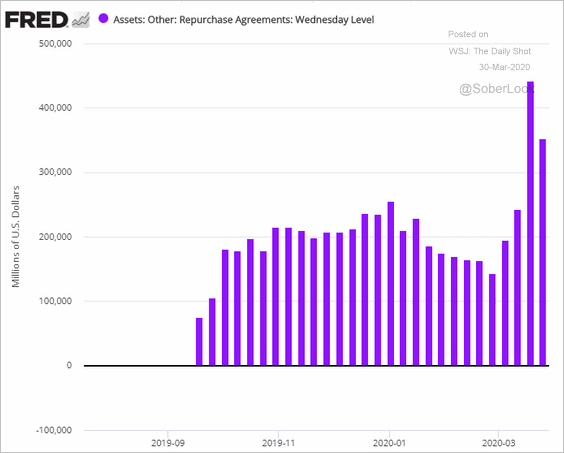
• With the Fed injecting massive amounts of liquidity, the demand for repo financing moderated last week.
• How much will the Federal Reserve’s efforts offset tumbling corporate earnings? The chart below compares the Fed’s balance sheet to expected changes in earnings per share.
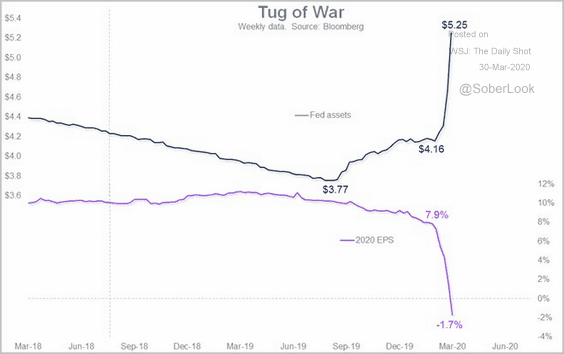 Source: @carlquintanilla, @TimmerFidelity
• The Fed’s aggressive actions boosted demand for gold. This chart shows weekly changes in the largest gold-focused ETF’s holdings.
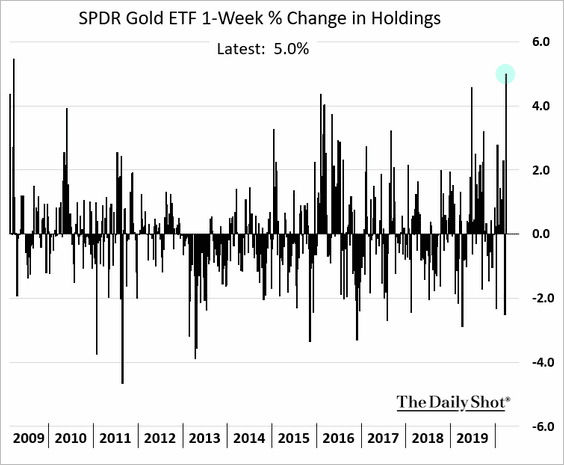 h/t Ranjeetha Pakiam, @TheTerminal
Analysts also expect the rising liquidity from quantitative easing to put downward pressure on the US dollar.
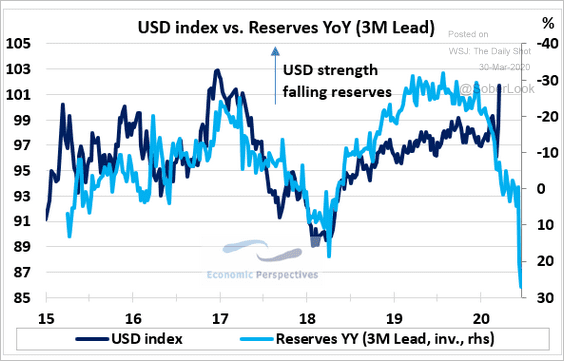 Source: Economic Perspectives
——————–
8. The speed of economic contraction has been unprecedented. Here is Deutsche Bank’s activity index in terms of the number of standard deviations.
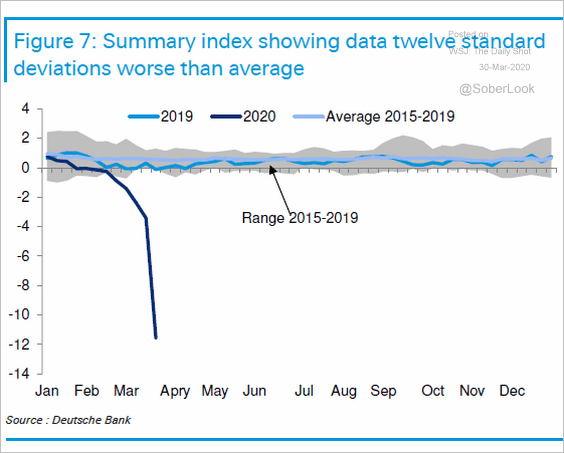 Source: Deutsche Bank Research, @tracyalloway
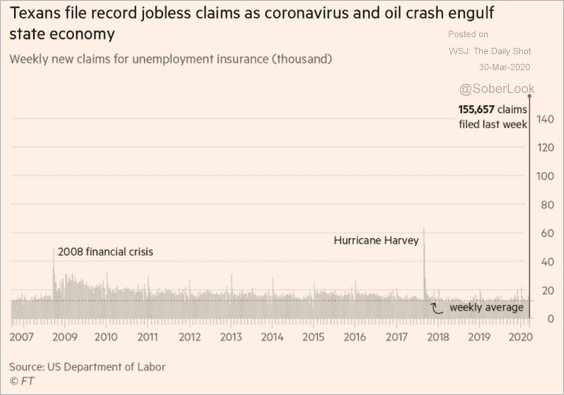
This chart compares the initial jobless claims now and in 2008.
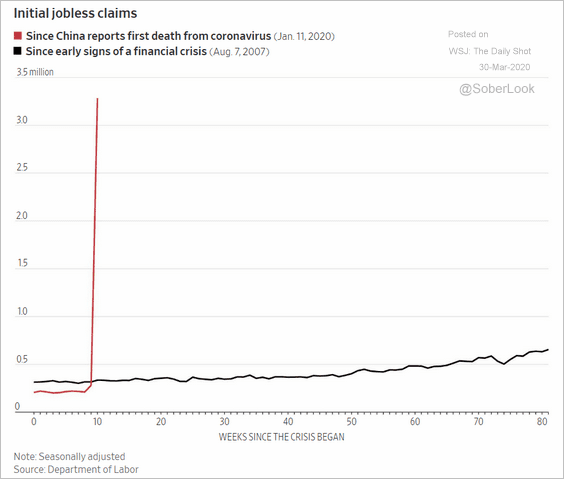 Source: @WSJ Read full article
• The fiscal and monetary response has also been remarkably fast. Here is a comparison to 2008/2009.
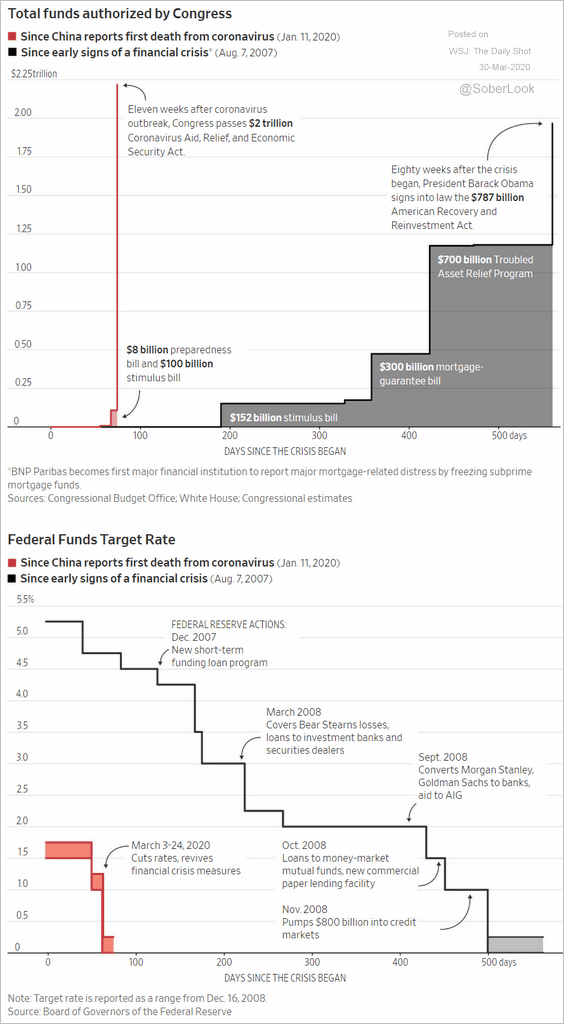 Source: @WSJ Read full article
Below is the breakdown of the federal government’s $2bn program.
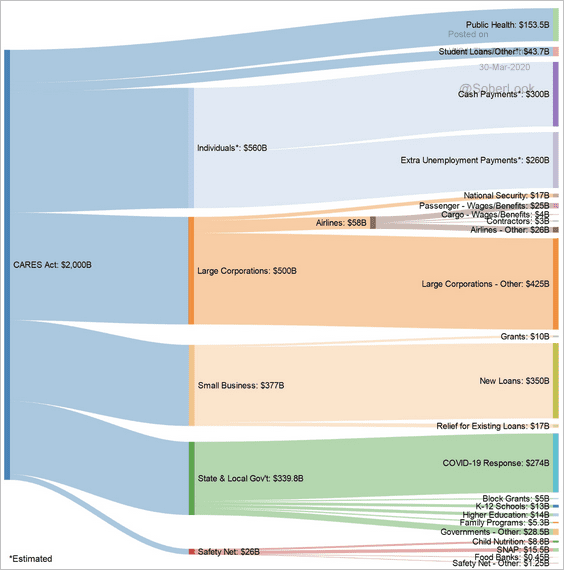 Source: @timkmak Read full article
• Will Congress put together another stimulus package? How much will the deficit rise?
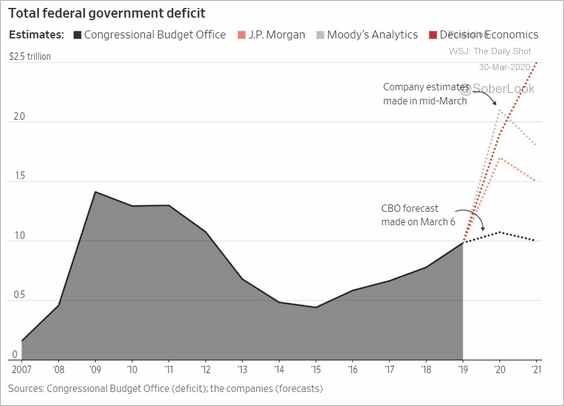 Source: @WSJ Read full article
——————–
9. Who is most at risk of being laid off in the current environment?
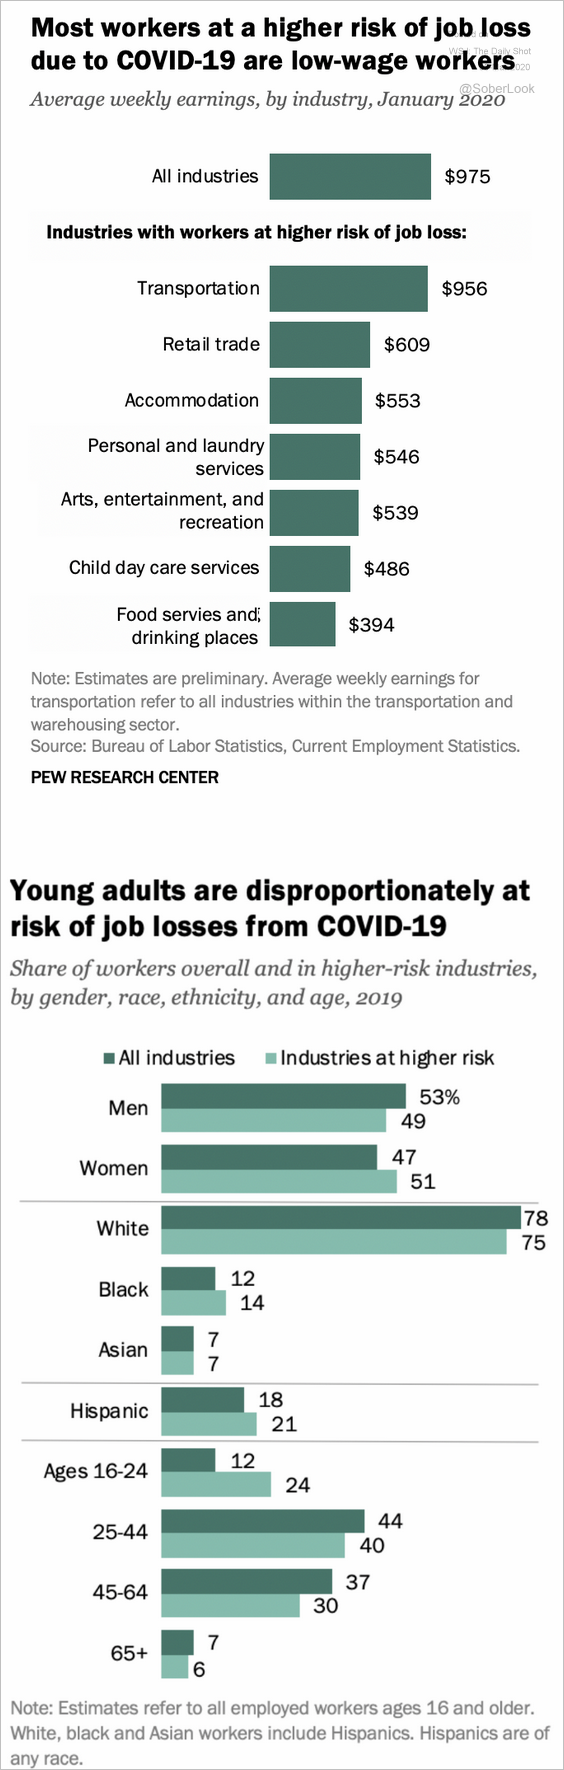 Source: Pew Research Center Read full article
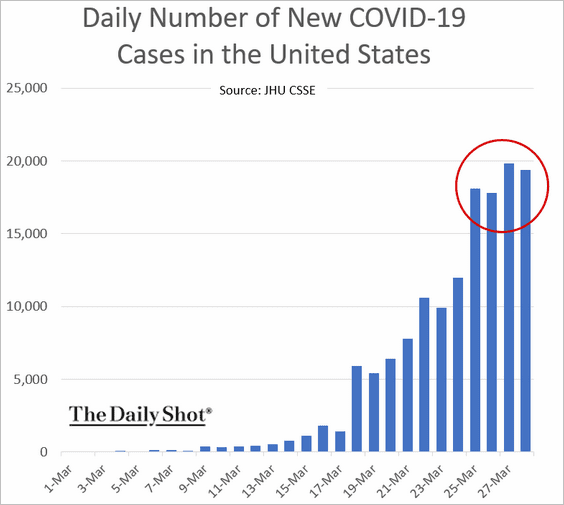
10. The rise in the total number of new US coronavirus cases has been relatively subdued in the past four days.
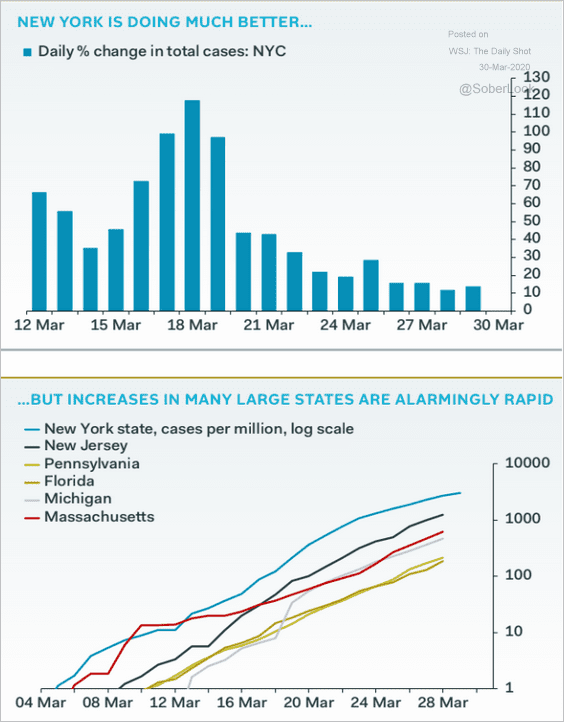
Growth in New York City cases has slowed, but other areas see rapid increases.
 Source: Pantheon Macroeconomics
Canda
1. The Bank of Canada cut rates by 50 bps and will begin large-scale securities purchases (including commercial paper).
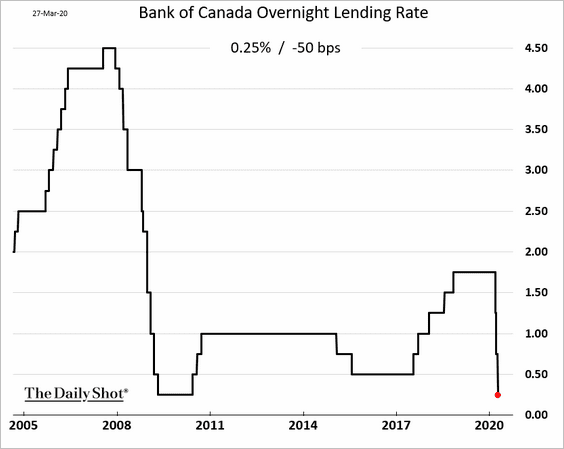
Here are some estimates from Scotiabank Economics.
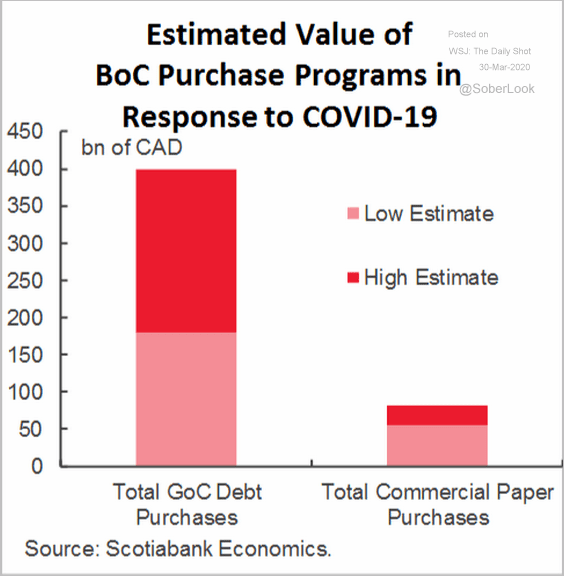 Source: Scotiabank Economics
——————–
2. Fiscal stimulus has picked up momentum as well.
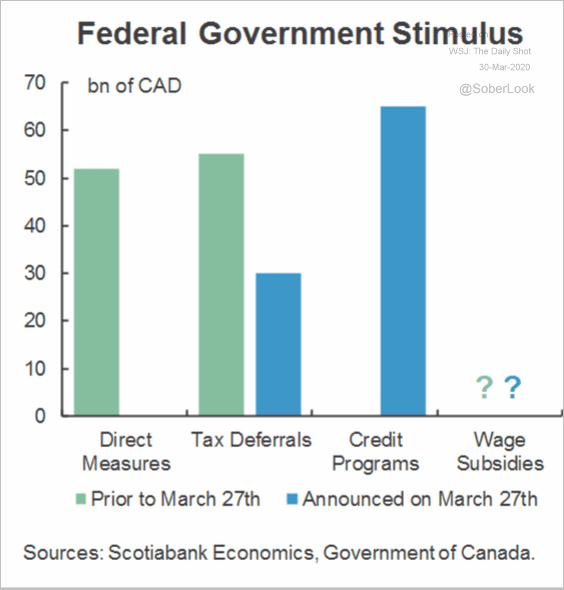 Source: Scotiabank Economics
The Eurozone
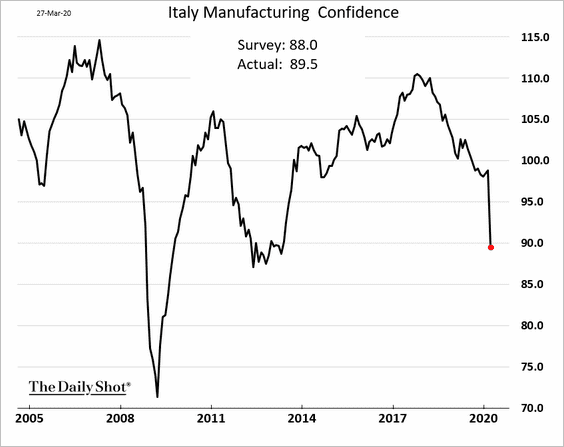
1. Let’s begin with Italy.
• Sentiment indicators have deteriorated, and further weakness is expected.
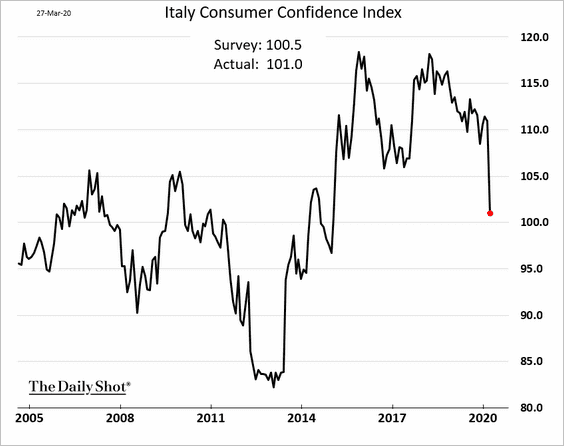
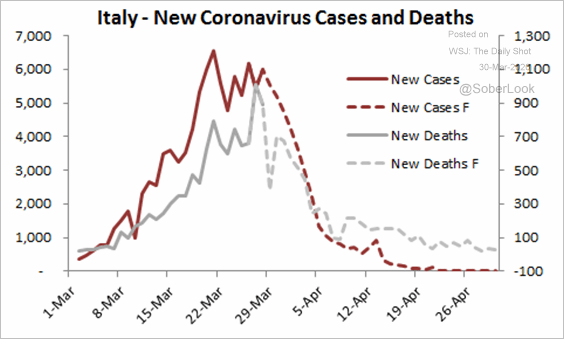
• The number of new coronavirus cases and fatalities has peaked.
 Source: Princeton Energy Advisors
 Source: @business Read full article
But the peak is lasting longer than what we saw in China and South Korea.
 Source: Pantheon Macroeconomics
——————–
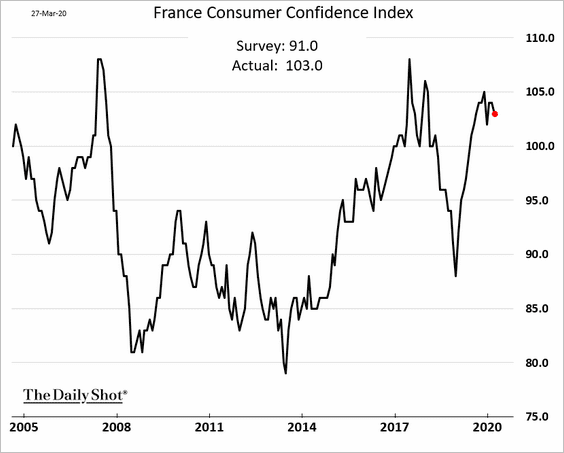
2. French consumer sentiment has been remarkably resilient. The April figures are likely to be much worse, however.
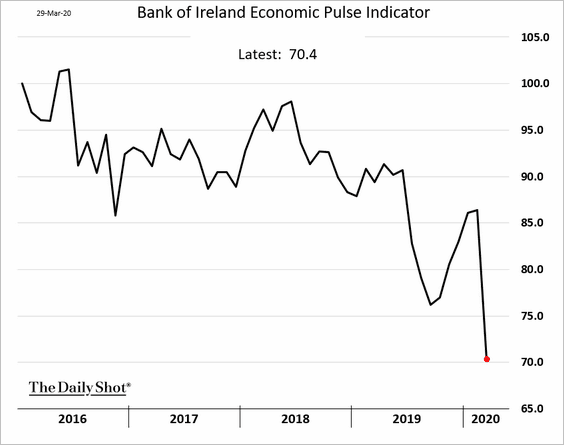
3. Here is the Bank of Ireland’s Economic Pulse Indicator, which combines consumer and business confidence.
Asia – Pacific
1. Japan is ramping up fiscal stimulus.
 Source: Reuters Read full article
2. Australia’s job postings tumble.
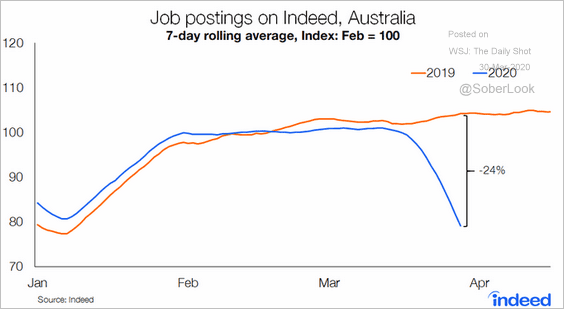 Source: @CallamPickering, @IndeedAU
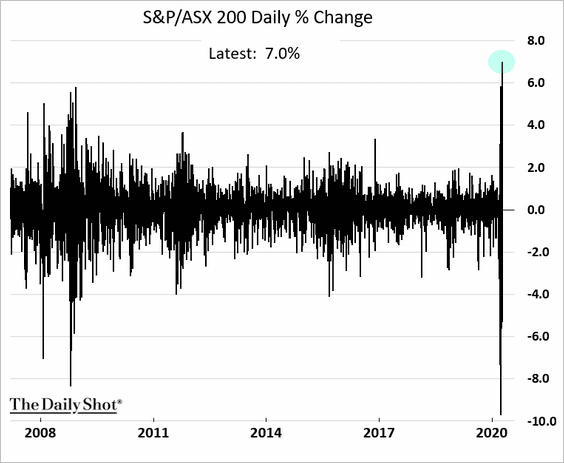
Separately, Australia’s benchmark stock market index jumped by the highest percentage on record on Monday.
China
1. Activity indicators continue to point to a gradual recovery.
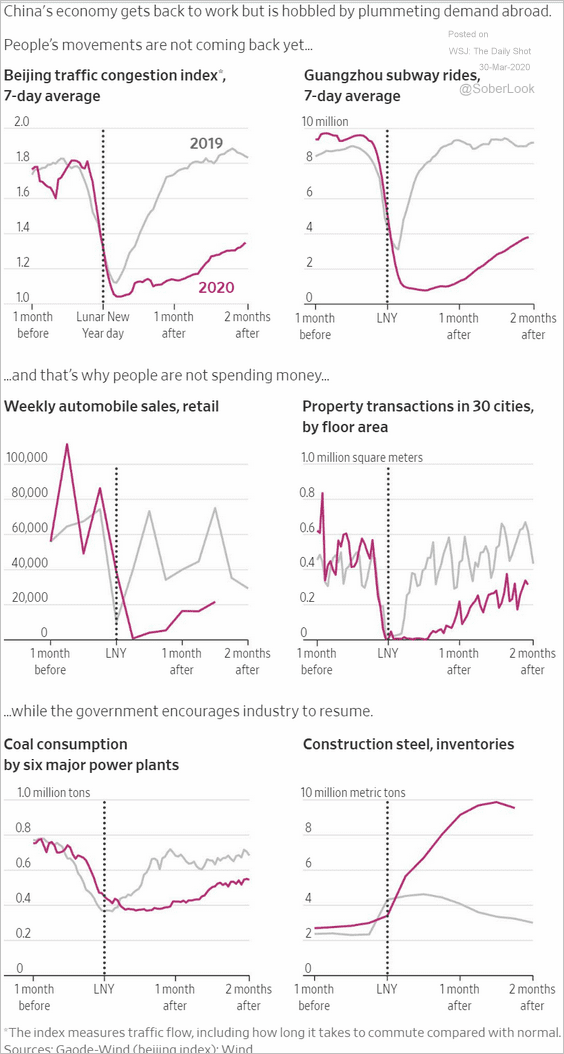 Source: @WSJ Read full article
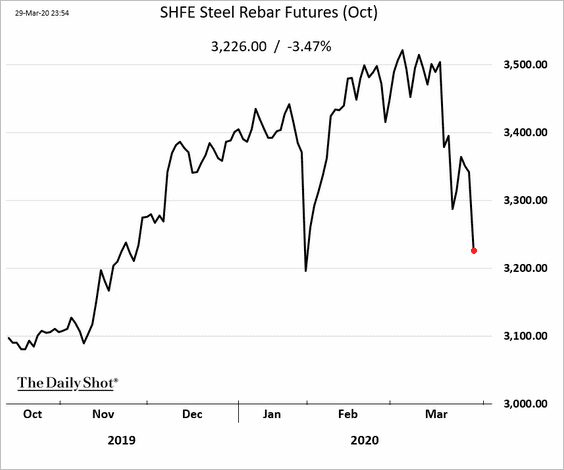
But with the global demand collapsing, China’s rebound will be tepid. This chart shows the steel rebar futures price in Shanghai (signaling weakness in construction).
——————–
2. China’s households are stretched.
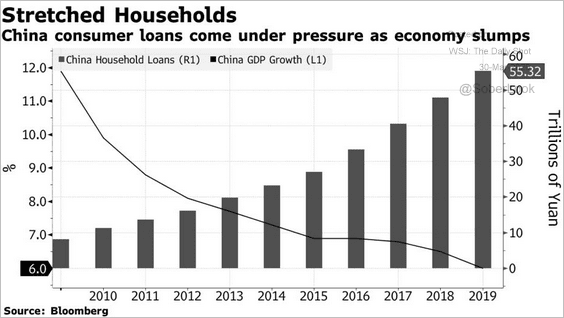 Source: @business Read full article
Nonetheless, consumer shares are outperforming, suggesting that households are starting to spend.
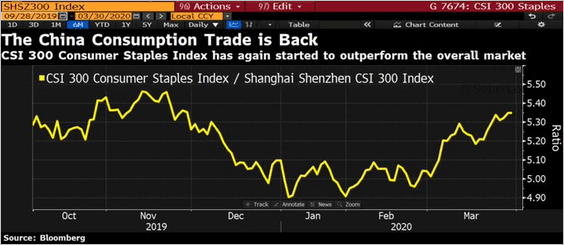 Source: @DavidInglesTV
Emerging Markets
1. Mexico’s trade balance continues to improve.
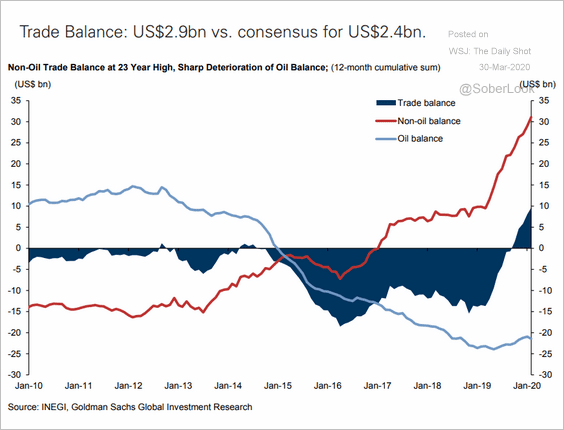 Source: Goldman Sachs
The recent gains, however, are driven by weak domestic demand.
 Source: ING
——————–
2. The Russian ruble is correlated with crude oil again.
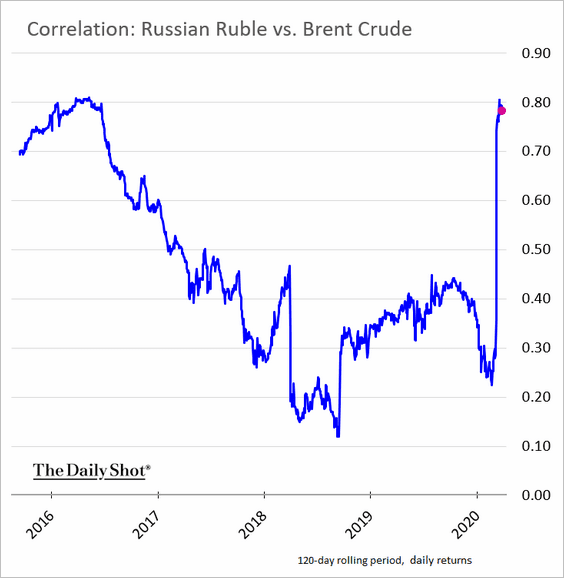 h/t Aine Quinn, @TheTerminal
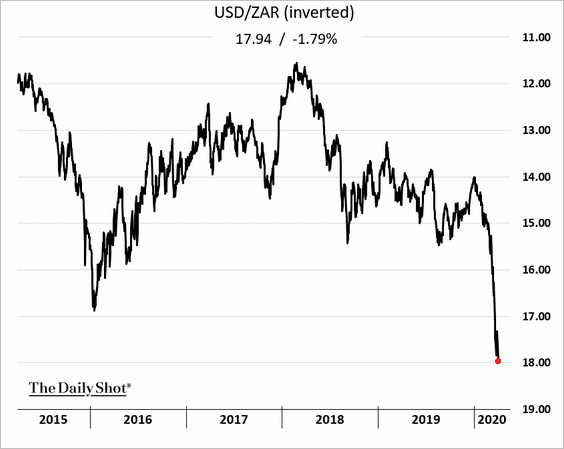
3. The South African rand hit a record low.
Commodities
1. The copper/gold ratio made a new 20-year low, which suggests risk-off conditions persist for the time being.
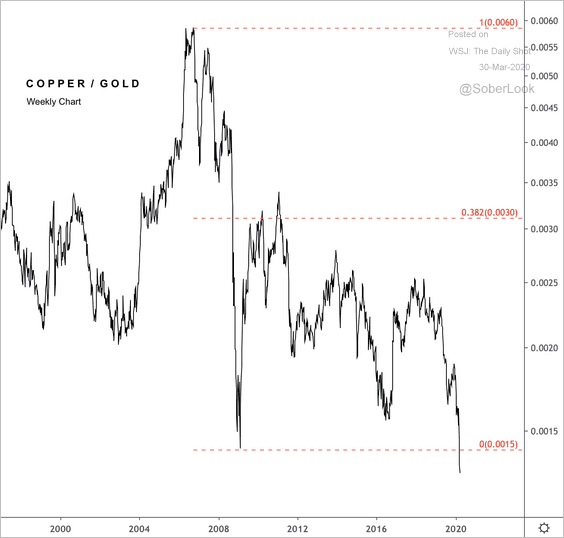 Source: @DantesOutlook
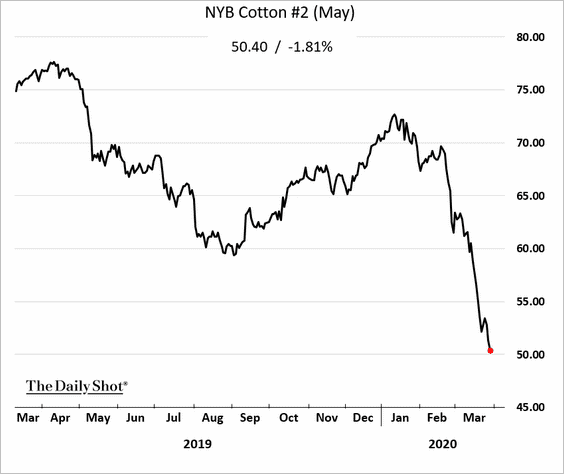
2. US cotton futures continue to sink on concerns about global demand.
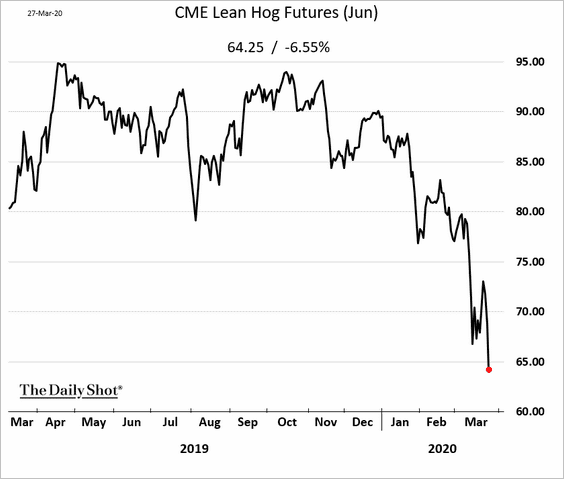
3. The Chicago lean hog futures are tumbling.
Energy
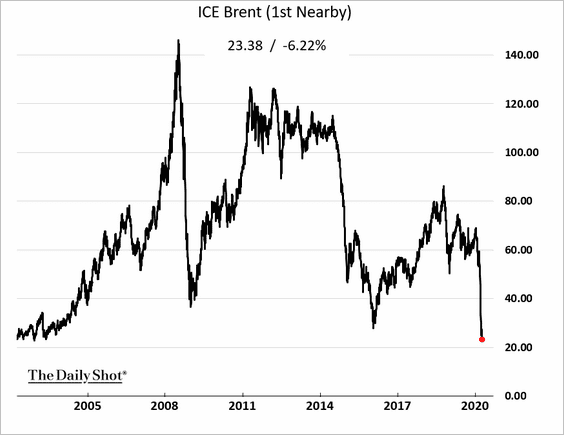
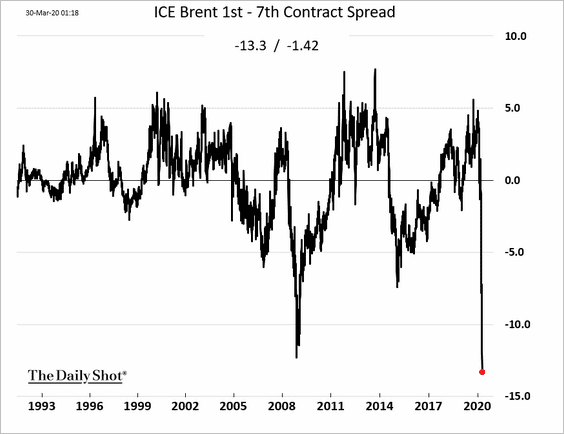
1. Brent crude hit the lowest level since 2003.
• And Brent contango is at record levels.
• US crude oil futures are testing support at $20/bbl.
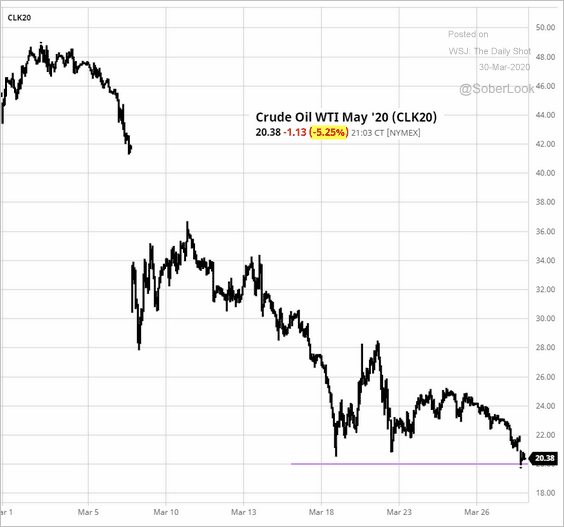
• It’s been the worst quarter on record.
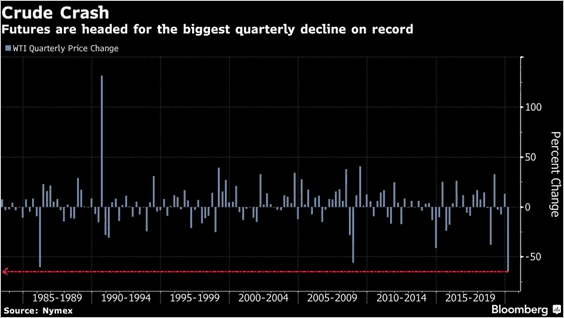 Source: @markets Read full article
——————–
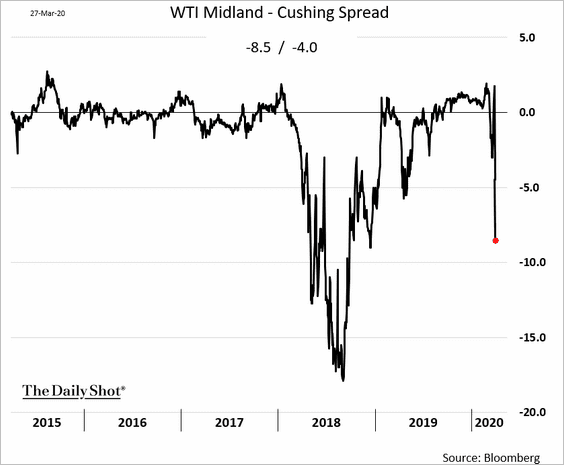
2. The Permian Basin crude oil (Midland) is once again trading at a steep discount to the US benchmark.
3. Oil majors have cut capital expenditures across the board.
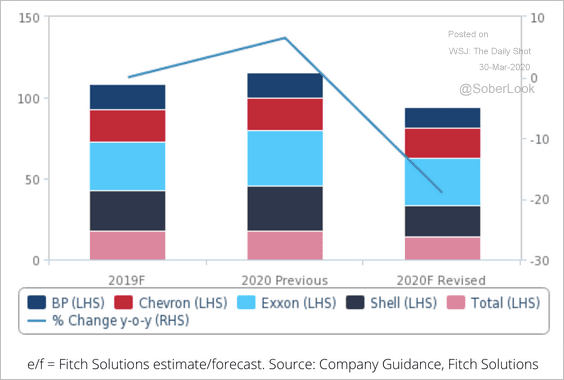 Source: Fitch Solutions Macro Research
The total US oil rig count is tumbling.
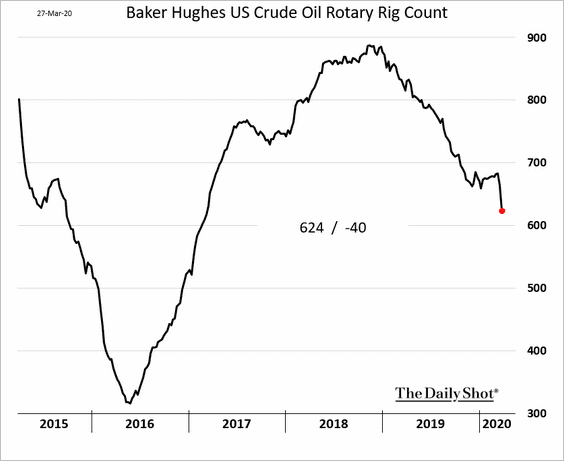
The implosion in the sector will be particularly painful for Texas.
 Source: @financialtimes Read full article
——————–
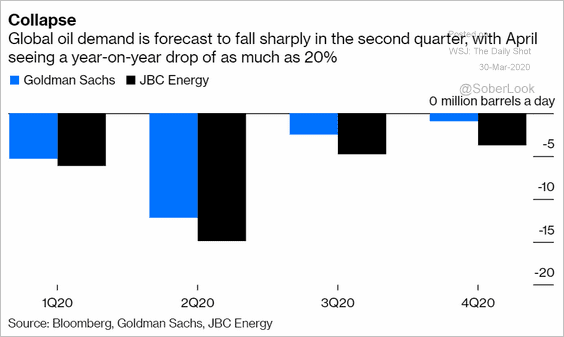
4. Economists continue to downgrade their estimates of global oil demand this year.
 Source: @bopinion Read full article
Equities
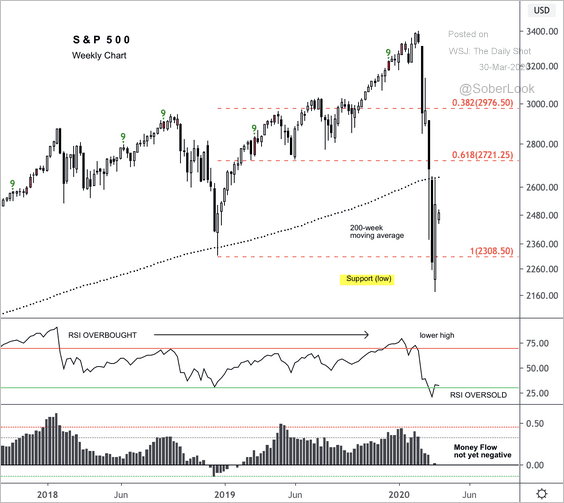
1. Will the S&P 500 re-test the 2018 “Christmas selloff” lows?
 Source: @DantesOutlook
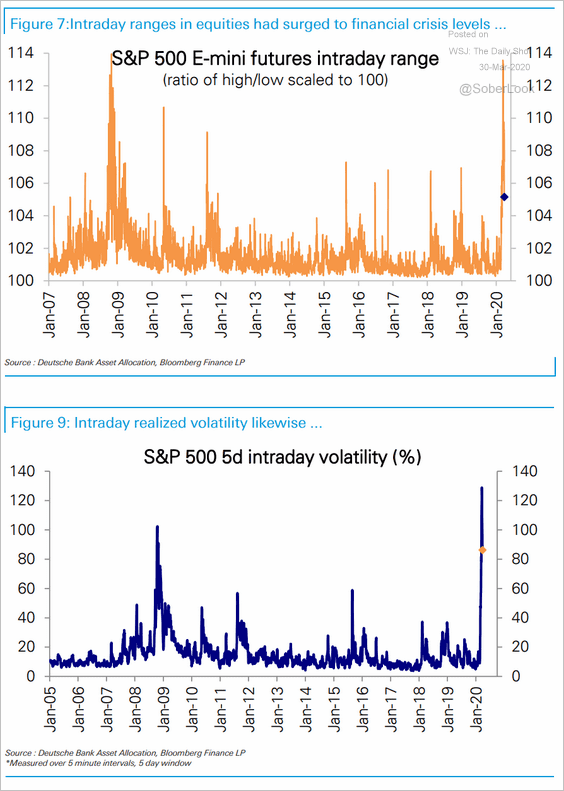
2. Intraday volatility hit a record high but has been moderating in recent days.
 Source: Deutsche Bank Research
3. The spread between implied and realized volatility has blown out.
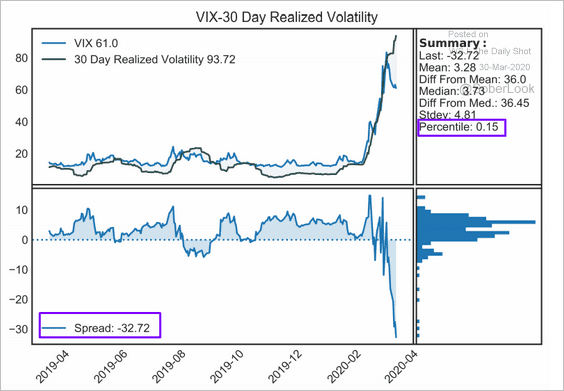 Source: Discretionary Dystopia Read full article
4. According to BCA Research, the stock-to-bond ratio will probably follow the path of the structural bull market and inflect higher.
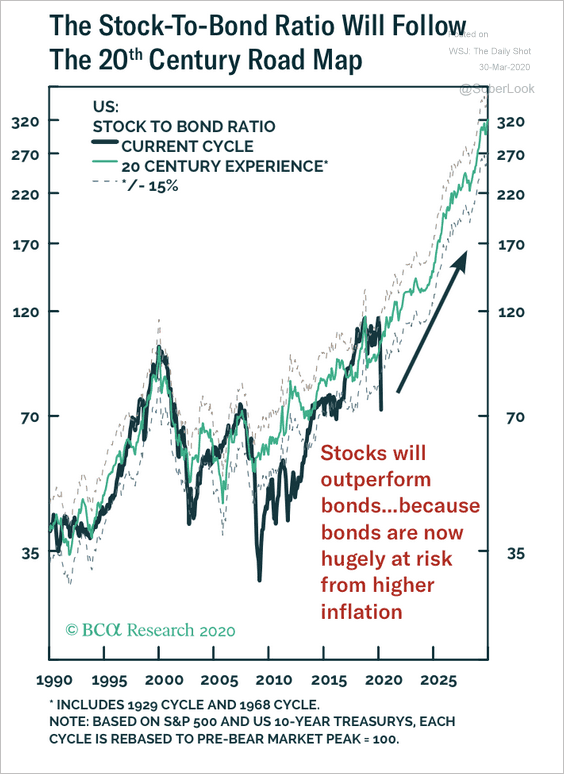 Source: BCA Research
5. The Q2 earnings growth consensus estimate for the S&P 500 hit -10%.
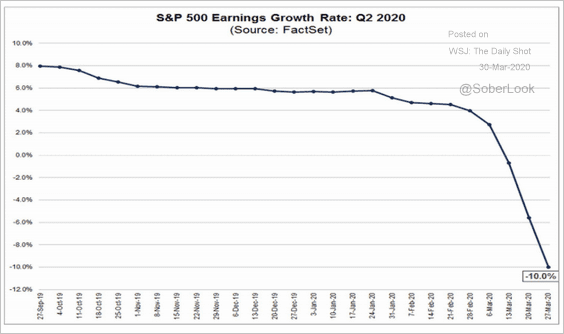 Source: @FactSet Read full article
Credit
1. The Fed’s decision to support the investment-grade (IG) corporate bond market resulted in the largest IG ETF (LQD) trading at a premium to NAV.
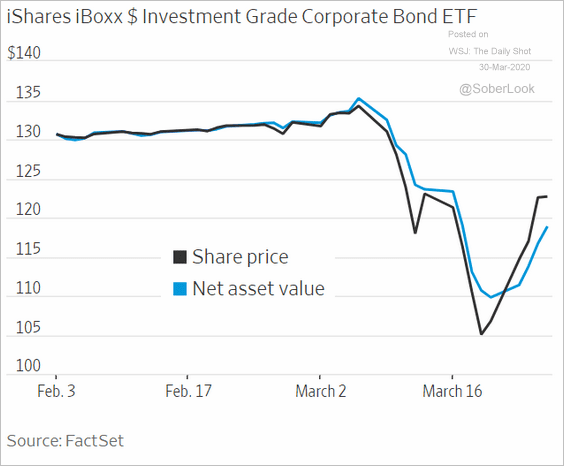 Source: @WSJ Read full article
2. This chart shows some scenarios for corporate spreads from Arbor Data Science.
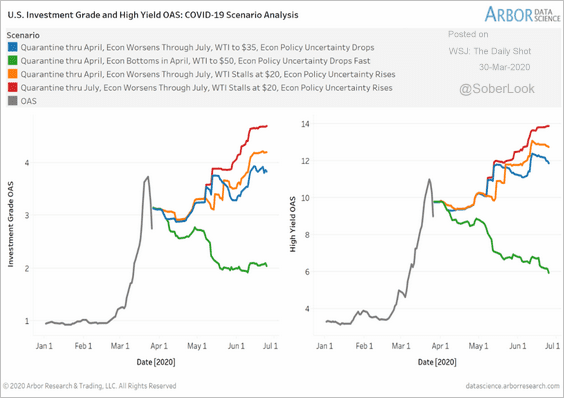 Source: Arbor Research & Trading
3. Asian HY bonds have underperformed.
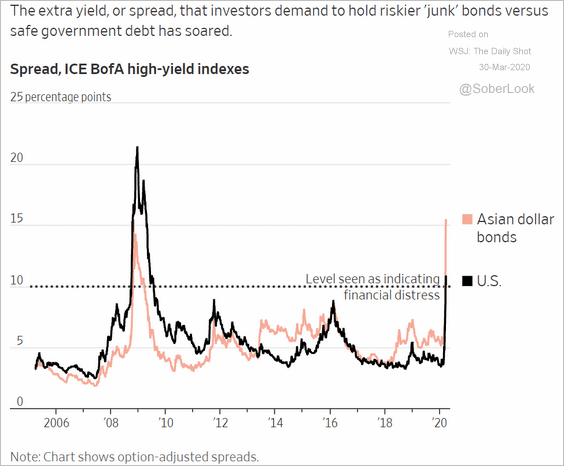 Source: @WSJ Read full article
4. Investment-grade bond issuance picks up as firms seek to boost liquidity.
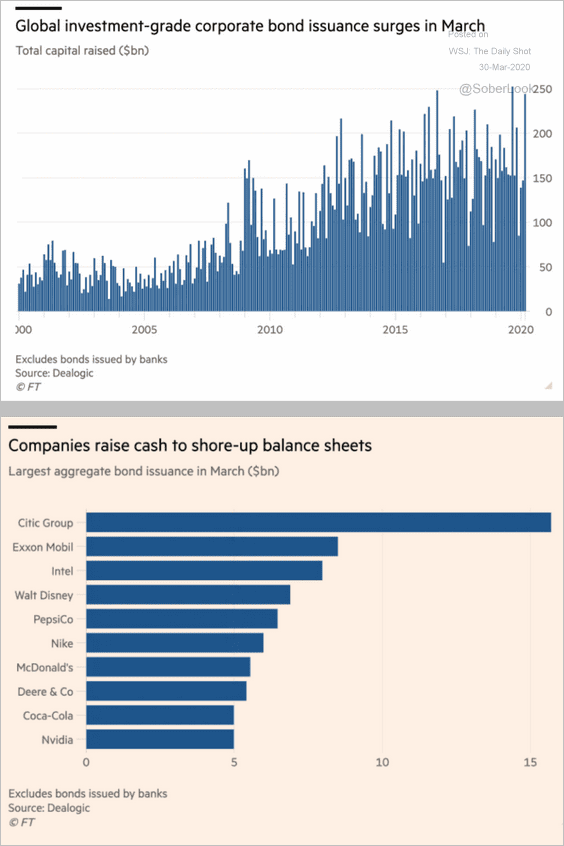 Source: @financialtimes Read full article
5. Airlines are tapping the leveraged loan market.
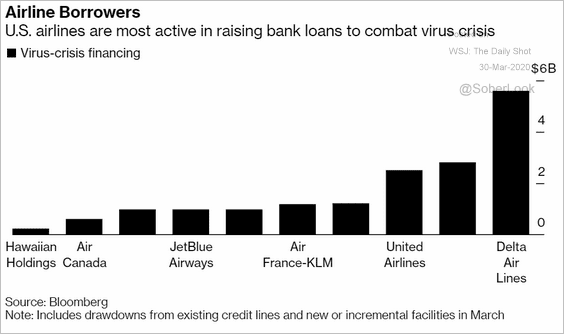 Source: @business Read full article
6. Here is an update on US fixed-income fund flows.
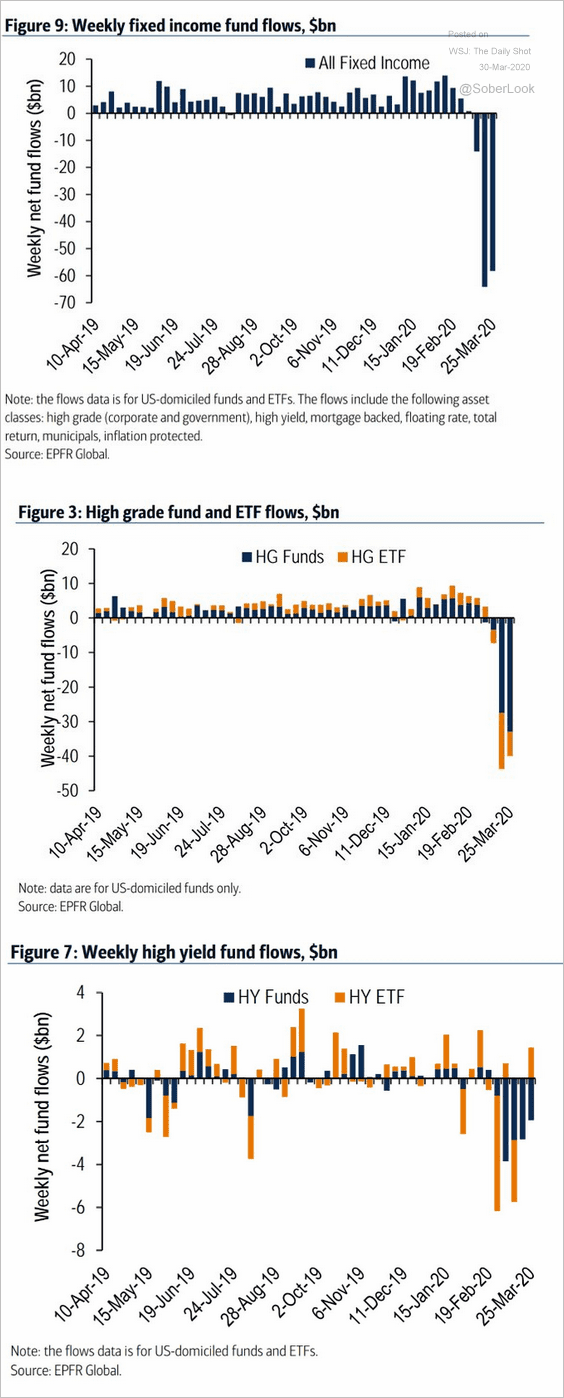 Source: BofA Merrill Lynch Global Research, @Scutty
7. The Fed’s swaps with other central banks have fully reversed the dollar funding pressure. This chart shows the 3-month EUR/USD cross-currency swap basis moving deep into positive territory.
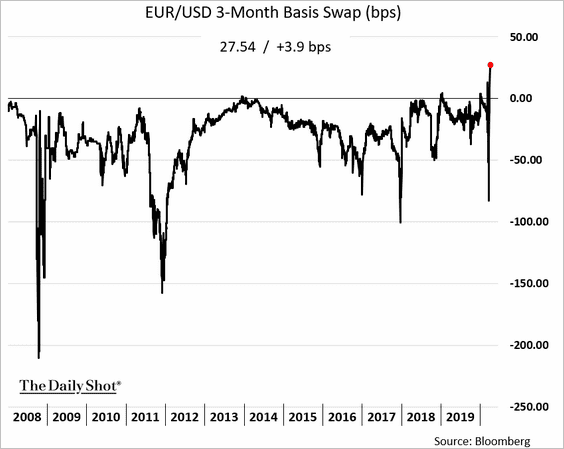
The draw on swaps has been well below what we saw in 2008. Part of the reason is that non-US banks have shrunk their dollar assets over the past decade, reducing the need for financing.
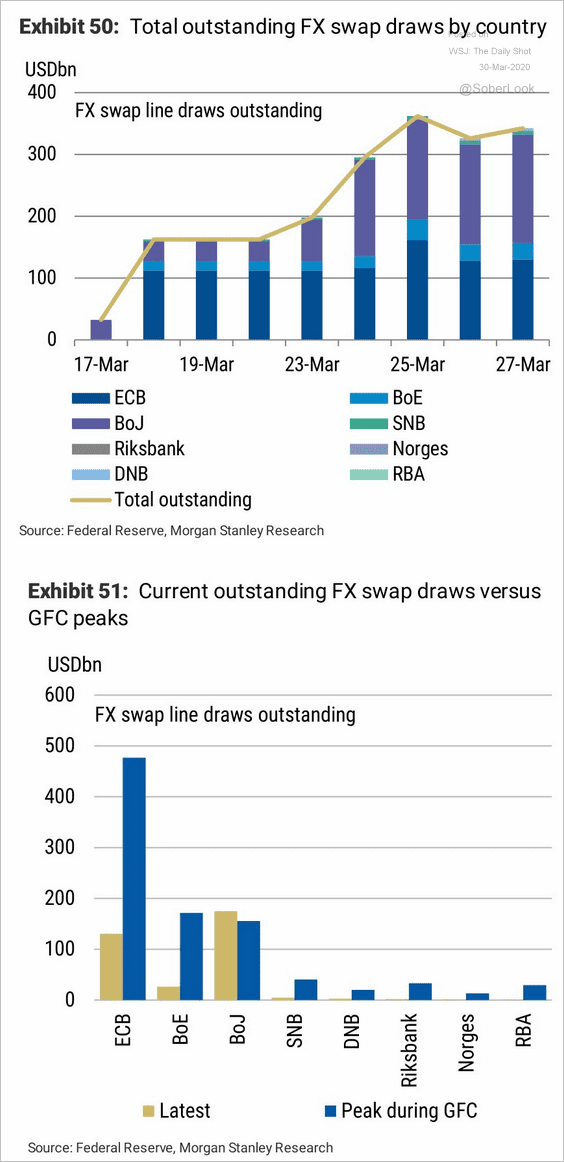 Source: Morgan Stanley Research, @TayTayLLP
——————–
8. Analysts are concerned about US bank capital ratios shrinking substantially over the next twelve months.
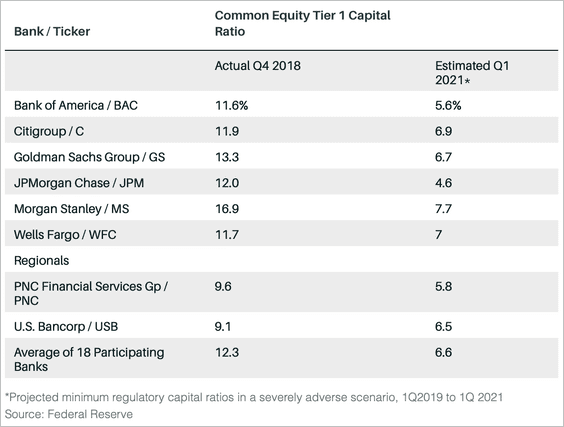 Source: @BarronsOnline Read full article
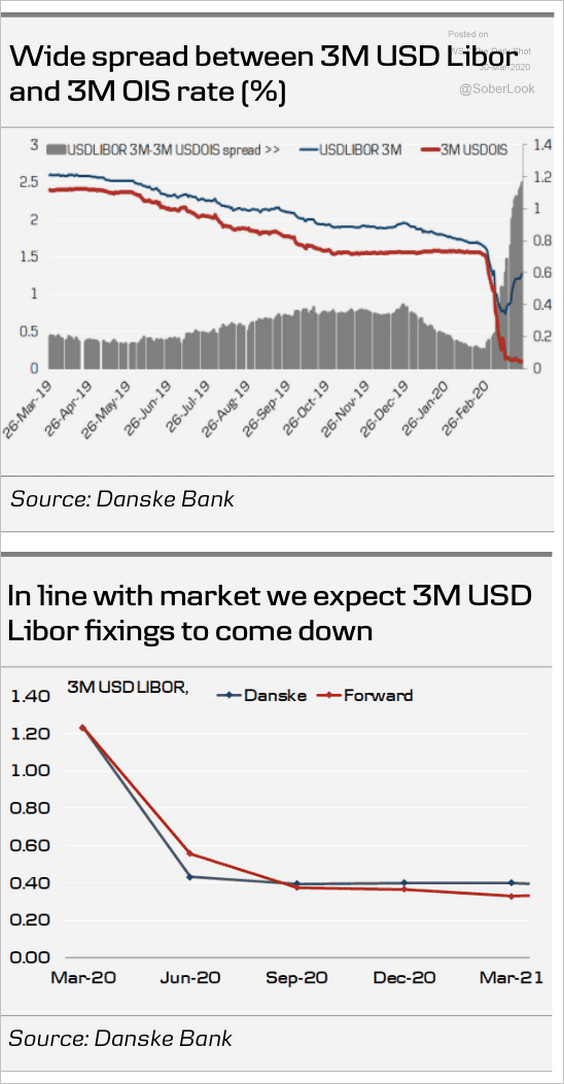
This uncertainty about the banking sector is part of the reason for the elevated LIBOR-OIS spread.
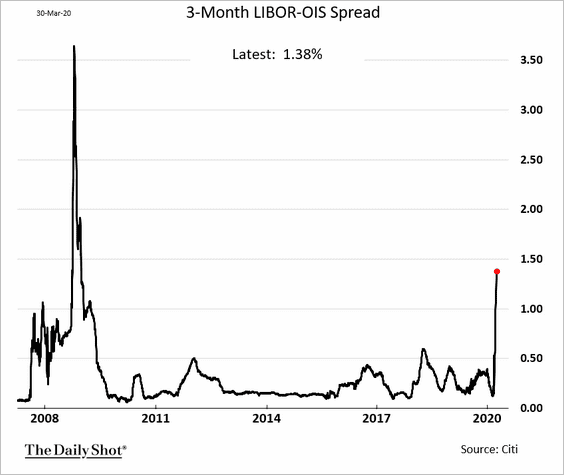
But Danske Bank expects the Fed’s liquidity operations to eventually cause the LIBOR-OIS spread to normalize near 20-30 basis points.
 Source: Danske Bank
——————–
9. Some lenders hedged their mortgage portfolios by shorting mortgage-backed securities (MBS). But then the Fed stepped into the market with the latest QE program, resulting in a massive MBS rally.
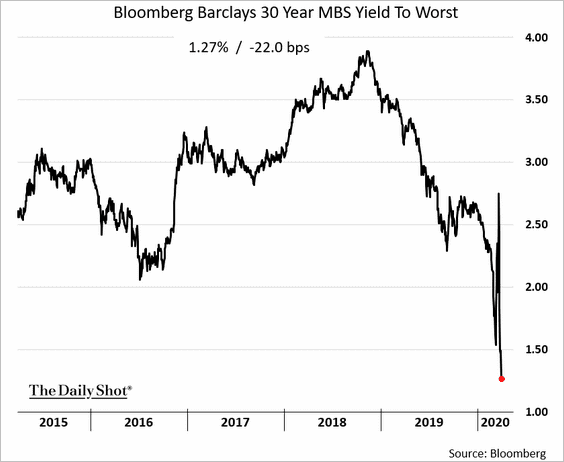
As a result, mortgage bankers got a margin call on their hedges.
 Source: @bpolitics Read full article
——————–
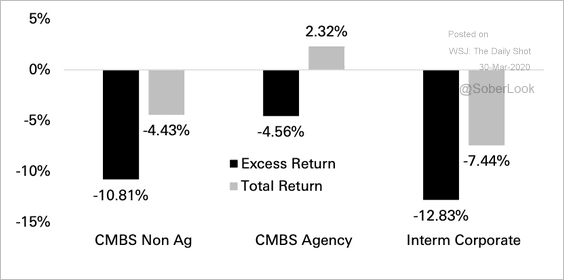
10. Commercial mortgage-backed securities (CMBS) year-to-date total excess returns have outpaced investment-grade corporate credit.
 Source: Deutsche Bank Research
By the way, CMBS spreads have mostly surpassed 2016 levels, but are well below the Lehman crisis levels.
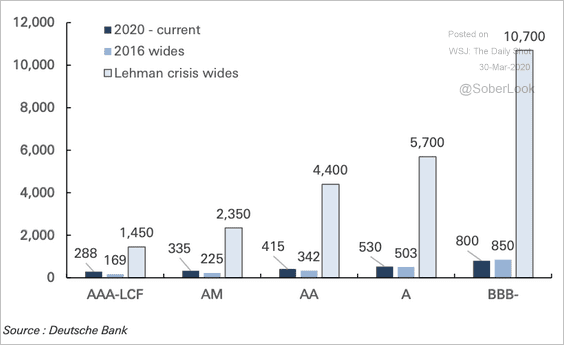 Source: Deutsche Bank Research
Rates
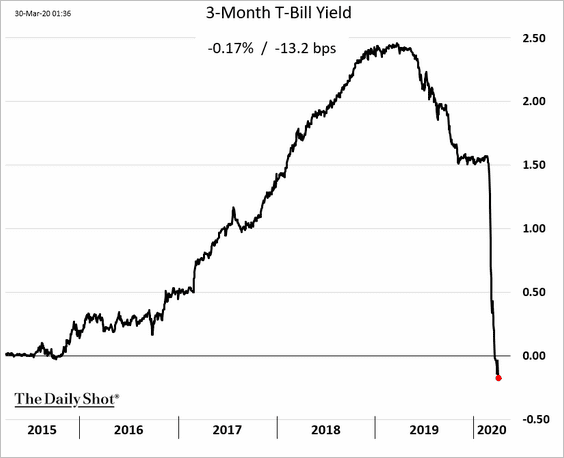
1. The US joins the negative-yield club as Treasury bill yields continue to fall.
2. Previous QE programs have resulted in upward pressure on Treasury yields.
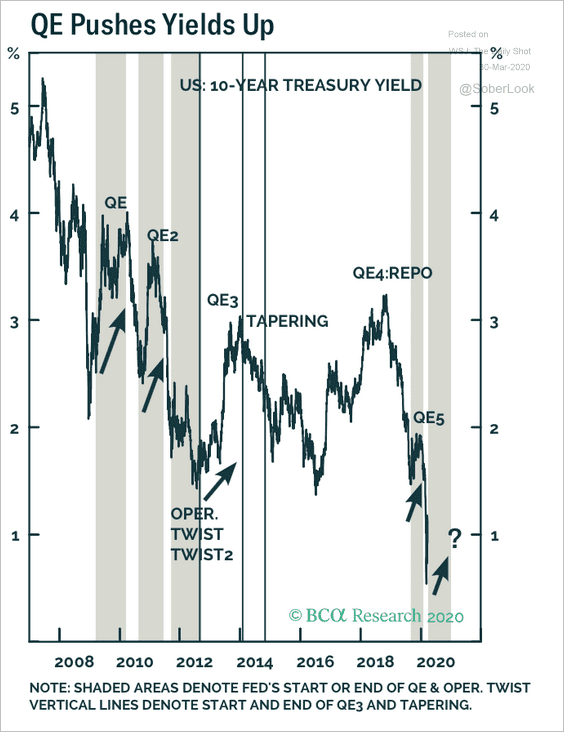 Source: BCA Research
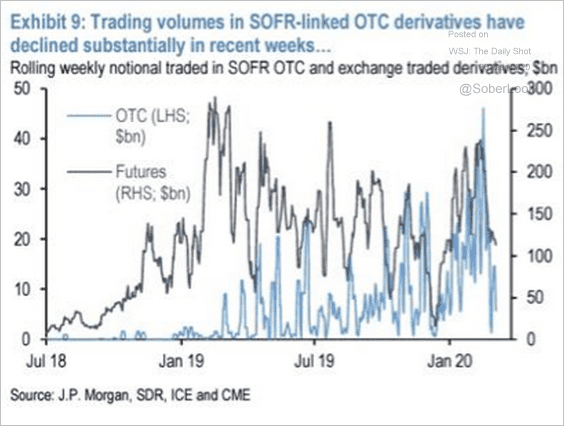
3. Over the past week, activity in SOFR futures has dropped 65% off its peak early this year, and swap volumes have dropped by 87% over the same period, according to JP Morgan.
 Source: JP Morgan
4. Pension funds’ bond allocation is near its previous top in 2008.
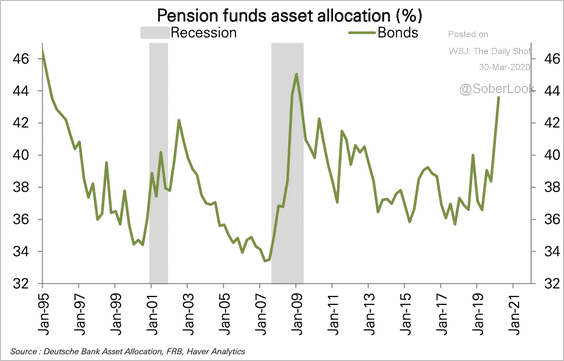 Source: Deutsche Bank Research
Global Developments
1. Central banks continue to cut rates.
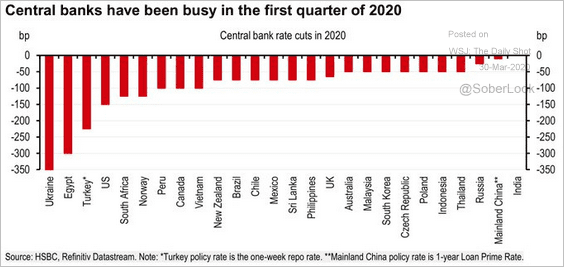 Source: HSBC, @TayTayLLP
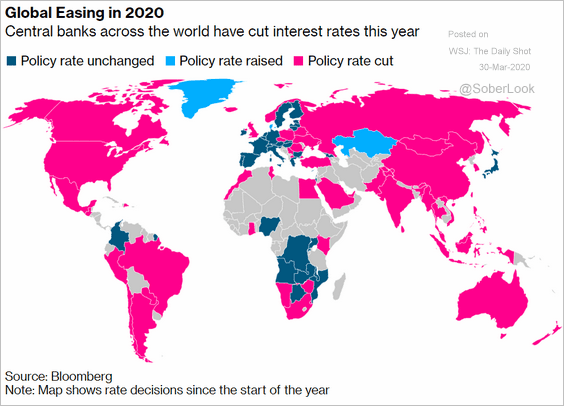 Source: @markets Read full article
——————–
2. Speculative accounts are betting against the US dollar.
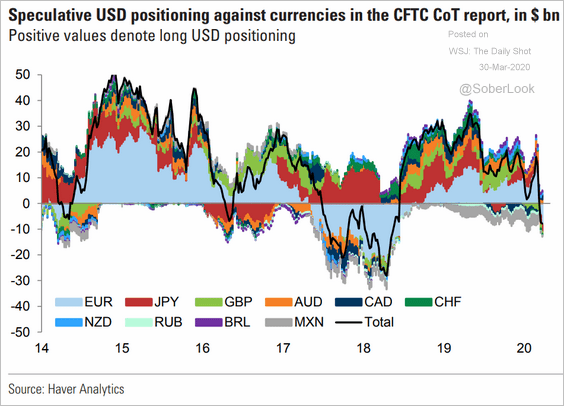 Source: Goldman Sachs
3. And they continue to bet against risk assets.
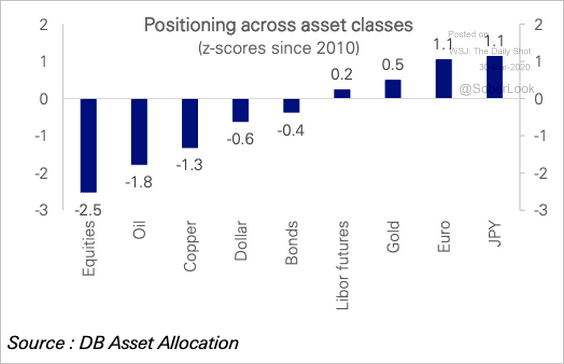 Source: Deutsche Bank Research
4. The world is getting unprecedented amounts of fiscal stimulus.
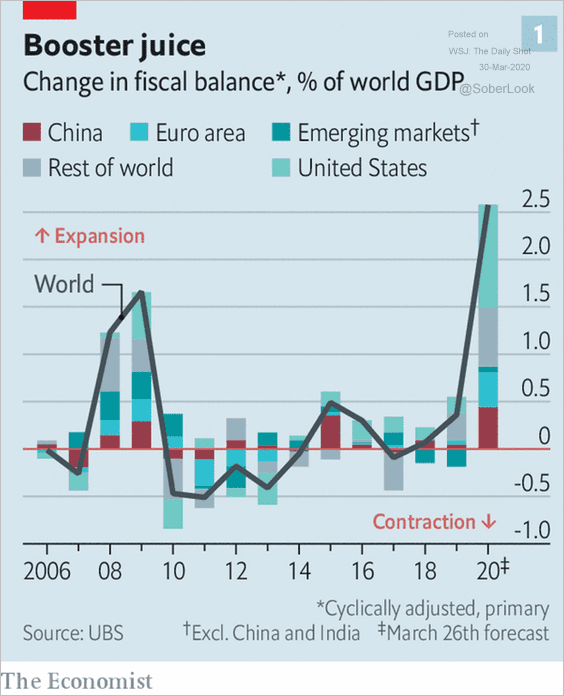 Source: @adam_tooze, @TheEconomist Read full article
5. How concerned are citizens of different countries about their personal situation and the economy?
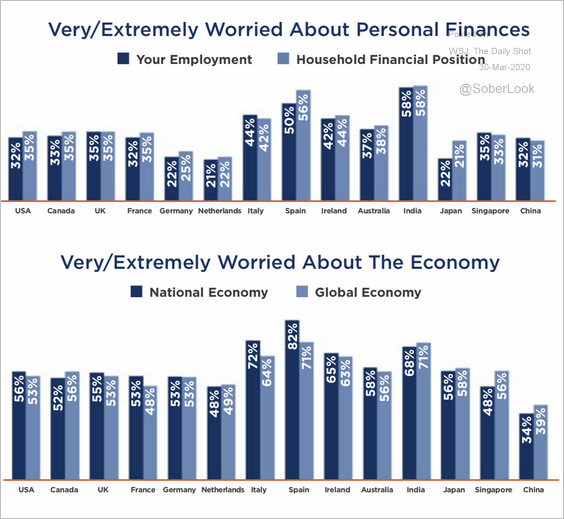 Source: Dynata
——————–
Food for Thought
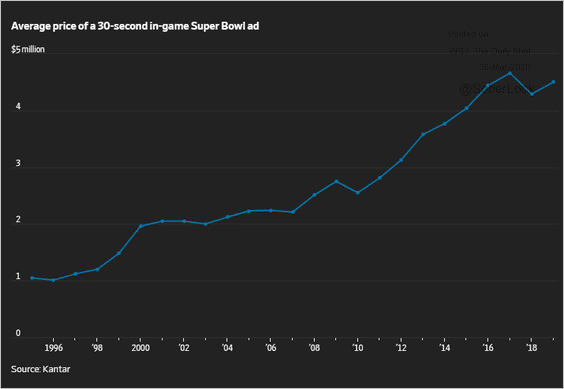
1. Super Bowl ad spending:
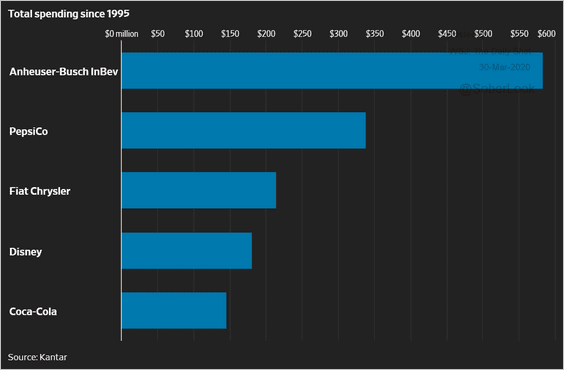 Source: @WSJ Read full article
 Source: @WSJ Read full article
——————–
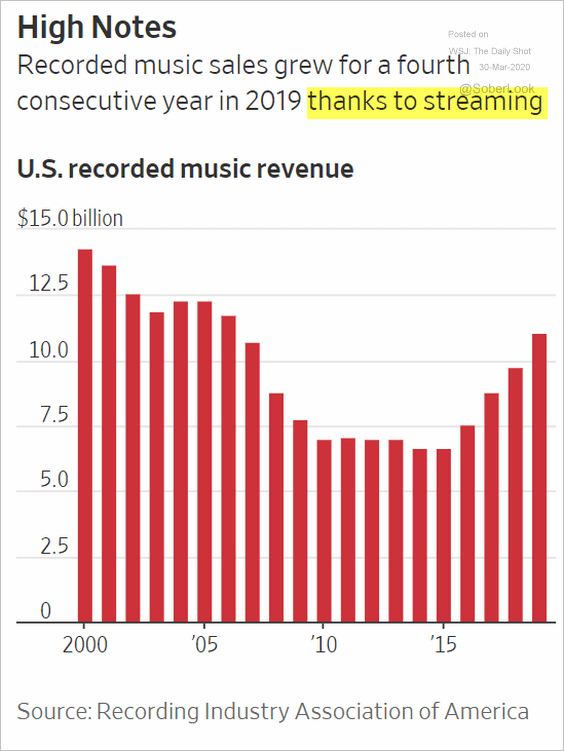
2. Recorded music sales:
 Source: @WSJ Read full article
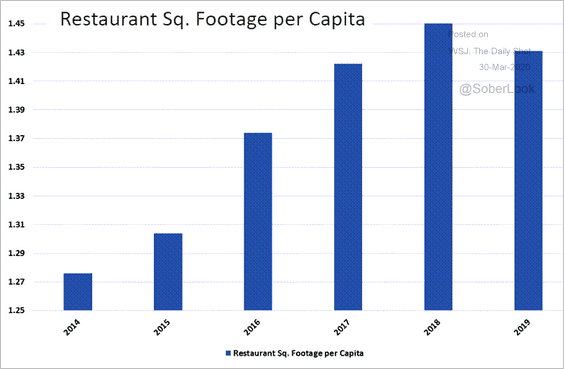
3. US restaurant square footage per capita:
 Source: Cantor Fitzgerald Market Strategy Team
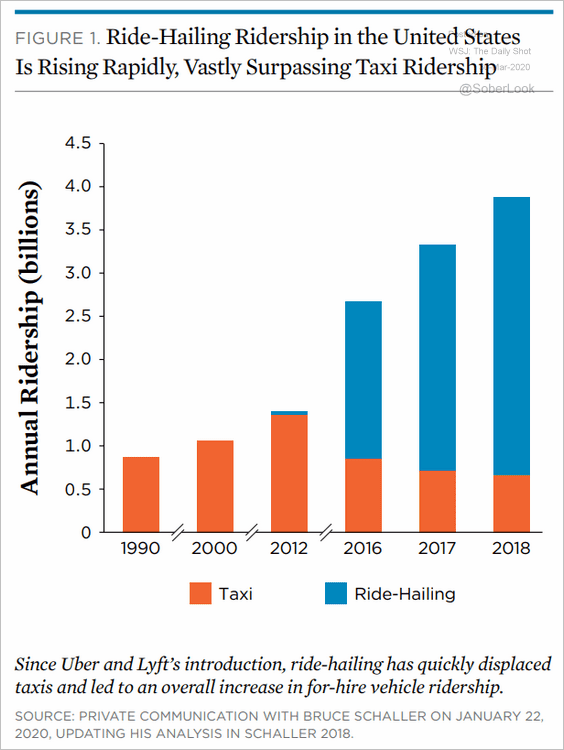
4. Ride-hailing services vs. taxi:
 Source: Union of Concerned Scientists
5. Pedestrian traffic fatalities:
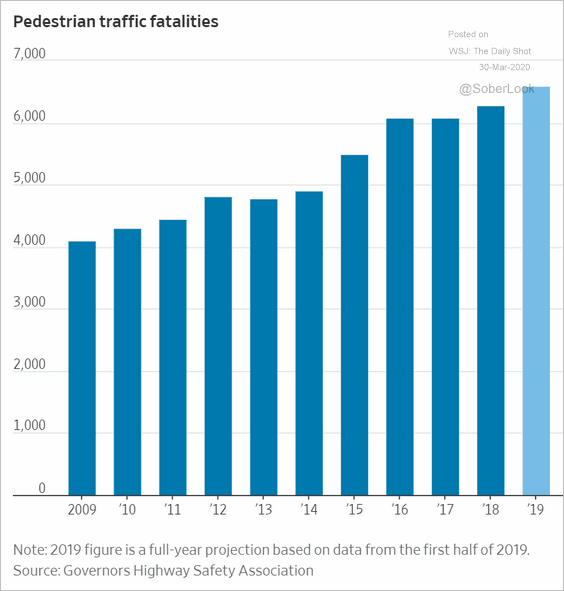 Source: @WSJ Read full article
6. Concerns about the outbreak:
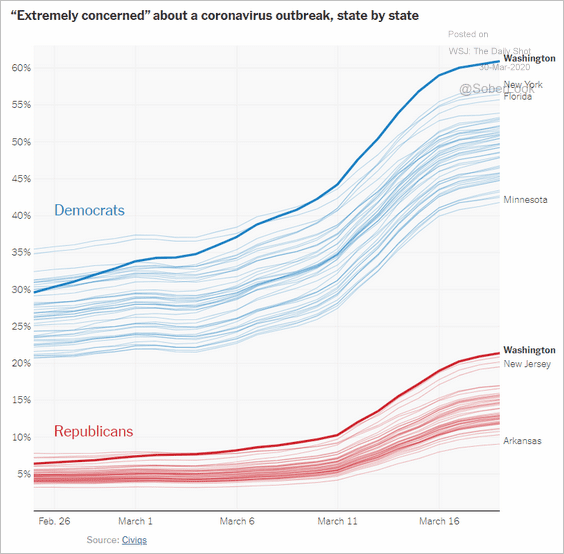 Source: The New York Times, {ht} The Intersection/Echeloninsights.com Read full article
7. Internet usage:
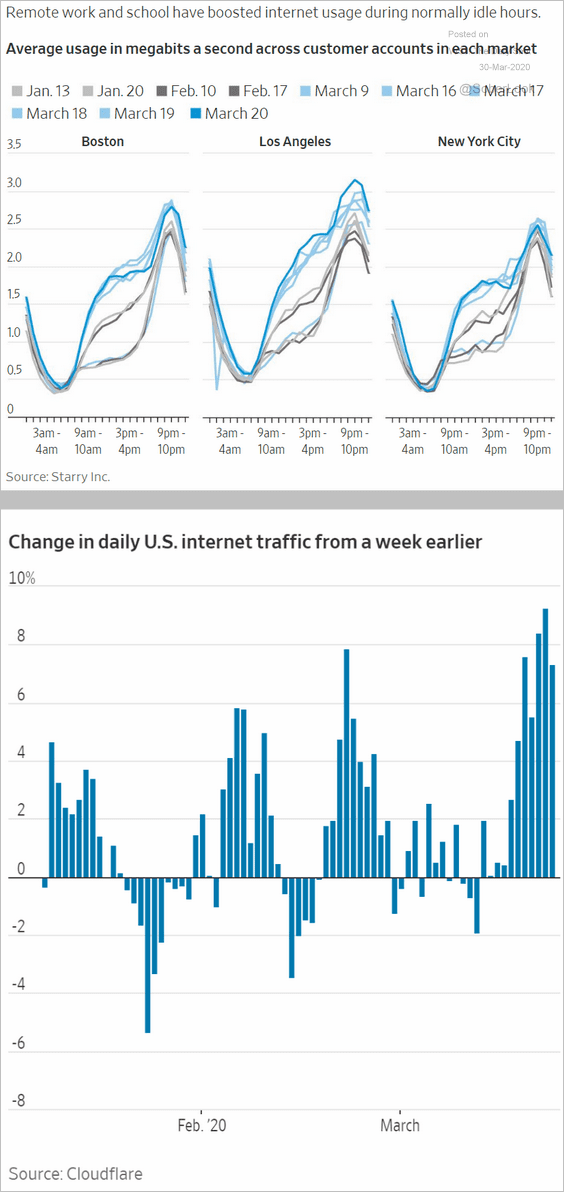 Source: @WSJ Read full article
8. Tracking cell phones from one area on a beach in Florida fanning across the country:
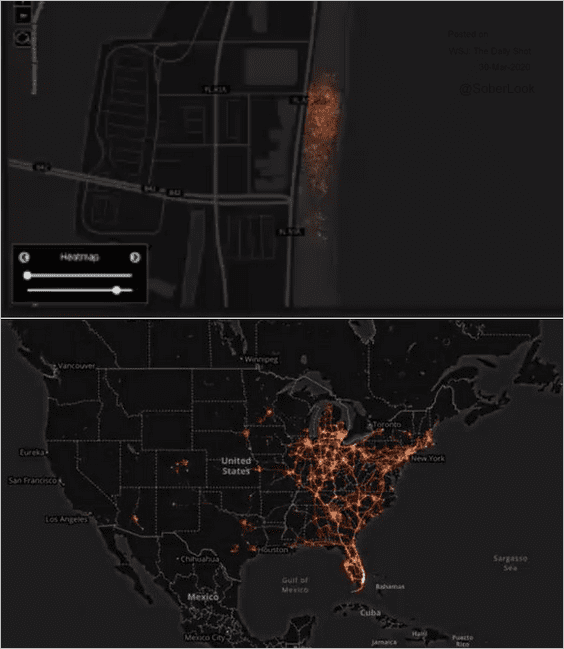 Source: Daily Dot, {ht} The Intersection/Echeloninsights.com Read full article
9. Canceled/postponed Olympic Games:
 Source: Statista
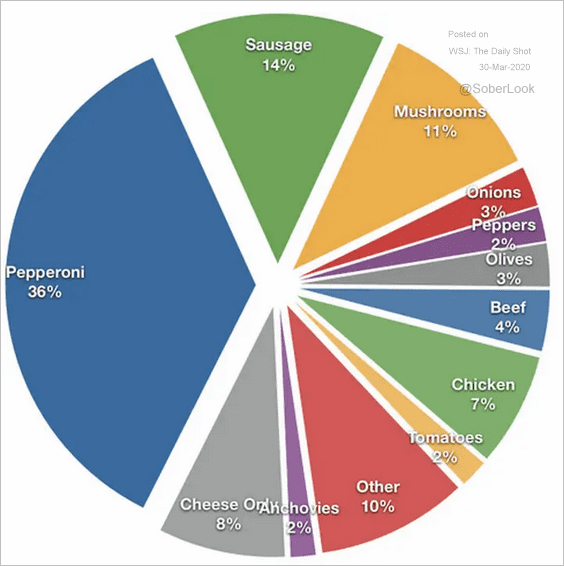
10. The most popular pizza toppings:
 Source: SFGate Read full article
——————–